
Solutions for Exposed Structural Concrete Bridged Elements for a More Sustainable Concrete Construction in Hot Climates


School of Architecture, University College Dublin, D14 E099 Dublin, Ireland
*
Author to whom correspondence should be addressed.
Buildings 2022, 12(2), 176; https://doi.org/10.3390/buildings12020176
Submission received: 20 December 2021
/
Revised: 26 January 2022
/
Accepted: 1 February 2022
/
Published: 4 February 2022
(This article belongs to the Special Issue Sustainable Concrete Construction: Methods and Practices)
Abstract
:New energy-efficiency regulations have been established and applied in many Gulf countries to improve building energy performance. Thermal bridging reduces the building envelop performance, and this is not a focus of these regulations. This paper investigates the concrete construction of residential housing in hot climates and identifies more sustainable concrete construction methods. Both experimental and numerical methods are used to identify the impact of thermal bridging. Using finite element analysis, the impact of solar radiation on a building’s thermal bridging was analyzed. It is identified as an essential element for accurate modelling of bridging across concrete in a hot climate. The FE model was evaluated against monitored data and assessed using common statistical indicators. The results show that the heat loss across uninsulated cast in situ structural elements is more than double the heat loss across portions of insulated walls. Moreover, neglecting solar radiation on the westerly façade can result in errors of >50%. Additionally, the impact of thermal bridging is increasingly evident when accounting for solar radiation. Modelling studies show that the impact of thermal bridging could be reduced by up to 73% by covering the structural elements with external insulation. Compliance with the various codes of the different Gulf states can be achieved through externally insulating with between 40 and 80 mm, and this is shown to have wide-ranging benefits in enhancing building energy efficiency.
1. Introduction
Concrete construction is increasing in many parts of the world that experience extremely high temperatures year-round. Identifying sustainable methods of constructing buildings in these countries to ensure low energy operation is a challenge. Buildings in hot climates, with wealthy populations, rely heavily on air-conditioning for cooling to maintain contemporary comfort conditions. Saudi Arabia is an example of a country with an extremely hot climate and a high air-conditioning-related energy load [1]. It has also set ambitious targets of achieving net-zero by 2060 [2]. Achieving high efficiency in operation is a key strategy for reducing the operational energy of the building stock. This carries further significance given the projections for increased construction in Saudi Arabia and the Gulf states more generally [3].
Residential buildings in Saudi Arabia and the Gulf states are predominantly built using concrete. Individual family housing and multi-unit housing are both commonly constructed of a structural concrete frame and concrete block in-fill. Individual family housing, or villa housing, accounts for 29% of all the housing built in Saudi Arabia and is a common typology across the Gulf states [4]. New energy-saving regulations have been established and applied in many Gulf counties to improve building energy performance. One of the significant factors that reduce the building envelop performance is thermal bridging [5]. However, none of these regulations focused on eliminating the thermal bridging problems. Past investigation of thermal bridging in existing and new buildings has shown that discontinuities of insulation in the building envelope caused by mortar joints and the exposed structural elements are the main causes of thermal bridging in the Gulf area [5].
Elements of the cast in situ reinforced concrete frame are responsible for most thermal bridging in the building envelope. The effects of thermal bridges on the heating load of two types of buildings with reinforced concrete structures, most widely used in Italy, were studied by Evola et al. [6]. The results demonstrated that the energy needs for heating a terraced house and semi-detached house reduced by 25% and 17.5%, respectively, after the correction of thermal bridges. A simulation study was carried out by Jiang et al. [7] to calculate the cooling loss caused by the effect of thermal bridges through a reinforced concrete column in a refrigerator room. The study reported that, by applying the optimum insulation method, there is a reduction in the amount of heat flux moved through the whole column section by about 37% and about a 55% reduction in the total cooling loss.
Analyses of the thermal bridging and bridging mitigation strategies are common for steel-framed structures with high thermal conductivity. Martins et al. [8] investigated mitigation strategies to improve the thermal performance and reduce the energy consumption of a lightweight steel-framed building and concluded that a reduction of up to 8.3% could be approached for the thermal transmittance of the walls by applying mitigation strategies. These strategies include applying thermal break rubber strips inserted between the vertical steel stud, vertical slotted steel profiles, and bolted connections. Moreover, the U-value of the wall can be reduced by about three times by using a vacuum insulation panel (VIP). Kosny and Christian [9] calculated the R-value of an insulated metal frame wall using a finite difference computer program. They found that the wall areas with thermal bridges had an R-value 50% lower than those without thermal bridges. Moreover, the increase of the steel spacing from 40 cm on the center to 60 cm improved the R-value by up to 20%. A proposed evaluation method using infrared thermography suggested by Bianchi et al. is based on in-field experimental measurements of the energy losses through the envelope in a test room [10]. The proposed procedure shows that the effects of thermal bridges increased the heat losses of the building by about 9%.
Concrete has a much lower thermal conductivity than steel; however, concrete structural elements often have a much greater surface area exposed to the external environment. Using whole building energy modelling and finite element analysis (FEA) studies, the impact of thermal bridging caused by the structural elements in Saudi Arabian’s residential villas was investigated by these authors [5]. The results showed that bridging through the cast concrete more than doubled the overall envelope U-value. This study reports experimental monitoring results of heat flux through these building envelopes and advances the finite element modelling studies to include parameters of particular significance in hot climates. Specifically, it highlights the importance of capturing solar radiation effects in the FEMs of concrete constructed buildings in hot climates. Although sunlight is essential for natural lighting in buildings, solar radiation is the primary source of heat gains, particularly in residential buildings when internal heat gains are minimal [11]. The building envelope is strongly affected by intense solar radiation that is absorbed by the envelope elements and conducts heat into the building. Dutta et al. [12] documented that, in a typical Norwegian office building, the envelope elements are responsible for about 70% of the amount of heat gain/loss inside buildings in the intense direct solar exposure, 19% is caused by air leakage, and 11% is due to thermal bridging [13]. The solar radiation in the GCC area is among the highest levels globally, where the average hourly rate of solar radiation in the GCC countries reaches about 250 W/m2 [14], with an average of more than 8 h of sunshine [14]. This high intensity of solar radiation could be used in a suitable application for thermal storage in cold countries. For instance, Aelenei et al. invented the Solar Bridge Retrofit System (SBRS) to allow the solar radiation to warm up the heavy structure of the building and transfer the heat inside the building [15]. However, the Gulf area is recognized as a hot region where high solar radiation is not preferred.
Many studies in the literature have shown thermal bridging related to windows [16,17,18], the contact junction between floor and walls [19,20,21], the contact junction between the slab and walls [20,21,22,23,24], and the contact junction between the ceiling and walls [20,21,25]. Studies have also shown thermal bridging related to building corners [20,21,26,27] and metal fasteners [28,29] and metal frames [30,31,32]. However, this study is purely focused on the opaque concrete elements of the façade. These represent a considerable area of the wall and, hence, are themselves interesting, particularly when analyzing methods of concrete construction.
The inclusion of solar radiation in FEMs has been investigated by several researchers. For example, the solar heat gains of a flat concrete roof deck with and without a radiation control layer were examined by Yarbrough and Anderson [33]. They showed that using radiation control coatings helped reduce the impact of solar gain on the exterior of a building, therefore helping to reduce the external surface temperatures and the heat transferred into the building. Moreover, Grynning et al. [13] investigated the impact of solar radiation and thermal transmission heat losses for a range of windows in terms of a net energy balance for the various solutions. Other researchers applied longwave and shortwave radiation in their FEM’s boundary condition to calculate the building’s construction thermal behavior [1,25,34,35,36]. The novelty of this paper is that it investigates the impact of solar radiation on thermal bridging through the building envelope specifically. It reports guidance on how to avoid this unsustainable construction detail and offers solutions for more sustainable concrete construction in hot climates. When studying thermal bridging, the paper presents modelling investigations that highlight the importance of accounting for shortwave radiation (from solar gains) and longwave radiation (from heat loss to the sky). These construction suggestions are for Gulf countries in general and specifically for Saudi Arabia.
The paper is organized into three sections to investigate these aims. The in situ experimental monitoring method is explained in the first section. The finite element model (FEM) description and boundary conditions are given next, followed by detailed model validation indicators. Experimental results showing evidence of bridging and models of these effects, including different parameter sets, are analyzed. Finally, alternative construction design options for hot climate countries in general and Saudi Arabia and the Gulf states in particular are considered.
Research Objectives
The primary objectives of this research are:
- To assess the concrete construction of residential housing typical in many Gulf countries,
- To evaluate the impact of solar radiation on thermal bridging through concrete structure,
- To provide more sustainable concrete construction fabric configurations that comply with the new modification of the Saudi code 2018.
To address objective (i), this research investigates concrete envelope construction to identify the location and extent of thermal bridging using two methods:
- a)
- Monitoring the heat flux entering the building for a period of two weeks,
- b)
- Simulating and analyzing its impact using FEM.
Moreover, to address objective (ii), two case studies (bridged and un-bridged building) have been investigated concerning the impact of solar radiation. The investigated buildings were evaluated and compared using the buildings’ energy consumption.
Additionally, to address objective (iii), these three subjects were analyzed using FEM:
- 1)
- To identify a more sustainable concrete construction, seven new wall section alternatives were investigated and compared to the current situation by establishing effective U-values for the different cases.
- 2)
- The minimum external insulation required for the Gulf countries was investigated.
- 3)
- The most suitable insulation thickness to suit the climate in Saudi Arabia and the other Gulf countries was identified.
The paper is organized into three main sections to investigate these aims. The in situ experimental monitoring method is explained in the first section. The finite element model (FEM) description and boundary conditions are outlined next, followed by detailed model validation indicators. The experimental results showing evidence of the bridging and FE models of these effects are analyzed. Finally, alternative construction design options for hot climate countries in general and Saudi Arabia and the Gulf states in particular are presented.
2. Methodology
Residential buildings in the Gulf states are typically built using concrete frame construction, with block in-fill as shown in Figure 1. The exposed structural elements cover between 30 to 40 % of the entire surface area of the façade [5]. In this research, an average concrete structural frame area of 35% of the wall area is used, while the in-fill blockwork wall represents 65% of the area. The blocks for in-fill are of a range of materials, such as concrete block, clay block, volcanic block and autoclaved aerated concrete (AAC) block, as well as insulated concrete block (ICB) of multiple layers with insulation in between [5]. The concrete frame construction usually penetrates the building, creating the thermal bridging path that this paper investigates.
2.1. Experimental Method
The experimental study in this research investigates the thermal bridging impact in Saudi residential buildings using heat flux monitoring. The investigation was conducted for three buildings representing the worst, moderate, and best wall construction types used in Saudi Arabia, as shown in Figure 2. The buildings were monitored for two weeks, each in a free-running environment chosen so as to determine the impact of thermal bridging without any external effects and determine the effect of solar radiation on the thermal bridging impact. The measurements were taken in the summer of 2021 (July and August). The heat flux and surface temperature of the concrete frame and the block in-fill between the concrete elements were monitored, as well as internal and external temperature using a heat flow meter (HFM) and temperature sensors.
2.1.1. Buildings Description
The case study buildings investigated in this research are constructed in a typical construction method used in Saudi Arabia’s residential buildings and the other Gulf countries. The buildings were chosen to present the worst-case thermal resistance (one layer of an uninsulated concrete block (2.37 W/m2·K)), the best case (double layers volcanic block with insulation in between (0.39 W/m2·K)), and a moderate case (one layer insulated concrete block (0.53 W/m2·K)), as shown in Figure 2. All these buildings are in Riyadh, Saudi Arabia, and all of them are facing westerly and, hence, exposed to the intense late afternoon/evening sun.
2.1.2. Measurement Setup
The equipment used to conduct the testing is a PHFS-09e heat flux and surface temperature sensor produced by FluxTeq (Blacksburg, VA, USA). The average sensitivity of the sensor is given as approx. 70–90 (µV/W/cm2). It can detect a heat flux range of ±150 kW/m2 and a T-type thermocouple temperature sensor range between −50 and +120 °C. The uncertainty of the heat flux sensors is ±0.29 (µV/W/cm2). Data were registered using a FluxDAQ+ data logging system developed by Fluxteq. The sensor outputs were calibrated using Equation (1) provided by the manufacturer.
where: S@T°C is the sensitivity at the sensor temperature, T°C is the sensor’s temperature, and SCalib is the calibrated sensor sensitivity.
S@T°C = (0.00334× T°C + 0.917) × SCalib
The building internal and external temperature measurements were recorded using a custom-made Raspberry Pi (Cambridge, UK) for data logging with one wire calibrated air temperature sensors (DS18B20, Dallas, TX, USA). The DS18B20 detects temperature raged between −50 and 125 °C with an accuracy of ±0.5 °C. All the equipment used are shown in Figure 3 below. In addition, these sensors were calibrated against the FluxTeq T-type thermocouple temperature sensor to match the same temperature results.
2.1.3. Thermal Camera
FLIR One was used to take thermal images of the three buildings to support the experimental data. FLIR One has a longwave infrared sensor ranging from 8 to 14 µm, a thermal resolution of 80 × 60 pixels, and thermal sensitivity of more than 0.1 °C [37]. Previous studies have validated and checked the accuracy of FLIR One [38,39].
2.2. Finite Element Modelling
A further thermal bridging investigation was conducted using finite element modelling, and Building-3 was chosen as the case study in these investigations. The experimental results are used to validate the accuracy of the FEM and in the internal and external boundary conditions. The FEM of Building-3 has an exposed column (S1), double-layered wall (S2), and a covered column (S3), as shown in Figure 4.
The general heat equation governing heat transfer in the solid is described by Equation (2). The heat transfer equations are solved using Heat Transfer in Solid Solver in COMSOL multiphysics 5.5. The materials used in the finite element model and their related properties are presented in Table 1.
where: ρc, Cc, and kc are the density, heat capacity, and thermal conductivity of the construction materials, T is the absolute temperature, t is the independent variable for time, and x, y, and z are the independent variables for representing dimensions.
2.3. Boundary Conditions
The west facade is affected strongly by the evening solar radiation; for this reason, it is essential to investigate the impact of both longwave and shortwave radiation. The finite element model, in this case, is investigated using three scenarios as presented in Figure 5 for the wall section of Building-3 that is shown in Figure 4. First, study the model using convection heat transfer boundary conditions (the external and internal temperature recorded from the experimental study and heat transfer coefficients). Then, the same model is investigated with the addition of shortwave radiation. The third model includes the addition of longwave radiation to the sky.
2.3.1. Shortwave Radiation
The building elements absorb the solar radiation in accordance with Equation (3).
where: Qr,sh is the shortwave radiation, α is the solar absorptance, A is the surface area exposed to the sun, and Gv is the measured irradiance for a vertical surface (W/m2).
The sun radiation data were extracted from the Saudi Renewable Resource Atlas [48]. However, these data were collected for a horizontal surface; hence, the data were corrected for a vertical surface using Equations (4)–(9).
where: GH is the measured irradiance on a horizontal surface (W/m2), Rb is the beam radiation tilt factor, n is the number of the day (1 is the 1st of Jan), Ф the latitude the angular; −90 ≤ φ ≤ 90°, β: the tilt angle, δ: the declination value, ω: the hour angle introduced in 0–24 h format, γ surface azimuth angle, θ angle of incidence, and θz zenith angle.
2.3.2. Longwave Radiation
Longwave thermal radiation also affects the building’s external surface, as per Equation (10). The effective sky temperature is estimated using Equation (11) and Table 2.
where: Qr,l is the longwave radiation, ε is the thermal emissivity, σ is the Stefan Boltzmann constant, Tsky is the sky temperature, T is the surface temperature, and fcloud is the sky cloud fraction ranging from 0 to 1, assumed to be 0 for a clear sky.
where: Tdp is the dew point temperature.
The best estimation result from Equation (11) and Table 2 for the sky temperature that could suit the Gulf weather is used in the FE model.
2.4. Validation of Finite Element Model
The usefulness of the simulated model depends on the accuracy of the model outputs. Therefore, researchers and standards suggested that FE models be evaluated against experimental data using multiple statistical estimation methods [12,42]. The statistical indicators adopted in this research are listed below.
R-square coefficient (R2) calculates the relation between the simulated data to the experimental data regression line. Results of the R² are calculated using Equation (13), and the result is between 0.00 to 1.00; the perfect correlation is equal to 1. According to ASHRAE Handbook, the acceptable value of R² is equal to or higher than 0.75 [42].
Root mean square error (RMSE) offers a value for the amount of dispersion produced by the model. Mathematically, it can be calculated using Equation (14), and the acceptable % RMSE indicated in ASHRAE is lower than 30% [42].
Mean absolute percentage error (MAPE) is the absolute sum difference between the actual measured data to the simulated data divided by the actual measured data. The acceptable value of MAPE depends on the type of industry; however, Moreno et al. indicated that <10% recognized as highly accurate, 10–20% recognized as good, 20–50% recognized as reasonable, and >50% is inaccurate results [55].
2.5. Evaluating the Impact of Solar Radiation on Energy Performance
The energy performance is assessed for the model with and without solar radiation for two weeks. Then, the energy transmittance is calculated using Equation (16) over the period studied.
where: E is energy transmittance for the dedicated time (t), n is the period studied in hours (h), and qt is the average heat flux resulting from FEM or calculated using Equation (16).
The relationship between solar radiation and thermal bridging is investigated using the results of the energy transmittance analysis. The energy performance of the evaluated models (bridged and un-bridged building) resulting from Equation (16) is then compared concerning the impact of solar radiation using the percentage difference calculated using Equation (17).
where: R1 is the energy performance of the model without solar radiation and R2 is the energy performance of the model with solar radiation.
2.6. Construction Solutions and Suggestions for Gulf Countries
The model walled section shown in Figure 4 is investigated in more detail, as well as examining some alternative modifications that are applied to improve the thermal resistance of the wall system (illustrated in Figure 6). Walls W1-(a) and W1-(b) represent the current situation that has been monitored, and walls W2 to W7 represent modified wall alternatives that were investigated to improve the wall’s thermal resistance. The typical proportion of structural elements (column) in these wall assemblies covers 35% of the wall section, while the blocks cover 65% of the wall area. The ratios of 35% of structural elements and 65% of block in-fill have been calculated in previous research [5] and used here.
The transient thermal transmittance (Ut-value) is used to capture the effect of thermal bridging, which is calculated using Equation (18).
where: qw is the average heat flux over the period studied, ∆T (To-Ti) is the temperature difference between external and internal.
3. Results
The results of this paper are divided into four sections. The experimental results are presented in the first section, Section 3.1. The second section (Section 3.2) shows the model investigation and validation results. The evaluation of the impact of solar radiation on the building results is outlined in Section 3.3. Finally, Section 3.4 provides construction modification and improvements suggestions and the results of the analysis of these.
3.1. Experimental Results
The experimental study was carried out for two weeks on each building, and the results are shown in Table 3 and Figure 7, Figure 8 and Figure 9. For the course of the monitoring period, the total heat flow entering the buildings is presented in Figure 7, Figure 8 and Figure 9 (left) for building 1, 2, and 3, respectively. As well, a selected day that represents the monitored data in more detail is presented in Figure 7, Figure 8 and Figure 9 (right). It is evident from the time series graphs that the heat flow entering the building through the structural elements is higher than that entering through the walls. For example, the difference between heat flux entering through the column and the wall in Building-1 is just 23%, which is attributed to the fact that this building is uninsulated. On the other hand, in the other buildings (Building-2 and Building-3), the heat flux crossing the column is more than double that crossing through the insulated walls, as shown in Table 3. Moreover, using an insulation layer (as in Building 2 and 3) helps minimize the amount of heat flux entering the building through the walls compared to uninsulated walls as in Building-1. Finally, covering the column by 15 cm volcanic block (as shown in S3 in Figure 4) assists in decreasing the amount of heat passing the building by 28% compared to the exposed column (S1 in Figure 4).
Figure 7 demonstrates the amount of heat flux entering the building through the column and the wall for a two-week period of monitoring and for the highlighted representative day. The heat flux into the building through the column is higher at nighttime than during the day. This might be explained by the difference in thermal capacity of the two elements—1884 (kJ/m2·K) for the column and 928 (kJ/m2·K) for the wall, enabling greater heat accumulation during the day in the column and the delayed release of this by night. Hence, the two elements behave similarly during daytime (when the external temperature is high) and differently at nighttime (when the external temperature drops), as shown in Figure 7 (right), where the heat flux through the wall is considerably lower than the heat flux through the column. This is because heat flows into the building where it is contained, and this increases the internal temperature during the night, forcing it to exceed the external temperatures until sunrise. During the night, when the external temperature is lower than the internal temperature, the direction of heat flow is from indoors to out.
It is also observed in Figure 7 that, at approximately 1:00 p.m., the direction in heat transfer changes due to the direct solar radiation on the west façade. The heat flow entering the building increases considerably as a consequence of the solar radiation incident on the west façade as the sun altitude angle drops in the late afternoon.
In Building-2, the average heat flux is 1.87 and 5.67 (W/m2) through the wall and column, respectively. The difference in heat flux is due to the thermal transmittance of the column (2.9 (W/m2·K) being more than five times that of the wall 0.53 (W/m2·K). The high U-value difference is a consequence of the insulation in the wall; hence, the wall provides higher resistance to the heat flow than the structural elements. As shown in Figure 8 (right), the column heat flux is seen to reach a maximum of almost 18 (W/m2), while the wall maximum heat flux is almost 3 (W/m2). The benefit of using thermal insulation in the wall is also seen where the internal temperature is maintained almost stable and lower than the external temperature throughout the day. However, the solar radiation hitting the westerly façade (between 2 and 3 p.m.) increases the internal temperatures.
The heat flux entering Building-3 through the exposed column, wall, and covered column is illustrated in Figure 9. The amount of heat flux entering the building through the wall is less than a third of that entering through the column. This low amount is due to the wall’s thermal properties, where the U-value of the wall is equal to 0.39 (W/m2·K) compared to 2.32 (W/m2·K) for the exposed column and 1.27 (W/m2·K) for the covered column. In addition, Building-3 is affected strongly by the direct solar radiation entering the building through the window. This solar radiation increases the internal temperature dramatically.
It could be noticed from Figure 8 and Figure 9 that the daily mean heat flow entering the building through the wall (2.3 W/m2) and column (8.1 W/m2) in Building-3 is higher than that in Building-2 (1.85 W/m2 for wall and 5.6 W/m2 for column), and this can be attributed to two factors. First, the orientation of the buildings is slightly different, where Building-3 has a more direct angle toward the west direction than Building-2. Moreover, the solar radiation hits Building-3 all day, while Buiding-2 is shaded by the neighboring buildings in the late daytime starting from 2:30 p.m. and continuing till the sunset, as shown in Figure 10. However, the maximum heat flux entering the building through the column in Building-2 is higher than Building-3 as it is a thinner column (2.9 W/m2·K in Building-2 and 2.32 W/m2·K in Building-3).
Figure 11 shows the impact of thermal bridging using a thermal imaging camera. Thermal bridging causes the surface temperature of the wall and structural elements to differ, as demonstrated in the thermal photos. For instance, the temperature difference between the wall and the column in Building-1 is 1.2 °C. However, this temperature difference is not high, which is attributed to the fact that the walls in Building-1 are not insulated. Moreover, as the wall becomes thicker due to increased insulation, the temperature difference between the wall and the structural element becomes bigger. This is demonstrated by a temperature difference of 2.1 °C and 2.4 °C for in Building-2 and Building-3, respectively.
3.2. Boundary Condition Evaluation
Three boundary conditions were applied to the model in series, starting with a convective boundary condition, followed by the inclusion of shortwave and longwave solar radiation. Beyond each stage, the accuracy of the FE model has been validated and compared to the experimental results.
The model was developed as outlined based on a fundamental scientific understanding of the heat transfer through the wall. Phenomena were successively added to augment the model’s ability to capture the observed conditions. Convective boundary conditions and shortwave and longwave radiation were added, and, at each stage, the model was compared to experimental data.
3.2.1. Convective Boundary Condition
The model simulation starts by adding a convection heat transfer boundary condition that includes external and internal temperature and heat transfer coefficients, as shown in Figure 5. The results of scenario one are illustrated in Figure 12, and the validation indicator results are listed in Table 4. At first glance, it is clear that, as the thermal transmittance of an element increases, the heat flow increases, as in Figure 12, right and left. However, when the element has low thermal transmittance as in the wall (Figure 12 middle), the simulated model results are not reaching the maximum and minimum levels as in the monitored results due to the materials’ resistance to heat flow.
At this point, the FE model is assumed accurate for S1 and S2, where R² is over 0.75, RMSE is under 30%, and the MAPE values are recognized as reasonable. However, S3 has an RMSE over 30, which requires further development.
3.2.2. Shortwave Radiation
As outlined in the introduction, solar radiation has a significant impact on the west façade. Thus, to improve the accuracy of the FE model and investigate the effects of solar radiation on the west façade, solar radiation is applied as a boundary condition. The results show an improvement in the FE model, as shown in Table 5. For instance, the R² values improved between 1% and 6%, depending on the location. Moreover, the RMSE and MAPE have a remarkable improvement, where the indicator error decreases by more than 14%.
3.2.3. Longwave Radiation Model
It has been shown in past studies that sky temperature influences the heat loss from vertical facades [56]; as a result, we have also included the effect of this longwave radiation in the model. The results from our modelling study confirm this as indicated by the lower statistical indicators in Table 6 when compared to modelling the facade without the sky temperature.
Longwave radiation is applied to S1 (exposed column) using six sky temperature models, and the results are presented in Figure 13 and Table 6. Some of the models were simply based solely on a function of the ambient temperature [49,50,51]. These models are useful in specific situations when cloud cover does not change much or over a short period of time. The other models were more complex, taking other factors into account, such as dew point temperature and cloud cover [52,53,54].
Among the six models investigated, Berdahl and Martin [52], Tang et al. [53], and Berdahl and Fromberg [54] gave the closest results to the experimental results. However, this study used Berdahl and Martin [52], which improves the R2 of the FE model from 0.80 to 0.83, and it improves the RMSE and MAPE by 14.4% and 15.3%, respectively. Moreover, the accuracy of the model has been proven over a range of climates and on both cloudy and clear days [56].
At this point, the accuracy of the FE model is validated and considered acceptable regarding all the statistical indicators used and subsequently can be used in a further thermal bridging investigation.
3.3. Evaluating the Impact of Solar Radiation on Thermal Bridging
The energy transmittance for the two cases (bridged and un-bridged building) was investigated concerning the impact of solar radiation. In the case where no solar radiation is applied to the model, the un-bridged and bridged models predict heat flow into the building in this case of 0.63 and 1.39 KWh/m2. This amount of energy increased nearly 75% to 0.79 and 1.81 KWh/m2 when accounting for the impact of solar radiation on the model. However, the increase in energy transmittance in the bridged wall was more significant, both in absolute and relative terms, when accounting for solar radiation, as shown in Table 7. This further emphasizes the importance of avoiding thermal bridging.
3.4. Construction Improvement Suggestions
Figure 14 shows the surface temperature distribution results of wall systems W1-(a) and W4 (shown in Figure 6), external and internal temperature, and solar radiation. The temperature distribution images show the heat flow change during the day. As shown in W1-(a), the exposed column performs as a thermal bridge and allows heat to transfer into the building. Thermal bridging caused by the exposed column in W1-(a) is responsible for an internal temperature change by roughly 1.5 °C throughout the day.
The building receives direct solar radiation on the west façade starting from the afternoon and reaching its peak at around 4:30 p.m. This direct solar radiation is increasing the external surface temperature of the building envelope, as shown in Figure 14 at 4:30 p.m. Finally, insulating the exposed column (as in W4) helps to prevent heat transfer and maintain a stable internal temperature during the day.
The effective Ut-values of the different wall systems and system specifications are listed in Table 8. The inclusion of thermal bridging weakens the wall system by increasing the overall or effective Ut-value of the wall system from 0.42 W/m2·K in W0 (base case—wall system with no column) to 1.20 W/m2·K in W1-(a). On the other hand, improving the thermal bridging caused by the exposed column by covering the column (as in W1-(b)—W7) helped to decrease the Ut-value by a percentage between 32 and 73% compared to the exposed column (W1-(a)). Finally, except for W5 and W7, all the wall systems did not meet the minimum requirements of the Saudi code 2018 of the U-value for Zone 1.
3.4.1. External Insulation System
This section modulates alternative continuous insulation strategies to avoid the clear thermal deficiencies in the discontinuous insulation layer. External wall insulation systems (EWIS) have been shown in previous research [57,58,59,60,61,62,63,64,65,66,67,68,69] to reduce the thermal conductance U-value of a wall by up to 50% when compared to buildings with internal insulation, resulting in a 16 % reduction in annual total energy load [59]. Therefore, further FE analysis of different insulation thicknesses was applied to wall systems similar to that in W6 and W7. Figure 15 illustrates the effective Ut-values derived from the FE study, with reference to the wider number of Gulf countries for which the results are also relevant. The U-values for residential building walls are noted. For example, a residential building in Saudi Arabia needs external insulation of between 65 mm to 80 mm depending on the climatic zone to meet the minimum U-value required by the Saudi Code 2018 [60].
3.4.2. The Effective External Insulation Thickness for the Gulf Area
It is essential to investigate the adequate insulation thickness to suit the climate in Saudi Arabia and the other Gulf countries. Finite element analysis was performed for a 20 cm concrete block wall with external insulation layer thicknesses ranging from 1 to 20 cm (as shown in Figure 16). The tested point was identified at the insulation and the concrete block meeting to isolate the insulation’s efficiency from other factors.
As shown in Figure 17, the percentage of heat flux reduction of using external insulation is dramatically decreased as the thickness increases. However, after exceeding a thickness of 100 mm, the reduction of heat flow entering the building is nearly stable, with a decrease of less than 1%. Other researchers showed similar results when they investigated the optimum insulation thickness for Saudi Arabia [34,67,68]. Their results show that the optimum insulation thickness for climatic zone 1 in Saudi Arabia ranged between 6 and 9 cm. Moreover, they found that the impact of insulation on decreasing heat flux has a small effect when the insulation thickness exceeds 5 cm and a minimal effect at thicknesses > 10 cm [17].
4. Limitations
The study was conducted within July and August, the hottest months of the year, in Riyadh, Saudi Arabia [69], and the same for the other GCC countries, which could clearly represent the thermal bridging and solar radiation’s impact. The average external temperature for Riyadh in these months is 36.4 °C [69]. In July, the highest average external temperature in the GCC countries is in Kuwait, with an average external temperature of 38.6 °C, and the lowest external temperature is in Muscat, Oman, 33.4°C [69]. Moreover, the study was conducted for the west façade that received a massive amount of solar radiation in the summer season. This amount is attributed to the fact that the zenith angle in these months is as high as 88°, making the sun point more to the west than other months, which helps to evaluate the impact of solar radiation. The average solar radiation in July for Riyadh is 245 KWh/m2. Muscat, Oman received the lowest amount of solar radiation in July among the GCC countries, with the average solar radiation equal to 224 KWh/m2, and the highest average solar radiation was in Kuwait, which equaled 249 KWh/m2 [70]. Moreover, Riyadh was chosen because it is in the middle of the Gulf region at latitude 24.6 and has the strictest building code [60]. As a result, it has the potential to represent the region, and anything that succeeds on it could be applied to the entire Gulf countries.
Cast concrete frame with concrete block in-fill construction is common for residential construction across a number of countries and continents with hot climates. This study is not extensive regarding all global concrete construction but is particularly focused on that in the Gulf region. However, the findings have relevance for the improvement of steel-reinforced concrete construction in other hot climates. Alternative reinforcement to standard steel is possible and may bring thermal advantages. However, this study is focused on the common and singular method of steel-reinforced concrete frame construction.
Only six sky models were investigated, each one for a specific reason. For instance, the Berdahl and Martin [52] and Berdahl and Fromberg [54] models were used because both were investigated in Arizona’s weather, close to this region’s weather. The model of Tang et al. [53] was used because it was studied in Israel, which is in the Middle East, as well as it being the most recent model, established in 2004. Two clear sky direct temperature models were used: that by Garg [49] and that by Swinbank [50]. Finally, the Whillier [51] model studied a cloudy sky and was used to imitate the Gulf sky’s suspended dust.
The material properties used in this research are not primary data and not calculated by the authors, but they rely on other Saudi studies, as listed in Table 1. The properties of molded polystyrene, for example, are specific to the materials produced by local Saudi manufacturers and measured by Al-Ajlan [44]. The properties of the masonry blocks (concrete and volcanic) materials are experimentally defined by Al-Awsh et al. [40,41] and used here. The other material properties are obtained mostly from standards such as the ASHRAE Handbook of Fundamentals [42] and ISO 10456 [43]. Hence, the results could be changed by changing the material properties.
5. Discussion and Conclusions
Concrete is the most widely used material for building construction; however, it is responsible for 8% of the anthropogenic-related CO2 emissions worldwide [71]. The study demonstrates the energy efficiency potential of implementing more sustainable concrete construction methods in the Gulf area, specifically by addressing the building’s envelope’s weaknesses. This study focused on exploring the impact of thermal bridging in existing buildings by monitoring the heat transfer for three types of concrete frames with wall in-fill constructions. Simulating and validating the effect of thermal bridging using the FE model came next. After the validation, the relationship between solar radiation and thermal bridging was studied. Lastly, some construction alternatives were investigated in terms of their thermal transmittance.
The experimental study of heat flux through the building fabric indicates that the heat flow through the aggregated area of thermal bridged elements is responsible for double that through the insulated concrete block areas. Likewise, a previous FE thermal bridging analysis of the building envelope conducted by the authors demonstrated a coinciding result to this study [5]. However, this impact could be reduced by up to 28% by just covering the column by a 15 cm volcanic block (as shown in S3 in Figure 4) or more by using an external insulation system, as demonstrated in Section 3.4.
The impact of thermal bridging on different construction systems used in the Gulf countries causes an increase in the heat flow through the bridged elements of the building, as proven in this paper and the previous study [5]. The novelty of the present study is not only investigating the impact of thermal bridging but also the relationship between solar radiation and thermal bridging. The global solar radiation in the Gulf countries is intense. This amount of global solar radiation is a combination of direct normal irradiance and diffuse horizontal irradiance registered on a horizontal plane surface. However, the building façades are vertical plane surfaces. This paper is focused on the westerly façade that is exposed to the intense late afternoon/evening sun, reaching its peak impact on the west façade at around 4:30 p.m. Therefore, the global solar radiation is corrected to meet the westerly façade using the radiation tilt factor. Thus, the study proved that the bridged construction’s energy transmittance was more significant when accounting for solar radiation. However, the amount of heat flow may be affected by other external factors, such as the shadow from the neighboring buildings or the building’s orientation, as shown in the earlier result.
The model validation section shows that solar radiation is significant for an acceptable accuracy regarding the strong validation between the simulation and experimental models of the west façade. Future work will use this validated model to investigate more realistic scenarios.
The solutions proposed in this research aim to propose design corrections for more sustainable buildings in the Gulf region. Simply by covering the exposed structural elements either by a layer of blocks or, for a better result, with a layer of insulation, significant heat gain can be prevented. The use of an external insulation system was suggested earlier by the authors in a previous study [5]. However, Saudi Arabia’s regulation SBC 2018 was updated in August 2021 by changing the required U-value for all the climatic zones (the previously required wall U-values were 0.342, 0.397, and 0.453 W/m2·K for zones 1, 2, and 3, respectively [41,60]). Therefore, the external insulation thickness suggested by the previous paper was updated in this study. For example, a residential building in Saudi Arabia needs external insulation ranging between 65 mm to 80 mm depending on the climatic zone. However, after exceeding a thickness of 100 mm, the effectivity of the external insulation is nearly stable, with a decrease in the U-value of less than 1%.
Author Contributions
Conceptualization, E.A., R.O., and O.K.; methodology, E.A., R.O., and O.K.; software, E.A.; validation, E.A.; formal analysis, E.A.; investigation, E.A.; resources, E.A.; data curation, E.A.; writing—original draft preparation, E.A.; writing—review and editing, E.A., R.O., and O.K.; visualization, E.A.; supervision, R.O. and O.K.; project administration, O.K. All authors have read and agreed to the published version of the manuscript.
Funding
This research received no external funding.
Data Availability Statement
Not applicable.
Acknowledgments
This paper is part of a PhD study funded by the Technical and Vocational Training Corporation in Saudi Arabia.
Conflicts of Interest
The authors declare no conflict of interest.
References
- Al-Sanea, S.A.; Zedan, M.F.; Al-Hussain, S.N. Effect of thermal mass on performance of insulated building walls and the concept of energy savings potential. Appl. Energy 2012, 89, 430–442. [Google Scholar] [CrossRef]
- Saudi Arabia Government. Saudi Vision 2030. Available online: https://www.vision2030.gov.sa/ar/v2030/a-sustainable-saudi-vision/ (accessed on 8 November 2021).
- Asif, M. Growth and sustainability trends in the buildings sector in the GCC region with particular reference to the KSA and UAE. Renew. Sustain. Energy Rev. 2016, 55, 1267–1273. [Google Scholar] [CrossRef]
- General Authority for Statistics, “Housing Statistics Bulletin,” Saudi Arabia. 2018. Available online: https://www.stats.gov.sa/en# (accessed on 1 October 2019).
- Alayed, E.; Richard, O.; Kinnane, O. Thermal envelope analysis for new code compliance of Saudi Arabian dwellings. Energy Build. 2021, 243, 110997. [Google Scholar] [CrossRef]
- Evola, G.; Margani, G.; Marletta, L. Energy and cost evaluation of thermal bridge correction in Mediterranean climate. Energy Build. 2011, 43, 2385–2393. [Google Scholar] [CrossRef]
- Jiang, X.; Lin, A.; Ma, H.; Li, X.; Li, Y. Minimizing the thermal bridge through the columns in a refrigeration room. Appl. Therm. Eng. 2019, 165, 114565. [Google Scholar] [CrossRef]
- Martins, C.; Santos, P.; da Silva, L.S. Lightweight steel-framed thermal bridges mitigation strategies: A parametric study. J. Build. Phys. 2016, 39, 342–372. [Google Scholar] [CrossRef]
- Kosny, J.; Christian, J.E. Thermal evaluation of several configurations of insulation and structural materials for some metal stud walls. Energy Build. 1995, 22, 157–163. [Google Scholar] [CrossRef]
- Bianchi, F.; Pisello, A.L.; Baldinelli, G.; Asdrubali, F. Infrared Thermography Assessment of Thermal Bridges in Building Envelope: Experimental Validation in a Test Room Setup. Sustainability 2014, 6, 7107–7120. [Google Scholar] [CrossRef] [Green Version]
- de la Flor, F.J.S.; Cebolla, R.O.; Félix, J.L.M.; Domínguez, S.Á. Solar radiation calculation methodology for building exterior surfaces. Sol. Energy 2005, 79, 513–522. [Google Scholar] [CrossRef]
- Dutta, A.; Samanta, A.; Neogi, S. Influence of orientation and the impact of external window shading on building thermal performance in tropical climate. Energy Build. 2017, 139, 680–689. [Google Scholar] [CrossRef]
- Grynning, S.; Gustavsen, A.; Time, B.; Jelle, B.P. Windows in the buildings of tomorrow: Energy losers or energy gainers? Energy Build. 2013, 61, 185–192. [Google Scholar] [CrossRef]
- Chmúrny, I. Influence of External Surface Resistance and Thermal Insulation Level on Energy Need for Cooling. Appl. Mech. Mater. 2016, 824, 445–452. [Google Scholar] [CrossRef]
- Aelenei, D.; Brito-Coimbra, S.; Gomes, M.G.; Rodrigues, A.M. Solar Bridge Retrofit System: An innovative solution to renovate structural thermal bridge areas. Energy Build. 2021, 236, 110784. [Google Scholar] [CrossRef]
- Cappelletti, F.; Gasparella, A.; Romagnoni, P.; Baggio, P. Analysis of the influence of installation thermal bridges on windows performance: The case of clay block walls. Energy Build. 2011, 43, 1435–1442. [Google Scholar] [CrossRef]
- Asdrubali, F.; Baldinelli, G.; Bianchi, F. A quantitative methodology to evaluate thermal bridges in buildings. Appl. Energy 2012, 97, 365–373. [Google Scholar] [CrossRef]
- Ben-nakhi, A.E. Minimizing thermal bridging through window systems in buildings of hot regions. Appl. Therm. Eng. 2002, 22, 989–998. [Google Scholar] [CrossRef]
- Borelli, D.; Cavalletti, P.; Marchitto, A.; Schenone, C. A comprehensive study devoted to determine linear thermal bridges transmittance in existing buildings. Energy Build. 2020, 224, 110136. [Google Scholar] [CrossRef]
- Capozzoli, A.; Gorrino, A.; Corrado, V. A building thermal bridges sensitivity analysis. Appl. Energy 2013, 107, 229–243. [Google Scholar] [CrossRef]
- Theodosiou, T.; Tsikaloudaki, K.; Kontoleon, K.; Giarma, C. Assessing the accuracy of predictive thermal bridge heat flow methodologies. Renew. Sustain. Energy Rev. 2020, 136, 110437. [Google Scholar] [CrossRef]
- Romero, M.J.; Aguilar, F.; Vicente, P.G. Analysis of design improvements for thermal bridges formed by double-brick façades and intermediate slabs for nZEB residential buildings in Spain. J. Build. Eng. 2021, 44, 103270. [Google Scholar] [CrossRef]
- Ge, J.; Xue, Y.; Fan, Y. Methods for evaluating and improving thermal performance of wall-to-floor thermal bridges. Energy Build. 2021, 231, 110565. [Google Scholar] [CrossRef]
- Garay, R.; Chemisana, D.; Uriarte, A. Dynamic performance assessment of multidimensional heat transfer in buildings. J. Build. Eng. 2019, 26, 100893. [Google Scholar] [CrossRef]
- Zedan, M.F.; Al-Sanea, S.; Al-Mujahid, A.; Al-Suhaibani, Z. Effect of Thermal Bridges in Insulated Walls on Air-Conditioning Loads Using Whole Building Energy Analysis. Sustainability 2016, 8, 1–20. [Google Scholar] [CrossRef] [Green Version]
- Real, S.; Gomes, M.G.; Rodrigues, A.M.; Bogas, J.A. Contribution of structural lightweight aggregate concrete to the reduction of thermal bridging effect in buildings. Constr. Build. Mater. 2016, 121, 460–470. [Google Scholar] [CrossRef]
- Baldinelli, G.; Bianchi, F.; Rotili, A.; Costarelli, D.; Seracini, M.; Vinti, G.; Asdrubali, F.; Evangelisti, L. A model for the improvement of thermal bridges quantitative assessment by infrared thermography. Appl. Energy 2017, 211, 854–864. [Google Scholar] [CrossRef]
- Alghamdi, A.; Alharthi, H.; Alanazi, A.; Halawani, M. Effects of Metal Fasteners of Ventilated Building Facade on the Thermal Performances of Building Envelopes. Buildings 2021, 11, 167. [Google Scholar] [CrossRef]
- Kim, Y.J.; Allard, A. Thermal response of precast concrete sandwich walls with various steel connectors for architectural buildings in cold regions. Energy Build. 2014, 1187, 137–148. [Google Scholar] [CrossRef]
- François, A.; Ibos, L.; Feuillet, V.; Meulemans, J. In situ measurement method for the quantification of the thermal transmittance of a non-homogeneous wall or a thermal bridge using an inverse technique and active infrared thermography. Energy Build. 2021, 233, 110633. [Google Scholar] [CrossRef]
- Zalewski, L.; Lassue, S.; Rousse, D.; Boukhalfa, K. Experimental and numerical characterization of thermal bridges in prefabricated building walls. Energy Convers. Manag. 2010, 51, 2869–2877. [Google Scholar] [CrossRef]
- Gorgolewski, M. Developing a simplified method of calculating U-values in light steel framing. Build. Environ. 2007, 42, 230–236. [Google Scholar] [CrossRef]
- DYarbrough, W.; Anderson, R.W. Use of radiation control coatings to reduce building air-conditioning loads. Energy Sources 1993, 15, 59–66. [Google Scholar] [CrossRef]
- Al-Sanea, S.A.; Zedan, M.F.; Al-Mujahid, A.M.; Al-Suhaibani, Z.A. Optimum R-values of building walls under different climatic conditions in the Kingdom of Saudi Arabia. Appl. Therm. Eng. 2016, 96, 92–106. [Google Scholar] [CrossRef]
- Tsilingiris, P.T. The influence of heat capacity and its spatial distribution on the transient wall thermal behavior under the effect of harmonically time-varying driving forces. Build. Environ. 2006, 41, 590–601. [Google Scholar] [CrossRef]
- Al-Sanea, S.A.; Zedan, M.F. Effect of thermal bridges on transmission loads and thermal resistance of building walls under dynamic conditions. Appl. Energy 2012, 98, 584–593. [Google Scholar] [CrossRef]
- TELEDYNE. FLIR One Gen 2. Available online: https://www.flir.com/products/flir-one-gen-3/ (accessed on 28 February 2020).
- van Doremalen, R.F.M.; van Netten, J.J.; van Baal, J.G.; Vollenbroek-Hutten, M.M.R.; van der Heijden, F. Validation of low-cost smartphone-based thermal camera for diabetic foot assessment. Diabetes Res. Clin. Pract. 2019, 149, 132–139. [Google Scholar] [CrossRef]
- Klaessens, J.H.; van der Veen, A.; Verdaasdonk, R.M. Comparison of the temperature accuracy between smart phone based and high-end thermal cameras using a temperature gradient phantom. In Design and Quality for Biomedical Technologies; Raghavachari, R., Liang, R., Eds.; SPIE: San Francisco, CA, USA, 2017; Volume 10056. [Google Scholar]
- Al-Awsh, W.A.; Qasem, N.A.A.; Al-Amoudi, O.S.B.; Al-Osta, M.A. Experimental and numerical investigation on innovative masonry walls for industrial and residential buildings. Appl. Energy 2020, 276, 115496. [Google Scholar] [CrossRef]
- Saudi Energy Efficiency Center. Guidelines for Thermal Insulation Systems and Materials (Arabic); Saudi Energy Efficiency Center: Riyadh, Saudi Arabia, 2021. [Google Scholar]
- American Society of Heating, Refrigerating and Air-Conditioning Engineers. ASHRAE—Handbook of Fundamentals, SI Edition ed; American Society of Heating, Refrigerating and Air-Conditioning Engineers, Inc.: Peachtree Corners, GA, USA, 2017. [Google Scholar]
- ISO 10456:2007. Building Materials and Products—Hygrothermal Properties—Tabulated Design Values and Procedures for Determining Declared and Design Thermal Values; International Organization for Standardization: Geneva, Switzerland, 2007. [Google Scholar] [CrossRef]
- Al-Ajlan, S.A. Measurements of thermal properties of insulation materials by using transient plane source technique. Appl. Therm. Eng. 2006, 26, 2184–2191. [Google Scholar] [CrossRef]
- ISO 6946:2017. Building Components and Building Elements—Thermal Resistance and Thermal Transmittance—Calculation Methods; International Organization for Standardization: Geneva, Switzerland, 2017. [Google Scholar] [CrossRef]
- CIBSE. Environmental Design CIBSE Guide A; CIBSE: London, UK, 2016. [Google Scholar]
- Al-Tamimi, A.S.; Al-Amoudi, O.S.B.; Al-Osta, M.A.; Ali, M.R.; Ahmad, A. Effect of insulation materials and cavity layout on heat transfer of concrete masonry hollow blocks. Constr. Build. Mater. 2020, 254, 119300. [Google Scholar] [CrossRef]
- King Abdullah City for Atomic and Renewable Energy. Renewable Resource Atlas. 2021. Available online: https://rratlas.energy.gov.sa/RRMMPublicPortal/?q=en/Home (accessed on 15 September 2021).
- Garg, H.P. Treatise on Solar Energy: Fundamental of Solar Energy; John Wiley & Sons: Hoboken, NJ, USA, 1982. [Google Scholar]
- Swinbank, W.C. Long-wave radiation from clear skies. Q. J. R. Meteorol. Soc. 1963, 89, 339–348. [Google Scholar] [CrossRef]
- Whillier, A. Design Factors Influencing Solar Collectors in Low Temperature Engineering Applications of Solar Energy; American Society of Heating, Refrigerating and Air-Conditioning Engineers, Inc.: Peachtree Corners, GA, USA, 1967. [Google Scholar]
- Berdahl, M.; Martin, P. Emissivity of Clear Skies. Mar. Sol. Energy 1982, 32, 663–664. [Google Scholar] [CrossRef]
- Tang, R.; Etzion, Y.; Meir, I.A. Estimates of clear night sky emissivity in the Negev Highlands, Israel. Energy Convers. Manag. 2004, 45, 1831–1843. [Google Scholar] [CrossRef]
- Berdahl, P.; Fromberg, R. The thermal radiance of clear skies. Sol. Energy 1982, 29, 299–314. [Google Scholar] [CrossRef]
- Moreno, J.J.M.; Pol, A.P.; Abad, A.S.; Blasco, B.C. Using the R-MAPE index as a resistant measure of forecast accuracy. Psicothema 2013, 3, 185–186. [Google Scholar] [CrossRef]
- O’Hegarty, R.; Kinnane, O.; McCormack, S.J. Concrete solar collectors for façade integration: An experimental and numerical investigation. Appl. Energy 2017, 206, 1040–1061. [Google Scholar] [CrossRef]
- Eben Saleh, M.A. Impact of Thermal Insulation Location on Buildings in Hot Dry Climates. Sol. Wind Technol. 1990, 7, 393–406. [Google Scholar] [CrossRef]
- Asan, H. Investigation of wall’s optimum insulation position from maximum time lag and minimum decrement factor point of view. Energy Build. 2000, 32, 197–203. [Google Scholar] [CrossRef]
- Alghamdi, A.A. Numerical investigation of thermal insulation options for non-insulated buildings in Saudi Arabia. Int. J. Ambient Energy 2019, 42, 1428–1434. [Google Scholar] [CrossRef]
- The Saudi Building Code National Committee Regulations. SBC 602: Energy Conservation Requirements (Arabic). In Saudi Building Code; 2018. Available online: https://sbc.gov.sa/En/BC/Pages/buildingcode/BCHome.aspx (accessed on 15 May 2019).
- Muscat Municipality. Building Regulation For Muscat; Muscat Municipality: Muscat, Oman, 1992. [Google Scholar]
- Department of Municipal Affairs Abu Dhabi International Energy Conservation Code; Department of Municipal Affairs: Abu Dhabi, United Arab Emirates, 2018.
- Dubai Municipality. Al Sa’fat, Dubai Green Building Evaluation System; Government of Dubai: Dubai, United Arab Emirates, 2016. [Google Scholar]
- Ministry of Electricity and Water. Energy Conservation Program Code of Practice; Ministry of Electricity and Water: Kuwait City, Kuwait, 2014; p. 30. Available online: http://www.mew.gov.kw/Files/MediaLibrary/TheCode.pdf. (accessed on 2 April 2020).
- Ministry of Municipality and Environment. Qatar Construction Specifications (QCS) 2014; Ministry of Municipality and Environment: Doha, Qatar, 2014. [Google Scholar]
- Electricity and Water Authority. Guidelines (149) for Thermal Insulation Implementation in Buildings; Electricity and Water Authority: Abu Saiba, Bahrain, 2018; Volume 149, pp. 17–25. [Google Scholar]
- Al-Sanea, S.A.; Zedan, M.F.; Al-Ajlan, S.A.; Hadi, A.S.A. Heat Transfer Characteristics and Optimum Insulation Thickness for Cavity Walls. J. Build. Phys. 2003, 26, 285–307. [Google Scholar] [CrossRef]
- Al-tamimi, N. An Optimum Thermal Insulation Type and Thickness for Residential Buildings in Three Different Climatic Regions of Saudi Arabia. Civ. Eng. Archit. 2021, 9, 317–327. [Google Scholar] [CrossRef]
- American Society of Heating, Refrigerating and Air-Conditioning Engineers, “ASHRAE Climatic Design Conditions,”. 2017. Available online: http://ashrae-meteo.info/v2.0/ (accessed on 12 June 2019).
- European Commission. Photovoltaic Geographical Information System. Available online: https://re.jrc.ec.europa.eu/pvg_tools/en/#MR (accessed on 23 November 2021).
- Maries, A.; Hills, C.D.; Carey, P. Low-Carbon CO2-Activated Self-Pulverizing Cement for Sustainable Concrete Construction. J. Mater. Civ. Eng. 2020, 32, 06020009. [Google Scholar] [CrossRef]
Figure 1.
Concrete frame construction with block in-fill and example of villa-style housing development in Saudi Arabia.
Figure 1.
Concrete frame construction with block in-fill and example of villa-style housing development in Saudi Arabia.

Figure 2.
Three rooms of buildings investigated in this research. Sensors S1, S3 on concrete columns and S2 on in-fill wall.
Figure 2.
Three rooms of buildings investigated in this research. Sensors S1, S3 on concrete columns and S2 on in-fill wall.

Figure 3.
The equipment used for monitoring the buildings. (A) Heat flux meter (PHFS-09e heat flux and surface temperature sensor). (B) The data logger (FluxDAQ+ data logging system developed by Fluxteq). (C) Internal and external temperature monitoring (custom made Raspberry Pi for data logging with one wire calibrated air temperature sensors (DS18B20)).

Figure 4.
External wall section of Building-3, S1 exposed column, S2 double-layered wall, and S3 covered column.
Figure 4.
External wall section of Building-3, S1 exposed column, S2 double-layered wall, and S3 covered column.
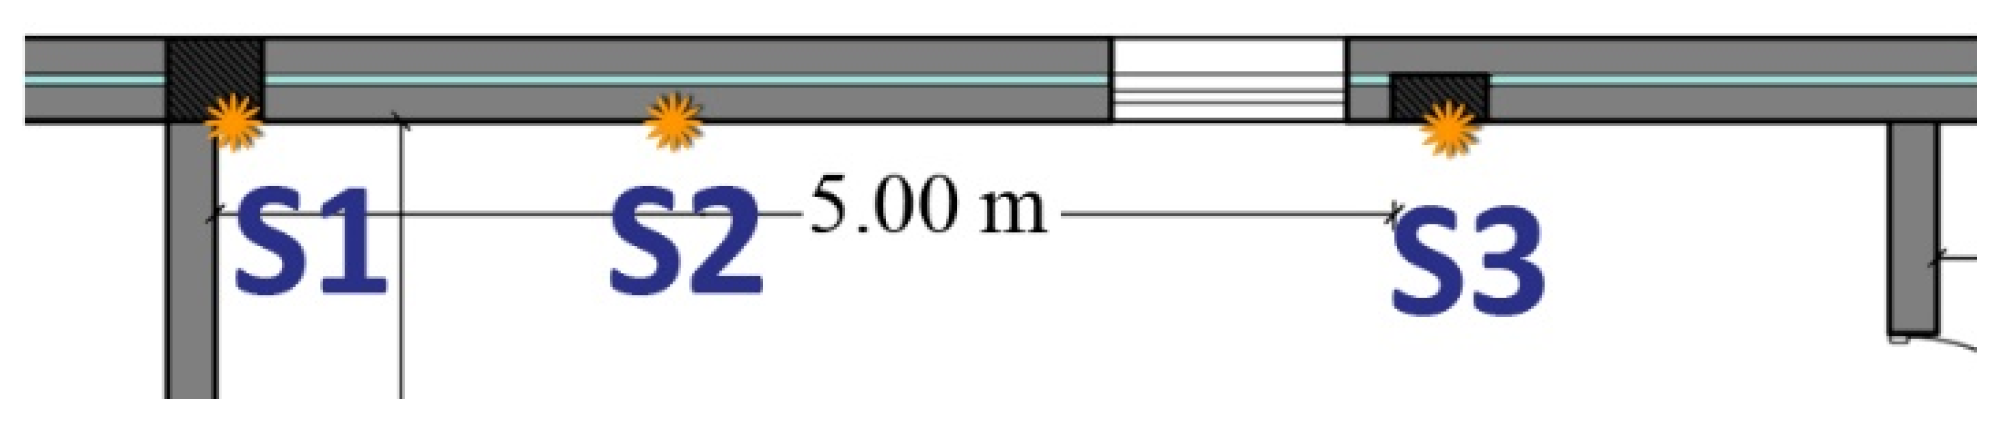
Figure 5.
(a) Scenario-1 with temperature and heat transfer coefficients only (left), (b) Scenario-2 with the addition of shortwave radiation (middle), and (c) Scenario-3 with the addition of longwave radiation (right).
Figure 5.
(a) Scenario-1 with temperature and heat transfer coefficients only (left), (b) Scenario-2 with the addition of shortwave radiation (middle), and (c) Scenario-3 with the addition of longwave radiation (right).

Figure 6.
Wall section alternatives investigated; the column and the wall in W1-(a) represent S1, S2 in Building-3, and the column in W1-(b) represents S3.
Figure 6.
Wall section alternatives investigated; the column and the wall in W1-(a) represent S1, S2 in Building-3, and the column in W1-(b) represents S3.

Figure 7.
(a) Building-1 heat flux for the whole period and (b) selected day heat flux, external and internal temperature, and solar radiation.
Figure 7.
(a) Building-1 heat flux for the whole period and (b) selected day heat flux, external and internal temperature, and solar radiation.

Figure 8.
(a) Building-2 heat flux for the whole period and (b) selected day heat flux, external and internal temperature, and solar radiation.
Figure 8.
(a) Building-2 heat flux for the whole period and (b) selected day heat flux, external and internal temperature, and solar radiation.

Figure 9.
(a) Building-3 heat flux for the whole period and (b) selected day heat flux, external and internal temperature, and solar radiation.
Figure 9.
(a) Building-3 heat flux for the whole period and (b) selected day heat flux, external and internal temperature, and solar radiation.

Figure 10.
Orientation and shadow study of (a) Building-2 and (b) Building-3.

Figure 11.
(a) Thermal images result for Building-1, (b) Building-2, and (c) Building-3, showing surface temperature differences evidencing thermal bridging through structural columns and beams.
Figure 11.
(a) Thermal images result for Building-1, (b) Building-2, and (c) Building-3, showing surface temperature differences evidencing thermal bridging through structural columns and beams.

Figure 12.
Simulated total heat flux result for two weeks for (a) exposed column, (b) wall, and (c) covered column, shown in relation to experimentally monitored data for different sensor locations S1–S3.
Figure 12.
Simulated total heat flux result for two weeks for (a) exposed column, (b) wall, and (c) covered column, shown in relation to experimentally monitored data for different sensor locations S1–S3.

Figure 13.
Two days result shows the impact of longwave radiation on the FE model’s (a) external temperature and (b) total heat flux.
Figure 13.
Two days result shows the impact of longwave radiation on the FE model’s (a) external temperature and (b) total heat flux.

Figure 14.
Modelled heat transfer through the walls W1-(a) and W4 (surface temperature distribution) at 3 different times during the 24 h period, corresponding with external and internal temperature and solar radiation.
Figure 14.
Modelled heat transfer through the walls W1-(a) and W4 (surface temperature distribution) at 3 different times during the 24 h period, corresponding with external and internal temperature and solar radiation.

Figure 15.
The benefit of using external insulation of varying thickness applied to a concrete frame structure with uninsulated concrete block in-fill and the thickness that meets the minimum U-value required for the Gulf countries (Adapted from Ref. [60,61,62,63,64,65,66]).

Figure 16.
Finite element analysis model.

Figure 17.
Percentage of heat flux reduction of using external insulation with regard to the insulation thickness.
Figure 17.
Percentage of heat flux reduction of using external insulation with regard to the insulation thickness.


Table 1.
Material properties used in finite element modelling.
| Common Materials | Density ρ kg/m3 | Design Thermal Conductivity k W/(m·K) | Specific Heat Capacity c J/(kg·K) | Source |
|---|---|---|---|---|
| Concrete Block, Hollow, 200 mm | 1105 | 1.04 | 840 | [25,34] |
| Concrete Block, Hollow, 150 mm | 1362 | 0.96 | 840 | |
| Concrete Block, Hollow, 100 mm | 1618 | 0.81 | 840 | |
| Volcanic Block | 800 | 0.34 | 840 | [40,41] |
| Cement mortar and plaster | 1800 | 0.72 | 1000 | [42,43] |
| Reinforced concrete | 2243 | 1.73 | 840 | [36] |
| Molded polystyrene insulation | 23 | 0.034 | 1280 | [44] |
| Air Space (20 mm) | 1.1 | 0.17 (keff) | 1007 | [45] |
| Surface emissivity coefficient (ε) | 0.9 | [42,46] | ||
| Absorptance coefficient (α) | 0.6 | [47] | ||
| Internal surface resistance | 0.13 m2K/W | |||
| External surface resistance | 0.044 m2K/W | |||
Table 2.
Sky temperature and sky emissivity models.
| Model | Site | Author/Reference | Note | ||
|---|---|---|---|---|---|
| 1 | Direct Temperature Models | Australia | Garg (1982), [49] | Clear Sky | |
| 2 | Australia | Swinbank (1963), [50] | |||
| 3 | USA | Whillier (1967), [51] | Cloudy Sky | ||
| 4 | USA AZ, TX, MD, MO, FL, NV | Berdahl and Martin (1982), [52] | Clear Sky Atmospheric Emissivity Models | ||
| 5 | Israel Negev Highlands | Tang et al. (2004), [53] | |||
| 6 | USA AZ/MD, and MO | Berdahl and Fromberg (1982), [54] | |||
Table 3.
Total energy transmittance entering the building through structural elements and wall with the % differences between the two elements.
Table 3.
Total energy transmittance entering the building through structural elements and wall with the % differences between the two elements.
| Building Name | Element | Energy (KWh) | % Difference |
|---|---|---|---|
| Building-1 | Exposed-Column | 1.13 | 23% |
| Wall | 0.92 | ||
| Building-2 | Exposed-Column | 1.89 | 100% |
| Wall | 0.63 | ||
| Building-3 | Exposed-Column | 2.73 | 111% |
| Wall | 0.78 | ||
| 91% | |||
| Covered-Column | 2.06 | ||
| % between Exposed and Covered Columns | 28% | ||
Table 4.
Results of statistical evaluation error comparison between experimental data and simulated data.
Table 4.
Results of statistical evaluation error comparison between experimental data and simulated data.
| Accuracy Measurement Indicator | S1—Exposed Column | S2—Wall | S3—Covered Column | |
|---|---|---|---|---|
| R-square coefficient | R2 | 0.76 | 0.78 | 0.91 |
| % Root Mean Square Error | RMSE | 24.0 | 26.1 | 33.5 |
| % Mean Absolute Error | MAPE | 24.1 | 25.7 | 32.3 |
Table 5.
Validation results comparison between models with convective boundary conditions and after adding shortwave radiation with a percentage difference.
Table 5.
Validation results comparison between models with convective boundary conditions and after adding shortwave radiation with a percentage difference.
| Accuracy Measurement Indicator | S1—Exposed Column | % Difference | S2—Wall | % Difference | S3—Covered Column | % Difference | ||||
|---|---|---|---|---|---|---|---|---|---|---|
| Convective BC | Convective + Shortwave Rad. | Convective BC | Convective + Shortwave Rad. | Convective BC | Convective + Shortwave Rad. | |||||
| R-square coefficient | R2 | 0.76 | 0.80 | 6% | 0.78 | 0.80 | 2% | 0.91 | 0.92 | 1% |
| % Root Mean Square Error | RMSE | 24.0 | 18.1 | 28% | 26.1 | 20.0 | 25% | 33.5 | 22.7 | 38% |
| % Mean Absolute Error | MAPE | 24.1 | 20.1 | 14% | 25.7 | 22.1 | 15% | 32.3 | 26.5 | 20% |
Table 6.
Longwave radiation impact on S1 (exposed column).
| Accuracy Measurement Method | S1 Convective + Shortwave Rad. | Sky Temperature Model | ||||||
|---|---|---|---|---|---|---|---|---|
| Ber&Mar [52] | Garg [49] | Swinbank [50] | Whillier [51] | Tang [53] | Ber&Fro [54] | |||
| % R-square coefficient | R2 | 0.80 | 0.83 | 0.71 | 0.68 | 0.78 | 0.81 | 0.81 |
| % Root Mean Square Error | RMSE | 18.1 | 14.4 | 26.6 | 31.1 | 16.0 | 14.6 | 14.5 |
| % Mean Absolute Error | MAPE | 20.1 | 15.3 | 24.7 | 29.2 | 16.2 | 15.6 | 15.5 |
Table 7.
Total energy transmitted for the bridged and un-bridged model for the two weeks.
| Total Energy Transmittance without Solar Radiation Applied to the Model (KWh/m2) | Total Energy Transmittance with Solar Radiation Applied to the Model (KWh/m2) | |
|---|---|---|
| Un-bridged model | 0.63 | 0.79 |
| Bridged Model | 1.39 | 1.81 |
Table 8.
Wall system specifications and the effective Ut-values of the different wall systems.
| System Name | Wall Construction System | Column Construction System | Block materials | Ut-Value (W/m2·K) |
|---|---|---|---|---|
| W0 | Two layers of 15 cm blocks + 5 cm insulation | (No column) | Volcanic | 0.42 |
| W1-(a) | Two layers of 15 cm blocks + 5 cm insulation | Exposed column | Volcanic | 1.20 |
| W1-(b) | Two layers of 15 cm blocks + 5 cm insulation | Covered by 15 cm block | Volcanic | 0.81 |
| W2 | A layer of 20 cm block + A layer of 10 cm block + 5 cm insulation | Covered by 5 cm insulation and 10 cm block | Volcanic | 0.45 |
| W3 | A layer of 20 cm insulated block + A layer of 10 cm block + 5 cm insulation | Covered by 5 cm insulation and 10 cm block | Concrete | 0.42 |
| W4 | Two layers of 15 cm blocks + 5 cm insulation | Covered by 5 cm insulation and 10 cm block | Volcanic | 0.45 |
| W5 | A layer of 15 cm block + A layer of 10 cm block + 10 cm insulation | Covered by 5 cm insulation and 10 cm block | Volcanic | 0.36 |
| W6 | A layer of 20 cm block | Covered by 5 cm insulation | Concrete | 0.60 |
| W7 | A layer of 20 cm block | Covered by 10 cm insulation | Concrete | 0.32 |
Publisher’s Note: MDPI stays neutral with regard to jurisdictional claims in published maps and institutional affiliations. |
© 2022 by the authors. Licensee MDPI, Basel, Switzerland. This article is an open access article distributed under the terms and conditions of the Creative Commons Attribution (CC BY) license (https://creativecommons.org/licenses/by/4.0/).
Share and Cite
MDPI and ACS Style
Alayed, E.; O’Hegarty, R.; Kinnane, O. Solutions for Exposed Structural Concrete Bridged Elements for a More Sustainable Concrete Construction in Hot Climates. Buildings 2022, 12, 176. https://doi.org/10.3390/buildings12020176
AMA Style
Alayed E, O’Hegarty R, Kinnane O. Solutions for Exposed Structural Concrete Bridged Elements for a More Sustainable Concrete Construction in Hot Climates. Buildings. 2022; 12(2):176. https://doi.org/10.3390/buildings12020176
Chicago/Turabian StyleAlayed, Essam, Richard O’Hegarty, and Oliver Kinnane. 2022. "Solutions for Exposed Structural Concrete Bridged Elements for a More Sustainable Concrete Construction in Hot Climates" Buildings 12, no. 2: 176. https://doi.org/10.3390/buildings12020176
Note that from the first issue of 2016, this journal uses article numbers instead of page numbers. See further details here.