
Energy Retrofitting Assessment of Public Building Envelopes in China’s Hot Summer and Cold Winter Climate Region


1
School of Architecture and Urban Planning, University of Suzhou Science and Technology, Suzhou 215009, China
2
Jiangsu Provincial Construction Carbon Neutral Technology Engineering Research Center, Suzhou 215009, China
3
Department of Civil Engineering, Xi’an Jiaotong-Liverpool University, Suzhou 215000, China
4
School of Architecture and Built Environment, The University of Adelaide, Adelaide, SA 5005, Australia
*
Author to whom correspondence should be addressed.
Buildings 2022, 12(11), 1866; https://doi.org/10.3390/buildings12111866
Submission received: 20 September 2022
/
Revised: 11 October 2022
/
Accepted: 31 October 2022
/
Published: 3 November 2022
(This article belongs to the Collection Buildings, Infrastructure and SDGs 2030)
Abstract
:The retrofitting of existing public buildings to save energy and reduce carbon emissions is a priority for China’s building sector. Accordingly, the Chinese government requires all public buildings to be energy retrofitted based on the Design Standard for Energy Efficiency of Public Buildings GB50189-2015. However, few studies have been conducted to assess the energy efficiency of this design standard in the hot summer and cold winter (HSCW) climate region of China. The aim of this study was therefore to provide sensitivity analysis for the thermal properties of the envelope of a typical public building energy retrofit in China’s HSCW climate region. The results show that the thermal performance of the existing envelope of the sample building was very poor, with heating and cooling energy consumption 18.94% higher than the GB90189-2015 baseline model. It was found that better optimized parameters could reduce the heating and cooling energy load by 28.26% compared with the parameters of the sample building. The findings from this study provide valuable references for local governments and practitioners eager to improve the energy efficiency of existing public buildings in China’s HSCW region.
1. Introduction
The energy consumption of the building sector accounts for around 40% of final energy use and 25% of total carbon dioxide emissions globally [1,2]. With continuous economic development and improving living standards, the energy demand of the building sector in China has been steadily growing since the beginning of the 21st century [3]. Since the end of 2015, all newly designed buildings in urban areas have been required to implement the government’s building energy-saving standard. Public buildings have the highest energy use intensity among all building types [4]. A huge number of existing public buildings in China were designed before the end of 2015, most with very high energy consumption [5]. Retrofitting existing buildings is recognized as the most feasible and cost-effective way to achieve green buildings, and it has less environmental impact than demolishing and reconstructing a new building [6]. Energy retrofitting existing public buildings is a priority for energy saving, mitigating the environmental impact of the building sector, and sustainably developing China [7].
Energy retrofitting existing buildings employs efficient energy-saving measures to reduce energy consumption while meeting the thermal comfort needs of people [8]. Since [9] China has a very large land area with distinct regional climates, bespoke measures are needed in different climate regions to meet the thermal comfort and living habits of the residents [9]. Building retrofit measures in China vary according to the five distinct climate regions defined by the “Thermal Design Standard for Civic Building (GB50176-2016)”, which are: Warm Winter and Hot Summer climate region, Temperate climate region, Hot Summer and Cold Winter (HSCW) climate region, Cold climate region, and Severe Cold climate region [10]. This research focuses on the HSCW climate region.
China’s HSCW climate region consists of 14 provinces and two municipalities, involving an area of 1,800,000 km2 with a population of more than 500 million [11]. The typical climate in this area is that of a tropical monsoon, with hot, humid summers and mild winters. The GDP of this area totals about 40% the GDP of the whole of China [12]. Because of the developed economy, the area has a relatively high-income population, with higher expectations of indoor thermal comfort. People rely on using heating, ventilation, and air conditioning (HVAC) systems to fulfil the indoor thermal conditions of buildings [13]. HVAC systems account for the largest proportion of energy consumption of public buildings in the HSCW climate region of China [14]. Measures that reduce the energy consumption of existing public buildings in the HSCW climate region need to be investigated.
The heating and cooling demands of buildings are affected by heat transfer through the building envelope. The building envelope separates the indoor environment from the exterior environment and directly attenuates the impact of the natural climate. Enhancing the thermal performance of the building envelope to mitigate the energy demand of a building is recognized as one of the most sustainable methods of building energy retrofitting [15]. The main building thermal envelope includes the external walls, roof, and windows. In earlier years, because of low comfort demand and low cost, buildings were constructed without any insulation. When existing uninsulated buildings are conditioned with heating and cooling systems, there is a huge waste of energy due to poor envelopes [16]. Insulation is recognized as one of the most vital parameters of energy conservation in buildings. In recognition of this importance, all energy regulations for buildings judge efficiency using the Heat Transfer Coefficient (U-value) of a building envelope, including the external walls, roof, and windows [17]. The main objective of the U-value is to measure heat transfer through the envelope, where a smaller U-value indicates better insulation [18]. External windows account for a substantial portion of the envelope and affect indoor space heating and cooling demand. Besides U-value, the Solar Heat Gain Coefficient (SHGC) is a primary parameter used to judge the energy performance of a window. SHGC is the fraction of the external solar radiation transmitted through a window and absorbed in the glazing [19]. Due to its importance, the SHGC value of windows is restricted in all the energy regulations for buildings [20]. The lower the SHGC, the more solar radiation is blocked from the window.
China’s first national standard of building energy efficiency for public buildings, “Design Standard for Energy Efficiency of Public Buildings (GB50189-2005)”, was implemented in 2005 to guide the design of new construction projects [21]. Compared with public buildings designed before 2005, the buildings that complied with the standard saved about 50% on energy consumption annually [22]. As building materials and technologies then rapidly developed after China’s “11th Five Year Plan (2006–2010)”, old standards and technical codes started to show limitations and lagged behind on design and technological developments. Consequently, the new version of GB50189-2015 was launched at the end of 2015 (MOHURD, 2015) [23]. The building envelope baseline thermal properties, including the U-Values and SHGCs of the external walls, roof, and windows, are improved in GB50189-2015 compared with GB50189-2005. A comparison of the parameters of GB50189-2005 and GB50189-2015 for the HSCW climate region is shown in Table 1.
Previous studies have analyzed energy retrofit measures for building envelopes to minimize the energy consumption of existing buildings in China’s HSCW climate region. Peng et al. (2014) studied the energy performance of a building after adding an insulation layer inside the external wall and replacing the windows with Low-E glassing [24]. Xu et al. (2016) assessed different energy retrofit measures in three different climate zones of China through simulation [25]. Ge et al. (2018) studied the energy performance of the building envelope energy retrofitting of a university building in Hangzhou through simulation [26]. Li et al. (2019) simulated the partial horizontal and vertical green roof and wall of an existing public building in a HSCW climate region of China [27]. Liu et al. (2021) simulated the insulation of building envelopes based on the Passivhaus EnerPHit standard for a suburban building in the HSCW region of China [28]. It is evident that previous studies focused on energy reduction using different retrofitting measures on the building envelope of existing buildings. Meanwhile, the Chinese government has required the energy thermal performance of existing public building retrofitting to be improved based on the public building energy efficiency standard GB50189-2015. However, few studies have investigated the influence of GB50189-2015 on the thermal energy performance of retrofitted existing public buildings [29].
The goals of this study are: the creation of a baseline model for the public building energy efficiency standard GB50189-2015 to assess the energy performance of existing buildings; the application of sensitivity analysis to assess the parameters of the thermal standard of the envelope for a typical public building prototype based on the GB50189-2015 standard; and the adoption of optimized parameters to assess energy performance. The findings of this study could provide a valuable reference to local governments and practitioners eager to improve the energy efficient retrofitting of existing public buildings.
2. Methodology
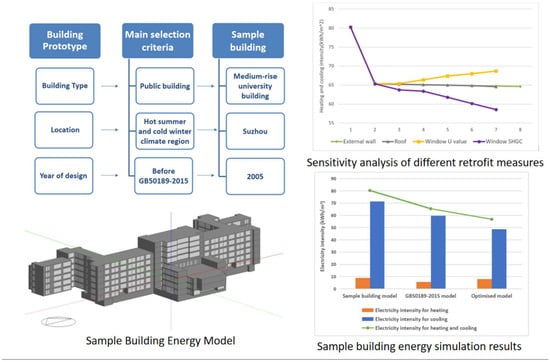
The sample building, which is representative of existing public building stock in China’s HSCW climate region, was selected for the case study. The sample building model and a corresponding standard GB50189-2015 baseline model were created using the simulation tool DesignBuilder [30]. The thermal and energy performance of the envelopes of sample buildings were assessed with the standard GB50189-2015 baseline model. Based on the baseline model, the study applied sensitivity analysis for the building envelope, including the U-value of the external wall, U-value of the roof, and U-value and SHGC value of external windows, to further optimize the parameters and identify its impact on the energy consumption of the building. Finally, an optimized building model was created, and simulations were performed to analyze the effectiveness of the optimized energy retrofitting measures.
2.1. Sample Building Selection
The sample public building was a typical medium-rise university building located in Suzhou, which is in a HSCW climate region of China. Compared with the existing building, the sample building had adopted retrofitting measures that significantly reduced the heating and cooling energy load. The building was constructed in 2005 with eight floors and underground parking. The building’s area was 31,960 m2, including a 3730 m2 underground building area. The building consisted of classrooms, offices, meeting rooms, hall/lecture theatres, laboratories, corridors, toilets, stairways, and lifts. The main functional zones of the building were classrooms and staff offices. The building typology was the most commonly used for university buildings, which could make the results applicable to a number of existing public buildings that were designed before GB50189-2015 was implemented in the HSCW climate region [31]. From a field investigation, it was determined that the indoor thermal environment was controlled by a multi-split air-conditioning system, which is the most wildly used by mid-rise university and office buildings in the HSCW climate region because of its ability to flexibly maintain individual zone control in each room with a high degree of efficiency [32]. There was a mechanical ventilation system installed in the building. Natural ventilation was obtained through window openings and infiltration.
2.2. Sample Building Model
DesignBuilder simulation software was used in this project to create the building geometry model [30]. DesignBuilder is a user-friendly integrated simulation software using the EnergyPlus simulation engine, which was developed by US DOE, and it is widely accepted as a reliable simulation tool, the accuracy of which has been validated by the American HVAC Engineering Association [33].
The simplified sample building model was created based on original CAD drawings and design data. The building facade’s decorative structure, internal architectural details, and any outdoor stairs and terraces were ignored in the model because they had little influence on the indoor thermal environment. The sample building photo and 3D model in DesignBuilder are shown in Figure 1 and Figure 2, respectively.
The layout of each floor was drawn according to the original CAD drawings and field investigation. As a university building, the primary functional zones of the building were classrooms, lecture theatres, offices, meeting rooms, computer labs, corridors, stairways, and toilets. The first-floor layout created in DesignBuilder is illustrated in Figure 3.
This research focuses on the energy retrofitting of existing building envelopes. The main composition of a building envelope was derived from the original CAD design drawings and descriptions. After setting up the composition of the external wall, roof, and external windows in DesignBuilder, the thermal properties of these envelopes were calculated with the use of the software. The detailed composition of the external walls, roof, and windows with calculated thermal properties are listed in Table 2.
According to the Implementation Guide for Green Building Assessment Standard for Existing Building Retrofitting [34], all other impact elements, including the light power density, electrical device density, cooling setpoint, heating setpoint, fresh air value, personal occupancy density, and operational schedule of the model, are taken from the standard values for an educational building in the HSCW climate region of GB50189-2015 and the Standard for Green Performance Calculation of Civil Buildings (JGJ/T 449-2018) by MOHURD [35]. This method of using the parameters of the latest standard have been proven effective by researchers for building energy simulations [36,37]. The major parameters of conditioned areas are listed in Table 3.
The location of the sample building was in Suzhou, and the hourly weather data was obtained from Meteonorm 7 [38]. Figure 4 illustrates the Suzhou weather data of a typical meteorological year. As illustrated, the coldest dry bulb temperature is about −5 °C, and the hottest dry bulb temperature is about 37 °C.
3. Building Energy Performance Assessment
3.1. Building Heating and Cooling Load
The energy simulation was performed, and the annual simulation results of the cooling and heating load is illustrated in Figure 5. The heating and cooling load refers to the instantaneous heating and cooling capacity (kW) necessary for maintaining indoor set-point temperatures, while the heating and cooling demand and consumption is the energy consumed over a period (kWh). As illustrated, the cooling load is much higher than the heating load for this sample public building based on the Suzhou weather data of a typical meteorological year. As can be seen, the heating load is mainly distributed in December, January, February, and March, while the cooling load is mainly distributed from May to September. The higher cooling load is reasonable, since as a public building, activities occur during the daytime. In summer, the outdoor temperature can reach 37 °C during the daytime, while in winter the outdoor temperature can reach 10 °C during daytime. This result is in line with Ge et al. (2018) and Liu et al. (2022), who found that the hot and long summer demanding more cooling is a typical phenomenon in the HSCW climate region of China [26,39].
3.2. Energy Performance of the Sample Building and GB50189-2015 Baseline Model
For assessing the thermal and energy performance of the existing building envelope, a GB50189-2015 baseline model was created based on the sample building model using the baseline parameters of the external walls, roof, and windows indicated in GB50189-2015. The U-values of the external walls, roof, and external windows, and the SHGC of external windows of the sample building and baseline parameter are listed in Table 4. The sample building envelope has a poor thermal property compared with the baseline thermal properties indicated in GB50189-2015.
The annual energy performance of the GB50189-2015 model was simulated, keeping other input parameters unchanged. The annual simulation results of the sample building model and the GB50189-2015 model are listed in Table 5.
From the table, it can be seen that the sample building had a very high energy consumption; the total annual energy consumption for heating and cooling was 18.94% greater than the GB50189-2015 model. The annual heating load is 36.93% lower for the GB50189-2015 building model, and the annual cooling load of the GB50189-2015 building model is 16.68% lower than the sample building model. The peak load of heating and cooling for the model are both lower for the GB50189-2015 building model compared with the sample building. Therefore, using baseline parameters of energy efficiency standards for public building as a first step for energy retrofitting could effectively assess the energy performance of existing buildings.
4. Sensitivity Analysis of Parameters of Envelope for Energy Retrofitting
4.1. Sensitivity Analysis of External Wall
For the energy retrofitting of an existing building’s external walls, adding an insulation layer is widely accepted as a practical measure. For the sample building, there was no insulation layer in the existing external walls. The U-value for the main composite of the existing walls was 1.98 W/. The thermal performance of an external wall is highly affected by the U-value. The baseline parameter of external walls in GB90185-2015 is 0.80 W/ for the HSCW climate region. To identify the most suitable U-value of the external walls of the sample building, seven different U-values under the baseline value of GB90185-2015 were simulated for energy performance. When the U-value of the external walls was altered in the simulation program based on the GB50185-2015 model, all other parameters were kept unchanged.
The results shown in Table 6 and Figure 6 indicate that the GB50189-2015 baseline value could effectively reduce the heating and cooling demand of the sample building. When using lower U-values for external wall energy retrofitting, the total heating and cooling load is slightly lower than the GB50189-2015 baseline. Although energy demand for heating decreases, certain cooling demands increase. This is mainly because the lower U-value of the external walls keeps the heat gain inside the building from releasing to the outside through the external walls. To reach the set point of the air conditioner for keeping indoor thermal comfort, more cooling is needed when the inside air temperature is high. The lower U-value for external wall energy retrofitting therefore has an opposite impact on cooling. Considering the climate condition in China’s HSCW region and the global warming effect, the air temperature is increasing year by year [40]. Using a lower U-value for external wall energy retrofitting will not effectively help to reduce the energy demand for cooling in summer and transition seasons in the HSCW region. This issue could be remediated by using active energy retrofitting measures by installing efficient air conditioning and ventilation systems [41].
4.2. Sensitivity Analysis of Roof
The U-value of the main composites of the roof of the sample building was 0.7 W/), which is higher than the baseline roof value of 0.5 W/) provided by GB90185-2015 for the HSCW climate region, as shown in Table 3. To identify the most suitable U-value for the roof for the sample building model, six different U-values under the baseline parameter of GB90185-2015 were simulated for energy performance.
As an alternative measure, a green roof was selected as a retrofit measure in this study. The climate in the HSCW region is suitable for growing vegetation, and green roofs are widely recognized nowadays as providing many benefits for the environment [42,43]. The potential for energy saving using a green roof as the retrofit measure was examined through a thermal building simulation performed by the EnergyPlus engine in DesignBuilder using the “Ecoroof” module. This module defines “Green roof” using various parameters, including thickness, thermal conductivity, height of plants, leaf area index, and leaf reflectivity. In this study, Sedum was used as the green roof plant, and parameters were designed in DesignBuilder according to the “Shanghai Technical Specification for Green Roof (DB31/T493-2017)” [44]. The parameters of the green roof are listed in Table 7.
The results of the green roof simulation are shown in Table 8 and Figure 7. Using a lower U-value as a retrofit measure for the roof barely improved energy efficiency. The energy consumption for heating was slightly decreased by a lower U-value; however, energy use for cooling was slightly increased. There was a slight decrease in total heating and cooling demand but using a lower-U-value material for a roof as a retrofit measure was not an effective method.
Green roofs cause a higher reduction in the heating and cooling load for an existing roof, while slightly reducing the heating and cooling load compared with the GB50189-2015 baseline. He et al. (2020) revealed that a green roof not only reduces the heat flux but also reduces incident solar radiation and cooling through latent heat loss [43]. In addition, a green roof also provides thermal mass as insulation material, especially in winter, to stabilize the indoor temperature. In the hot season, roof insulation causes heat to continuously enter the building during the night, whereas a green roof effectively minimizes this phenomenon. Therefore, the energy performance of a building using a green roof as a retrofit measure is superior to using a thicker insulation layer. A green roof reduces both heating and cooling energy consumption as well as the heating and cooling peak load; it effectively reduces the heat gain in summer and heat loss in winter. As it also benefits the surrounding environment of a building. It is a good option as a retrofit measure for a roof in the HSCW climate region of China.
4.3. Sensitivity Analysis of External Windows
The existing external windows were 12 mm tempered single-layer glass, the U-value of which was 5.6 W/, as shown in Table 1. The insulation of the existing windows was higher than the baseline parameter of GB90185-2015, which is a U-value of 2.4 W/. To identify the most suitable U-value of a window for the sample building, five different U-values under the baseline parameters of GB90185-2015 were simulated for energy performance.
As expressed in Table 9 and Figure 8, using better insulation with a lower U-value for the energy retrofitting of external windows increases the heating and cooling demand, and in particular, the energy consumption for cooling. The energy demand for heating is reduced because of better insulation in the cold season. However, the lower U-values for windows has the added effect of increasing cooling demand in the cooling season. The lower U-value prevents the heat gain inside the building from being released to the outside through the windows. Intense solar radiation and hot temperatures in the cooling season causes overheating, since better window insulation keeps the heat inside. Hence, in this case, it is not suggested that excessively insulating materials with lower U-values be used as energy retrofitting measures for the windows.
Besides the U-value, the SHGC is a primary parameter for window energy performance. The lower the SHGC, the more solar radiation is blocked from the window. The SHGC of the existing external windows was 0.758, as shown in Table 1. To identify the most suitable SHGC value for the window energy retrofitting of the sample building, five different SHGC values under the baseline value of GB90185-2015 were simulated for energy performance when the SHGC of the windows was altered in the simulation program based on the GB50185-2015 baseline model (all other parameters remain unchanged).
As illustrated in Table 10 and Figure 9, the lower SHGC values reduce the total heating and cooling energy load. In particular, lower SHGC values effectively reduce the cooling demand in the hot season. A lower SHGC value for a window system indicates better shading performance. This reveals that in China’s HSCW climate region, shading is an effective window retrofit measure.
5. Results of the Optimized Building Model
The heating and cooling intensity of U-values for the external wall and the roof, and the U-value and SHGC values for the windows are given in Table 6, Table 8, Table 9 and Table 10, and are illustratively compared in Figure 10. From these results, it can be concluded that using lower SHGC values for the windows has the most influential impact for reducing total yearly heating and cooling demand in the HSCW region, compared to other measures, whereas using a lower U-value for the windows increases the total heating and cooling demand. The results also indicate that better insulation of the external walls and roof have little influence on total energy consumption.
The parameters which had better overall energy performance were used to create an optimized building model: a baseline U-value of 0.8 W/ was used for external wall retrofitting; the green roof was used for roof retrofitting; and a baseline U-value of 2.4 W/ and a lowest SHGC value of 0.1 were used for window retrofitting. The simulation results for the optimized building model are provided in Table 11.
As shown by the simulation results in Table 11, the annual heating load and the electricity intensity for heating of the optimized model are higher, while the cooling load and electricity intensity for cooling are lower than the GB50189-2015 model. The annual heating and cooling load of the optimized model was 11.49% lower than the GB50189-2015 baseline model, and 28.26% lower than the sample building. The peak load for both heating and cooling were lower in the optimized model.
6. Conclusions
This research provides energy retrofit optimization strategies for existing public buildings in China’s HSCW climate region through a case study. The public building used as a case study was in Suzhou, which is a typical city in China’s HSCW climate region. The sample building model and a corresponding standard GB50189-2015 baseline model were created using the simulation tool DesignBuilder. The thermal and energy performance of the envelope of the sample building was assessed using the standard GB50189-2015 baseline model. Based on this baseline model, the study adopted sensitivity analyses for the building envelope, including the U-value of external walls, the U-value of the roof, and U-value and SHGC value of external windows, to further assess the parameters and identify their significance in affecting the energy consumption for indoor space heating and cooling. In comparison with the sample building, the total energy use of the GB50189-2015 baseline model was 18.94% lower. The optimized parameters could reduce the heating and cooling load by 11.49% compared with the GB50189-2015 baseline model, and by 28.26% compared with the existing sample building. The following conclusions are drawn from this research.
For existing public buildings constructed before the implementation of the energy efficiency standard GB50189-2015, thermal properties and energy performance could effectively be assessed by using the baseline model of the energy efficiency standard. If an existing public building already meets the baseline value of the latest energy efficiency standard, further improvement of the insulation of external walls and the roof cause little energy reduction for heating and cooling. Hence, it is not recommended to consider installing insulation with a lower U-value as a retrofit measure for external walls and roofs. Instead of insulation, green roofs prove a better solution for energy retrofitting for a roof, as they reduce heat gain in summer and heat loss in winter. Using a lower SHGC value for windows could greatly reduce the energy consumption compared with other parameters of an envelope. Improved shading and lower SHGC values are the most effective measures for public building envelope energy retrofitting in China’s HSCW climate region.
The findings of this study could provide a valuable reference for local government and practitioners to improve energy efficiency when retrofitting existing public buildings in China’s HSCW climate region. The methodology of this research could also be adopted to investigate existing building energy retrofitting for other climate regions in China and around the world. Since lack of funds and high cost is one of the barriers for energy retrofit projects, the cost-effectiveness of retrofitting measures and the return rates could be analyzed in future studies. The embodied emissions caused by energy retrofitting could also be assessed to investigate the tradeoff between operational energy and embodied energy of a public building retrofit project.
Author Contributions
Conceptualization, C.L. and W.M.; data curation, C.L. and W.M.; funding acquisition, C.L. and J.LH.; methodology, W.M. and J.H.; resources, D.L.; supervision, C.L., J.H., J.Z. and C.Z.; writing—original draft, C.L. and W.M.; writing—review & editing, J.H., D.L., J.Z. and C.Z. All authors have read and agreed to the published version of the manuscript.
Funding
This research was supported by the National Natural Science Foundation of China (No. 51908393), the Key Disciplines of 14th Five-Year Plan of Jiangsu Province, and by the Urban & Environmental Studies University Research Center, Xi’an Jiaotong-Liverpool University.
Data Availability Statement
Data available on request from the corresponding author.
Conflicts of Interest
The authors declare that they have no known competing financial interest or personal relationships that could have appeared to influence the work reported in this paper.
References
- Nizam, R.S.; Zhang, C.; Tian, L. A BIM based tool for assessing embodied energy for buildings. Energy Build. 2018, 170, 1–14. [Google Scholar] [CrossRef]
- Zuo, J.; Pullen, S.; Rameezdeen, R.; Bennetts, H.; Wang, Y.; Mao, G.; Zhou, Z.; Du, H.; Duan, H. Green building evaluation from a life-cycle perspective in Australia: A critical review. Renew. Sustain. Energy Rev. 2017, 70, 358–368. [Google Scholar] [CrossRef]
- Xing, W.; Hao, J.L.; Ma, W.; Gong, G.; Nizami, A.; Song, Y. Energy performance of buildings using electrochromic smart windows with different window-wall ratios. J. Green Build. 2022, 17, 3–20. [Google Scholar] [CrossRef]
- Building Energy Research Center of Tsinghua University (BERC). Annual Report on China Building Energy Efficiency 2017; China Architecture & Building Press: Beijing, China, 2017. [Google Scholar]
- Hu, S.; Jiang, Y.; Yan, D. China Building Energy Use and Carbon Emission Yearbook 2021; China Architecture & Building Press: Beijing, China, 2021. [Google Scholar]
- Husin, S.; Zaki, N.; Husain, M. Implementing sustainability in existing building through retrofitting measures. Int. J. Civ. Eng. Technol. 2019, 10, 1450–1471. [Google Scholar]
- Ma, W.; Hao, J.L.; Zhang, C.; Di Sarno, L.; Mannis, A. Evaluating carbon emissions of China’s waste management strategies for building refurbishment projects: Contributing to a circular economy. Environ. Sci. Pollut. Res. 2022, 1–15. [Google Scholar] [CrossRef] [PubMed]
- Aksamija, A. Impact of retrofitting energy-efficient design strategies on energy use of existing commercial buildings: Comparative study of low-impact and deep retrofit strategies. J. Green Build. 2017, 12, 70–88. [Google Scholar] [CrossRef]
- Huo, H.; Xu, W.; Li, A.; Lv, Y.; Liu, C. Analysis and optimization of external Venetian blind shading for nearly zero-energy buildings in different climate regions of China. Sol. Energy 2021, 223, 54–71. [Google Scholar] [CrossRef]
- GB 50176-2016; Thermal Design Code for Civil Building. Ministry of Housing and Urban-Rural Development of the People’s Republic of China: Beijing, China, 2016.
- Liu, C.; Mohammadpourkarbasi, H.; Sharples, S. Evaluating the potential energy savings of retrofitting low-rise suburban dwellings towards the Passivhaus EnerPHit standard in a hot summer/cold winter region of China. Energe Build. 2021, 231, 110555. [Google Scholar] [CrossRef]
- Deng, Y.; Gou, Z.; Gui, X.; Cheng, B. Energy consumption characteristics and influential use behaviors in university dormitory buildings in China’s hot summer-cold winter climate region. J. Build. Eng. 2021, 33, 101870. [Google Scholar] [CrossRef]
- Ma, W.; Kim, M.K.; Hao, J.L. Numerical simulation modeling of a GSHP and WSHP system for an office building in the Hot Summer and Cold Winter Region of China: A Case Study in Suzhou. Sustainability 2019, 11, 3282. [Google Scholar] [CrossRef] [Green Version]
- Lee, E.S.; Pang, X.; McNeil, A.; Hoffmann, S.; Thanachareonkit, A.; Li, Z.; Ding, Y. Assessment of the Potential to Achieve very Low Energy Use in Public Buildings in China with Advanced Window and Shading Systems. Buildings 2015, 5, 668–699. [Google Scholar] [CrossRef]
- Gil-Baez, M.; Padura, Á.B.; Huelva, M.M. Passive actions in the building envelope to enhance sustainability of schools in a Mediterranean climate. Energy 2019, 167, 144–158. [Google Scholar] [CrossRef]
- Webb, A.L. Energy retrofits in historic and traditional buildings: A review of problems and methods. Renew. Sustain. Energy Rev. 2017, 77, 748–759. [Google Scholar] [CrossRef]
- Peng, C.; Huang, L.; Wan, B. Novel integrated design strategies for net-zero-energy solar buildings (NZESBS) in Nanjing, China. J. Green Build. 2015, 10, 89–115. [Google Scholar] [CrossRef]
- Aditya, L.; Mahlia, T.M.I.; Rismanchi, B.; Ng, H.M.; Hasan, M.H.; Metselaar, H.S.C.; Muraza, O.; Aditiya, H.B. A review on insulation materials for energy conservation in buildings. Renew. Sustain. Energy Rev. 2017, 73, 1352–1365. [Google Scholar] [CrossRef]
- Marinoski, D.L.; Güths, S.; Pereira, F.O.R.; Lamberts, R. Improvement of a measurement system for solar heat gain through fenestrations. Energe Build. 2007, 39, 478–487. [Google Scholar] [CrossRef]
- Kim, S.S.; Bae, M.J.; Kim, Y.D. Policies and Status of Window Design for Energy Efficient Buildings. Procedia Eng. 2016, 146, 155–157. [Google Scholar] [CrossRef] [Green Version]
- GB 50189-2005; Standard for Energy Efficiency Design of Public Buildings. Ministry of Housing and Urban-Rural Development of the People’s Republic of China: Beijing, China, 2005.
- Hong, T. A close look at the China Design Standard for Energy Efficiency of Public Buildings. Energe Build. 2009, 41, 426–435. [Google Scholar] [CrossRef]
- GB 50189-2015; Standard for Energy Efficiency Design of Public Buildings. Ministry of Housing and Urban-Rural Development of the People’s Republic of China: Beijing, China, 2015.
- Peng, C.; Wang, L.; Zhang, X. DeST-based dynamic simulation and energy efficiency retrofit analysis of commercial buildings in the hot summer/cold winter zone of China: A case in Nanjing. Energe Build. 2014, 78, 123–131. [Google Scholar] [CrossRef]
- Xu, P.; Shen, Y.; Chen, L.; Mao, J.; Chang, E.; Ji, Y. Assessment of energy-saving technologies retrofitted to existing public buildings in China. Energy Effic. 2016, 9, 67–94. [Google Scholar] [CrossRef]
- Ge, J.; Wu, J.; Chen, S.; Wu, J. Energy efficiency optimization strategies for university research buildings with hot summer and cold winter climate of China based on the adaptive thermal comfort. J. Build. Eng. 2018, 18, 321–330. [Google Scholar] [CrossRef]
- Li, Z.; Chow, D.H.; Yao, J.; Zheng, X.; Zhao, W. The effectiveness of adding horizontal greening and vertical greening to courtyard areas of existing buildings in the hot summer cold winter region of China: A case study for Ningbo. Energe Build. 2019, 196, 227–239. [Google Scholar] [CrossRef]
- Liu, C.; Sharples, S.; Mohammadpourkarbasi, H. Evaluating Insulation, Glazing and Airtightness Options for Passivhaus EnerPHit Retrofitting of a Dwelling in China’s Hot Summer–Cold Winter Climate Region. Energies 2021, 14, 6950. [Google Scholar] [CrossRef]
- GB 55015-2021; Standard for Building Energy Conservation and Renewable Energy Utilization. Ministry of Housing and Urban-Rural Development of the People’s Republic of China: Beijing, China, 2021.
- BesignBuilder v7. DesignBuilder Software Ltd. Available online: https://designbuilder.co.uk/ (accessed on 20 March 2020).
- Yang, W.; Fang, Y. Study on the energy conservation reformation of the existing university buildings in Hot Summer and Cold Winter climate zone. Zhejiang Constr. 2016, 33, 46–49. [Google Scholar]
- Jiang, H.; Yao, R.; Han, S.; Du, C.; Yu, W.; Chen, S.; Li, B.; Yu, H.; Li, N.; Peng, J. How do urban residents use energy for winter heating at home? A large-scale survey in the hot summer and cold winter climate zone in the Yangtze River region. Energe Build. 2020, 223, 110131. [Google Scholar] [CrossRef]
- U.S. Department of Energy (DOE). Engineering Reference. EnergyPlus Version 9.0.1 Documentation; U.S. DOE: Washington, DC, USA, 2018.
- Wang, Q.; Wang, J.; Cheng, Z. Implementation Guide for Green Building Assessment Standard for Existing Building Retrofitting; China Architecture and Building Press: Beijing, China, 2016; pp. 32–33. [Google Scholar]
- JGJ/T 449-2018; Standard for Green Performance Calculation of Civil Buildings. Ministry of Housing and Urban-Rural Development of the People’s Republic of China: Beijing, China, 2018.
- Carlsson, M.; Touchie, M.; Richman, R. Investigating the potential impact of a compartmentalization and ventilation system retrofit strategy on energy use in high-rise residential buildings. Energe Build. 2019, 199, 20–28. [Google Scholar] [CrossRef]
- Lee, J.; Shepley, M.M.; Choi, J. Exploring the effects of a building retrofit to improve energy performance and sustainability: A case study of Korean public buildings. J. Build. Eng. 2019, 25, 100822. [Google Scholar] [CrossRef]
- Meteonorm7.0. Available online: https://meteonorm.com/ (accessed on 25 May 2020).
- Liu, J.; Yang, X.; Liu, Z.; Zou, J.; Wu, Y.; Zhang, L.; Zhang, Y.; Xiao, H. Investigation and evaluation of building energy flexibility with energy storage system in hot summer and cold winter zones. J. Energy Storage 2022, 46, 103877. [Google Scholar] [CrossRef]
- Tran, C.N.; Tam, V.W.; Le, K.N.; Illankoon, I.M.C.S. Environmental impacts assessment for Australian buildings: Thermal resistance and environmental impacts relationship. Int. J. Constr. Manag. 2020, 1–18. [Google Scholar] [CrossRef]
- Hong, Y.; Ezeh, C.I.; Deng, W.; Hong, S.-H.; Peng, Z. Building Energy Retrofit Measures in Hot-Summer–Cold-Winter Climates: A Case Study in Shanghai. Energies 2019, 12, 3393. [Google Scholar] [CrossRef] [Green Version]
- Tam, V.W.; Wang, J.; Le, K.N. Thermal insulation and cost effectiveness of green-roof systems: An empirical study in Hong Kong. Build. Environ. 2016, 110, 46–54. [Google Scholar] [CrossRef]
- He, Y.; Yu, H.; Ozaki, A.; Dong, N. Thermal and energy performance of green roof and cool roof: A comparison study in Shanghai area. J. Clean. Prod. 2020, 267, 122205. [Google Scholar] [CrossRef]
- DB31/T493-2017; Technical Specification for Roof Greening. Shanghai Landscaping & City Appearance Administration Bureau: Shanghai, China, 2017.
Figure 1.
Sample building photo (author original).

Figure 2.
3D model of sample building created in DesignBuilder.

Figure 3.
Sample building first-floor layout in DesignBuilder.

Figure 4.
Suzhou’s typical meteorological-year temperatures.

Figure 5.
Monthly heating and cooling load of sample building.

Figure 6.
Electricity intensity for heating and cooling using different U-values for external wall energy retrofitting.
Figure 6.
Electricity intensity for heating and cooling using different U-values for external wall energy retrofitting.

Figure 7.
Electricity intensity for heating and cooling using different U-values for roof energy retrofitting.
Figure 7.
Electricity intensity for heating and cooling using different U-values for roof energy retrofitting.

Figure 8.
Electricity intensity for heating and cooling using different U-values for window energy retrofitting.
Figure 8.
Electricity intensity for heating and cooling using different U-values for window energy retrofitting.

Figure 9.
Electricity intensity for heating and cooling using different SHGC values for window energy retrofitting.
Figure 9.
Electricity intensity for heating and cooling using different SHGC values for window energy retrofitting.

Figure 10.
Comparison of the impact of U-value of external walls, U-value of roof, U-value of windows, and SHGC value of windows.
Figure 10.
Comparison of the impact of U-value of external walls, U-value of roof, U-value of windows, and SHGC value of windows.


Table 1.
Comparison of baseline values of building envelope thermal properties of GB50189-2005 and GB50189-2015.
Table 1.
Comparison of baseline values of building envelope thermal properties of GB50189-2005 and GB50189-2015.
| GB50189-2005 | GB50189-2015 | ||||
|---|---|---|---|---|---|
| U-Value | SHGC (East, South, West/North) | U-Value | SHGC (East, South, West/North) | ||
| External wall | ≤1.0 | ≤0.80 | |||
| Roof | ≤0.70 | ≤0.50 | |||
| Floor | ≤1.0 | ≤0.70 | |||
| Single façade window to wall ratio (including transparent curtain wall) (SWWR) | SWWR ≤ 0.20 | ≤4.7 | ≤3.5 | ||
| 0.20 ˂ SWWR ≤ 0.30 | ≤3.5 | ≤0.48 | ≤3.0 | ≤0.44/0.48 | |
| 0.30 ˂ SWWR ≤ 0.40 | ≤3.0 | ≤0.44/0.52 | ≤2.6 | ≤0.40/0.44 | |
| 0.40 ˂ SWWR ≤ 0.50 | ≤2.8 | ≤0.39/0.48 | ≤2.4 | ≤0.35/0.40 | |
| 0.50 ˂ SWWR ≤ 0.60 | ≤2.5 | ≤0.35/0.44 | ≤2.2 | ≤0.35/0.40 | |
| 0.60 ˂ SWWR ≤ 0.70 | ≤2.5 | ≤0.35/0.44 | ≤2.2 | ≤0.30/0.35 | |
| 0.70 ˂ SWWR ≤ 0.80 | ≤2.0 | ≤0.26/0.30 | |||
| SWWR ˃ 0.80 | ≤1.8 | ≤0.24/0.30 | |||
Table 2.
Composition of main building envelope and thermal properties.
| Envelope | Material | Thickness [mm] | SHGC | |
|---|---|---|---|---|
| External wall | outermost layer: cement plaster | 20 | 1.98 | |
| middle layer: hollow brick | 240 | |||
| innermost layer: cement plaster | 20 | |||
| Roof | concrete protection layer | 40 | 0.7 | |
| waterproof layer: EPDM | 1.2 | |||
| thermal insulation layer: XPS extruded polystyrene | 35 | |||
| cement plaster | 20 | |||
| levelling layer: concrete | 20 | |||
| structure layer: reinforced concrete | 120 | |||
| External windows | tempered glass | 12 | 5.6 | 0.758 |
| aluminum frame | - |
Table 3.
Main functional zone design parameters of conditioned areas.
| Classroom | Office | Lecture Theatre | Computer Lab. | Meeting Room | |
|---|---|---|---|---|---|
| Light power density (W/m2) | 9 | 9 | 9 | 9 | 9 |
| Electrical device density (W/m2) | 5 | 15 | 5 | 15 | 15 |
| Cooling setpoint (°C) | 26 | 26 | 26 | 26 | 26 |
| Heating setpoint (°C) | 18 | 18 | 18 | 18 | 18 |
| Personal occupancy density (m2/person) | 1.39 | 8 | 2.5 | 4 | 2.5 |
| Fresh air (/h person) | 24 | 30 | 14 | 20 | 14 |
| Operational schedule (workday) | 7:00–19:00 | 7:00–19:00 | 7:00–19:00 | 7:00–19:00 | 7:00–19:00 |
Note: The parameters are adapted from GB50189-2015 and JGJ/T 449-2018.
Table 4.
Thermal properties of the sample building and GB50189-2015 model.
| Envelope | Sample Building Model | GB50189-2015 Model | ||
|---|---|---|---|---|
| SHGC | SHGC | |||
| External wall | 1.98 | 0.80 | ||
| Roof | 0.70 | 0.50 | ||
| External window | 5.6 | 0.758 | 2.4 | 0.35 |
Table 5.
Comparison of the simulation results of the sample building model with the GB50189-2015 model.
Table 5.
Comparison of the simulation results of the sample building model with the GB50189-2015 model.
| Sample Building Model | GB50189-2015 Model | ||
|---|---|---|---|
| Annual heating load | 255,218.48 | 160,956.88 | kWh |
| Annual cooling load | 2,025,823.74 | 1,687,943.93 | kWh |
| Total annual heating and cooling load | 2,281,042.22 | 1,848,900.81 | kWh |
| Peak load of heating | 2410.738 | 1594.73 | kW |
| Peak load of cooling | 3253.009 | 2634.2 | kW |
| Electricity intensity for heating | 8.98 | 5.69 | kWh/ |
| Electricity intensity for cooling | 71.26 | 59.64 | kWh/ |
| Electricity intensity for heating and cooling | 80.24 | 65.33 | kWh/ |
Table 6.
Energy simulation results of using different U-values for external wall energy retrofitting.
Table 6.
Energy simulation results of using different U-values for external wall energy retrofitting.
| Electricity Intensity for Heating (kWh/m2) | Electricity Intensity for Cooling (kWh/m2) | |||
|---|---|---|---|---|
| Existing external wall | 1.98 | 8.98 | 71.26 | 80.24 |
| GB90185-2015 baseline | 0.80 | 5.69 | 59.64 | 65.33 |
| 0.7 | 5.41 | 59.78 | 65.19 | |
| 0.6 | 5.13 | 59.93 | 65.06 | |
| 0.5 | 4.86 | 60.09 | 64.95 | |
| 0.4 | 4.58 | 60.22 | 64.8 | |
| 0.3 | 4.31 | 60.4 | 64.71 | |
| 0.2 | 4.03 | 60.6 | 64.63 |
Table 7.
Green roof parameters.
| Properties | Value |
|---|---|
| Height of plants | 0.3 |
| Leaf area index (LAI) | 3 |
| Leaf reflectivity | 0.19 |
| Leaf emissivity | 0.97 |
| Minimum stomatal resistance (s/m) | 120 |
| Max volumetric moisture content at saturation | 0.5 |
| Min residual volumetric moisture content | 0.01 |
| Initial volumetric moisture content | 0.15 |
| Thermal conductivity of thermal bulk (W/m | 0.4 |
Table 8.
Energy simulation results of using different U-values and green roof energy retrofitting.
| U-Value | ||||
|---|---|---|---|---|
| Existing Roof | 0.7 | 8.98 | 71.26 | 80.24 |
| GB90185-2015 baseline | 0.5 | 5.69 | 59.64 | 65.33 |
| 0.4 | 5.55 | 59.64 | 65.19 | |
| 0.3 | 5.42 | 59.65 | 65.07 | |
| 0.2 | 5.28 | 59.69 | 64.97 | |
| 0.1 | 5.15 | 59.71 | 64.86 | |
| Green roof | / | 5.5 | 59 | 64.5 |
Table 9.
Simulation results of different U-values for window energy retrofitting.
| U-Value | ||||
|---|---|---|---|---|
| Existing external windows | 5.6 | 8.98 | 71.26 | 80.24 |
| GB90185-2015 baseline | 2.4 | 5.69 | 59.64 | 65.33 |
| 2 | 5.05 | 60.31 | 65.36 | |
| 1.5 | 4.01 | 62.36 | 66.37 | |
| 1 | 3.05 | 64.31 | 67.36 | |
| 0.5 | 2.21 | 65.77 | 67.98 | |
| 0.1 | 1.57 | 67.13 | 68.7 |
Table 10.
Energy simulation results of using different SHGC values for window energy retrofitting.
| SHGC | ||||
|---|---|---|---|---|
| Existing external windows | 0.758 | 8.98 | 71.26 | 80.24 |
| GB90185-2015 baseline | 0.35 | 5.69 | 59.64 | 65.33 |
| 0.3 | 6.16 | 57.58 | 63.74 | |
| 0.25 | 6.28 | 57.12 | 63.4 | |
| 0.2 | 6.8 | 54.99 | 61.79 | |
| 0.15 | 7.36 | 52.81 | 60.17 | |
| 0.1 | 7.99 | 50.59 | 58.58 |
Table 11.
Annual energy performance of the sample building model, the GB50189-2015 model, and the optimized model.
Table 11.
Annual energy performance of the sample building model, the GB50189-2015 model, and the optimized model.
| Sample Building Model | GB50189-2015 Model | Optimized Model | ||
|---|---|---|---|---|
| Annual heating load | kWh | 255,218.48 | 160,956.88 | 224,525.29 |
| Annual cooling load | kWh | 2,025,823.74 | 1,687,943.93 | 1,412,004.06 |
| Total annual heating and cooling load | kWh | 2,281,042.22 | 1,848,900.81 | 1,636,529.35 |
| Peak load of heating | kW | 2410.738 | 1594.73 | 1591.06 |
| Peak load of cooling | kW | 3253.009 | 2634.2 | 2378.51 |
| Electricity intensity for heating | kWh/ | 8.98 | 5.69 | 7.93 |
| Electricity intensity for cooling | kWh/ | 71.26 | 59.64 | 48.79 |
| Electricity intensity for heating and cooling | kWh/ | 80.24 | 65.33 | 56.72 |
Publisher’s Note: MDPI stays neutral with regard to jurisdictional claims in published maps and institutional affiliations. |
© 2022 by the authors. Licensee MDPI, Basel, Switzerland. This article is an open access article distributed under the terms and conditions of the Creative Commons Attribution (CC BY) license (https://creativecommons.org/licenses/by/4.0/).
Share and Cite
MDPI and ACS Style
Liu, C.; Ma, W.; Hao, J.; Luo, D.; Zuo, J.; Zhang, C. Energy Retrofitting Assessment of Public Building Envelopes in China’s Hot Summer and Cold Winter Climate Region. Buildings 2022, 12, 1866. https://doi.org/10.3390/buildings12111866
AMA Style
Liu C, Ma W, Hao J, Luo D, Zuo J, Zhang C. Energy Retrofitting Assessment of Public Building Envelopes in China’s Hot Summer and Cold Winter Climate Region. Buildings. 2022; 12(11):1866. https://doi.org/10.3390/buildings12111866
Chicago/Turabian StyleLiu, Changchun, Wenting Ma, Jianli Hao, Daiwei Luo, Jian Zuo, and Cheng Zhang. 2022. "Energy Retrofitting Assessment of Public Building Envelopes in China’s Hot Summer and Cold Winter Climate Region" Buildings 12, no. 11: 1866. https://doi.org/10.3390/buildings12111866
Note that from the first issue of 2016, this journal uses article numbers instead of page numbers. See further details here.