Article

Displacement Demand for Nonlinear Static Analyses of Masonry Structures: Critical Review and Improved Formulations

by
Gabriele Guerrini
1,2,*,
Stylianos Kallioras
1,2,
Stefano Bracchi
1,2,
Francesco Graziotti
1,2 and
Andrea Penna
1,2
1
Department of Civil Engineering and Architecture (DICAr), University of Pavia, Via Ferrata 3, 27100 Pavia, PV, Italy
2
European Centre for Training and Research in Earthquake Engineering (EUCENTRE), Via Ferrata 1, 27100, Pavia PV, Italy
*
Author to whom correspondence should be addressed.
Buildings 2021, 11(3), 118; https://doi.org/10.3390/buildings11030118
Submission received: 15 February 2021 / Revised: 5 March 2021 / Accepted: 9 March 2021 / Published: 16 March 2021
(This article belongs to the Special Issue Seismic Performance Assessment of Buildings)

Abstract

:
This paper discusses different formulations for calculating earthquake-induced displacement demands to be associated with nonlinear static analysis procedures for the assessment of masonry structures. Focus is placed on systems with fundamental periods between 0.1 and 0.5 s, for which the inelastic displacement amplification is usually more pronounced. The accuracy of the predictive equations is assessed based on the results from nonlinear time-history analyses, carried out on single-degree-of-freedom oscillators with hysteretic force–displacement relationships representative of masonry structures. First, the study demonstrates some limitations of two established approaches based on the equivalent linearization concept: the capacity spectrum method of the Dutch guidelines NPR 9998-18, and its version outlined in FEMA 440, both of which overpredict maximum displacements. Two codified formulations relying on inelastic displacement spectra are also evaluated, namely the N2 method of Eurocode 8 and the displacement coefficient method of ASCE 41-17: the former proves to be significantly unconservative, while the latter is affected by excessive dispersion. A non-iterative procedure, using an equivalent linear system with calibrated optimal stiffness and equivalent viscous damping, is then proposed to overcome some of the problems identified earlier. A recently developed modified N2 formulation is shown to improve accuracy while limiting the dispersion of the predictions.

1. Introduction

Nonlinear static procedures (NSPs) have gained popularity in the professional practice for the seismic performance assessment of existing masonry structures. In fact, they can provide good predictions of local and global earthquake-induced deformations directly related to structural and non-structural damage [1]. At the same time, NSPs are not affected by some of the hurdles of nonlinear time-history analyses (NLTHA), namely the definition of cyclic constitutive models, the adoption of viscous damping models, and the selection of representative ground motions. Various NSPs require determining first the capacity curve of a single-degree-of-freedom (SDOF) oscillator, equivalent to the multi-degree-of-freedom (MDOF) structure, through pushover analyses [2,3,4,5,6,7,8]. It is then necessary to determine the inelastic displacement demands on the SDOF system due to certain seismic hazards and compare them with displacement thresholds identified on the capacity curve, corresponding to meaningful limit states. Over recent decades, several methods have been developed for the evaluation of the displacement demands, which can be classified into two main families and form the object of this study.
The first family includes methods based on the concept of an “equivalent linear system”. The seismic demand on a nonlinear structure is estimated using overdamped elastic spectra and a substitute linear-elastic SDOF system, with reduced effective stiffness and equivalent viscous damping to account for the effects of period elongation and hysteretic energy dissipation due to yielding [9,10,11,12]. With these techniques, one generally achieves a solution through an iterative process. The “capacity spectrum method”, initially proposed by Freeman et al. [13] and documented thoroughly in the American ATC-40 and FEMA 274 guidelines [14,15], is the most prominent example of these analysis procedures. The method has been recently revamped in the Italian building code NTC-18 [16,17], in the Dutch NPR 9998-18 [18] derived from the New Zealand code for the seismic assessment of existing buildings [19], and in some displacement-based procedures [20,21]. Modified versions of this approach have been proposed in the FEMA 440 guidelines [22] and other seismic assessment procedures.
Methods that employ inelastic response spectra, referring to the initial elastic stiffness and viscous damping of a first-mode-equivalent SDOF oscillator, belong to the second family. Pioneer studies in the development of such approaches were conducted in the 1960s [23,24], illustrating the “equal displacement rule” for medium and long-period systems and the significant amplification of displacement demands for inelastic systems in the short-period range. During the following decades, several researchers confirmed these observations and addressed the influence of oscillators relative strength, hysteretic rules, supplemental viscous damping, P-Δ effects, soil conditions, and ground motion characteristics on constant-ductility or constant-relative-strength inelastic response spectra [1,25,26,27,28,29,30]. Some of these efforts led to the development of the so-called “N2 method” [31,32,33,34], included in Eurocode 8 [35] and the Italian building code NTC-18 [16,17], and of the “displacement coefficient method” of FEMA 273 and FEMA 274 guidelines [15,36], adopted by the ASCE 41-17 code [37].
Recently, criticism has been raised against the first family of methods because of accuracy issues, convergence issues, and lack of mechanical correlation between viscous damping and hysteretic energy dissipation [4,38,39,40,41,42]. Nevertheless, building codes worldwide still include formulations based on the equivalent linear system concept. Moreover, inelastic displacement demands depend on the oscillator hysteretic behavior, being generally larger for less dissipative systems with shorter elastic periods [26,38,42]. However, current building codes propose NSP formulations that do not address this hysteresis dependence but give only explicit consideration of structural period and ductility. Research has been conducted in recent years to optimize methods belonging to the second family [43,44,45,46]. Applications of NSP to probabilistic seismic assessment and urban-scale risk evaluation have also been proposed [47,48,49]. Statistics-based, rather than mechanics-based approaches, such as those relying on surrogate models, could also be employed to calibrate these relationships, as has been done for other engineering applications [50].
For these reasons, this paper first discusses the accuracy of two established methods per family to calculate the inelastic seismic displacement demand on short-period masonry buildings, highlighting their shortcomings. Then, it presents an improved formulation for each family, the “optimal stiffness method” and the “modified N2 method” [44], respectively, which account for the typical hysteretic dissipation of masonry structures. The assessment and calibration of the predictive equations are based on the results from extensive NLTHA on nonlinear SDOF oscillators, with fundamental periods ranging from 0.05 to 0.5 s and hysteretic behavior representative of masonry structures, performed with TREMURI [51,52]. Two independent databases of real earthquake records were used, as well as two sets of oscillators. A total number of 3,434,900 analyses supported the evaluation and calibration processes.

2. Evaluation and Calibration with Nonlinear Time-History Analyses

2.1. Nonlinear SDOF Oscillators

A large number of NLTHA was performed on inelastic SDOF oscillators, covering a comprehensive range of structural parameters representative of masonry buildings as detailed in previous work by the authors [44,53,54]. The oscillators were analyzed in TREMURI [51,52]: this software allows modeling structures through macroelements with constitutive relationships compatible with masonry in-plane flexural and shear behavior. The monotonic acceleration-displacement (AD) response of each oscillator, obtained from the software, was idealized into a bilinear elastoplastic relationship (Figure 1a). The idealized elastic stiffness, k , was first established as the slope of the secant line through 70% of the maximum base shear. Then, the idealized yield pseudo-acceleration, a y , and displacement, d y , were calculated by equating the areas below the curves between the origin and the ultimate displacement, d u , identified at a base-shear drop equal to 20% of the maximum strength [16,17]. The idealized elastic period was determined as T = 2 π m / k , where m was the mass associated with each SDOF system.
The displacement ductility demand, μ , the strength ratio, R (also termed force-reduction factor, response-modification factor, or behavior factor), and the inelastic displacement ratio C were defined on the elastoplastic backbone curve as follows Equations (1)–(3):
μ = d m a x d y
R = a e a y = d e d y
C = d m a x d e
where d m a x is the maximum inelastic displacement demand, d e = a e · ( 2 π / T ) 2 is the elastic displacement demand, and a e ( T ) is the elastic pseudo-spectral acceleration for idealized elastic period T and 5% viscous damping ratio. The following relationship between μ , R , and C can be derived from Equation (1) through Equation (3):
μ = R · C
meaning that for a given R one can determine C by calculating μ or, conversely, for a given μ , one can determine C by calculating R . In what follows, the symbols μ R and C R will denote the ductility demand and inelastic displacement ratio for a given R , as opposed to R μ and C μ , which would indicate the strength ratio and inelastic displacement ratio for a given μ .
Two sets of target SDOF oscillators were defined, starting from seven hysteretic reference models with Jacobsen’s equivalent viscous damping ratio, ξ h y s t , between 13.8% and 19.9%, and targeting ten different idealized elastic periods T between 0.05 and 0.5 s [44,54]. The first set of oscillators (Set 1) was then generated assuming ten values of the idealized yield strength a y between 0.5 and 5.0 m/s2, resulting in 700 oscillators employed to evaluate current formulations and calibrate new equations. The second set of SDOF systems (Set 2) was instead obtained considering five values of strength ratio R between 1.0 and 5.0, resulting in a group of 350 oscillators used to determine C R R   T and μ R R   T relationships.

2.2. Ground Motion Records and Response Spectra

Two databases of earthquake records were selected to conduct NLTHA. The first group (Database A) included 467 pairs of accelerograms from the third release of the SIMBAD database [55]. The second group (Database B) comprised 1753 pairs of records [56], combining tectonic ground motions from the NGA1 [57] and the RESORCE [58] databases with induced-seismicity motions from the Groningen gas field [59]. Both databases cover wide ranges of site conditions and seismological parameters.
The actual elastic response spectra of the signals were approximated by Newmark-Hall’s spectral shapes [25,44] (Figure 1b). The approximated spectra were anchored to the actual peak ground acceleration (PGA) of the records. A least-square regression was performed on each pseudo-acceleration spectrum within the period range between 0 and 4.0 s to select parameter F 0 , which quantifies the plateau acceleration as a multiple of PGA, and corner period T C , which identifies the transition from the constant-acceleration to the constant-velocity branch of the idealized spectrum. Elastic displacement spectra were derived from the Newmark-Hall pseudo-acceleration spectra, multiplying each ordinate by ( 2 π / T ) 2 . Figure 1b shows an example of actual and approximated elastic response spectrum in AD format.
Each SDOF oscillator from Set 1 was subjected to the records of both databases, resulting in 653,800 (Suite 1-A) and 2,454,200 (Suite 1-B) earthquake simulations using Database A and Database B, respectively. Both suites of simulations were used to evaluate current approaches, while Suite 1-A served for the calibration of new equations and Suite 1-B for their validation. Instead, the oscillators of Set 2 were analyzed only with the ground motions of Database A, resulting in additional 326,900 simulations (Suite 2-A), which were employed to produce constant-relative-strength inelastic response spectra. A total number of 3,434,900 analyses formed the basis of this study.

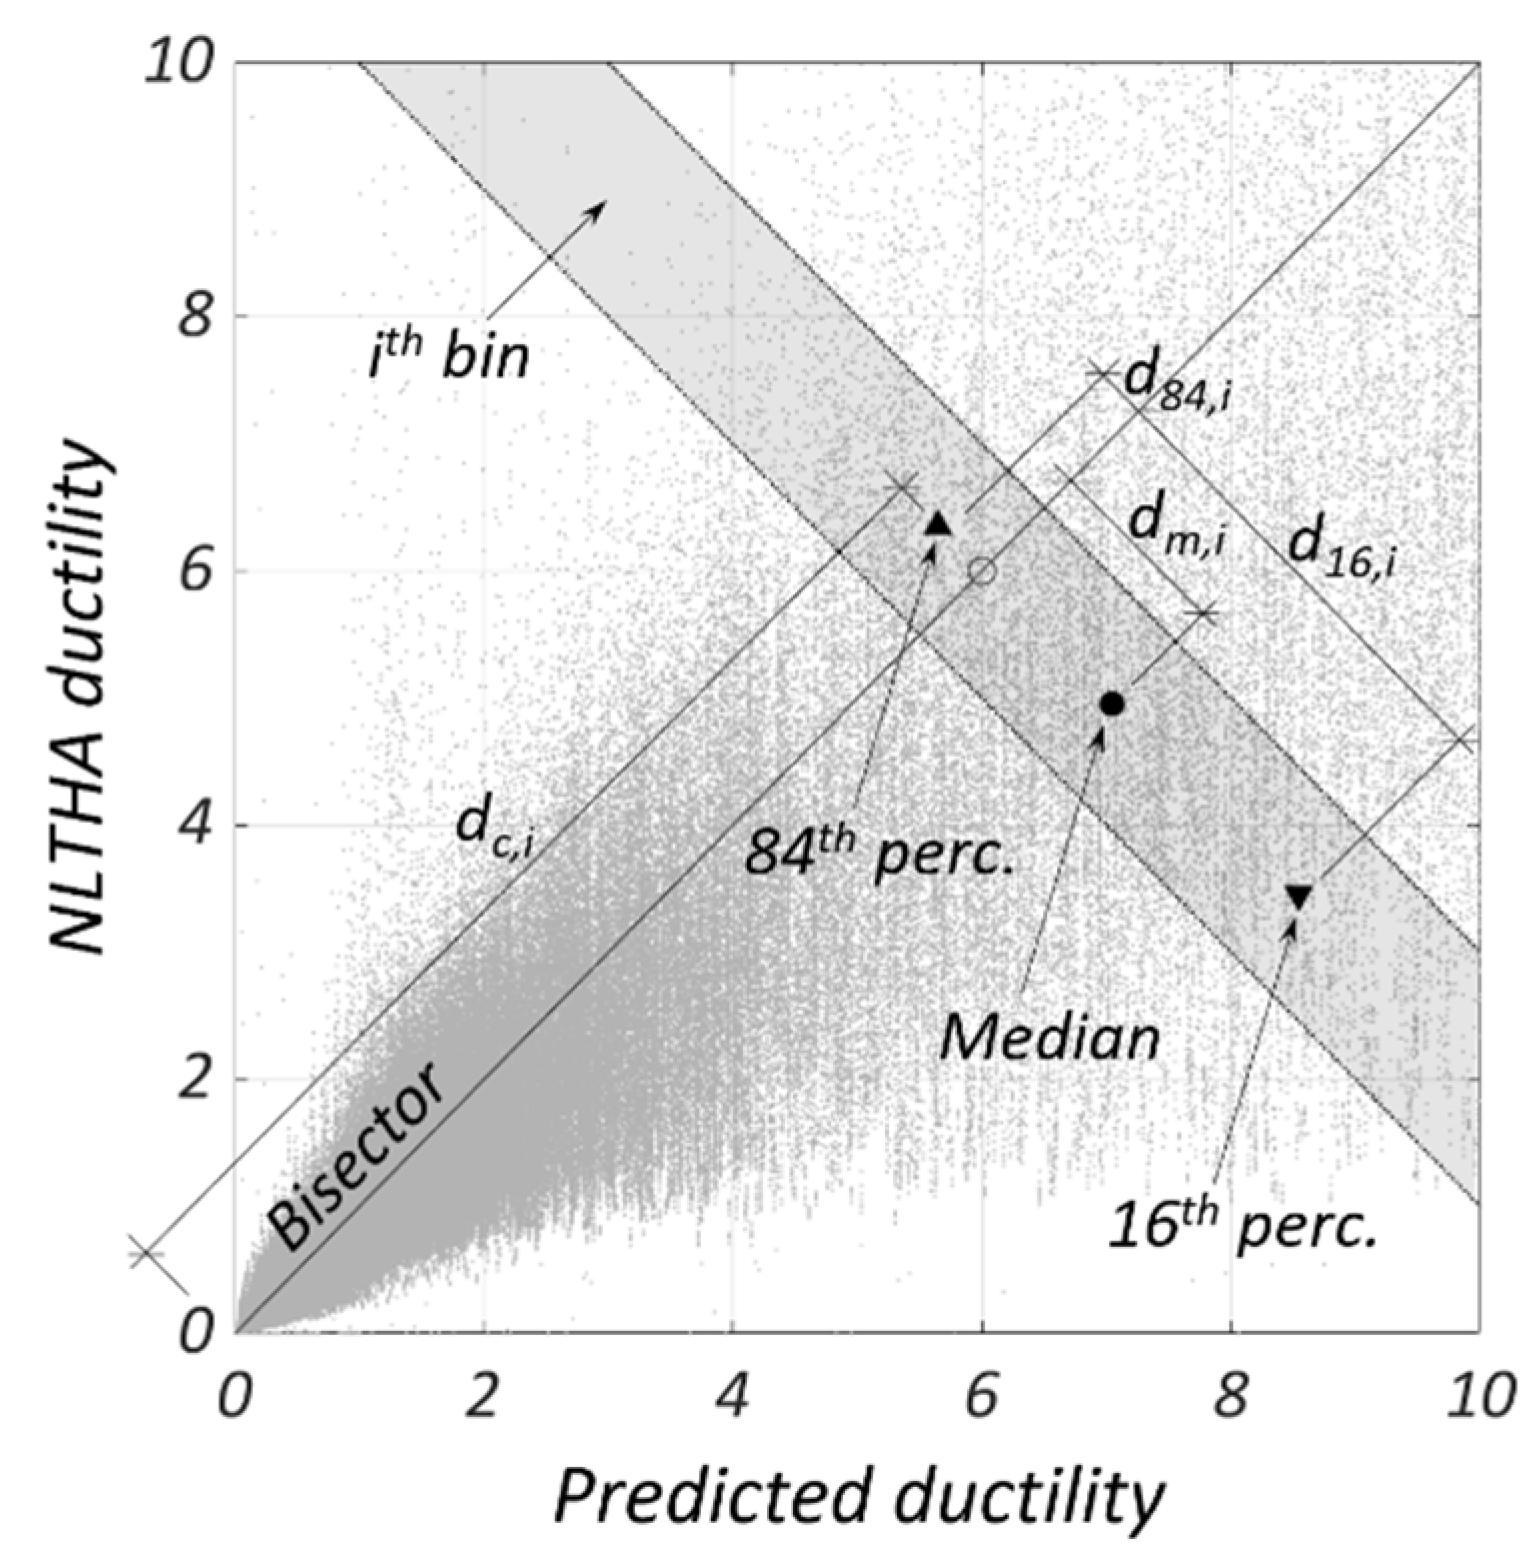
2.3. Evaluation and Calibration Procedures

Statistical analysis was performed with MATLAB (MathWorks, version R2019a) considering pairs of equation-predicted and NLTHA ductility demands obtained from Suite 1-A or Suite 1-B analyses, represented by gray dots in Figure 2 [44]. The points were assigned to diagonal bins, with boundaries orthogonal to the bisector of the first quadrant. The median distance from the bisector d m , i , the 16th percentile distance d 16 , i , and the 84th percentile distance d 84 , i were calculated for the data points within the ith bin; points for these percentiles were determined for each bin, associating those distances with the bin central value, as plotted in Figure 2. Similarly, the points corresponding to the 5th and 95th percentile were also determined. Median, 5th, 16th, 84th, and 95th percentile lines were then drawn by connecting these points.
Parameters of the proposed equations were calibrated with the dynamic responses from Suite 1-A, applying an orthogonal regression between the predictions and the results of NLTHA to minimize the error on the median and the scatter (i.e., the 16th and 84th percentiles) by diagonal bins [44]. The accuracy of the calibrated equations was then evaluated following the same approach based on Suite 1-B analysis results.
The evaluation and calibration procedures by diagonal bins were limited to displacement ductility demands up to 10, considered as a limit value for most structures to which these methods would be applied. Ideally, an accurate and precise method would result in the median line coinciding with the bisector, with upper and lower percentiles as close as possible to it. Due to the high rate of divergence towards the infinity of the ductility demand from both NLTHA and predictions, it was not possible to obtain meaningful results for oscillators with periods of 0.05 s, which were consequently excluded from the statistical analysis [44].
The NLTHA results from Suite 2-A were instead used to determine C R R T and μ R R   T relationships, calculating for each idealized period T and strength ratio R the median values of inelastic displacement ratio C R and ductility μ R . In this case, also ductility demands greater than 10 were included in the determination of the median values.

3. Established Formulations Based on Equivalent Linearization

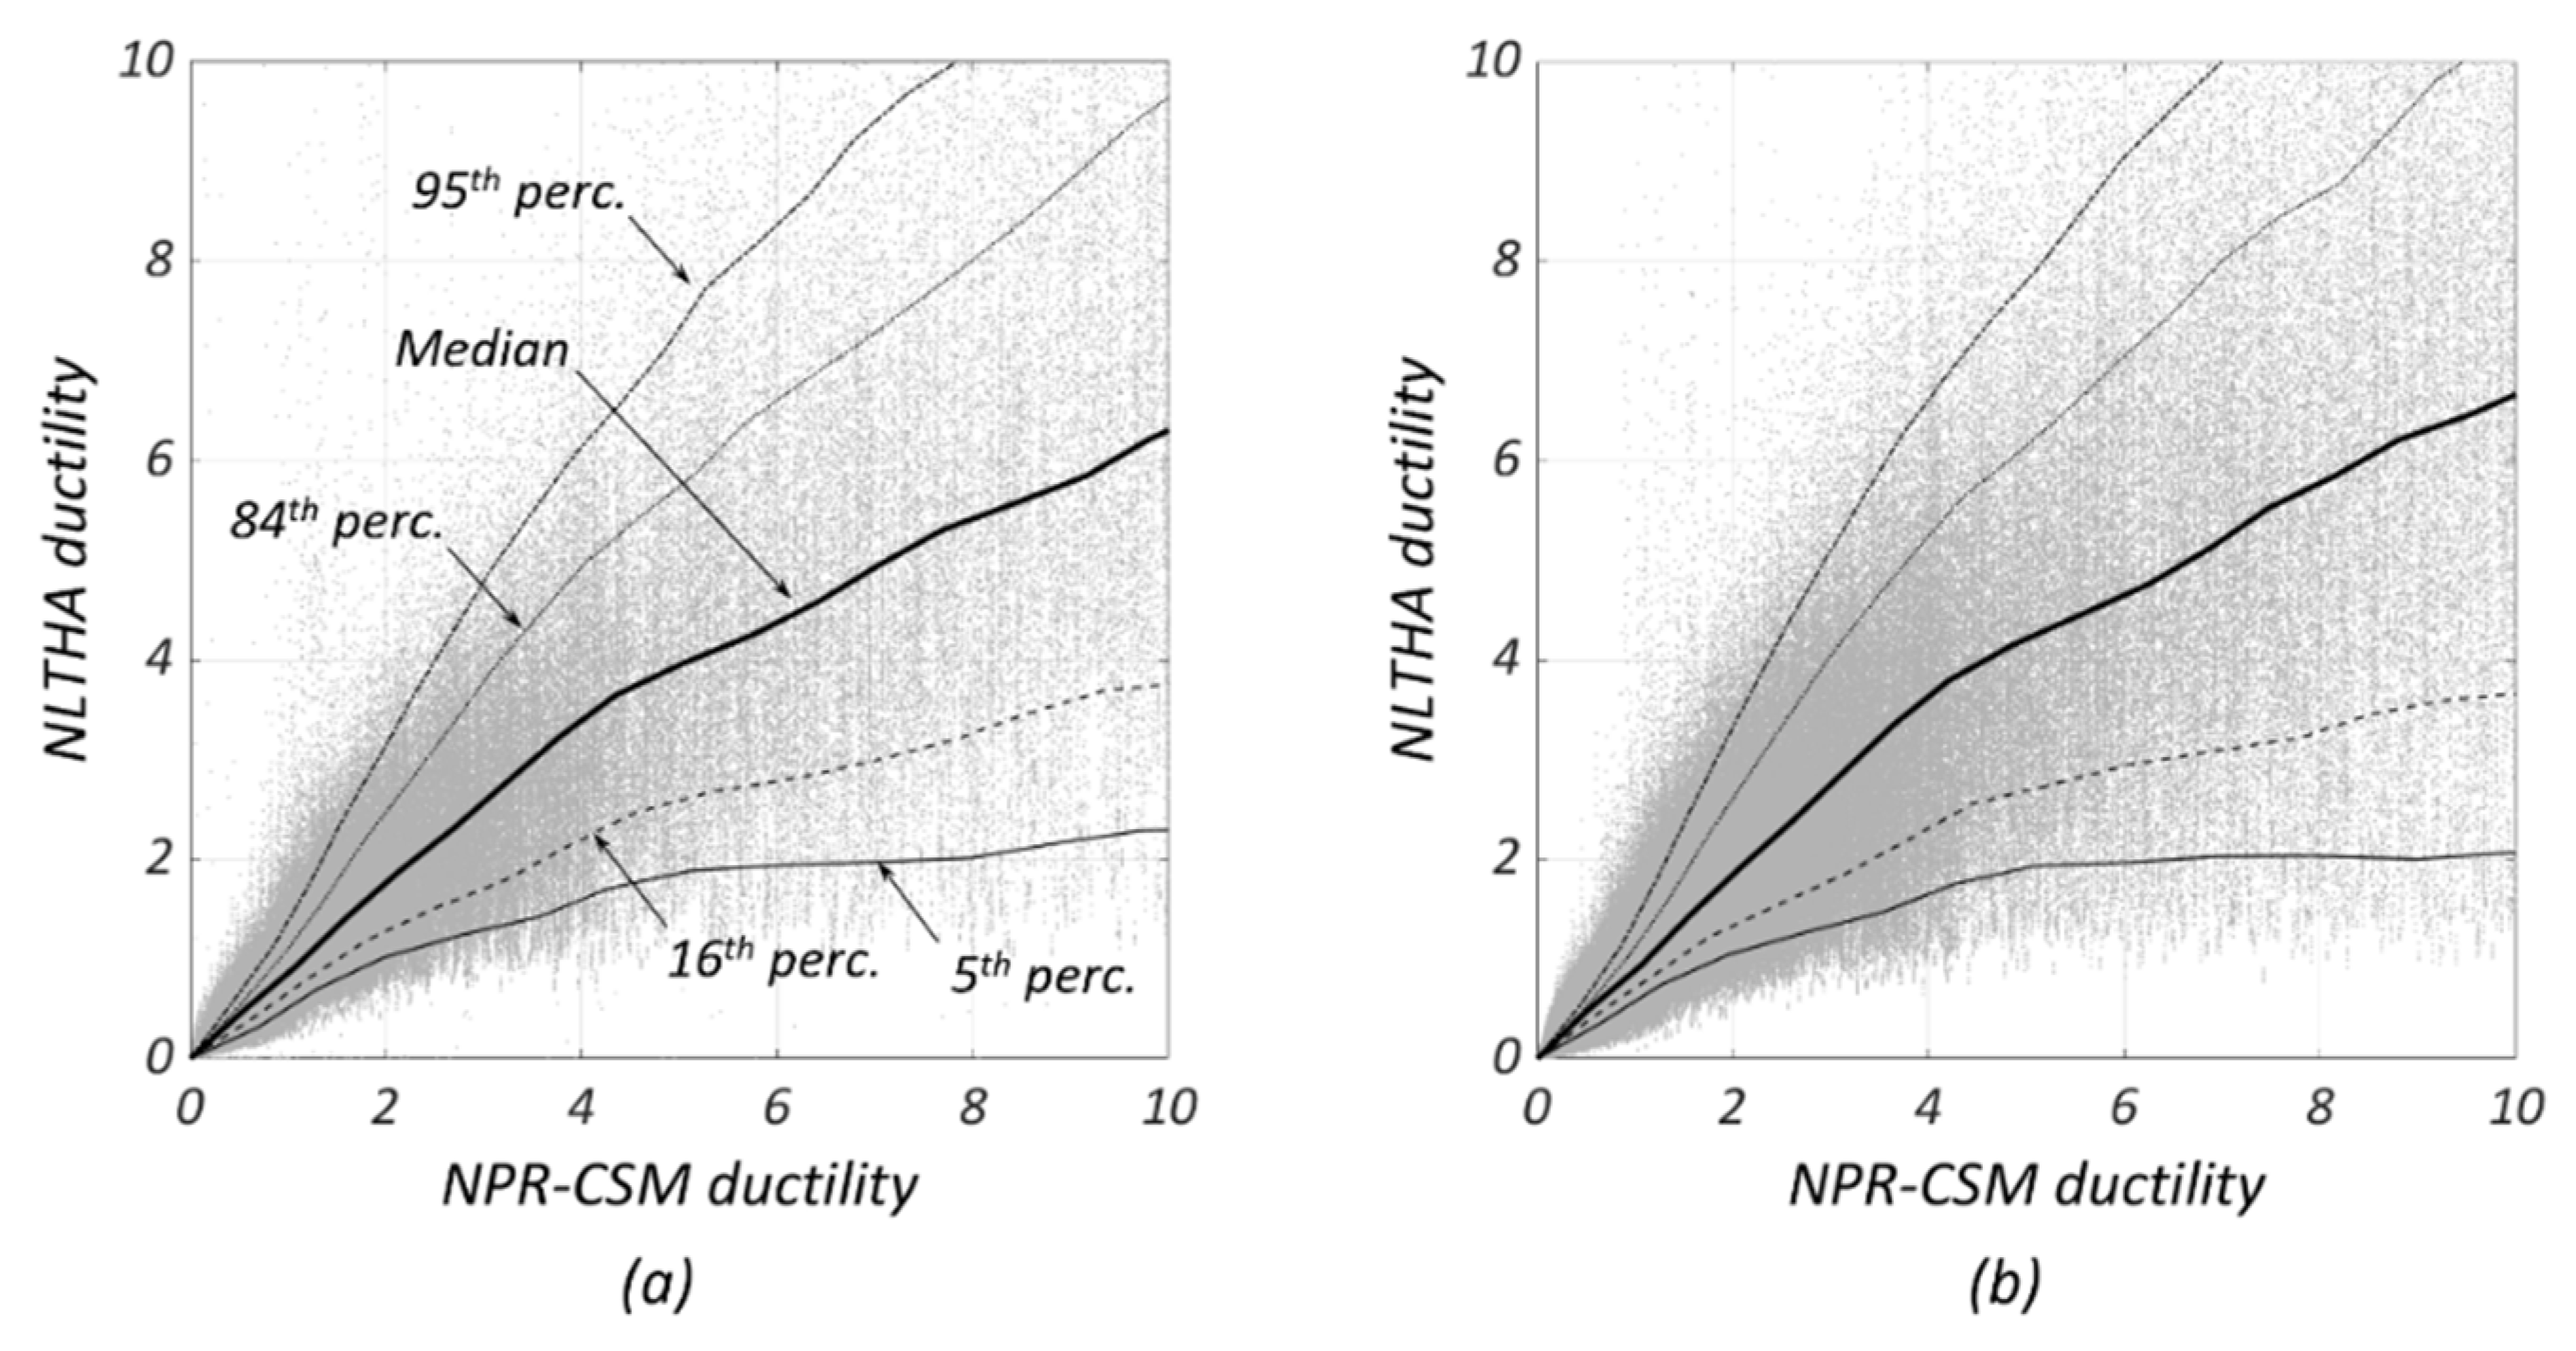
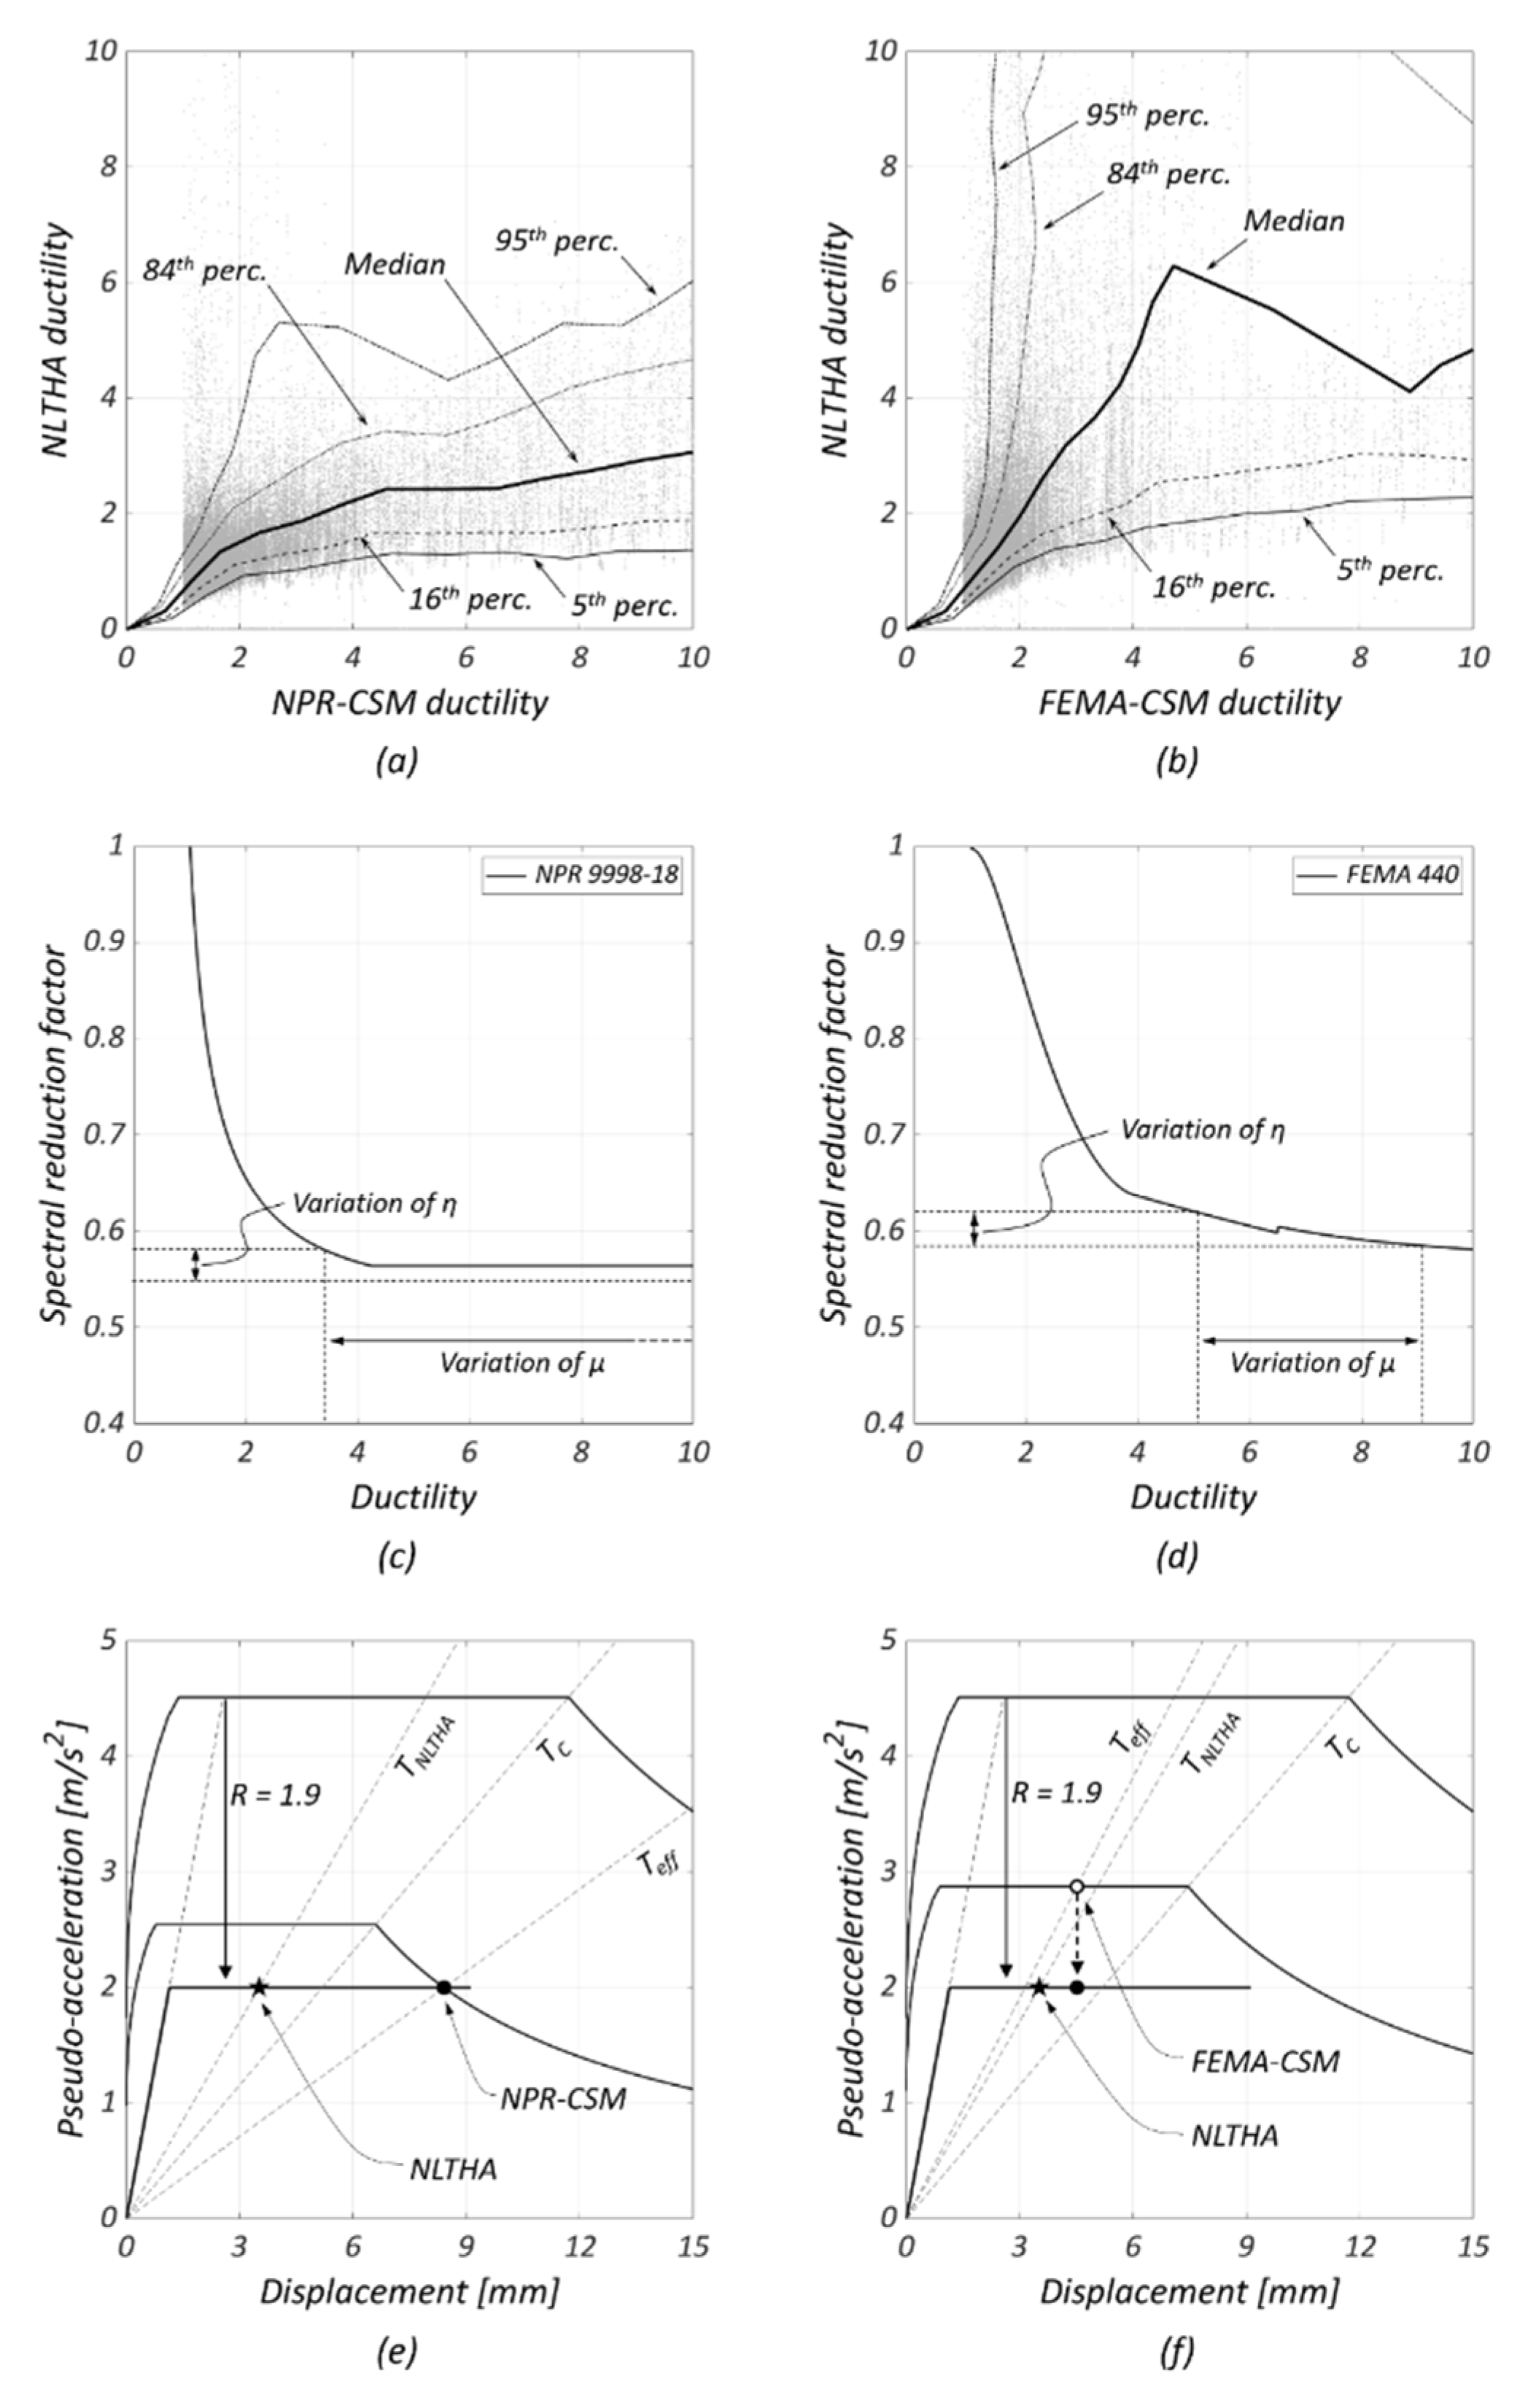
3.1. Capacity Spectrum Method (NPR 9998-18)

The capacity spectrum method (CSM) was initially adopted by the ATC-40 guidelines [14] for the seismic evaluation of existing concrete buildings. The same version of the method has been proposed by the 2018 edition of the Italian building code NTC-18 [16,17] as one of the two available methods to estimate displacement demands. Recently, the CSM has also been adopted as the preferred method for the nonlinear static analysis of masonry buildings by the Dutch code NPR 9998-18 [18], derived from the New Zealand code [19].
For oscillators that remain elastic (i.e., with R 1 ), simply d m a x = d e . Based on the equivalent linearization approach, the CSM approximates the response of an SDOF oscillator undergoing inelastic deformations (i.e., with R > 1 ) through a substitute linear-elastic system, with reduced stiffness and increased viscous damping to account for nonlinear effects. The procedure implies a relationship between the inelastic excursion, expressed in terms of ductility μ , and an equivalent viscous damping ratio ξ e f f , which is used to adjust the initial elastic demand spectrum. In NPR 9998-18 [18], ξ e f f is first related to μ ; then, a spectral reduction factor η is calculated, as follows Equations (5)–(7):
ξ e f f = ξ h y s t + ξ s o i l + 0.05 0.40
ξ h y s t = 0.42 ( 1 0.9 μ 0.1 μ ) 0.15
η = 0.07 0.02 + ξ e f f 0.55
In this study, the effect of soil–structure interaction ( ξ s o i l ) on the equivalent viscous damping is ignored. In fact, NPR 9998-18 [18] allows ignoring ξ s o i l for buildings up to two stories, which include most masonry structures. In any case, imposing η 0.55 limits the effectiveness of additional damping sources for μ 4.3 . The method assumes that the period of the equivalent linear system T e f f corresponds to the secant stiffness at the maximum displacement; for elastoplastic systems without hardening, this is Equation (8):
T e f f = T μ
Since μ is the unknown of the problem, the solution requires iterations that end when the spectral displacement demand at T e f f ( μ ) , obtained from the elastic spectrum reduced by η ( μ ) , is equal to μ · d y . Graphically, the seismic demand on the nonlinear oscillator results from the intersection of its AD capacity curve with the elastic response spectrum reduced by η ( μ ) to account for hysteretic energy dissipation.
Figure 3 compares the displacement ductility demands resulting from the CSM procedure by NPR 9998-18 [18] with the ones obtained from NLTHA of Suite 1-A and Suite 1-B. The NPR method results in a significant overestimation of the demand, as the median line falls below the bisector, especially for large μ , while the percentiles are scattered away. Similar trends are obtained using both ground motion databases.
Figure 4 compares the median C R R   T and μ R R   T spectra calculated with the CSM by NPR 9998-18 [18] (solid lines) with those derived from NLTHA (dashed lines) for analysis Suite 2-A. The curves are limited to periods T between 0.1 and 0.5 s and strength ratios R between 1.0 and 5.0. One can observe that, generally, the inelastic displacement ratios C R from NLTHA tend to infinity as T approaches zero, and approximate 1.0 as T goes to infinity. Consistently, the ductility demand μ R from NLTHA approaches the R factor for long periods according to Equation (4).
The CSM by NPR 9998-18 [18] overestimates systematically median C R and μ R for all R factors across all periods T , when compared to the NLTHA results. Specifically, for periods approaching zero (i.e., very stiff structures), the estimated displacement demands tend to infinity with a faster rate compared to the NLTHA results. Instead, for periods T > 0.3   s (i.e., more flexible structures), predicted C R and μ R become constant but higher than 1.0 and R , respectively.

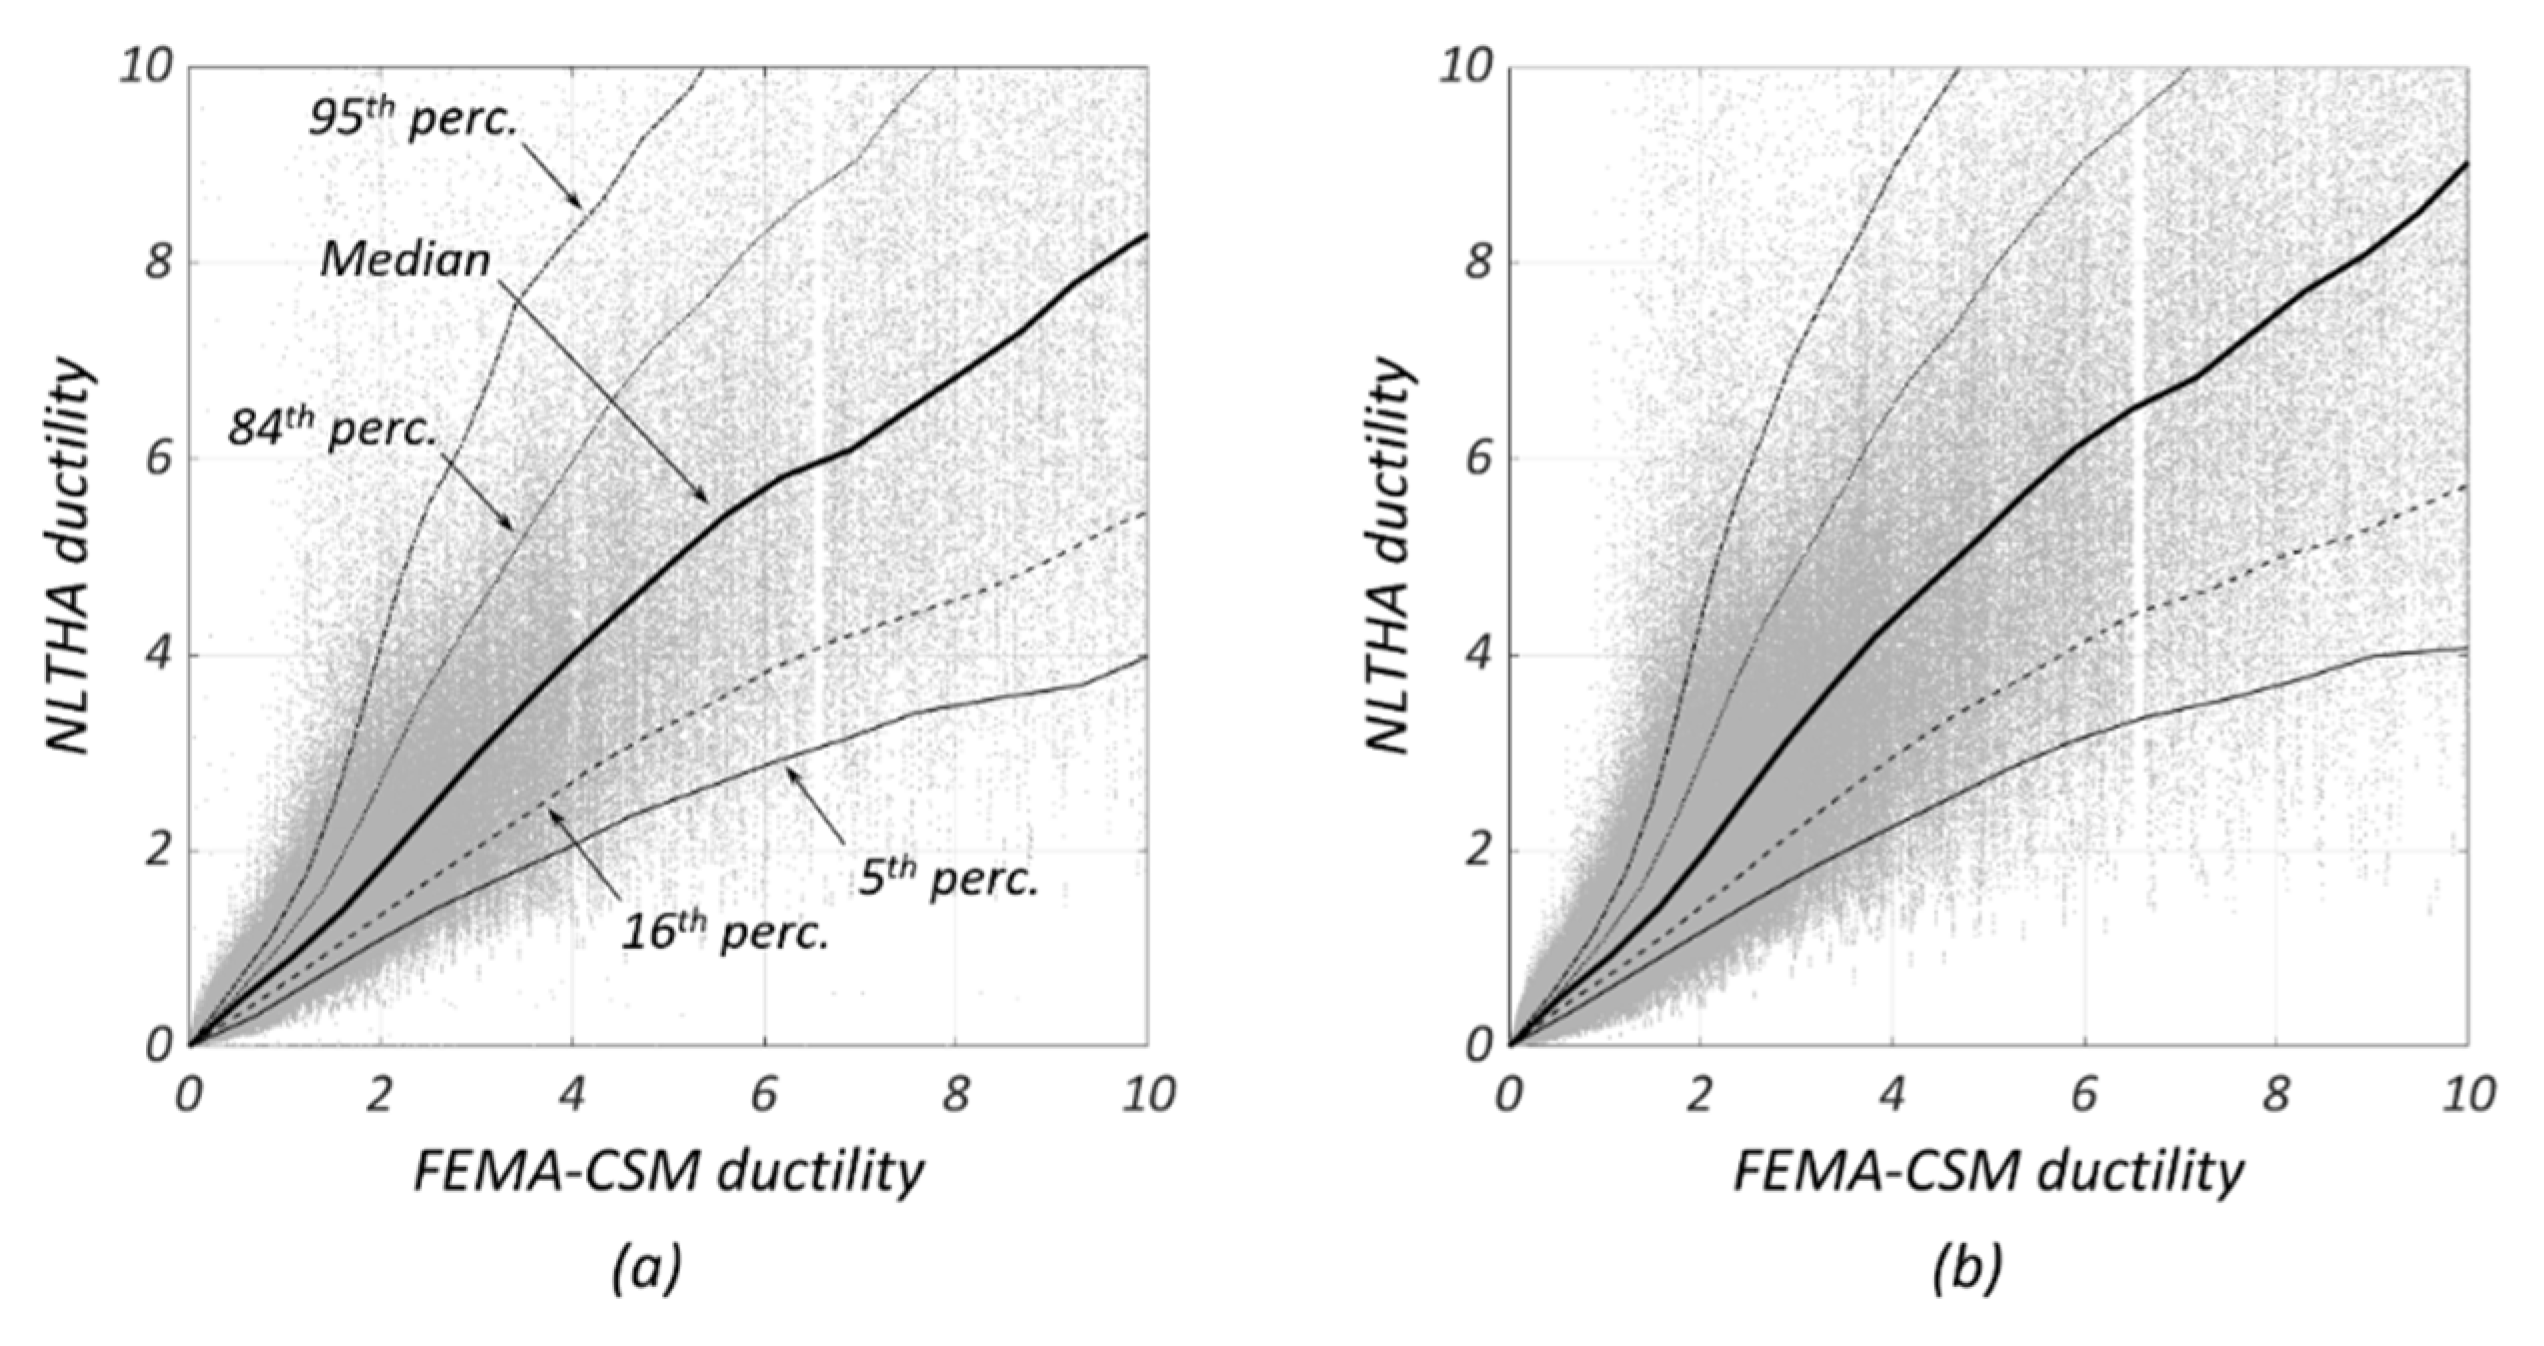
3.2. Modified Capacity Spectrum Method (FEMA-440)

An improved version of the CSM has been proposed in the FEMA-440 guidelines [22], where the equivalent linear system is defined by an optimal effective period T e f f and effective viscous damping ξ e f f . Similar to the NPR 9998-18 [18] procedure, T e f f and ξ e f f depend on the unknown ductility μ : consequently, an iterative process is required to calculate the displacement demand. For SDOF oscillators that remain elastic (i.e., with R 1 ), simply d m a x = d e . For oscillators undergoing inelastic deformations (i.e., with R > 1 ) with degrading stiffness and no hardening, compatible with masonry behavior, the spectral reduction parameters are computed as Equations (9) and (10):
ξ e f f = {   5.1 ( μ 1 ) 2 1.1 ( μ 1 ) 3 + 5 ,                       1.0 < μ < 4.0       12 + 1.4 ( μ 1 ) + 5 ,                                                         4.0 μ 6.5       20 { 0.62 ( μ 1 ) 1 [ 0.62 ( μ 1 ) ] 2 } ( T e f f T ) 2 + 5 ,                     μ > 6.5                      
η = 0.25 ( 5.6 ln ξ e f f )
There is no lower bound limit applied to the reduction factor of Equation (10), as opposed to Equation (7). Unlike the CSM by NPR 9998-18 [18], this method does not require the intersection between the capacity curve and demand spectra. The resulting effective period for stiffness-degrading, not hardening systems, is given by Equation (11):
T e f f = {   [ 0.17 ( μ 1 ) 2 0.032 ( μ 1 ) 3 + 1 ] Τ ,           1.0 < μ < 4.0 [ 0.10 + 0.19 ( μ 1 ) + 1 ] Τ ,                                                 4.0 μ 6.5 { 0.85 [ ( μ 1 ) 1 ] + 1 } Τ ,                                           μ > 6.5                      
Figure 5 compares the ductility demands resulting from the CSM procedure of FEMA 440 [22] with the ones obtained from NLTHA of Suite 1-A and Suite 1-B. Despite some accuracy improvements compared to the NPR 9998-18 [18] formulation, especially for larger ductility, this approach is still affected by overestimation and high scatter issues. Similar trends are observed for both earthquake record databases.
Figure 6 illustrates the comparison of the median C R R T and μ R R   T curves. Different from NPR 9998-18 [18], FEMA 440 [22] offers predictions that align with the NLTHA results for short periods. Deviations are noticed only for oscillators with T 0.2   s and R 2.5 , for which the predicted median C R and μ R remain constant instead of going to infinity. Similar to the CSM of NPR 9998-18 [18], this method overpredicts demands for systems with periods T > 0.3   s , even though to a lesser extent.

3.3. Issues with Methods Based on Equivalent Linearization

The overestimation observed for both NPR 9998-18 [18] and FEMA 440 [22] capacity spectrum methods is particularly evident (Figure 7a,b) considering only oscillators with a secant period T N L T H A , defined as the effective period at the displacement demand from NLTHA (stars on Figure 7e,f), shorter than the corner period T C of the demand spectrum. Three main causes may be responsible for the origin of the observed behavior.
The first issue affects all capacity spectrum method formulations, which define an effective period corresponding to the intersection between capacity and demand diagrams, such as the original ATC–40 [14] and the approaches followed by the Italian NTC-18 [16,17], the New Zealand guidelines [19], and the Dutch NPR 9998-18 [18]. The problem is due to the dependence of the spectral reduction factor η on the ductility demand μ , which tends to saturate as μ increases, and in some formulations is limited to a minimum value (Figure 7c,d).
In particular, the NPR 9998-18 [18] method limits ξ h y s t 0.15 , then imposing η 0.56 (excluding soil–structure interaction damping). If a system is characterized by R > 1 / η = 1.77 , the only possible intersection is with the constant-velocity or constant-displacement branch of the demand spectrum (solid dot on Figure 7e), resulting necessarily in T e f f > T C as opposed to the results of NLTHA.
Consequently, this formulation cannot be used to check limit states associated with displacement capacities corresponding to secant periods shorter than T C : in fact, it would automatically result in a violation of such displacement capacity thresholds. This problem does not affect the improved CSM by FEMA 440 [22] because it does not seek convergence through the direct intersection between capacity and demand diagrams (hollow dot in Figure 7f).
The second source of inaccuracy is identified in the relationship between η and μ for any value of T N L T H A . As η tends to level off for increasing μ , small variations in η strongly affect the predicted μ , with a bias towards overestimation of μ when η is slightly underestimated (Figure 7c,d) [60]. This problem affects both NPR 9998-18 [18] and FEMA 440 [22] capacity spectrum methods, as they seek convergence on μ . However, it is amplified in the Dutch formulation due to the lower bound imposed on η .
The third issue depends on the statistical distribution of μ values associated with a certain η , which is non-symmetrical with positive skewness for medium- and long-period systems, as inferred from the data shown by Pennucci et al. [61]. This means that, for given η , values of μ exceeding the median ductility will more likely result in larger errors than values falling below it. This happens with both iterative formulations.
Differently from NPR 9998-18 [18], the CSM formulation by FEMA 440 [22] significantly underestimates displacement demands in the low-ductility range (Figure 7b). This problem can be explained by looking at the C R R T and μ R R T curves of Figure 6: for any system with period T 0.2   s and strength ratio R 2.5 the method predicts constant ductility demands, below the values obtained from NLTHA.

4. Established Formulations Based on Inelastic Response Spectra

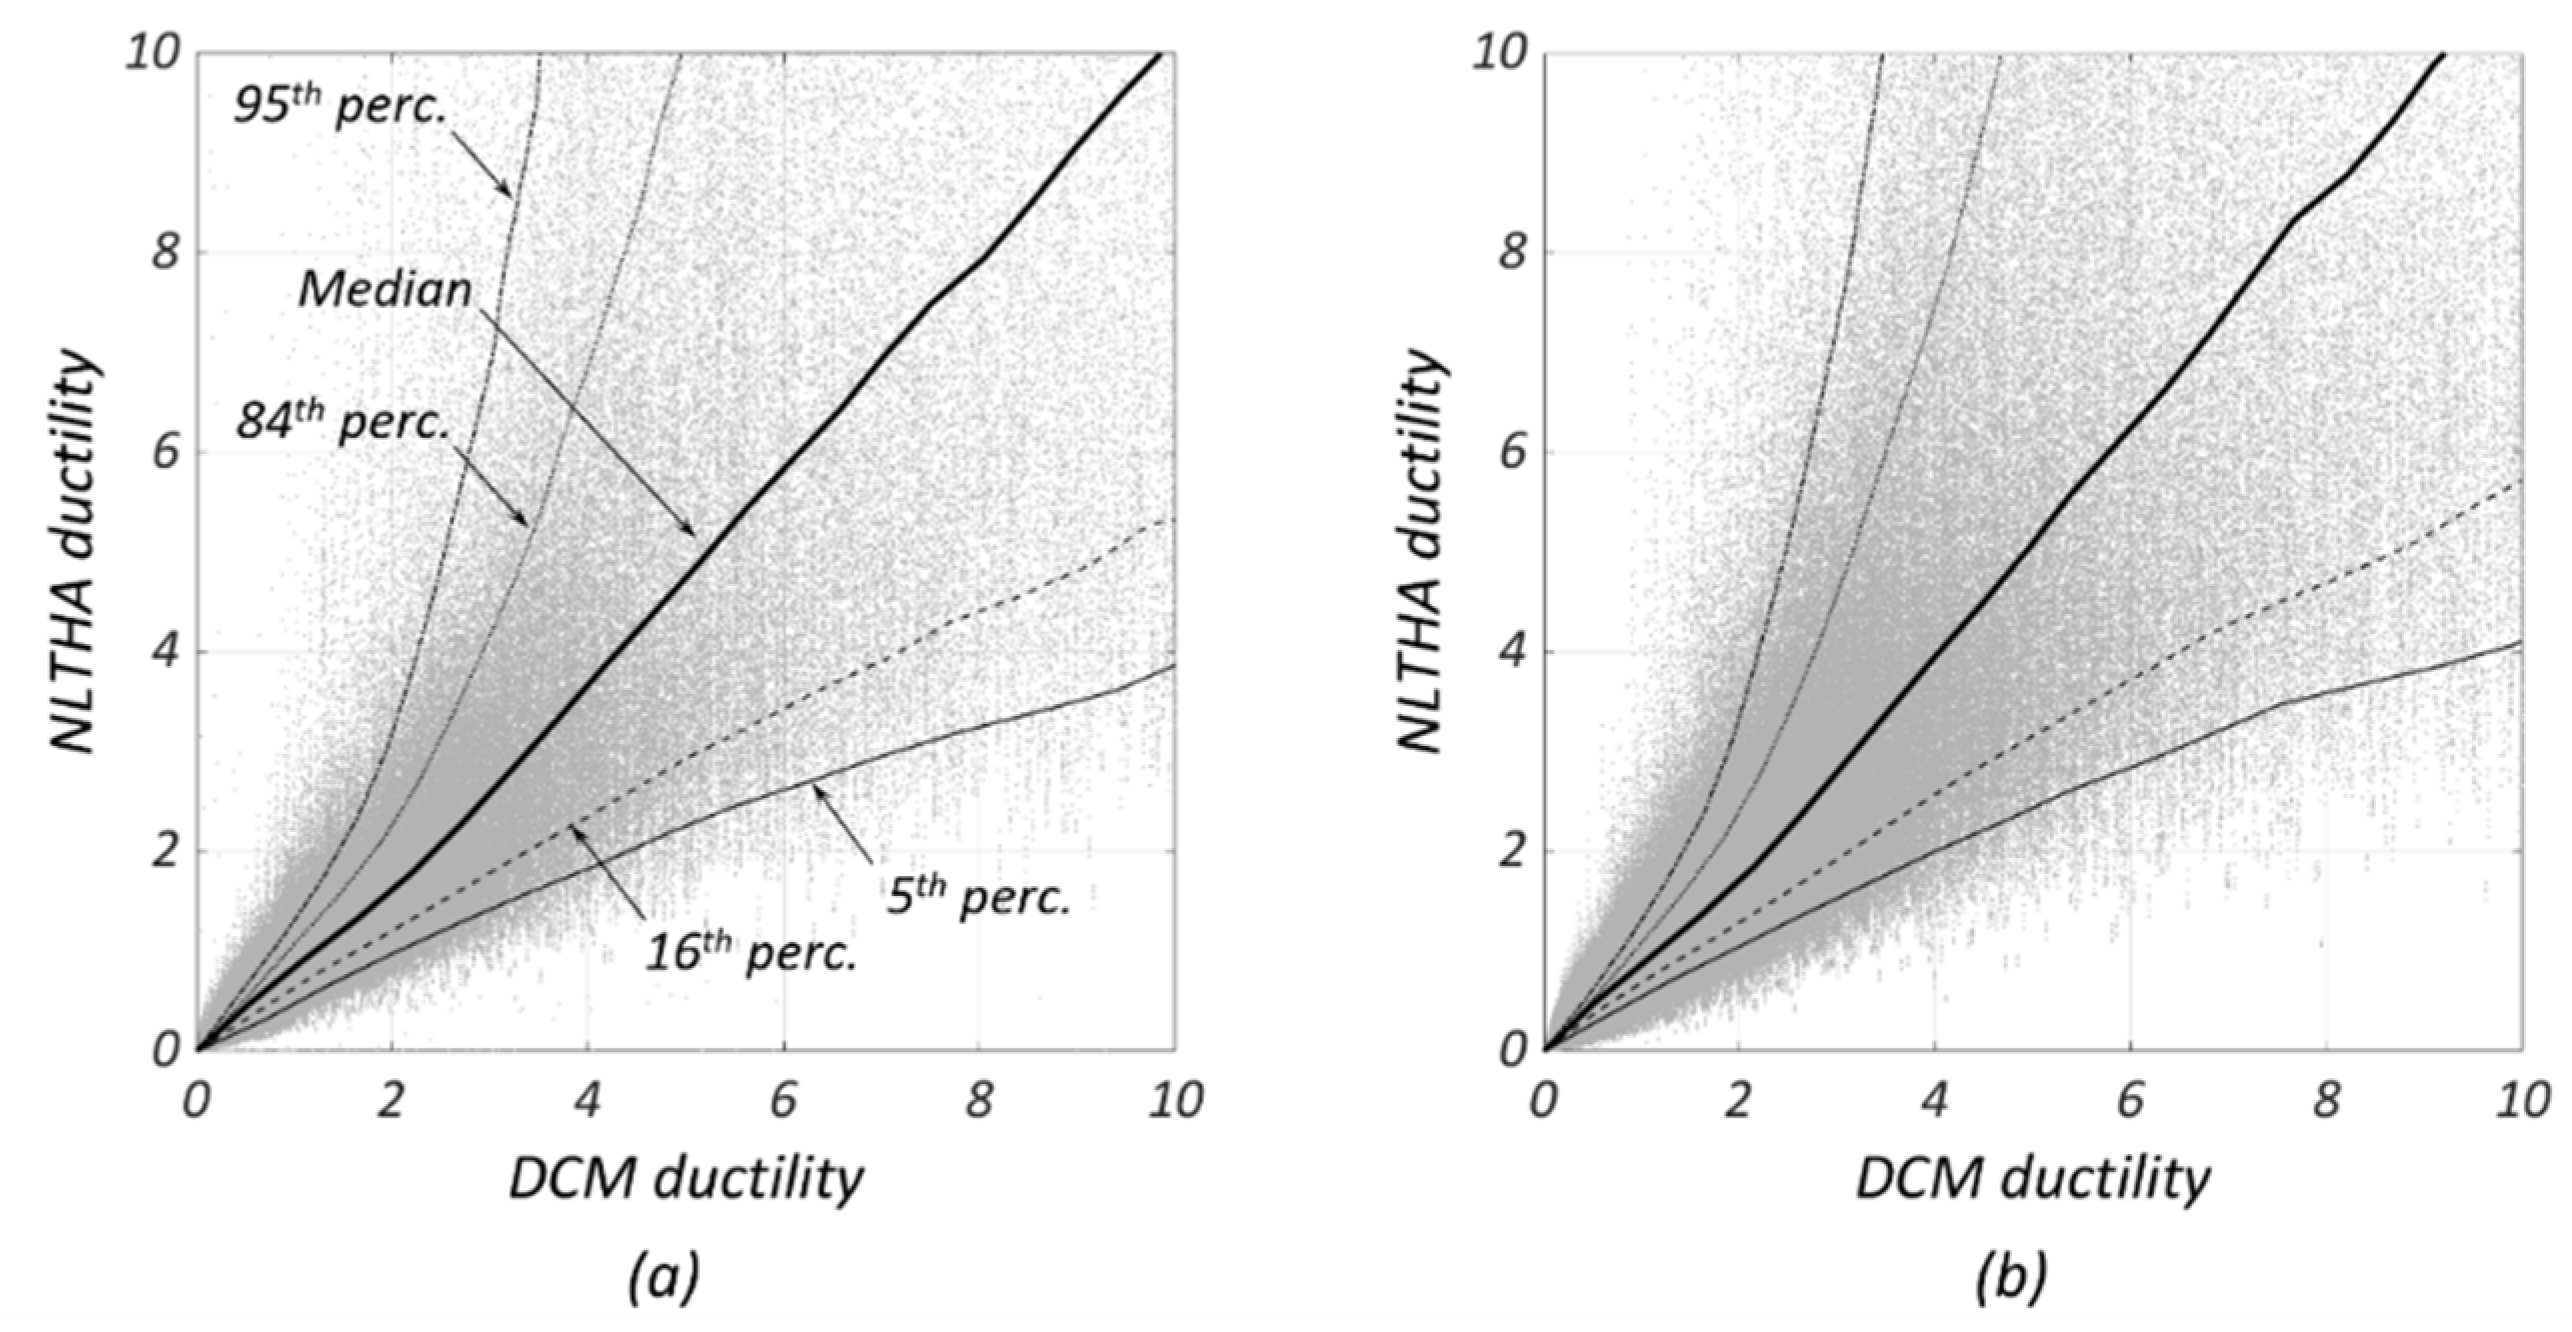
4.1. N2 Method (Eurocode 8 and NTC-18)

The current NSP formulations by Eurocode 8 [35] and by the Italian building code NTC-18 [16,17] descend from the N2 method [31,32,33,34], which relates maximum inelastic and elastic displacement demands on an SDOF oscillator, when R > 1 , with Equation (12):
d m a x = 1 R [ ( R 1 ) ( T C T ) + 1 ] d e d e
while d m a x = d e when R 1 . The lower-bound limit of Equation (12) is necessary because for T T C the inelastic displacement demand should not be taken as less than the elastic one (equal displacement rule).
Figure 8 compares the ductility demands predicted by the equation with the ones obtained from the NLTHA of Suite 1-A and Suite 1-B. In both cases, the comparison reveals that the current code formulation underestimates inelastic displacement demands significantly when they exceed a ductility of 4, as indicated by the median line found above the bisector. Nevertheless, the N2 approach results in limited dispersion compared to other existing methods.
The tendency of the method to underestimate displacement demands is also visible in the C R R T and μ R R T relationships in Figure 9. Differences between the predictions by the N2 equations and the results from NLTHA are more pronounced for systems of short period and low relative strength (high R factors).

4.2. Displacement Coefficient Method (ASCE 41-17)

The displacement coefficient method (DCM) is presented in the ASCE 41-17 code [37]. When R > 1 , the method calculates the maximum displacement demand on nonlinear SDOF system as in Equation (13):
d m a x = C 1 C 2 d e
while d m a x = d e when R 1 . Coefficients C 1 and C 2 are empirical modification factors given by the following Equations (14) and (15):
C 1 = {   1 + R 1 0.04 a ,           T 0.2   s                               1 + R 1 a T 2 ,           0.2   s < T 1.0   s 1.0 ,                               T > 1.0   s                              
C 2 = {   1 + 1 800 ( R 1 T ) 2 ,           T 0.7   s 1.0 ,                                                     T > 0.7   s
where a is a site-dependent parameter associated with the known site class [62] of each recording station: a = 130 for site classes A and B, a = 90 for site class C, and a = 60 for site classes D, E, and F. Figure 10 shows that, despite good accuracy in the median prediction, these equations result in large scatter, as indicated by the distance of the lower and upper percentile lines from the median.
Figure 11 illustrates the comparison between the C R R T and μ R R T spectra by the DCM and those obtained from NLTHA results. One can notice that the method provides considerably lower median values of C R and μ R for systems with periods T < 0.15   s regardless of the strength ratio R . Instead, the method overpredicts demands for longer periods and for all strength ratios R . This confirms the overall large scatter affecting the DCM predictions, as pointed out by FEMA 440 [22] and Ruiz-García and Miranda [1]. The transition of Equation (14) at T = 0.2   s explains the change of slope of the curves in Figure 11: this happens because for periods T 0.2   s coefficient C 1 remains constant with the period.

4.3. Issues with Methods Based on Inelastic Response Spectra

Figure 8 through Figure 11 show that both the N2 method of Eurocode 8 and NTC-18 [16,17,35] and the DCM of ASCE 41-17 [37] can result in significant errors when applied to short-period masonry-type oscillators. Both formulations were originally derived for steel and concrete frame structures, characterized by longer fundamental periods and higher hysteretic dissipation capacity. In fact, Guerrini et al. [44] demonstrated that the inefficiency of the N2 equation is more evident for oscillators with T < 0.5 s, and that errors are more pronounced for systems with low hysteretic dissipation. They suggested that the accuracy of the method would benefit from explicit consideration of the hysteretic behavior, especially at short periods, where inelastic displacement demand amplification is more sensitive to this parameter.
Another source of inaccuracy for the N2 formulation [16,17,35] lies in the fact that it belongs to the so-called “indirect methods” [63], where the μ R R T relationship (i.e., for given R ) results from the inversion of the calibrated R μ μ T equation (i.e., for a given μ ) by Vidic et al. [25]. This process can introduce systematic errors that tend to underestimate the maximum inelastic displacement demands, with a greater error for increasing ductility [1].
The N2 method and the DCM correctly predict ductility demands that tend towards infinity for very short periods and approach the R value for long periods. Nevertheless, both methods display problems with the rate of convergence to these two limits. In particular, the DCM approaches the two boundaries with a lower rate than the one obtained from NLTHA, while the N2 method significantly underestimates the displacement amplification at short periods.

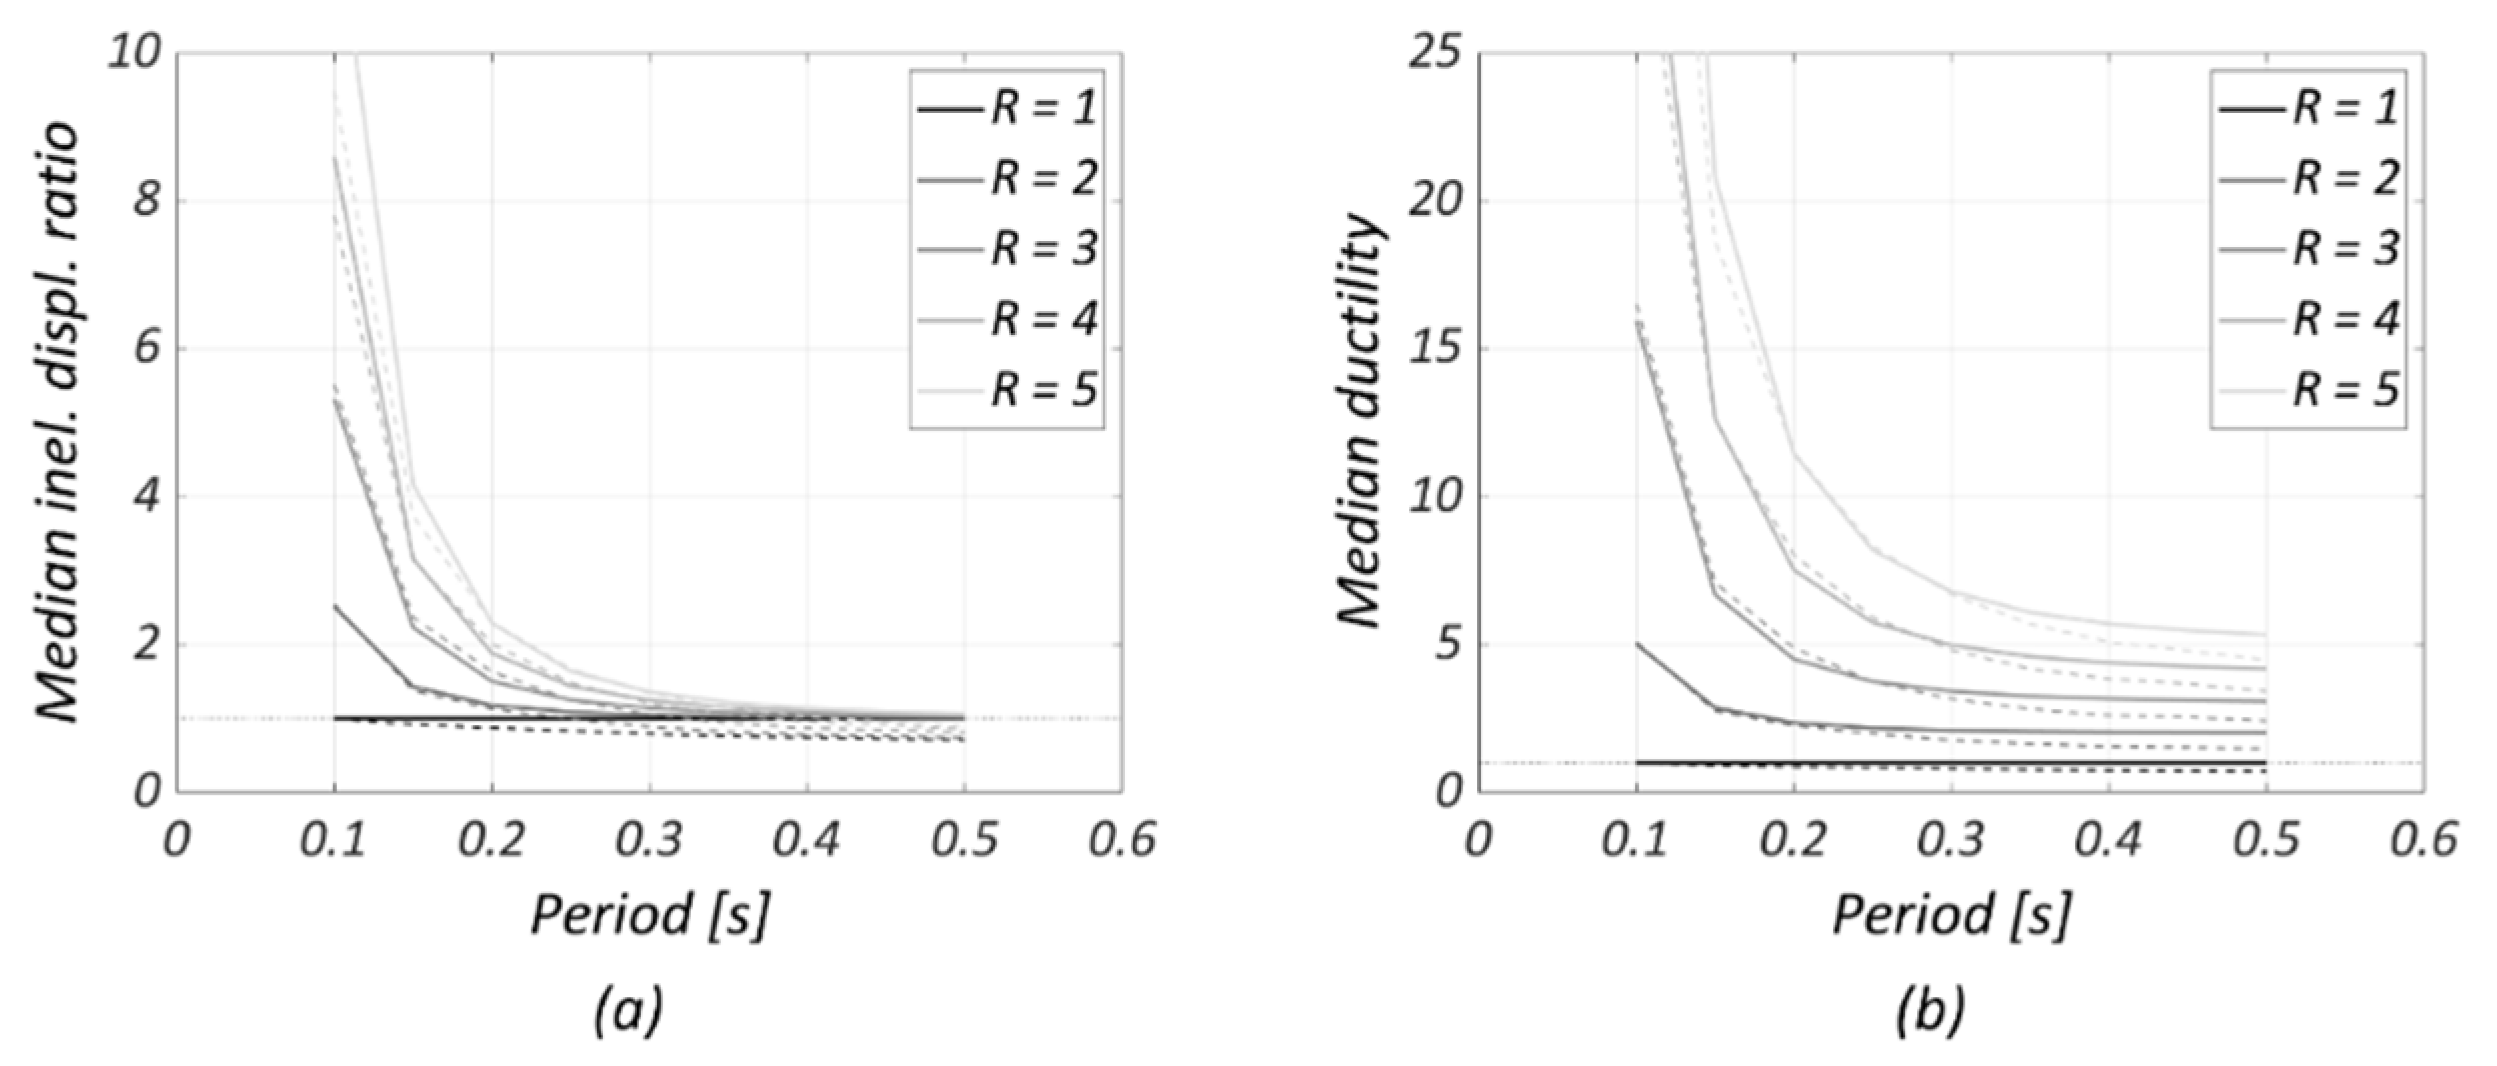
5. Proposed Formulations

5.1. Optimal Stiffness Method

This section presents an improved equivalent linearization procedure, named optimal stiffness method (OSM), as it defines an optimal stiffness T o p t and the corresponding equivalent viscous damping ratio ξ o p t in terms of the idealized elastic period T and the strength ratio R of the oscillator. Adapting the equation form discussed by Lin and Miranda [64], the following relationships were calibrated based on the results from NLTHA on masonry-type oscillators. For oscillators that remain elastic (i.e., with R 1 ), simply d m a x = d e . The optimal linear parameters for SDOF oscillators with R > 1 are given by Equations (16) and (17):
ξ o p t = 0.05 + n h y s t ( R 1 ) 2
T o p t = T + m h y s t ( R 1 ) 2
The coefficients m h y s t and n h y s t in these equations were calibrated with dynamic responses of SDOF oscillators from Suite 1-A by the orthogonal regression algorithm mentioned earlier. The calibration of the parameters was performed separately for systems of low ( 13 % ξ h y s t < 15 % ), intermediate ( 15 % ξ h y s t 18 % ), and high ( 18 % < ξ h y s t 20 % ) hysteretic dissipation. The resulting values are summarized in Table 1.
The relationship between spectral reduction factor η and equivalent viscous damping ratio ξ o p t was taken by Eurocode 8, without lower-bound limitations, according to Equation (18):
η = 0.10 0.05 + ξ o p t
Owing to the dependence of the equivalent system properties on the known strength ratio R , rather than on the unknown ductility μ , the method offers the advantage of a direct non-iterative solution. In this way, the method overcomes the problems associated with the relationship between η and μ of NPR 9998-18 [18] and FEMA 440 [22]. The proposed equation generally provides an accurate estimate of the ductility demand, as demonstrated by the median line approaching the bisector in Figure 12. Moreover, predictions are characterized by low dispersion for both Suite 1-A and 1-B analyses.
Good agreement was also observed between the predicted and the NLTHA-derived median C R R T and μ R R T spectra, as shown in Figure 13. It is noteworthy that, for periods T > 0.3   s , the predicted curves approach those obtained by NLTHA, as opposed to the equivalent linearization procedures by NPR 9998-18 [18] and FEMA 440 [22], which deviate significantly.

5.2. Modified-N2 Method

Motivated by the limitations of the N2 method of Eurocode 8 and NTC-18 [16,17,35], when applied to masonry-like systems, a modified-N2 (MN2) method has been formulated and calibrated against NLTHA results to relate inelastic and elastic seismic displacement demands for this kind of oscillators [44]. For SDOF systems with R > 1 , the formulation results in Equation (19):
d m a x = 1 R [ ( R 1 ) 2.1 ( T T h y s t + a h y s t ) ( T T C ) 2.3 + R ] d e
while d m a x = d e when R 1 . Unlike the original N2 formulation, this equation tends asymptotically to the elastic displacement demand as T approaches infinity, without the need for a lower-bound limit. The coefficients T h y s t and a h y s t were calibrated with the results from NLTHA on SDOF oscillators (Suite 1-A) using the same orthogonal regression algorithm discussed above [44]. Similar to the OSM equations, Equation (19) was calibrated separately for three ranges of hysteretic dissipation capacity; the resulting values for the parameters are listed in Table 2.
The ductility demands predicted by the MN2 method are shown in Figure 14. The equation exhibits significantly improved accuracy and reduced dispersion compared to the original N2 method, considering both Site 1-A and 1-B analysis results. The improved performance of this method for periods ranging between 0.1 and 0.5 s is also reflected in the predicted C R R T and μ R R T spectra, which accurately approximate the NLTHA-derived spectra (Figure 15).

5.3. Accuracy and Scatter of OSM and MN2 Methods

Figure 12 and Figure 14 show that median and percentile distances from the bisector can be approximated well by straight lines on the plane of ductility demands predicted by the proposed equations versus the NLTHA. This means that the ratio of the percentile to the central ductility value of each bin remains nearly constant over the considered ductility range (up to 10). Percentile factors γ p were evaluated for different percentiles p over the entire set of oscillators and for individual periods T , and were taken to be equal to the slope of the corresponding percentile line. The inelastic displacement demand d m a x , p , corresponding to percentile p, can be expressed as Equation (20):
d m a x , p = γ p d m a x
Table 3 and Table 4 summarize the values of γ p for the 50th (median), 70th, 84th and 95th percentiles for both proposed methods, showing that they provide accurate estimates of the median inelastic displacement demand ( γ 50 1.0 ). It can also be observed that the OSM is somehow less precise than the MN2 method in its predictions because it is characterized by a larger scatter: this is reflected by larger values of γ p for higher percentiles.
Lacking detailed information on the amount of hysteretic dissipation for a specific masonry structure, the parameters of the intermediate case ( 15 % ξ h y s t 18 % ) could be generally adopted with both methods. This simplification would have a minimal effect on the accuracy of the results. In most cases, only the second decimal figure would change in factors γ p for higher percentiles. No appreciable effect of the focal distance was observed on the accuracy and dispersion of the predictions, when the ground motion records were treated in two groups considering distance thresholds of 5, 10, 15 or 20 km.
Finally, it has been observed that for oscillators with a secant period T N L T H A from NLTHA shorter than the corner period T C of the demand spectrum, both methods provide improved estimations of the median inelastic displacement demand compared to established formulations. The MN2 method appears more accurate than the OSM in these situations, despite a slight tendency towards overestimations. On the other hand, the OSM results in a more pronounced underestimation of the median displacement demand with somewhat larger dispersion for these oscillators.

6. Discussion and Conclusions

This paper discussed the implementation of six methods for estimating inelastic seismic displacement demands to be used in nonlinear static analysis procedures for the assessment of existing masonry structures. The predictive accuracy of the methods was assessed based on the results from nonlinear time-history analyses (NLTHA) on single-degree-of-freedom (SDOF) oscillators with hysteretic relationships typical of masonry buildings and periods between 0.05 and 0.5 s. Two independent ground motion databases, as well as two sets of oscillators, were used for this scope, resulting in a total number of 3,434,900 analyses.
The study first demonstrated some limitations of two established iterative methods based on the equivalent linearization concept: the capacity spectrum method recommended by the Dutch code NPR 9998-18, and its modified version outlined in the American guidelines FEMA 440. Both methods provide general overprediction of inelastic displacement demands because of issues in the relationships between ductility demand, effective viscous damping, and spectral reduction factors. Overestimations are more pronounced for methods seeking convergence through direct intersection between capacity and demand diagrams, like in NPR 9998-18, especially if the NLTHA results in a maximum displacement corresponding to an effective period shorter than the corner period of the demand spectrum. This problem can be found in all similar methods, such as the ones of the Italian NTC-18 and of the New Zealand guidelines.
Two established formulations based on inelastic displacement spectra, oscillator idealized elastic period, and strength ratio were also evaluated. The N2 method of Eurocode 8 and Italian building code NTC-18 proved to underestimate the displacement demand in spite of a limited scatter. In contrast, the displacement coefficient method of ASCE 41-17 was shown to better predict the median ductility but with excessively high dispersion. Both methods have problems with the rate of convergence to infinite and elastic displacement demands as the elastic period approaches zero and infinity, respectively. These issues are mainly due to lack of calibration with the dynamic responses of masonry structures.
An alternative approach based on the equivalent linearization concept, termed optimal stiffness method (OSM), was then proposed. This procedure defines an optimal stiffness and equivalent viscous damping in terms of idealized elastic period and strength ratio, which are both known in the assessment of an existing building. This formulation does not need iterations on the ductility demand and overcomes the problems with the relationships between ductility demand, effective viscous damping, and spectral reduction factors. A modified version of the N2 method (MN2), directly calibrated with the dynamic response of short-period oscillators, was finally presented.
Both proposed formulations predict the median ductility demand accurately while limiting the dispersion of the results. However, the MN2 method is somehow more precise than the OSM because it is characterized by a smaller scatter. The MN2 method appears more accurate than the OSM when the NLTHA results in a maximum displacement corresponding to an effective period shorter than the corner period of the demand spectrum, despite a slight tendency towards overestimations. On the other hand, in these cases, the OSM results in a more pronounced underestimation of the median displacement demand with somewhat larger dispersion for these oscillators. Neither of the proposed methods appeared sensitive to the focal distance of the earthquake records. Due to the high rate of divergence towards the infinity of the ductility demand from both NLTHA and predictions, it was not possible to obtain meaningful results for oscillators with periods shorter than 0.1 s.
The general equations of the OSM and MN2 methods can be calibrated with the NLTHA responses of SDOF oscillators with other hysteretic rules. Different sets of parameters can then be derived, allowing the application of these formulations to other structural systems.

Author Contributions

G.G.: conceptualization, investigation, methodology, software, formal analysis, data curation, writing—original draft preparation, visualization; S.K.: investigation, software, formal analysis, data curation, validation, writing—original draft preparation, visualization; S.B.: investigation, validation, writing—review and editing; F.G.: conceptualization, methodology, writing—review and editing, supervision, project administration, funding acquisition; A.P.: resources, supervision, project administration, funding acquisition. All authors have read and agreed to the published version of the manuscript.

Funding

This research was funded by ReLUIS-DPC project 2019-2021 WP10 “Contributi normativi relativi a costruzioni esistenti in muratura”, funded by the Italian Department of Civil Protection and the UNIPV-TU Delft project “Development and verification of software for the seismic assessment of masonry buildings according to Annex G of NPR9998:2018”, funded by Nationaal Coördinator Groningen (NCG), Centrum Veilig Wonen (CVW), and Econstruct BV.

Data Availability Statement

Data can be made available upon request to the corresponding author.

Acknowledgments

The authors would like to express their gratitude to G. Magenes for his valuable comments and to V. Bonura, E. Bossi, and C. Rossi who contributed to the elaboration of the SDOF analysis results. The authors are also grateful to H. Crowley and R. Pinho for providing part of the seismic input for nonlinear time-history analyses.

Conflicts of Interest

The authors declare no conflict of interest. The funders had no role in the design of the study; in the collection, analyses, or interpretation of data; in the writing of the manuscript, or in the decision to publish the results.

References

  1. Ruiz-García, J.; Miranda, E. Inelastic displacement ratios for evaluation of existing structures. Earthq. Eng. Struct. Dyn. 2003, 32, 1237–1258. [Google Scholar] [CrossRef]
  2. Saiidi, M.; Sozen, M.A. Simple Nonlinear Seismic Analysis of R/C Structures. J. Struct. Div. 1981, 107, 937–953. [Google Scholar] [CrossRef]
  3. Miranda, E. Approximate Seismic Lateral Deformation Demands in Multistory Buildings. J. Struct. Eng. 1999, 125, 417–425. [Google Scholar] [CrossRef]
  4. Chopra, A.K.; Goel, R.K. Evaluation of NSP to Estimate Seismic Deformation: SDF Systems. J. Struct. Eng. 2000, 126, 482–490. [Google Scholar] [CrossRef] [Green Version]
  5. Chopra, A.K.; Goel, R.K. A modal pushover analysis procedure for estimating seismic demands for buildings. Earthq. Eng. Struct. Dyn. 2002, 31, 561–582. [Google Scholar] [CrossRef] [Green Version]
  6. Antoniou, S.; Pinho, R. Advantages and limitations of adaptive and non-adaptive force-based pushover procedures. J. Earthq. Eng. 2004, 8, 497–522. [Google Scholar] [CrossRef]
  7. Antoniou, S.; Pinho, R. Development and verification of a displacement-based adaptive pushover procedure. J. Earthq. Eng. 2004, 8, 643–661. [Google Scholar] [CrossRef]
  8. Brozovič, M.; Dolšek, M. Envelope-based pushover analysis procedure for the approximate seismic response analysis of buildings. Earthq. Eng. Struct. Dyn. 2013, 43, 77–96. [Google Scholar] [CrossRef]
  9. Jacobsen, L.S. Steady Forced Vibrations as Influenced by Damping. Trans. ASME-APM 1930, 52, 169–181. [Google Scholar]
  10. Hudson, D.E. Equivalent Viscous Friction for Hysteretic Systems with Earthquake-Like Excitations. In Proceedings of the 3rd World Conference on Earthquake Engineering, New Zealand National Committee on Earthquake Engineering, Wellington, New Zealand, 22 January–1 February 1965; Volume 2, pp. 185–202. [Google Scholar]
  11. Jennings, P.C. Equivalent Viscous Damping for Yielding Structures. J. Eng. Mech. Div. 1968, 94, 103–116. [Google Scholar] [CrossRef]
  12. Shibata, A.; Sözen, M.A. Substitute-Structure Method for Seismic Design in R/C. J. Struct. Div. ASCE 1976, 102, 1–18. [Google Scholar] [CrossRef]
  13. Freeman, S.A.; Nicoletti, J.P.; Tyrrell, J.V. Evaluation of Existing Buildings for Seismic Risk—A Case Study of Puget Sound Naval Shipyard, Bremerton, Washington. In Proceedings of the 1st US National Conference on Earthquake Engineering, Oakridge, CA, USA, 18–20 June 1975; pp. 113–122. [Google Scholar]
  14. Applied Technology Council (ATC). Seismic Evaluation and Retrofit of Concrete Buildings, ATC–40; Applied Technology Council: Redwood City, CA, USA, 1996. [Google Scholar]
  15. Federal Emergency Management Agency (FEMA). NEHRP Commentary on the Guidelines for the Seismic Rehabilitation of Buildings, FEMA Publication 274; Federal Emergency Management Agency: Washington, DC, USA, 1997.
  16. Ministry of Infrastructures and Transport (MIT). Norme Tecniche per le Costruzioni (NTC-18), DM 17/01/2018; Ministry of Infrastructures and Transport: Rome, Italy, 2018. (In Italian)
  17. Ministry of Infrastructures and Transport (MIT). Istruzioni per l’Applicazione dell’Aggiornamento delle “Norme Tecniche per le Costruzioni (NTC-18)”, Circ. 7 of 21/01/2019; Ministry of Infrastructures and Transport: Rome, Italy, 2019. (In Italian)
  18. Netherlands Standardization Institute (NEN). Assessment of Structural Safety of Buildings in Case of Erection, Reconstruction, and Disapproval—Induced Earthquakes—Basis of Design, Actions and Resistances, NPR 9998; Netherlands Standardization Institute: Delft, The Netherlands, 2018. (In Dutch) [Google Scholar]
  19. New Zealand Society for Earthquake Engineering (NZSEE). The Seismic Assessment of Existing Buildings, Part C: Detailed Seismic Assessment; MBIE, EQC, SESOC, NZSEE, NZGS: Wellington, New Zealand, 2016.
  20. Dwairi, H.M.; Kowalsky, M.J.; Nau, J.M. Equivalent Damping in Support of Direct Displacement-Based Design. J. Earthq. Eng. 2007, 11, 512–530. [Google Scholar] [CrossRef]
  21. Priestley, M.J.N.; Calvi, G.M.; Kowalsky, M.J. Displacement-Based Seismic Design of Structures; IUSS Press: Pavia, Italy, 2007. [Google Scholar]
  22. Federal Emergency Management Agency (FEMA). Improvement of Nonlinear Static Seismic Analysis Procedures, FEMA Publication 440; Federal Emergency Management Agency: Washington, DC, USA, 2005.
  23. Veletsos, A.S.; Newmark, N.M. Effect of Inelastic Behavior on the Response of Simple Systems to Earthquake Motions. In Proceedings of the 2nd World Conference on Earthquake Engineering, Tokyo, Japan, 11–18 July 1960; Science Council of Japan: Tokyo, Japan, 1960; Volume 2, pp. 895–912. [Google Scholar]
  24. Veletsos, A.S.; Newmark, N.M.; Chelapati, C.V. Deformation Spectra for Elastic and Elastoplastic Systems Subjected to Ground Shock and Earthquake Motions. In Proceedings of the 3rd World Conference on Earthquake Engineering, Wellington, New Zealand, 22 January–1 February 1965; Volume 2, pp. 663–682. [Google Scholar]
  25. Newmark, N.M.; Hall, W.J. Earthquake Spectra and Design; Earthquake Engineering Research Institute: Berkeley, CA, USA, 1982. [Google Scholar]
  26. Riddell, R.; Hidalgo, P.; Cruz, E. Response Modification Factors for Earthquake Resistant Design of Short Period Buildings. Earthq. Spectra 1989, 5, 571–590. [Google Scholar] [CrossRef]
  27. Rahnama, M.; Krawinkler, H. Effects of Soft Soil and Hysteresis Model on Seismic Demands; Report No., 108; The John A. Blume Earthquake Engineering Center, Stanford University: Stanford, CA, USA, 1993. [Google Scholar]
  28. Miranda, E. Evaluation of Site-Dependent Inelastic Seismic Design Spectra. J. Struct. Eng. 1993, 119, 1319–1338. [Google Scholar] [CrossRef]
  29. Miranda, E. Inelastic Displacement Ratios for Structures on Firm Sites. J. Struct. Eng. 2000, 126, 1150–1159. [Google Scholar] [CrossRef]
  30. Ramirez, O.M.; Constantinou, M.C.; Whittaker, A.S.; Kircher, C.A.; Chrysostomou, C.Z. Elastic and Inelastic Seismic Response of Buildings with Damping Systems. Earthq. Spectra 2002, 18, 531–547. [Google Scholar] [CrossRef]
  31. Fajfar, P.; Fischinger, M. N2–A Method for Nonlinear Seismic Analysis of Regular Buildings. In Proceedings of the 9th World Conference on Earthquake Engineering, Tokyo, Japan, 2–6 August 1988; Science Council of Japan: Tokyo, Japan, 1988; Volume 5, pp. 111–116. [Google Scholar]
  32. Vidic, T.; Fajfar, P.; Fischinger, M. Consistent inelastic design spectra: Strength and displacement. Earthq. Eng. Struct. Dyn. 1994, 23, 507–521. [Google Scholar] [CrossRef]
  33. Fajfar, P. Capacity Spectrum Method Based on Inelastic Demand Spectra. Earthq. Eng. Struct. Dyn. 1999, 28, 979–993. [Google Scholar] [CrossRef]
  34. Fajfar, P. A Nonlinear Analysis Method for Performance-Based Seismic Design. Earthq. Spectra 2000, 16, 573–592. [Google Scholar] [CrossRef]
  35. European Committee for Standardization (CEN). Eurocode 8: Design of Structures for Earthquake Resistance—Part 1: General Rules, Seismic Actions, and Rules for Buildings, EN 1998-1; European Committee for Standardization: Brussels, Belgium, 2004. [Google Scholar]
  36. Federal Emergency Management Agency (FEMA). NEHRP Guidelines for the Seismic Rehabilitation of Buildings, FEMA Publication 273; Federal Emergency Management Agency: Washington, DC, USA, 1997.
  37. American Society of Civil Engineers (ASCE). Seismic Evaluation and Retrofit of Existing Buildings; ASCE/SEI American Society of Civil Engineers: Reston, VG, USA, 2017.
  38. Bertero, V.V.; Anderson, J.C.; Krawinkler, H.; Miranda, E. Design Guidelines for Ductility and Drift Limits; Report No. UCB/EERC-91/15; Earthquake Engineering Research Center, University of California at Berkeley: Berkeley, CA, USA, 1991. [Google Scholar]
  39. Krawinkler, H. New Trends in Seismic Design Methodology. In Proceedings of the 10th European Conference on Earthquake Engineering, Vienna, Austria, 28 August–2 September 1994; Balkema: Rotterdam, The Netherlands, 1995; Volume 2, pp. 821–830. [Google Scholar]
  40. Chopra, A.K.; Goel, R.K. Direct Displacement-Based Design: Use of Inelastic vs. Elastic Design Spectra. Earthq. Spectra 2001, 17, 47–64. [Google Scholar] [CrossRef]
  41. Martinelli, E.; Faella, C. Nonlinear static analyses based on either inelastic or elastic spectra with equivalent viscous damping: A parametric comparison. Eng. Struct. 2015, 88, 241–250. [Google Scholar] [CrossRef]
  42. Amadio, C.; Rinaldin, G.; Fragiacomo, M. Investigation on the accuracy of the N2 method and the equivalent linearization procedure for different hysteretic models. Soil Dyn. Earthq. Eng. 2016, 83, 69–80. [Google Scholar] [CrossRef]
  43. Michel, C.; Lestuzzi, P.; Lacave, C. Simplified non-linear seismic displacement demand prediction for low period structures. Bull. Earthq. Eng. 2014, 12, 1563–1581. [Google Scholar] [CrossRef] [Green Version]
  44. Guerrini, G.; Graziotti, F.; Penna, A.; Magenes, G. Improved evaluation of inelastic displacement demands for short-period masonry structures. Earthq. Eng. Struct. Dyn. 2017, 46, 1411–1430. [Google Scholar] [CrossRef]
  45. Diana, L.; Manno, A.; Lestuzzi, P. Seismic displacement demand prediction in non-linear domain: Optimization of the N2 method. Earthq. Eng. Eng. Vib. 2019, 18, 141–158. [Google Scholar] [CrossRef]
  46. Lestuzzi, P.; Diana, L. Accuracy Assessment of Nonlinear Seismic Displacement Demand Predicted by Simplified Methods for the Plateau Range of Design Response Spectra. Adv. Civ. Eng. 2019, 2019, 1–16. [Google Scholar] [CrossRef] [Green Version]
  47. Dolšek, M.; Fajfar, P. Simplified probabilistic seismic performance assessment of plan-asymmetric buildings. Earthq. Eng. Struct. Dyn. 2007, 36, 2021–2041. [Google Scholar] [CrossRef]
  48. Diana, L.; Lestuzzi, P.; Podestà, S.; Luchini, C. Improved Urban Seismic Vulnerability Assessment Using Typological Curves and Accurate Displacement Demand Prediction. J. Earthq. Eng. 2019, 1–23. [Google Scholar] [CrossRef]
  49. Snoj, J.; Dolšek, M. Pushover-based seismic risk assessment and loss estimation of masonry buildings. Earthq. Eng. Struct. Dyn. 2020, 49, 567–588. [Google Scholar] [CrossRef]
  50. Shishegaran, A.; Khalili, M.R.; Karami, B.; Rabczuk, T.; Shishegaran, A. Computational predictions for estimating the maximum deflection of reinforced concrete panels subjected to the blast load. Int. J. Impact Eng. 2020, 139, 103527. [Google Scholar] [CrossRef]
  51. Lagomarsino, S.; Penna, A.; Galasco, A.; Cattari, S. TREMURI program: An equivalent frame model for the nonlinear seismic analysis of masonry buildings. Eng. Struct. 2013, 56, 1787–1799. [Google Scholar] [CrossRef]
  52. Penna, A.; Lagomarsino, S.; Galasco, A. A nonlinear macroelement model for the seismic analysis of masonry buildings. Earthq. Eng. Struct. Dyn. 2014, 43, 159–179. [Google Scholar] [CrossRef]
  53. Graziotti, F.; Penna, A.; Bossi, E.; Magenes, G. Evaluation of Displacement Demand for Unreinforced Masonry Buildings by Equivalent SDOF Systems. In Proceedings of the 9th International Conference on Structural Dynamics, Porto, Portugal, 30 June–2 July 2014; pp. 365–372. [Google Scholar]
  54. Graziotti, F.; Penna, A.; Magenes, G. A nonlinear SDOF model for the simplified evaluation of the displacement demand of low-rise URM buildings. Bull. Earthq. Eng. 2016, 14, 1589–1612. [Google Scholar] [CrossRef]
  55. Smerzini, C.; Galasso, C.; Iervolino, I.; Paolucci, R. Ground Motion Record Selection Based on Broadband Spectral Compatibility. Earthq. Spectra 2014, 30, 1427–1448. [Google Scholar] [CrossRef] [Green Version]
  56. Crowley, H.; Pinho, R. Report on the v5 Fragility and Consequence Models for the Groningen Field. In Report on Groningen Field Seismic Hazard and Risk Assessment Project; Van Elk, J., Doornhof, D., Eds.; Nederlandse Aardolie Maatschappij (NAM): Assen, The Netherlands, 2017; Available online: www.nam.nl/feiten-en-cijfers (accessed on 13 March 2021).
  57. Chiou, B.S.J.; Darragh, R.; Gregor, N.; Silva, W.J. NGA Project Strong-Motion Database. Earthq. Spectra 2008, 24, 23–44. [Google Scholar] [CrossRef] [Green Version]
  58. Akkar, S.; Sandikkaya, M.A.; Şenyurt, M.; Sisi, A.A.; Ay, B.O.; Traversa, P.; Douglas, J.H.; Cotton, F.; Luzi, L.; Hernandez, B.M.; et al. Reference database for seismic ground-motion in Europe (RESORCE). Bull. Earthq. Eng. 2014, 12, 311–339. [Google Scholar] [CrossRef] [Green Version]
  59. Bommer, J.J.; Dost, B.; Edwards, B.; Stafford, P.J.; Van Elk, J.; Doornhof, D.; Ntinalexis, M. Developing an Application-Specific Ground-Motion Model for Induced Seismicity. Bull. Seism. Soc. Am. 2015, 106, 158–173. [Google Scholar] [CrossRef] [Green Version]
  60. Graziotti, F. Contributions towards a Displacement-Based Seismic Assessment of Masonry Structures. Ph.D. Thesis, University School for Advanced Studies IUSS, Pavia, Italy, 2013. [Google Scholar]
  61. Pennucci, D.; Sullivan, T.J.; Calvi, G.M. Displacement Reduction Factors for the Design of Medium and Long Period Structures. J. Earthq. Eng. 2011, 15, 1–29. [Google Scholar] [CrossRef]
  62. American Society of Civil Engineers (ASCE). Minimum Design Loads and Associated Criteria for Buildings and Other Structures, ASCE/SEI 7-16; American Society of Civil Engineers: Reston, VG, USA, 2016; pp. 17–41.
  63. Miranda, E. Estimation of Inelastic Deformation Demands of SDOF Systems. J. Struct. Eng. 2001, 127, 1005–1012. [Google Scholar] [CrossRef]
  64. Lin, Y.-Y.; Miranda, E. Noniterative Equivalent Linear Method for Evaluation of Existing Structures. J. Struct. Eng. 2008, 134, 1685–1695. [Google Scholar] [CrossRef]
Figure 1. Oscillators and input ground motions for nonlinear time-history analyses (NLTHA): (a) elastoplastic idealization of monotonic acceleration-displacement (AD) response (adapted from [44]); (b) elastic response spectra in AD format of the Niijima Island earthquake (1 July 2000).
Buildings 11 00118 g001
Figure 2. Comparison between predicted and NLTHA ductility demands: definition of diagonal bins and percentile distances from the bisector.
Buildings 11 00118 g002
Figure 3. Comparison between ductility demands from the capacity spectrum method (CSM) by NPR 9998-18 and from NLTHA: (a) Suite 1-A, and (b) Suite 1-B.
Buildings 11 00118 g003
Figure 4. Comparison between the predictions by the CSM of NPR 9998-18 (solid lines) and the results from NLTHA of Suite 2-A (dashed lines): (a) median C R R T curves, and (b) median μ R R T curves.
Buildings 11 00118 g004
Figure 5. Comparison between ductility demands from the CSM by FEMA 440 and from NLTHA: (a) Suite 1-A, and (b) Suite 1-B.
Buildings 11 00118 g005
Figure 6. Comparison between the predictions by the CSM of FEMA 440 (solid lines) and the results from NLTHA of Suite 2-A (dashed lines): (a) median C R R T curves, and (b) median μ R R T curves.
Buildings 11 00118 g006
Figure 7. Comparison between ductility demand predictions from CSM and NLTHA on systems with T N L T H A < T C from Suite 1-A: (a) NPR 9998-18, and (b) FEMA 440. Relationships between spectral reduction factor and ductility according to (c) NPR 9998-18 and (d) FEMA 440. Application of the CSM to a system with T N L T H A < T C : (e) NPR 9998-18, and (f) FEMA 440.
Buildings 11 00118 g007
Figure 8. Comparison between ductility demands from the N2 method and from NLTHA: (a) Suite 1-A, and (b) Suite 1-B.
Buildings 11 00118 g008
Figure 9. Comparison between the predictions by the N2 method (solid lines) and the results from NLTHA of Suite 2-A (dashed lines): (a) median C R R T curves, and (b) median μ R R T curves.
Buildings 11 00118 g009
Figure 10. Comparison between ductility demands from the displacement coefficient method (DCM) by ASCE 41-17 and from NLTHA: (a) Suite 1-A, and (b) Suite 1-B.
Buildings 11 00118 g010
Figure 11. Comparison between the predictions by the DCM of ASCE 41-17 (solid lines) and the results from NLTHA of Suite 2-A (dashed lines): (a) median C R R T curves, and (b) median μ R R T curves.
Buildings 11 00118 g011
Figure 12. Comparison between ductility demands from the proposed optimal stiffness method (OSM) and from NLTHA: (a) Suite 1-A, and (b) Suite 1-B.
Buildings 11 00118 g012
Figure 13. Comparison between the predictions by the proposed OSM (solid lines) and the results from NLTHA of Suite 2-A (dashed lines): (a) median C R R T curves, and (b) median μ R R T curves.
Buildings 11 00118 g013
Figure 14. Comparison between ductility demands from the MN2 method and from NLTHA: (a) Suite 1-A, and (b) Suite 1-B.
Buildings 11 00118 g014
Figure 15. Comparison between the predictions by the MN2 method (solid lines) and the results from NLTHA of Suite 2-A (dashed lines): (a) median C R R T curves, and (b) median μ R R T curves.
Buildings 11 00118 g015
Table 1. Calibrated parameters for the proposed OSM equations.
Hysteresis Casemhyst (s)nhyst (-)
13 % ξ h y s t < 15 % 0.0670.040
15 % ξ h y s t 18 % 0.0650.059
18 % < ξ h y s t 20 % 0.0610.077
Table 2. Calibrated parameters for the proposed modified-N2 (MN2) equation [44].
Hysteresis Caseahyst (-)Thyst (s)
13 % ξ h y s t < 15 % 0.70.055
15 % ξ h y s t 18 % 0.20.030
18 % < ξ h y s t 20 % 0.00.022
Table 3. Percentile factors of displacement predicted by the proposed OSM for various percentiles.
PercentileIdealized Elastic Period (s)Overall
0.10.20.30.40.5
50th1.11.01.01.01.11.0
70th1.51.21.21.21.41.2
84th2.31.51.41.51.71.5
95th6.42.11.71.92.42.3
Table 4. Percentile factors of displacement demands predicted by the MN2 method for various percentiles.
PercentileIdealized Elastic Period (s)Overall
0.10.20.30.40.5
50th0.91.11.00.90.81.0
70th1.21.31.21.11.01.2
84th1.41.51.41.21.11.4
95th1.81.91.71.51.41.7
Publisher’s Note: MDPI stays neutral with regard to jurisdictional claims in published maps and institutional affiliations.

