
Optimising the Parameters of a Building Envelope in the East Mediterranean Saharan, Cool Climate Zone


Energy Engineering Department, School of Natural Resources Engineering and Management, German Jordanian University, Amman 11180, Jordan
Buildings 2021, 11(2), 43; https://doi.org/10.3390/buildings11020043
Submission received: 18 December 2020
/
Revised: 15 January 2021
/
Accepted: 21 January 2021
/
Published: 27 January 2021
(This article belongs to the Special Issue Net-Zero/Positive Energy Buildings and Districts)
Abstract
:Enhancing the energy efficiency and environmental sustainability of buildings is a significant global aim. New construction regulations are, therefore, geared specifically towards low-emission and energy-efficient projects. However, there are numerous and typically competitive priorities, such as making the most of energy usage in residential buildings. This leads to the complex topic of multi-objective optimisation. The primary aim of this research was to reduce the energy consumed for heating and cooling loads in residential buildings in Ma’an City, which is located in the Jordanian Saharan Mediterranean, a cool climate zone. This was achieved by optimising various design variables (window to wall percent, ground floor construction, local shading type, infiltration rate (ac/h), glazing type, flat roof construction, natural ventilation rate, window blind type, window shading control schedule, partition construction, site orientation and external wall construction) of the building envelope. DesignBuilder software (version 6.1) was utilised to run a sensitivity analysis (SA) for 12 design variables to evaluate their influence on both heating and cooling loads simultaneously using a regression method. The variables were divided into two groups according to their importance and a genetic algorithm (GA) was then applied to both groups. The optimum solution selected for the high-importance variables was based on minimising the heating and cooling loads. The optimum solution selected for the low-importance variables was based on the lowest summation of the heating and cooling loads. Finally, a scenario was devised (using the combined design variables of the two solutions) and simulated. The results indicate that the total energy consumption was 1186.21 kWh/year, divided into 353.03 kWh/year for the cooling load and 833.18 kWh/year for the heating load. This was compared with 9969.38 kWh/year of energy, divided into 3878.37 kWh/year for the heating load and 6091.01 kWh/year for the cooling load for the baseline building. Thus, the amount of energy saved was 88.1%, 94.2% and 78.5% for total energy consumption, cooling load and heating load, respectively. However, implementing the modifications suggested by the optimisation of the low-importance variables was not cost-effective, especially the external wall construction and partition construction, and therefore these design variables can be neglected in future studies.
1. Introduction
There is now a global movement towards ensuring more efficient energy consumption in all sectors to mitigate the massive increase in demand for energy and the depletion of natural resources. The residential sector accounts for a significant share of the energy consumed; especially electrical energy, which incurs substantial losses through generation, transmission and distribution. In Jordan, for instance, the residential sector consumes 45.4% of the electricity generated, and most of this energy is spent on heating and cooling loads. Jordan is, therefore, finding it increasingly difficult to meet the demand for energy. This makes it essential to implement energy-efficient technologies in building envelopes to minimise the energy wasted and ensure future sustainable development. Consequently, reducing the energy consumed in the residential sector has been a primary aim of governmental organisations and institutions in Jordan. This has resulted in the creation and dissemination of numerous public advertisements on the use of energy, several campaigns to replace lights in residences with more efficient alternatives, and the provision of incentives to install solar water heaters and solar panels. In addition, several codes and books have been published that describe the procedures for making buildings (both new and existing buildings) more energy-efficient. However, these instructions are not obligatory [1].
Researchers are thus seeking to determine the best ways to build such buildings or increase energy efficiency in existing buildings. They have ceaselessly strived to develop better construction materials, reduce costs, increase the energy-efficiency of buildings and improve thermal comfort. In particular, they have worked towards developing a novel solution to tackle the problem of energy consumption by residential buildings and the impact of this on the environment [1].
Ensuring buildings are more energy-efficient is imperative if the future use of energy is to be sustainable. For optimal thermal performance, there needs to be new, innovative designs for the construction of buildings. To achieve this, effective and accurate software programs are required that can correctly predict the performance of buildings in disparate conditions. However, current software is inadequate. To enhance the prediction of energy usage within buildings and lower their running costs, it is vital to address all relevant physical, social and environmental factors during construction [2].
With a focus on multi-objective optimisation, a group of researchers employed both MATLAB and Energy Plus to enhance the energy design of the casing of a building. The principal objectives were to evaluate overall energy-related global costs, primary energy consumption and discomfort hours. The variables measured were the thermo-physical properties of envelope components, the radiative properties of plasters, set point temperatures, window type and building orientation. A Pareto optimisation was performed using a genetic algorithm (GA) that yielded two optimal solutions: a nearly zero energy building (NZEB) that minimises PEC and a cost-optimal solution that minimises energy-related global cost (GC) [3].
The buildings in question were standard newly constructed residential buildings in four climate zones within the country of Italy:
- Zone B: Palermo, located in Sicily (Southern Italy);
- Zone C: Naples, located in Campania (Southern Italy);
- Zone D: Florence, located in Toscana (Central Italy);
- Zone E: Milan, located in Lombardy (Northern Italy).
Climatic Zone A was not considered because it includes only two municipalities; thus, its outcomes were not representative. The results indicate that set point temperatures for space conditioning have a substantial effect on the objective functions irrespective of climate zone, and that the solar absorbance of the external surfaces of roofs and vertical walls rises substantially from warmer to colder climate zones [3].
To identify the most practical and inexpensive design, another set of researchers applied passive design methods. Their objective was to combine external shading devices with self-shading envelopes in a 10-storey hotel building located in an extreme hot–humid zone in Saudi Arabia. DesignBuilder was utilised to perform modelling and energy simulations. Even though the baseline building did not have a solar shade, fibre glass insulation was installed in the walls and roofs while the windows were double-glazed in accordance with Saudi guidelines. The results indicate that the proposed shading reduced annual energy usage by 20.5%. The researchers estimated that two years would be needed to pay back the extra costs incurred by the use of passive shading [4].
Another study constructed and then validated a simulation model called the MEEDI, and created a graphic that depicted the results of a parametric sensitivity analysis of energy efficiency in diverse climates across Chile. The MEEDI measures the monthly energy usage of buildings, a process known as ISO 13790, and utilises two revised techniques to measure solar heat gains and the flow of heat through the floor. The economic viability of this method for construction envelopes was then evaluated. The results indicate that variations in building design can have a direct impact on overall energy efficiency. Worthwhile efficiency benefits and a reduction in carbon emissions can be achieved at reasonable costs through simple changes to the envelope materials. Depending on where in Chile they were located and the overall level of efficiency, payback times ranged from 5 to 27 years. The researchers acknowledged that while the MEEDI model can be employed to measure the precise energy demand within a typical Chilean home, it is sufficiently flexible to enable a breadth of scenarios to be tested. Thus, it can provide measures of efficiency for a disparate range of temperature conditions, envelope fabrics and energy systems [5].
Using DesignBuilder, three drawing halls were simulated on campus in a study conducted at Mansoura University in Egypt. The purpose was to enhance the energy efficiency within these halls according to three criteria: single- or multi-objective optimisation, intuitive or computerised optimisation and parametric or whole-design optimisation. Ignoring daylight requirements, the results indicated that ventilation system functionality, optimising the shade overhangs and louvres of windows, and low glazing transmittance reduced cooling loads by from 26% to 31% in comparison to the base case [6].
Another study employed DesignBuilder to simulate the thermal performance of a 145 square metre rural house in Beijing, North China. The objective was to implement passive energy modifications of the building envelope to decrease the energy consumed annually for heating purposes. The most salient modifications were replacing the traditional windows with double-glazed windows and installing thermal insulation within the building. The results indicated that these modifications saved 60% of the energy consumed for heating purposes [7].
Harkouss, Fardoun and Biwole (2018) conducted a comprehensive study to determine the optimal passive design for residential buildings. Utilising Köppen–Geiger climate classifications, TRNSYS (TRaNsient SYStem) software was employed to simulate the yearly energy usage, costs and comfort of a building in one city in each climate zone for twenty-five different climates. The objective was to determine the best way to lower energy demands (for cooling and heating) within the building and also the life-cycle cost (LCC). Effective passive cooling techniques such as blinds and natural ventilation were also introduced to increase the simulated levels of thermal comfort. The study comprised five phases: building energy simulation, optimisation, Multi-Criteria Decision Making (MCDM), a sensitivity study and an adaptive comfort analysis. The ideal passive solution reduced cooling requirements and heating requirements by 52%, 54% and 87%, respectively, compared to the base building. Furthermore, the passive cooling techniques were effective in substantially decreasing overheating and increasing levels of adaptive thermal comfort for residents [8].
Another study evaluated the effect of various climate zones in Australia (representing the primary global climates) on the thermal performance of a building. Design methods were developed to align with each climate zone in order to enhance thermal performance. AccuRate (rating software tools accredited by the Nationwide House Energy Rating Scheme in Australia) was then utilised to assess the thermal performance of the same building in different climate zones. The aim was to ensure that the right design would be employed for a building based on its surrounding climate. The optimal designs for each climate zone were then assessed against a variety of climate variables (wind speed and direction, solar radiation, rainfall and humidity) to develop a sustainable building that will substantially reduce energy consumption whilst maintaining the thermal comfort of residents [9].
Numerous studies have aimed to determine how to improve the energy consumption of buildings; they have found that energy estimation, from the design stage through scientific or practical calculations or simulation programs, was useful, particularly if followed by high-quality construction. The paper now reviews the findings of several studies that explore the relationship between climate factors and the basic design parameters affecting the thermal performance of buildings. Site analysis is the first stage of design. Orientation impacts the building’s overall thermal performance and the design of heating and cooling to maintain the thermal comfort of occupants [9].
One set of researchers examined the relationship between building orientation on-site and its thermal performance using Design builder as a simulation program that utilised climatic data on the selected location and data on the building envelope entered by the user. The researchers selected, for their sample, a house that matched the characteristics of 60% of the buildings in Jordan. The results showed that orienting the long axis of the building on the north–south axis had a clear impact on thermal performance. They found that positioning the largest glazing area to the south allowed the building to gain the desired heat in winter. The study also demonstrates the effect of orientations on the airflow inside the building crossing from west to east. Appropriate orientations helped minimise heat loss in the winter months and reduced heating energy by almost 35% compared to the Base Case building, indicating a marked improvement in overall thermal performance [10].
Regarding the windows and glazing of the building envelope, it will not be possible to apply any of the designed solar passive strategies unless a certain amount of solar radiation reaches the building facades. An investigation was conducted on an office building in Turkey to assess the influence of window designs and types on energy performance with respect to wall-to-windows area ratio, shading, orientation, geometrical shape and thermo-physical properties. Simulations of two common types of office room models were conducted with changes in parameters such as the window-to-wall ratio of the façade, total solar energy transmittance of the glazing and shading levels regarding orientations. The results indicated that the most influential parameter on annual energy consumption is the window-to-wall ratio. North-facing office units generate a tremendous energy demand while south-facing office units have the lowest energy demand during the heating season. The optimal configuration has a WWR between 40% and 60% during the heating season. There is no positive impact on increasing windows to wall ratio for the north façade in all locations. The primary recommendation is, therefore, to reduce the window size to decrease greenhouse gas emissions and achieve conditions of thermal comfort for the occupants [11].
Another study found that increasing the shading level of windows results in an incremental increase in annual heating consumption and a decrease in annual cooling consumption. The architectural glazing façade may result in massive energy consumption [12].
The thermal energy performance of a building is influenced by structural materials and slab types. The building structure is limited by multiple factors such as building shape, construction materials types. Several studies have shown that buildings with a high thermal mass require more time and energy to heat up and cool down. A study exploring the impact of concrete structures in Australia on energy performance used simulation programs to identify a benchmarking method for measuring the thermal energy performance of a building using two forms of construction (flat slab and waffle slab) and two types of concrete (normal conventional weight and novel Ultra-lightweight). This classification depends on the properties of the material, its ability to absorb and store heat, and its transmission [13].
The correct use of thermal mass in different climatic conditions depends on the region’s prevailing climate. Hot, humid weather (for example, tropical and sub-tropical) is most challenging in this environment, as night temperatures remain high. Its use is primarily as a temporary heat sink. However, it must occupy a strategic position to prevent overheating. It should be placed in an area that is not directly exposed to solar energy and allow adequate ventilation at night to move the stored energy away without further increasing internal temperatures. The results indicated that a higher concrete mass (thermal mass) stored more heat, which then reduced the peak indoor air temperatures, whereas ultra-lightweight concrete generated indoor temperatures that were more sensitive to fluctuations in external air temperatures. Hence, the building required more energy to achieve the desired indoor temperature range. Choosing the appropriate type of concrete and form of construction could reduce the annual cooling energy demand of a highly glazed office building by 14% in colder climate zones and 3% in warmer and hot climates [13].
Wall insulation with a scientific and efficient thermal insulation technology is an essential measure for energy conservation in buildings. The standard method employed to improve the performance of wall insulation is to integrate the insulation layer into the built foundation wall; however, this increases the construction cost and delays construction time due to the construction of both the foundation wall and the insulation layer. The selection of insulation materials is critically important and has a pronounced effect on building energy performance [14].
One study investigated climate responsive solutions in the vernacular architecture of Bushehr city and clarified the design features in the city. Notably, sustainability and adaptation were consistent in using the lowest costing materials and applications from the surrounding environment to create a comfortable environment. This depended on adapting to the climate as it is (passive techniques) rather than artificial building alternatives that support climate change (as is currently the case in the modern era). Vernacular buildings are architectural products that emerged as a response to the requirements of societies before the industrial period and to the insurmountable limits of artificial building created by the region and climate, because of the unique interaction between the human mind and experience gathered by observing natural phenomena in the vernacular buildings [15].
The effectiveness of the thermal performance of the design of this city has been achieved through urban planning concepts that take the climatic characteristics of the site, the relations between the orientation of buildings and the sun, direction and flow of air movement, whether distances between buildings are well organised and the existence of shaded crossing corridors that serve pedestrians into consideration. Designers also need to use the small spaces that separate the buildings to direct the airflow between blocks of buildings. The design for the comprehensive system within Bushehr city was completed by the unique features of individual unit design. This is the result of hundreds of years of optimisation to provide comfortable shelter in a local climate using available materials and known construction technologies [16].
The relationship between the climate zoning and energy performance of buildings, which was investigated during hot summer periods and their impact on a building’s thermal-energy behaviour, shows that in an urban area, it is essential to conduct a statistical analysis of microclimate variation during hot periods [17].
Building performance simulation can provide many measures in which an integrated design solution satisfies the design requirements and objectives. In sustainable buildings, it is beneficial to identify the most critical design parameters to develop efficient alternative design solutions or generate optimised design solutions. A sensitivity analysis makes it possible to identify the most critical parameters with respect to building performance, and to focus the design and optimisation of sustainable buildings on these extremely important parameters. Such an analysis will typically be performed at a reasonably early stage of the building design process, where it is still possible to influence such parameters [18].
Research by Zero Carbon Hub of 16 housing developments in the U.K. indicated that all the dwellings presented a higher measured heat loss than predicted. This mismatch between the energy performance predicted at the design stage and once the building is in operation is known as the energy performance gap. To overcome this gap, the researchers investigated the relation between thermal performance and defects, utilising a defects classification system that provides a methodology for defect identification and collection. The construction community needs optimal solutions to comprehensively deal with the design through all stages of construction, starting with good design, simulation of energy assessments, highly efficient construction methods and an awareness of users’ behaviour [19].
Other researchers compared different solutions to identify retrofit strategies for a historic building envelope using energy plus and the Pareto method. The main result of the multi-objective optimisation was the generation of eight optimal solutions for the sensitivity analysis with no significant change in energy consumption for cold and hot climates. However, for a hot climate, natural ventilation was necessary in addition to thermal insulation to guarantee human comfort with different costs for these solutions [20].
Another study was conducted to create an effective balance between investment costs, energy consumption and indoor environment quality in residential high-rise buildings. This involved evaluating the effects of varying parameters of energy usage for heating and cooling in each Chinese climate zone. WUFI®Plus (Wärme Und Feuchte Instationär—which, translated, means heat and moisture transiency developed by Fraunhofer Institute for Building Physics in Stuttgart, Germany), simulations were conducted for a base building that complied with energy-efficiency codes for Chinese buildings and for buildings where design parameters differed according to the climate zone. The three most sensitive parameters were then identified and the reductions in overall energy demand for each climate zone estimated, as presented in Table 1 [21]:
Even though more suitable indoor temperatures result in higher heating and cooling loads, the energy demand associated with the additional heating and cooling loads can be reduced by enhancing the design of the building envelope. Table 2 summarises research on the different design variables and their influence on the thermal performance and comfort of the building.
DesignBuilder software was employed in another study to compare wall and roof thermal insulation with no heat insulation in a standard 100 square metre residential apartment on the 3rd floor of a three-storey building in Egypt. The sensible cooling load, air-conditioner energy usage rate, energy usage charge, and the CO2 emitted by the power station were measured in terms of energy consumed where the room temperature was set at 24, 22 and 20 °C, respectively. The results indicated that thermal insulation (glass wool blanket), 0.05 m thick in the walls and roof of the floor, meant that 40% of the electricity consumed by the air conditioner significantly reduced the operational costs. Moreover, the energy saved reduced the CO2 generated by the power plant as a result of increased energy use in the residential building by 30% [37].
The present research aimed to minimise the energy consumed by heating and cooling loads in residential buildings in Ma’an City, which is situated in the Jordanian Saharan Mediterranean, with a cool climate zone. This was achieved by optimising various design variables (window to wall percent, ground floor construction, local shading type, infiltration rate (ac/h), glazing type, flat roof construction, natural ventilation rate, window blind type, window shading control schedule, partition construction, site orientation and external wall construction) of the building envelope.
The research consisted of four phases:
- Using DesignBuilder simulation software to develop a three-dimensional model of a typical Jordanian building that complies with local codes and instructions;
- Establishing the design parameters and associated values on which to perform the optimisation;
- Conducting a sensitivity analysis to ascertain the importance of the design variables and then group them accordingly;
- Conducting an optimisation by performing multiple random simulations and selecting an optimised solution from the vast number of design parameter configurations that were generated.
2. Materials and Methods
This section explains the process of optimising several design parameters of a building envelope in the Jordanian Saharan Mediterranean cool climate zone. This involved utilising DesignBuilder software to simulate the thermal performance of a baseline building, evaluating the sensitivity of the design parameters on its heating and cooling loads, and devising an optimised solution for these design parameters.
2.1. Location and Climate
Jordan is located between the Arabian Desert and the eastern Mediterranean area; hence, its climatic conditions are characterized by long, hot and dry summers and short and cold winters. December, January, and February are the coldest months, with average maximum/minimum temperatures of 10 and 5 °C, respectively, while July, August, and September are the hottest months, with average maximum/minimum temperatures of 35 and 20 °C. During the summer, daily temperatures can, in some cases, reach or even exceed 40 °C, especially when a hot, dry southeastern wind blows. In winter, significant amounts of precipitation of between 200 and 400 mm fall, and these decrease/stop during the summer season. Within Jordan, there are different climate zones, some of which are similar to the Mediterranean climate while others are almost identical to a desert climate. The Jordanian weather comprises four distinct seasons in which autumn and spring are within the ideal comfort range for humans.
Situated in the Saharan Mediterranean cool climate zone, the city of Ma’an is the largest governorate in Jordan, with an area of 32,832 km2 (37% of Jordan’s overall land area). It is characterised by a cold Saharan climate with hot summers and mild to cold winters. Precipitation is rare, with an annual average of 40 mm [38].
2.2. Building Baseline Specifications and Shape
This typical building comprised a living room, saloon, kitchen, storage room, master bedroom and two other bedrooms, and two bathrooms with a total area of around 186 m2. Every room was identified as a separate zone, as shown in Figure 1 and Figure 2. The building is oriented where the long axis faces the south–north axis. The building does not have external shading or wind hurdles, which results in a significant amount of solar radiation entering the building.
The building envelope materials and its specifications were developed based on typical Jordanian architectural design and adhere to Jordanian building codes. These were applied to the DesignBuilder software as follows.
2.2.1. Walls, Floor and Roof
The building external, internal, roof and floor materials specification and configuration illustrated in Table 3, where the U-Value is the thermal transmittance.
2.2.2. External Windows Glazing and Frame
The external windows glassing materials’ specification and configuration are illustrated in Table 4.
External windows glassing surrounded with thermally broken aluminium frame (polyvinyl chloride (PVC)) with U-value = 5.01 W/m2·K.
2.3. Simulation Software
DesignBuilder software (version 6.1) was used to stimulate the energy performance of the building. This is an EnergyPlus-based software tool that analyses building energy, including heating, cooling, lighting, and ventilation. It is also employed to control and measure building carbon, cost, and daylighting performance. DesignBuilder provides a simple and user-friendly way to simulate and optimise the building envelope and environment through rapid comparison of the performance of different building elements. DesignBuilder allows the user to examine the effect of changing each building envelope material on energy performance and consumption in the building.
2.3.1. Energy Retrofit Strategies
To enhance the overall thermal performance of each Jordanian climate, several design variables were considered.
2.3.2. Temperature Set Point of Heating and Cooling
Temperature set points of heating and cooling systems have a significant effect on energy consumption in the building. However, these were fixed at 19 °C for the heating system and 24 °C for the cooling system, as the aim was to reduce heating and cooling loads while maintaining existing levels of thermal comfort.
2.3.3. Building Orientation
An optimum building orientation may reduce energy consumption in the building. To select the most energy-efficient orientation, the base case design was rotated from 0° to 360° in steps of 5° while noting that the base case has a rotation of 90°.
2.3.4. Thickness of External Wall Insulation
The thermal transmittance (U-value) of external walls has a tangible effect on the overall heating and cooling load in the building. Therefore, the effect of increasing insulation thickness was investigated. Table 5 shows how the U-value of the external wall changes as the insulation thickness increases.
2.3.5. Thickness of Roof Insulation
The thermal transmittance (U-value) of roof is one of the main elements of the building envelope. Therefore, the effect of increasing the thickness of the thermal insulation layer was tested. Table 6 illustrates how the U-value of the roof changes as the insulation thickness increases.
2.3.6. Thermal Mass of Internal Walls
The effect of changing the thermal mass of the internal walls was also tested. Table 7 shows the specifications of the thermal masses that were tested for the construction of the internal walls.
2.3.7. Floor Insulation
The effect of insulating the floor with different thicknesses of thermal insulation was tested. Table 8 shows how the U-value of the floor changes as the insulation thickness increases.
2.3.8. Glassing Type
The features and specification of glassing materials have a significant effect on energy performance. Therefore, several glassing types were investigated to examine their effect on heating and cooling loads in buildings. Table 9 presents the specification for different types of glassing.
2.3.9. Window-to-Wall Ratio
Windows are an important element in the building envelope and have a significant impact on heating and cooling loads. This is because they facilitate energy gain from the sun radiation while increasing the infiltration rate and thermal conductivity between the building and the outside environment. Window-to-wall ratios were calculated by dividing total building glazed area by its external wall area.
Therefore, window-to-wall ratios from 0% to 100% were investigated in steps of 1%.
2.3.10. Infiltration Rate (Air Leakage)
Infiltration rate is defined as air leaking into the building from the external environment through cracks, openings, and doors. It is measured in air change per hour (ac/h). Different infiltration rates from 0.25 to 1.5 (ac/h) were tested.
2.3.11. Local (External) Shading
2.3.12. Window Shading Type and Schedule
Window shading devices are tools that cover the window-glassing surface which can be opened or closed to allow or prevent the radiation, or a portion of it, from entering the building, depending on their reflectance and transmittance properties.
Therefore, different types of diffusing shades with different light properties were tested to determine their influence on heating and cooling loads (see Table 11). Additionally, 11 schedules controlling the opening of the window shading were tested.
2.3.13. Natural Ventilation Rate and Schedule
If managed effectively, natural ventilation is extremely useful for lowering the heating and cooling loads by raising the level of heat exchange between the inside and outside of the building according to the difference in temperature.
With a schedule based on room occupancy, the rate of natural ventilation was, therefore, measured in steps of 0.1 (ac/h) from 0 to 5 (ac/h).
2.4. Sensitivity Analysis
It may not be possible to find an optimum solution using a local sensitivity analysis method or by testing one variable at a time, as the design variables might exert an interaction effect on heating and cooling loads. Therefore, an optimisation process for all such variables needs to be performed. However, this could be extremely time-consuming as there may be a large number of variables generating vast combinations of simulations.
To accelerate the optimisation, both global uncertainty and a sensitivity analysis need to be performed to identify those variables that have the largest and smallest effects on the required outcomes and reduce the number of variables involved.
There are several forms of sensitivity analysis (Fourier amplitude sensitivity testing (FAST), Morris, Regression) that can be employed to determine the relationship between the design variables and the required outcomes.
Regression was applied in this study as it is an existing feature in DesignBuilder and can be applied to obtain detailed data for complex models. In this research, the objectives were heating and cooling load, the key indicator that identifies the most and least important variables was the Standardised Regression Coefficient (SRC), and the design variables were those listed in Energy Retrofit Strategies section. To yield accurate results, the following points needed to be addressed:
- Although the number of random simulations is typically 1.5 to 10 times greater than the number of variables, DesignBuilder proposes a number equal to or greater than 10 times this number, with 12 main variables, some of which could have at least 16 possible values, the sample size in this study was 1200 random simulations (100 times the number of variables);
- To define the variables, DesignBuilder orders values in ascending or descending order; for instance, increasing or decreasing U-values for external wall insulation;
- When performing a sensitivity analysis, DesignBuilder suggests avoiding choices with similar values. For example, the U-value of the wall will not change if the insulation is placed at a different location within the wall.
2.5. Optimisation
Having performed the sensitivity analysis, the design variables are divided into two groups according to their effect on heating and cooling loads: a high-importance group and a low-importance group.
Optimisation is then performed, which involves searching for and selecting the design options that are likely to be most efficient in achieving the required objectives.
As such, optimisation is similar to a process in which the performance of objectives changes in line with alterations in the design variables of the building.
To search for optimal design options, DesignBuilder employs genetic algorithms (GA). This is a superior method to parametric regression as a greater number of variables can be included (up to 10), along with two objectives, which, in this research, are “minimising heating load” and “minimising cooling load”.
The process is iterative in that first a population of random values are generated (known as a “generation”). Each generation measures the fitness of variables in this population according to the value of the objective function. The fittest individuals are then selected on a stochastic basis and, through recombination and spontaneous mutation, their genomes are employed to create a new generation. Subsequent iterations of the algorithm then utilise the most recent generation of potential solutions. The algorithm usually terminates when the population has achieved a sufficient level of fitness or a specified number of generations have been produced.
The results of the simulated output of each combination of variables are then depicted on a graph with heating on one side and cooling on the other. The minimum values form the “Pareto Front” of optimal designs on the left bottom of the cloud datapoint.
Optimisation was performed with a random sample of 6000 simulations for the high-importance group and 2000 simulations for the low-importance group.
The solutions with the lowest summation of heating and cooling loads for both groups were then selected and combined and a simulation performed to determine whether any further reduction in heating and cooling loads could be achieved.
3. Results and Discussion
To optimise several design parameters of a building envelope, a baseline residential building was designed, and its thermal performance evaluated using DesignBuilder software. This was extremely important as it enabled the thermal performance of various designs to be compared, to assess which have a positive or negative effect on the thermal performance of the building.
3.1. Baseline Building
The simulation indicated that, for Saharan Mediterranean, cool climate zones (Ma’an, Jordan), the annual consumption of energy in a baseline building is 6091.01 and 3878.37 kWh/year for the cooling load and the heating load, respectively.
3.2. Sensitivity Analysis
Using the impeded feature in DesignBuilder, a sensitivity analysis was conducted on 12 design variables. The particular method applied was regression where the indicating factor was the Standardised Regression Coefficient (SRC) and the number of random simulations was chosen to be 100 times the number of design variables.
As presented in Figure 4, the SRC of the cooling load indicates that cooling load is most strongly influenced by window-to-wall percent. The input and output are directly related. Increasing window-to-wall percent, therefore, increases cooling load. Cooling load is also strongly influenced by ground floor construction and local shading type, and moderately influenced by flat roof construction, infiltration (ac/h), natural ventilation rate, window blind type, glazing type, and window shading control schedule. External wall construction, partition construction, and site orientation do not have any notable influence on cooling load and can, therefore, be ignored in further analysis of the cooling load for this model.
As depicted in Figure 5, the SRC of the heating load indicates that it is most strongly influenced by infiltration (ac/h). The input and output are directly related. Increasing infiltration (ac/h), therefore, increases heating load. Heating load is strongly influenced by glazing type and window-to-wall percent and moderately influenced by local shading type. Site orientation, flat roof construction, window blind type, partition construction, external wall construction, window shading control schedule, ground floor construction, and natural ventilation rate do not have any notable influence on heating load and can, therefore, be ignored in further analysis of the heating load for this model.
The design variables were then categorised according to their importance for heating and cooling loads, as presented in Table 12. This made it easier to determine which variables to include/exclude in the optimisation process.
Thus, two groups of design variables were identified.
A high-importance group (window-to-wall per cent, ground floor construction, local shading type, infiltration rate (ac/h), glazing type, flat roof construction, natural ventilation rate, window blind type, window shading control schedule) was identified. Based on Table 12 and the SRC graphs, because the cooling load is the dominant, window-to-wall ratio, glazing type, and local shading type will most likely be optimised to prevent the solar gain in summer rather than allowing it to reduce the heating load. Decreasing the U-Value of the flat roof construction and ground floor construction is too expensive but can reduce both heating and cooling loads, albeit with different levels of importance, as increasing the insulation thickness will prevent heat exchange through the large area between the internal space and the outside environment and ground. This will be most effective in preventing heat exchange with the cold air in the summer season, as the cooling load has the highest annual energy consumption. Conversely, the infiltration rate has the highest negative impact on the heating load as it will leak the heat contained in the building to the outside environment while having a slight impact on the cooling load. The infiltration rate can be noticeably reduced at a relatively low cost by applying insulation material on windows edges, wall cracks and doors frames.
A low-importance group (partition construction, site orientation, external wall construction) was identified. These variables have a low influence on heating and cooling loads and, in most cases, increasing their insulation thickness or using better insulation material is extremely expensive. Thus, they will most likely be kept, as they meet the standards, but will still be considered in the optimisation to determine their most suitable values. Site orientation, by contrast, is usually restricted by the land shape and location, but this research considers no such restrictions when determining the optimal orientation. Window blind type and its control schedule depend on the resident’s awareness; if they were installed efficiently, they will slightly reduce heating and cooling loads at a low cost.
3.3. Optimisation
The GA technique embedded in DesignBuilder was deployed optimise the two groups of design variables by setting the objectives of the optimisation to minimise heating and cooling loads using 6000 and 2000 random simulations for the high-importance group and low-importance group, respectively.
3.3.1. High Importance Variables
The 6000 solutions from the random simulations are presented in Figure 6, along with their related heating and cooling loads. The Pareto Front (the most optimal solutions) is highlighted in orange.
Although the original aim was to investigate three solutions (minimising cooling load, minimising heating load, minimising the summation of heating and cooling loads); the fact that the cooling load was dominant in the Saharan Mediterranean cool climate zone meant that the arrangement of solutions based on cooling load (from the smallest to the highest) and the summation of heating and cooling loads were almost identical. Thus, two solutions were considered (minimising heating load, minimising heating and cooling load).
3.3.2. Minimising Heating Load
Because the heating load of the baseline building was extremely low, it was easy to overcome by optimising the high-importance design variables. This was clearly demonstrated in the results of the random simulations, where two of the Pareto solutions had a heating load close to zero and, in 21 solutions, the heating load was less than 10 kWh/year. For these 21 solutions, the cooling load ranged from 14,522.51 to 37,718.28 kWh/year.
Thus, the optimal solution for optimising the heating load regardless of the cooling load will lead to a total energy consumption of 14,532.11 kWh/year. This is higher than the energy consumption of 9969.38 kWh/year for the baseline building. Hence, this optimisation is neglected.
3.3.3. Minimising Both Heating and Cooling Loads
The solution with the lowest summation of heating and cooling was chosen as the total energy consumption for this solution was 1624.34 kWh/year, divided into 718.70 kWh/year for the cooling load and 905.64 kWh/year for the heating load. The design variables for this solution are presented in Table 13.
The optimal solution of optimising both heating and cooling load simultaneously was, therefore, chosen for further analysis.
3.3.4. Low Importance Variables
Figure 7 presents the cloud of random simulations for the low-importance group of variables and the Pareto Front (the most optimal solutions).
Among the 2000 solutions generated, the Pareto Front (optimal solutions) indicates that there only 10 optimum solutions in which the cooling load ranged from 5116.30 to 5205.97 kWh/year and the heating load ranged between 3336.62 and 3697.54 kWh/year.
The small range for these loads was predicted, as the modified design variables were shown to have low importance by the sensitivity analysis. Thus, only the solution with the lowest summation of heating and cooling was chosen as the total energy consumption for this solution is 8525.06 kWh/year, divided into 5182.44 kWh/year for the cooling load and 3342.62 kWh/year for the heating load. The design variables for this solution are presented in Table 14.
3.3.5. Optimal Solution
After choosing the optimum solution for both high- and low-importance variables, the design variables of the two solutions were combined and a simulation for heating and cooling load of the building was created. Total energy consumption was then further reduced to 1186.21 kWh/year, divided into 353.03 kWh/year for the cooling load and 833.18 kWh/year for the heating load. However, the reduction in energy consumed by implementing the modification suggested by the optimisation of the low-importance design variables did not appear to be cost-effective, particularly the external wall construction and partition construction.
4. Conclusions
Buildings consume almost 40% of the world’s energy and emit one-fifth of the total CO2 emissions. These numbers can be reduced by the application of passive design strategies, such as a design for climate. This research conducted an optimisation for the main design variables in a building in Ma’an, which is situated in the Jordanian Saharan Mediterranean, cool climate zone. The aim was to reduce the consumption of heating and cooling loads while maintaining the current levels of thermal comfort provided by existing heating and cooling systems.
A simulation of the thermal performance of a baseline building was conducted, which indicated that the baseline building will consume 9969.38 kWh/year of energy, divided into 3878.37 kWh/year for the heating load and 6091.01 kWh/year for the cooling load.
A sensitivity analysis (SA) was then conducted for 12 design variables to evaluate their influence on both heating and cooling loads simultaneously using a regression method with 1200 random runs. Based on the results, the variables were divided into two groups according to their importance: a high-importance group (window-to-wall percent, ground floor construction, local shading type, infiltration rate (ac/h), glazing type, flat roof construction, natural ventilation rate, window blind type, window shading control schedule) and a low-importance group (partition construction, site orientation, external wall construction). A genetic algorithm (GA) was employed for both the high-importance and low-importance groups. The final results indicated a reduction in energy consumption of 88.1%, 94.2% and 78.5% for total energy consumption, cooling load and heating load, respectively. The total amount of energy saved as a result of the simulation was 1186.21 kWh/year, divided into 353.03 kWh/year for the cooling load and 833.18 kWh/year for the heating load.
These results will help to enhance the codes and the role of public authorities and provide them with an effective evaluation for buildings. This will enable them to develop a plan to spread awareness about the environment and its relationship with buildings and to minimise the footprint of the residential sector. It is important to focus on all types of energy consumption and introduce renewable energy techniques to achieve a net zero energy building.
Numerous priorities, such as maximising energy usage, lowering financial costs, and minimising environmental effects, should be taken into consideration in the optimum design of residential buildings. This makes the complex topic of multi-objective optimisation an important factor to consider in future research.
Funding
This research received seed grant fund (SNERM 04/2018) provided by the deanship of graduate studies and research at the German Jordanian University.
Institutional Review Board Statement
Not applicable.
Informed Consent Statement
Not applicable.
Data Availability Statement
No new data were created or analyzed in this study. Data sharing is not applicable to this article.
Acknowledgments
the author thankful for the seed grant fund (SNERM 04/2018) provided by the deanship of graduate studies and research at the German Jordanian University.
Conflicts of Interest
The author declares no conflict of interest.
References
- National Electric Power Company. NEPCO Annual Report. 2017. Available online: http://www.nepco.com.jo/store/docs/web/2017_en.pdf (accessed on 14 June 2020).
- Al-Addous, M.; Albatayneh, A. Knowledge gap with the existing building energy assessment systems. Energy Explor. Exploit. 2020, 38, 783–794. [Google Scholar] [CrossRef] [Green Version]
- Ascione, F.; Bianco, N.; Mauro, G.M.; Napolitano, D.F. Building envelope design: Multi-objective optimization to minimize energy consumption, global cost and thermal discomfort. Application to different Italian climatic zones. Energy 2019, 174, 359–374. [Google Scholar] [CrossRef]
- Alhuwayil, W.K.; Mujeebu, M.A.; Algarny, A.M.M. Impact of external shading strategy on energy performance of multi-story hotel building in hot-humid climate. Energy 2019, 169, 1166–1174. [Google Scholar] [CrossRef]
- Simon, F.; Ordoñez, J.; Girard, A.; Parrado, C. Modelling energy use in residential buildings: How design deci-sions influence final energy performance in various Chilean climates. Indoor Built Environ. 2019, 28, 533–551. [Google Scholar] [CrossRef]
- Samaan, M.M.; Farag, O.; Khalil, M. Using simulation tools for optimizing cooling loads and daylighting levels in Egyptian campus buildings. HBRC J. 2018, 14, 79–92. [Google Scholar] [CrossRef] [Green Version]
- Liang, X.; Wang, Y.; Zhang, Y.; Jiang, J.; Chen, H.; Zhang, X.; Roskilly, T. Analysis and optimization on energy per-formance of a rural house in northern China using passive retrofitting. Energy Procedia 2017, 105, 3023–3030. [Google Scholar] [CrossRef]
- Harkouss, F.; Fardoun, F.; Biwole, P.H. Passive design optimization of low energy buildings in different climates. Energy 2018, 165, 591–613. [Google Scholar] [CrossRef]
- Albatayneh, A.; Alterman, D.; Page, A.; Moghtaderi, B. The significance of building design for the cli-mate. Environ. Clim. Technol. 2018, 22, 165–178. [Google Scholar] [CrossRef] [Green Version]
- Alshboul, A.A.; Alkurdi, N.Y. Enhancing the Strategies of Climate Responsive Architecture, The Study of Solar Accessibility for Buildings Standing on Sloped Sites. Mod. Appl. Sci. 2019, 13, p69. [Google Scholar] [CrossRef] [Green Version]
- Altun, A.F.; Kılıç, M. Influence of Window Parameters on the Thermal Performance of Office Rooms in Different Climate Zones of Turkey. Int. J. Renew. Energy Res. 2019, 9, 226–243. [Google Scholar]
- Luo, Y.; Zhang, L.; Wang, X.; Xie, L.; Liu, Z.; Wu, J.; He, X. A comparative study on thermal performance evalua-tion of a new double skin façade system integrated with photovoltaic blinds. Appl. Energy 2017, 199, 281–293. [Google Scholar] [CrossRef]
- Robati, M.; Kokogiannakis, G.; McCarthy, T.J. Impact of structural design solutions on the energy and thermal performance of an Australian office building. Build. Environ. 2017, 124, 258–282. [Google Scholar] [CrossRef]
- Li, J.; Meng, X.; Gao, Y.; Mao, W.; Luo, T.; Zhang, L. Effect of the insulation materials filling on the thermal per-formance of sintered hollow bricks. Case Stud. Therm. Eng. 2018, 11, 62–70. [Google Scholar] [CrossRef]
- Motealleh, P.; Zolfaghari, M.; Parsaee, M. Investigating climate responsive solutions in vernacular architecture of Bushehr city. HBRC J. 2018, 14, 215–223. [Google Scholar] [CrossRef]
- Shi, L.; Zhang, H.; Li, Z.; Luo, Z.; Liu, J. Optimizing the thermal performance of building envelopes for energy saving in underground office buildings in various climates of China. Tunn. Undergr. Space Technol. 2018, 77, 26–35. [Google Scholar] [CrossRef]
- Pyrgou, A.; Castaldo, V.L.; Pisello, A.L.; Cotana, F.; Santamouris, M. On the effect of summer heatwaves and ur-ban overheating on building thermal-energy performance in central Italy. Sustain. Cities Soc. 2017, 28, 187–200. [Google Scholar] [CrossRef]
- Heiselberg, P.; Brohus, H.; Hesselholt, A.; Rasmussen, H.; Seinre, E.; Thomas, S. Application of sensitivity analysis in design of sustainable buildings. Renew. Energy 2009, 34, 2030–2036. [Google Scholar] [CrossRef] [Green Version]
- Alencastro, J.; Fuertes, A.; De Wilde, P. The relationship between quality defects and the thermal performance of buildings. Renew. Sustain. Energy Rev. 2018, 81, 883–894. [Google Scholar] [CrossRef]
- Roberti, F.; Oberegger, U.F.; Lucchi, E.; Gasparella, A. Energy retrofit and conservation of built heritage using multi-objective optimization: Demonstration on a medieval building. In Proceedings of the Building Simulation Applications, Bolzano, Italy, 4–6 February 2015; pp. 4–6. [Google Scholar]
- Zhao, M.; Künzel, H.M.; Antretter, F. Parameters influencing the energy performance of residential buildings in different Chinese climate zones. Energy Build. 2015, 96, 64–75. [Google Scholar] [CrossRef]
- Lomas, K.J.; Eppel, H. Sensitivity analysis techniques for building thermal simulation programs. Energy Build. 1992, 19, 21–44. [Google Scholar] [CrossRef]
- Sanchez, D.G.; Lacarrière, B.; Musy, M.; Bourges, B. Application of sensitivity analysis in building energy simula-tions: Combining first-and second-order elementary effects methods. Energy Build. 2014, 68, 741–750. [Google Scholar] [CrossRef] [Green Version]
- Tian, W.; De Wilde, P. Uncertainty and sensitivity analysis of building performance using probabilistic climate projections: A UK case study. Autom. Constr. 2011, 20, 1096–1109. [Google Scholar] [CrossRef]
- Albatayneh, A.; Alterman, D.; Page, A.; Moghtaderi, B. The Significance of Sky Temperature in the Assessment of the Thermal Performance of Buildings. Appl. Sci. 2020, 10, 8057. [Google Scholar] [CrossRef]
- Albatayneh, A.; Alterman, D.; Page, A.; Moghtaderi, B. Alternative Method to the Replication of Wind Effects into the Buildings Thermal Simulation. Buildings 2020, 10, 237. [Google Scholar] [CrossRef]
- Burhenne, S. Monte Carlo Based Uncertainty and Sensitivity Analysis for Building Performance Simulation; Shaker Verlag: Herzogenrath, Germany, 2013. [Google Scholar]
- Ioannou, A.; Itard, L.C. Energy performance and comfort in residential buildings: Sensitivity for building param-eters and occupancy. Energy Build. 2015, 92, 216–233. [Google Scholar] [CrossRef]
- Bre, F.; Silva, A.S.; Ghisi, E.; Fachinotti, V.D. Residential building design optimisation using sensitivity analysis and genetic algorithm. Energy Build. 2016, 133, 853–866. [Google Scholar] [CrossRef]
- Albatayneh, A.; Alterman, D.; Page, A.; Moghtaderi, B. The Significance of the Adaptive Thermal Comfort Limits on the Air-Conditioning Loads in a Temperate Climate. Sustainability 2019, 11, 328. [Google Scholar] [CrossRef] [Green Version]
- Albatayneh, A.; Alterman, D.; Page, A.; Moghtaderi, B. The Significance of Temperature Based Approach Over the Energy Based Approaches in the Buildings Thermal Assessment. Environ. Clim. Technol. 2017, 19, 39–50. [Google Scholar] [CrossRef] [Green Version]
- Albatayneh, A.; Alterman, D.; Page, A.; Moghtaderi, B. The Impact of the Thermal Comfort Models on the Predic-tion of Building Energy Consumption. Sustainability 2018, 10, 3609. [Google Scholar] [CrossRef] [Green Version]
- Albatayneh, A.; Alterman, D.; Page, A.; Moghtaderi, B. Development of a new metric to characterise the buildings thermal per-formance in a temperate climate. Energy Sustain. Dev. 2019, 51, 1–2. [Google Scholar] [CrossRef]
- Li, H.; Wang, S.; Cheung, H. Sensitivity analysis of design parameters and optimal design for zero/low energy buildings in subtropical regions. Appl. Energy 2018, 228, 1280–1291. [Google Scholar] [CrossRef]
- Gagnon, R.; Gosselin, L.; Decker, S. Sensitivity analysis of energy performance and thermal comfort throughout building design process. Energy Build. 2018, 164, 278–294. [Google Scholar] [CrossRef]
- Shen, H.; Tzempelikos, A. Sensitivity analysis on daylighting and energy performance of perimeter offices with automated shading. Build. Environ. 2013, 59, 303–314. [Google Scholar] [CrossRef]
- An-Naggar, A.S.; Ibrahim, M.A.; Khalil, E.E. Energy Performance Simulation in Residential Buildings. Procedia Eng. 2017, 205, 4187–4194. [Google Scholar] [CrossRef]
- Fick, S.E.; Hijmans, R.J. WorldClim 2: New 1-km spatial resolution climate surfaces for global land areas. Int. J. Climatol. 2017, 37, 4302–4315. [Google Scholar] [CrossRef]
Figure 1.
Layout of the building.

Figure 2.
3D model of the building.

Figure 3.
Local shading techniques (overhangs, louvers, and side fins).

Figure 4.
Cooling load sensitivity analysis.
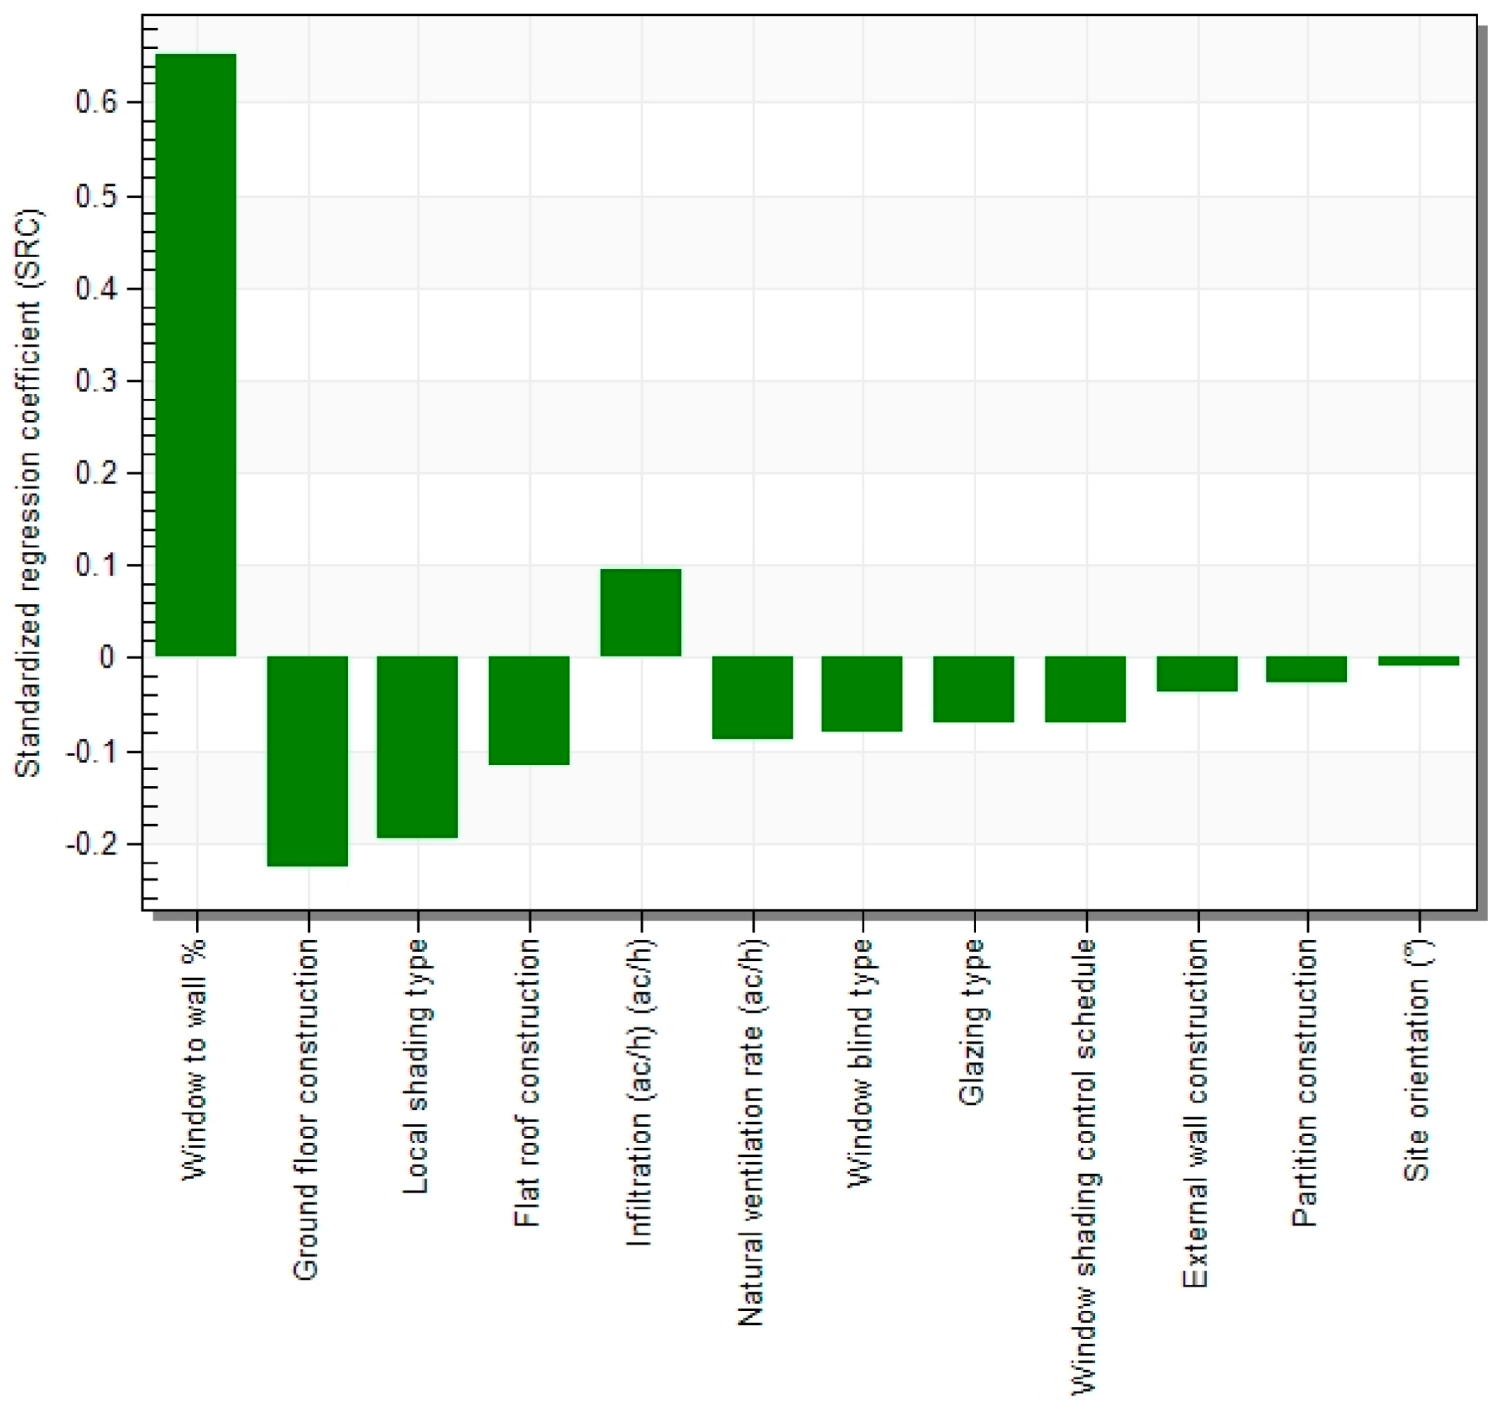
Figure 5.
Heating load sensitivity analysis.

Figure 6.
Optimisation of high-importance variables—optimisation analysis results—minimise heating load and cooling load.
Figure 6.
Optimisation of high-importance variables—optimisation analysis results—minimise heating load and cooling load.

Figure 7.
Optimisation of low-importance variables, minimise cooling load and heating load.


Table 1.
Sensitive design parameters and energy reduction for Chinese climate zones.
| Climate Zone | Sensitive Design Parameters | Maximum Energy Saving kWh/(m2 per Year) |
|---|---|---|
| Very cold and cold zones | Air tightness, thermal transmittance (U-value) of external windows/glass door and insulation thickness | 75 |
| Warm winter and hot summer zone | Insulation thickness, solar protection and solar heat gain coefficient (SHGC) of external windows/glass door | 50 |
| Cold winter and hot summer zone | air tightness, insulation thickness, and solar protection | 40 |
| Mild climate zone | Insulation thickness, air tightness and U-value of external windows/glass door | 35 |
Table 2.
Research on the different design variables.
| Input Variables | Output Variables | Type of Study | Aim of Research | Ref. |
|---|---|---|---|---|
| 70 input parameters, for instance: thermostat set points, ground reflectivity, surface convection coefficients, thermal conductivity of materials, solar radiation, heat gains. | Energy consumption, Peak power demand. | Sensitivity analysis: differential sensitivity analysis (DSA), Monte Carlo analysis (MCA), and stochastic sensitivity analysis (SSA) | Passive solar, single zone buildings tested for application of different sensitivity analysis methods | [22] |
| 24 variables, including: building height, length, width, rotation, view factor of the ground, ground reflectivity, insulation thickness, glazing ratio, weather parameters, setpoint temperature, ventilation rates, variables concerning occupancy and building environment | Yearly heating loads, Heating load per m3, Heating power, Summer comfort factor. | Sensitivity analysis (Morris method and the function analysis system technique (FAST)) | Thermal comfort and heating/cooling loads assessment | [23] |
| Typical parameters: weather conditions physical properties of building materials, internal heat gains (occupancy, metabolic rate, equipment, lighting, set point temperature), interventions in building fabric and systems, infiltration rate, chiller coefficient of performance (COP), boilers efficiency. | Annual heating energy, Annual cooling energy, Carbon emissions | Sensitivity analysis standardized regression coefficients (SRC) method; Uncertainty analysis | University building renovation scenarios assessed regarding changing climate conditions | [24] |
| Sky temperature, wind effect | Internal air temperature | Computational fluid dynamics (CFD) | Find ways to simulate sky temperature and wind effect | [25,26] |
| U-values of building components, ACH, heat recovery, thermal bridges | Annual heating energy per m2 floor area, Cost-benefit analysis based on sampling results. | Sensitivity analysis (Sobol sampling) and Uncertainty analysis | 3 case studies combining cost–benefit calculation and bps | [27] |
| Orientation, U-Wall, U-Roof, U-Floor, U-Windows, solar heat gain coefficient, window frame thickness, Thermo control, ventilation and infiltration rate, occupation, metabolic rate, clothing level | Annual heating Energy consumption, Predicted mean vote index. | Sensitivity analysis | Sensitivity analysis of Building parameters and occupancy parameters effects in residential buildings | [28] |
| Window shading size, window width, window length, windows infiltration rate, doors infiltration rate, AF-Ventilation, U-Ext Wall, U-Int Wall, U-First Floor, U-Roof, 𝛼-Ext Wall, 𝛼-Roof, 𝛼-Floors, thickness of floor slab | Heating/cooling/fans energy consumption, Total degree hours, Global objective, Cooling degree hours, Heating degree hours. | Sensitivity analysis | Building design optimisation using Sensitivity analysis and genetic algorithm | [29] |
| Occupants behaviour and thermal comfort model | Amount of energy required to sustain occupant’s thermal comfort. | Actual data measurements | - | [30,31,32,33] |
| Orientation, window to wall ratio, skylight to roof ratio, U-Wall, U-Roof, U-Skylight, U-Win, U-Floor, C-Floor, C-Roof, C-Wall, α-Ext Wall, SHGC, T-vis, infiltration, glazing, floor, parapet, corner linear transmittance | Hourly discomfort index, Cooling energy, Annual electricity energy. | Sensitivity analysis | Sensitivity analysis and optimisation of building design in subtropical regions | [34] |
| Orientation, window to wall ratio, overhang depth, SHGC, insulation, infiltration rate, insulation thickness, window resistance, T-slab Floor, infiltration, sensible heat recovery effectiveness, air Distribution effectiveness, heating, and cooling setpoints, T-cool air, T-heat air | Energy consumption, Predicted mean vote index. | Sensitivity analysis | Sensitivity Analysis throughout the building design process | [35] |
| Window to wall ratio, window type, space aspect ratio, insulation, T-Shading, 𝛼-front shade, 𝛼-back shade | Useful daylight illuminance (UDI), Lighting energy consumption, Heating/cooling energy. | Sensitivity analysis, Uncertainty analysis | Performance of office room with automated shading | [36] |
Table 3.
Thicknesses and thermal conductivity for walls, roof and floor.
| Layer Name | Thermal Conductivity (W/m·K) | Thickness (mm) |
|---|---|---|
| External wall | ||
| Stone | 2.2 | 50 |
| Concrete Reinforced | 2.5 | 100 |
| Extruded polystyrene | 0.03 | 50 |
| Concrete Block | 1.6 | 100 |
| Cement Plaster | 1.2 | 10 |
| U-Value (W/m2·k) | 0.563 | |
| Internal wall | ||
| Cement Plaster | 1.2 | 30 |
| Concrete block | 1.6 | 100 |
| Cement Plaster | 1.2 | 30 |
| U-Value (W/m2·k) | 2.5 | |
| Floor | ||
| Cement Plaster | 1.2 | 30 |
| Concrete block | 1.6 | 100 |
| Cement Plaster | 1.2 | 30 |
| U-Value (W/m2·k) | 2.5 | |
| Roof | ||
| Asphalt | 0.7 | 20 |
| Extruded polystyrene | 0.03 | 50 |
| Miscellaneous materials-aggregate | 1.3 | 100 |
| Concrete Reinforced | 2.5 | 320 |
| Cement Plaster | 1.2 | 20 |
| U-Value (W/m2·K) | 0.535 | |
Table 4.
Glazing layer configuration and their thicknesses.
| Layer Name | Layer Thickness (mm) |
|---|---|
| Generic BLUE | 6 |
| 100% Air Gap | 6 |
| Generic CLEAR | 6 |
| U-value (W/m2·K) | 3.1 |
| Total Solar transmission (SHGC) | 0.5 |
| Light transmission (%) | 0.51 |
Table 5.
External wall insulation thickness and its related U-values.
| Walls Insulation Thickness (cm) | U-Value (W/m2·K) |
|---|---|
| 5 (baseline) | 0.56 |
| 7.5 | 0.4 |
| 10 | 0.31 |
| 12.5 | 0.25 |
| 15 | 0.21 |
Table 6.
Roof insulation thickness and its related U-values.
| Roof Insulation Thickness (cm) | U-Value (W/m2·K) |
|---|---|
| 5 (baseline) | 0.54 |
| 7.5 cm | 0.39 |
| 10 cm | 0.3 |
| 12.5 cm | 0.25 |
| 15 cm | 0.21 |
Table 7.
Specifications of various thermal masses for internal walls.
| Thickness (cm) | Material | Conductivity (W/m·K) | Specific Heat (J/kg·K) | Density (kg/m3) |
|---|---|---|---|---|
| 5 | Heavyweight concrete block | 1.31 | 840 | 2240 |
| 10 | ||||
| 15 | ||||
| 20 | ||||
| 10 | Heavyweight dry concrete cast | 1.3 | 840 | 2000 |
| 20 | ||||
| 30 | ||||
| 10 | Lightweight dry concrete cast | 0.22 | 840 | 720 |
| 20 | ||||
| 30 | ||||
| 10 | Very lightweight concrete | 0.16 | 840 | 470 |
| 20 | ||||
| 30 | ||||
| 10 | High-density concrete | 2 | 1000 | 2400 |
| 20 | ||||
| 30 |
Table 8.
Floor insulation thickness and its related U-values.
| Floor Insulation Thickness (cm) | U-Value (W/m2·K) |
|---|---|
| 0 (baseline) | 1.88 |
| 5 | 0.5 |
| 7.5 | 0.37 |
| 10 | 0.29 |
| 12.5 | 0.24 |
| 15 | 0.2 |
Table 9.
Specification of glassing types.
| Type | Total Solar Transmission SHGC | Light Transmission | U-Value (W/m2·K) |
|---|---|---|---|
| Double blue 6/6 mm Air (baseline) | 0.486 | 0.505 | 3.157 |
| Double blue 6/13 mm Air | 0.481 | 0.505 | 2.708 |
| Double Elec ABS bleached 6/13 mm Air | 0.739 | 0.752 | 1.772 |
| Dbl Elec Abs coloured 6/13 mm Air | 0.155 | 0.114 | 1.772 |
| Double LoE Abs bleached 6/13 mm Arg | 0.478 | 0.657 | 1.322 |
| SageGlass Climatop (triple) | 0.248 | 0.357 | 0.687 |
| Dbl Elec Ref coloured 6/6 mm Air | 0.162 | 0.137 | 2.4 |
| Dbl Elec Ref coloured 6/13 mm Air | 0.142 | 0.137 | 1.772 |
Table 10.
External window shading scenarios.
| Scenarios | Characteristic |
|---|---|
| Baseline | No shading |
| 1 | Overhangs (0.5 m) |
| 2 | Overhangs (1 m) |
| 3 | Overhangs (1.5 m) |
| 4 | Overhangs (2 m) |
| 5 | Louvres (0.5 m) |
| 6 | Louvres (1 m) |
| 7 | Louvres (1.5 m) |
| 8 | Overhang (0.5 m) + Louvre (0.5 m) + Side fins |
| 9 | Overhang (1 m) + Louvre (1 m) + Side fins |
| 10 | Overhang (0.5 m) + Side fins |
| 11 | Overhang (1 m) + Side fins |
Table 11.
Types of diffusing shades.
| Scenarios | Characteristic |
|---|---|
| Baseline | No shading |
| 1 | High reflectance—Low transmittance shade |
| 2 | Medium reflectance—Low transmittance shade |
| 3 | Medium reflectance—Medium transmittance shade |
| 4 | Low reflectance—Low transmittance shade |
| 5 | Low reflectance—Medium transmittance shade |
| 6 | Low reflectance—High transmittance shade |
Table 12.
Sensitivity analysis.
| - | - | Cooling Load | ||
|---|---|---|---|---|
| - | Importance | High | Medium | Low |
| Heating Load | High | Window-to-wall percent | Infiltration (ac/h) Glazing type | - |
| Medium | Local shading type | - | - | |
| Low | Ground floor construction | Natural ventilation rate Flat roof construction Window blind type Window shading control schedule | Partition construction Site orientation External wall construction | |
Table 13.
Optimum solution for high importance variables.
| Design Variable | Value |
|---|---|
| Flat roof construction | Flat roof with 15 cm layer of insulation |
| Glazing type | SageGlass Climatop Blue No Tint (triple) |
| Window blind type | High reflectance—low transmittance shade |
| Window shading control schedule | Summer cooling workdays, the shades in the period between 15/05 and 30/09 for 24 h |
| Infiltration rate | 0.25 (ac/h) |
| Natural ventilation rate | 4 (ac/h) |
| Local shading type | Overhang + side fins (1 m projection) |
| Window-to-wall ratio | 39% |
| Ground floor construction | Typical ground floor (baseline) |
Table 14.
Optimum solution for low-importance variables.
| Design Variable | Value |
|---|---|
| External wall construction | External wall with 15 cm layer of insulation |
| Partition construction | Partition wall the concrete blocks replaced with 30 cm very lightweight dry concrete cast |
| Site orientation | 85° (rotating the building 5° counter-clockwise) |
Publisher’s Note: MDPI stays neutral with regard to jurisdictional claims in published maps and institutional affiliations. |
© 2021 by the author. Licensee MDPI, Basel, Switzerland. This article is an open access article distributed under the terms and conditions of the Creative Commons Attribution (CC BY) license (http://creativecommons.org/licenses/by/4.0/).
Share and Cite
MDPI and ACS Style
Albatayneh, A. Optimising the Parameters of a Building Envelope in the East Mediterranean Saharan, Cool Climate Zone. Buildings 2021, 11, 43. https://doi.org/10.3390/buildings11020043
AMA Style
Albatayneh A. Optimising the Parameters of a Building Envelope in the East Mediterranean Saharan, Cool Climate Zone. Buildings. 2021; 11(2):43. https://doi.org/10.3390/buildings11020043
Chicago/Turabian StyleAlbatayneh, Aiman. 2021. "Optimising the Parameters of a Building Envelope in the East Mediterranean Saharan, Cool Climate Zone" Buildings 11, no. 2: 43. https://doi.org/10.3390/buildings11020043
Note that from the first issue of 2016, this journal uses article numbers instead of page numbers. See further details here.