
Experimental Investigation of Unconfined Compressive Properties of Artificial Ice as a Green Building Material for Rinks


1
Key Lab of Structures Dynamic Behavior and Control of the Ministry of Education, Harbin Institute of Technology, Harbin 150090, China
2
Key Lab of Smart Prevention and Mitigation of Civil Engineering Disasters of the Ministry of Industry and Information Technology, Harbin Institute of Technology, Harbin 150090, China
3
Beijing National Aquatics Center Co., Ltd., Beijing 100101, China
*
Author to whom correspondence should be addressed.
Buildings 2021, 11(12), 586; https://doi.org/10.3390/buildings11120586
Submission received: 29 September 2021
/
Revised: 5 November 2021
/
Accepted: 25 November 2021
/
Published: 26 November 2021
(This article belongs to the Special Issue Sustainable and Green Construction Materials: Opportunities for New and Existing Structures)
Abstract
:The construction of a prefabricated ice rink has recently attracted considerable interest owing to its detachability, short building period, and high cooling efficiency, among other benefits. Characterizing the compressive properties of an artificial ice sheet is crucial in the design, operation, and maintenance stages of the rink. Several uniaxial compressive tests were conducted in the present work to better understand the mechanical behavior of artificial ice in winter sports rinks. The artificial ice was produced using homemade equipment to simulate the real ice-making conditions in the rink. Comprehensive conditions such as strain rate, ice temperature, ice-making method, water quality, air temperature and humidity were considered in the experiments. The obtained results show that the compressive behavior of artificial ice is considerably affected by the strain rate and ice temperature, and slightly affected by the ice-making method and water quality, whereas the effects of air temperature and humidity are inconclusive. The identified range of strain rate for ductile-brittle transition was within 8.3 × 10⁻⁵ s–1 and 8.3 × 10⁻⁴ s−1, in which the strength reaches a maximum value at 1.7 × 10⁻⁴ s−1. The influencing factors on the compressive strength and effective modulus were analyzed based on the experimental observations, and fitting functions were established to describe the relationships. The results of this study will hopefully provide a reference for the design and optimization of ice rinks, particularly for prefabricated rinks.
1. Introduction
In the last few years, with the development of ice sports, there has been a growing interest in the construction of prefabricated rinks [1,2,3]. For example, after the successful World Men’s Curling Championships were conducted in a prefabricated rink in 2016, the Curling competition in 2022 Beijing Winter Olympics and Winter Paralympics will also be conducted in a novel prefabricated rink. The ice sheet of the conventional rink is directly built on the rigid concrete surface whereas the ice sheet in a prefabricated rink, is supported using a foam insulation material, which has an extremely low elastic modulus. It has been concluded that the ice sheet in a prefabricated rink easily undergoes bending failure because of the different supporting conditions of the ice sheet [4]. Thus, a fundamental understanding of the mechanical behavior of artificial ice in the rink is required to prevent the artificial ice sheet failure in service. Notably, ice, as a common sustainable and green building material that has been increasingly employed in the construction of landscapes or shelters [5,6,7] in cold regions, has been studied by several researchers. However, for the artificial ice as a building material in winter sports rinks, the mechanical properties remain unclear.
Compared with common ice in nature, such as sea ice, river ice, and iceberg ice, there are three main characteristics of artificial ice in rinks [8]. First, according to the technical guidance of producing artificial ice recommended by ASHRAE [9], pure water with controlled electric conductivity (for an example, 0.1–10 μS/cm at 25 °C) should be prepared to freeze the ice sheet. Then, as the ice sheet is constructed, normal temperature pure water at about 20 °C is sprayed layer by layer on the cooling surface, until the designed thickness of a few centimeters is achieved. Finally, artificial ice is formed from bottom to upper surfaces as the cooling system is placed under the ice sheet.
In contrast with natural ice, there are few reported studies on the crystal structure and mechanical behavior of artificial ice in a rink, whereas some physical properties of artificial ice in winter sports rinks and the overall performance of novel prefabricated rinks are available. For example, Poirier et al. [10] measured the ice surface hardness from the skating rink, to investigate the friction coefficient model for a steel blade and ice. In addition, the columnar crystal structure of the artificial ice sheet in the vertical direction was reported. For the ice sheet performance, Zhang et al. [1] demonstrated in their research that no ice cracking phenomenon in the prefabricated rink was observed during the 2019 China Youth Curling Open. Further, a qualitative analysis shows that an increase in the insulation layer thickness or a decrease in the ice sheet thickness can reduce the ice cracking load.
Contrary to the limited research on the mechanical behavior of artificial ice in rinks, considerable efforts have been made toward studying of natural ice. There appears to be a widespread consensus that ice is similar to concrete and rock in that it has strong compressive strength but low tensile strength [11,12,13]. A comprehensive overview of the mechanical properties of sea ice, freshwater ice and iceberg ice can be found in some reviews [14,15,16]. For the compressive behavior, two typical ice behaviors under varying strain rates, i.e., ductile and brittle failures, have been observed [17,18]. The ductile-brittle transition behavior of ice was theoretically studied by the micromechanical competition between crack propagation and creep at crack tips [19,20]. Moreover, temperature also has a significant effect on strength and viscosity [21,22,23]. An analysis of the available data for freshwater and seawater ice indicated that when the ice temperature decreases by 1 °C, the failure strengths increase to 0.35 and 0.4 MPa, respectively [24]. In addition, Farid et al. [25] and Kermani et al. [26] demonstrated that the compressive properties of atmospheric ice are also highly dependent on porosity. In summary, the compressive behavior of common ice in nature is sensitive to strain rate and ice temperature. These valuable findings can serve as a reference for studying the mechanical properties of artificial ice in rinks.
Artificial ice in rinks can be regarded as a new type of ice, due to its distinguishing features in terms of water quality and ice-making conditions. Few studies on the mechanical properties of artificial ice in rinks were provided in published literature. However, the commonly acknowledged understanding of sea ice, freshwater ice, and atmospheric ice, among others, provides some inspirations for our current work on artificial ice. In this paper, the compressive properties of artificial ice in rinks at different loading conditions and ice-making conditions would be studied by a series of tests. This paper is composed of five parts and is structured as follows: Preparation of the artificial ice using self–designed equipment, observation of the crystal structure, and experimental program are presented in the second part. The third part provides the test results of ice samples based on observations. In addition, the influencing factors of compressive strength and effective modulus are discussed in the fourth part. Finally, some conclusions drawn from the tests are presented in the fifth part. The research findings have a significant value for the practical application and development of prefabricated rinks in engineering practice.
2. Materials and Methods
2.1. Materials
2.1.1. Preparation of Ice Specimens
The artificial ice was produced using a self–designed low–temperature test chamber ice-making tank with a size of 825 mm × 345 mm × 15 mm (Figure 1a) to achieve the characteristics of layer-by-layer pouring and bottom-up freezing of artificial ice on an ice rink. The working principle of the ice-making device is shown in Figure 1b. The cold air generated in the test chamber is heat exchanged with the water in the tank through the steel plate at the bottom of the tank, such that the temperature of the water sample is reduced below the freezing point. This accomplishes the layered freezing of water from the bottom to the top. In addition, it takes about 0.5 to 7 h to freeze a layer of ice with different thickness. During the artificial ice preparation, the conditions such as ice temperature, ice-making method, water quality (total dissolved solids/TDS), room temperature and humidity are also necessary to be controlled to make the prepared ice sample satisfy the test requirements.
According to the guidelines recommended by the International Association for Hydro–Environment Engineering and Research (IAHR) [27], the size of a cuboid–shaped ice sample used in a uniaxial test is 50 mm × 50 mm × 100 mm. The large ice block is first cut into parts slightly larger than the standard size by hand saw, and then fine machining is conducted using a planer to ensure that the upper and lower surfaces meet the test requirements for size, parallelism and flatness.
2.1.2. Crystal Structure of Ice Specimens
The microstructure of different ice types is different, which affects their mechanical behavior. Therefore, it is necessary to understand the crystal type of ice before the uniaxial loading test. The crystal structure of the ice in vertical and horizontal directions was observed using an orthogonal polarizer. Figure 2a and b show an example of the horizontal slices at various depths and vertical slices of ice crystal photos, respectively. The artificial ice on the ice rink is typical columnar ice, which is consistent with the results in the skating rink [10,28]. Calculated by using image processing method, the average grain sizes are 7.5, 6.5, and 6.0 mm for horizontal sections at depths of 0, 4, and 8 cm, respectively, showing a decreasing tendency with an increase in the distance from the ice top surface. This phenomenon, i.e., the column diameter of ice crystals increasing in the freezing direction, shows an agreement with that of naturally formed ice such as sea ice and rive ice. An average density of artificial ice is calculated as 911 kg/m3 using the mass volume method.
2.2. Methods
2.2.1. Test Equipment
The uniaxial compression strength tests of artificial ice were conducted in a low–temperature laboratory, and the WDW–100 micro controlled low–temperature electronic universal testing machine was used. As illustrated in Figure 3, the testing machine is mainly composed of a microcomputer control system, electronic universal testing machine and low–temperature test chamber. It can perform compression, tensile, bending and shear tests in a low–temperature environment. The temperature in the test chamber is monitored using a platinum resistance temperature sensor and controlled by temperature control system. The temperature control accuracy of 0.1 °C can satisfy the test accuracy requirements. A lighting system is also set in the box, which is convenient for recording the failure process of ice samples and providing a reliable environment for conducting ice uniaxial compression tests.
2.2.2. Test Methods
According to the aforementioned ice-making method in Section 2.1, the ice samples with 5 cm × 5 cm × 10 cm were prepared considering different ice making influencing factors, such as the ice making–method, water quality type and ambient room temperature and humidity. The machined specimens were stored in thermostatic storage chambers at the specified temperature before the test. After stabilizing the temperature in the low–temperature test chamber to the required temperature, the ice sample after constant temperature treatment was quickly placed on the workbench of the universal testing machine. To prevent the occurrence of eccentric loading, the center of the ice sample was adjusted to coincide with the indenter center of the universal testing machine. The displacement controlled loading of the machine at varying velocities was adopted, in which the strain rate of the ice specimen can be determined by the ratio of the displacement rate of the indenter to the length of the ice specimen, i.e., . After detecting the sample failure, the loading was completed and the results were recorded.
The detailed test parameters are given in Table 1. A total of 18 groups of tests were carried out, in which three effective uniaxial compression stress-strain curves were obtained for each group. Special emphasis was placed on −8.5 °C, which was the design temperature for curling ice sheets in the 2022 Beijing Winter Olympics.
Strength and modulus as essential parameters describing the ice behavior, play an important role in ice engineering applications. Although the usefulness of measuring ice strength in uniaxial tests is limited as it strongly increases under more triaxial loading states [29], the uniaxial test results can not only provide a reference for triaxial test but can also be used for some simple stress states, for example, failure assessment on compression zone of an ice sheet in a rink under bending action. In next part, the compressive strength and effective modulus calculated from the following expressions (Equations (1) and (2)) are discussed.
where F is the maximum loading force by the indenter, A is the cross–section area of the ice specimen. It is worth emphasizing that the modulus calculated from the stress-strain curve using Equation (2) is often termed “effective modulus”, instead of “elastic modulus”. Generally speaking, ice is a kind of material with obvious viscous effect, and the viscous deformation always comes into play. While the elastic modulus of ice is normally determined measuring the propagation of elastic waves, or by measuring the ultrasonic velocity [15]. In this work, the effective modulus in lateral direction, i.e., loading direction perpendicular to the grain columns (shown in Figure 3), is obtained from the linear elastic segment of the stress-strain curves.
3. Results
3.1. Stress-strain Curves of Ice Samples
The obtained stress-strain curves of ice specimens under a series of varying parameters during compression progress is presented in Figure 4. As expected, similar to naturally formed ice, the strain rate (Figure 4a) and ice temperature (Figure 4b) significantly affect the mechanical behavior of this artificial ice. Moreover, it appears that the measured stress-strain curves were also related to the three other investigated factors, including ice-making mode (Figure 4c), water quality (Figure 4d) and air temperature and humidity (Figure 4e), in which, the ice-making mode’s effect was more obvious.
In addition, as shown in Figure 4a, two obvious curve shapes of the artificial ice, reflecting ductile and brittle behavior, were observed at different loading rates. To better understand the two failure behaviors, the typical stress-strain curves divided into different stages are given in Figure 4f. For a low strain rate (8.3 × 10⁻⁵ s−1), the stress-strain curve was divided into four stages. The stress increases significantly slower in the first stage, which corresponds to the complete compaction of the indenter of the experimental machine and the ice sample. Then, the stress increases almost linearly with an increase in strain rate, mainly due to the elastic deformation of ice crystals under compression. The third stage, characterized by the nucleation and formation of cracks, involves the plastic deformation of ice sample with obvious nonlinearity, and the maximum strength was achieved in this region. After the failure strength occurred, the cracks continued to develop and propagate, resulting in the reduction of stress. In short, the ice specimens under low strain rate experienced elastic, plastic and strain softening stages during compression, and exhibited typical ductile failure behavior. Whereas for a high strain rate (1.7 × 10⁻³ s−1), the failure occurs approximately at the end of the linear elastic stage, exhibiting typical brittle failure behavior. According to the previous works on the ice under compression [11,15,17,18], both for ductile and brittle failure, the effective modulus was calculated based on Equation (2) using the second stage (shown in Figure 4f) of the stress-strain curves, since the stress increases approximately linearly with strain in this section.
3.2. Failure Mode of Ice Samples and Determination of Creep Parameter n
During the uniaxial compression tests of artificial ice, two typical failure modes of ice samples, namely, ductile failure and brittle failure were observed. As shown in Figure 5a, when the ice sample is damaged in the form of ductility, small micro cracks were first generated at the bottom of the sample. With continuous compression, the cracks gradually expanded into the ice sample, and the number of cracks increased. Finally, due to a rapidly increasing crack population, the loading force of the testing machine reached a peak value, and lateral expansion deformation was observed at the middle of the sample. In the work conducted by Li and Du [30], the cracks before ice failure under compression were identified as tensile and shear cracks using acoustic emission technology.
In the case of brittle failure, as presented in Figure 5b, the initial crack first appeared at the bottom of the ice sample, which was similar to a ductile failure. With increasing load, growth and propagation of cracks roughly along the loading direction were observed, but no significant increase in the number of cracks was found. Finally, with further crack propagation, a primary crack that ran through the upper and lower surfaces was formed, and local crushing occurred in the top and bottom regions of the sample.
It appears that a relationship exists between the failure mode and the strain rate. Figure 6 shows the distribution proportion of failure modes of ice samples under the investigated strain rates of 8.3 × 10⁻⁶ s−1 and 1.7 × 10⁻³ s−1. In general, with the increase of strain rate, the ice samples failure mode gradually changes from ductile to brittle failure. When the strain rate is lower than 8.3 × 10⁻⁵ s−1, the ice is in ductile regime, occurring ductile failure. However, when the strain rate is higher than 8.3 × 10⁻⁴ s−1, the ice with splitting failure exhibits brittle behavior. Whereas the ice shows ductile-brittle mixture failure mode in the range of 1.7 × 10⁻⁴ s–1~3.3 × 10⁻⁴ s−1.
Creep, a well–known deformation phenomenon for ice under constant stress due to the fact that ice is generally kept at a high homologous temperature of above 0.8 Tm (Tm is the melt temperature) in nature, is of primary importance in some engineering applications, such as thermal stresses calculation in the ice cover of a reservoir [31]. In addition, it has been reported by Snyder and Schulson [19] that the competition mechanism between creep and crack propagation (corresponding to ductile and brittle behaviors, respectively) at crack tips can be responsible for the ductile-brittle transition phenomenon in ice. Therefore, the previously obtained ice failure modes were significantly affected by the strain rate. In the case of a higher strain rate, there was insufficient time for the development of creep deformation to reduce the stress intensity factor at the crack tip, and the ice exhibits brittle behavior. Otherwise, the ice behavior was reverse.
Generally speaking, the creep deformation comprises three stages: the primary creep stage with decreasing strain rate, secondary creep stage with a constant strain rate, and tertiary creep stage with increasing deformation rate [32]. Among them, secondary creep is the most interest in ice engineering and the Glen’s power law [33] (shown in Equation (3)) is widely accepted to describe the characteristics of secondary creep.
where is the minimum strain rate occurring in the secondary creep stage, is the constant stress applied on ice, and B and n are material constants for creep.
Despite the general determination of creep parameter with constant stress loading tests, the correspondence between the stress dependence of the minimum strain rate in creep tests and strain rate dependence of strength in constant strain rates loading tests [34,35], as shown in Figure 7a, provide another method (presented in Equation (4)) for determining the creep parameter through our uniaxial compression tests with constant strain rates.
where is the loading strain rate with a constant value, is the yield stress (defined as the maximum stress) for the uniaxial compression test, and B and n are material constants for creep.
As presented in Figure 7b, the value of n is calculated as 5.12, by applying Equation (4) to the obtained strain rate in the ductile domain (8.3 × 10⁻⁶ s−1 to 1.7 × 10⁻⁴ s−1) and the corresponding strength. The obtained creep parameter n, considered as the ratio of dislocation climb and dislocation glide [36], corresponds to the results of other investigators, who analyzed the parameter in a similar way. For example, Seifaddini et al. [37], in their research, reported the parameter n as 3.3 and 4.18 for laboratory–made polycrystalline ice under uniaxial compression at temperatures of −5 °C and −10 °C, respectively. Jones [38] obtained an n–value of 5.04 for the unconfined compressive tests at −11 °C. Recently, the stress exponent n, has been described as 3.3 for pure ice measured at −10 °C [39].
4. Discussion
4.1. Experimental and Theoretical Strain Rate for Ductile-brittle Transition
The strain rate for ductile-brittle transition obtained from the present experiments at −8.5 °C is approximately within the range of 8.3 × 10⁻⁵ s–1 to 8.3 × 10⁻⁴ s−1. This range is close to those of freshwater ice obtained in previous studies. For example, in an investigation on the transitional strain rate of columnar–grained freshwater ice conducted by Batto and Schulson [40], the transitional strain rate was 3 × 10⁻⁴ s–1 for ice with grain size of 3.5 mm, and 3–6 × 10⁻⁵ s–1 for ice with 15 mm grains at −10 °C. In their study, it was concluded that the transitional strain rate could be scaled as d−1.5 (d is the grain size). Using the d–1.5 scaling, the transitional strain rates obtained by Batto and Schulson [40] can be scaled as 1.2 × 10⁻⁴ s−1 for grain size of 6.6 mm, and it can be found that our obtained transitional strain rate at −8.5 °C is consistent with the scaled strain rate from Batto and Schulson [40]. Golding et al. [41] obtained the transitional strain rate as 10−4 s−1 for columnar–grained freshwater ice with grain size of 3–6 mm at −10 °C. More recently, Deng et al. [17] reported the transitional strain rate of approximately 1–5 × 10⁻³ s−1 for laboratory–grown ice produced by distilled water at −18 °C. Yasui et al. [39] examined the transitional strain rate of freshwater ice with grain size of 0.3–0.4 mm at −10 °C, and they determined the strain of 10−3–10−2 s−1.
To predict the ice failure mode, Schulson and his collaborator [20,42] developed a physical model accounting for the ductile-brittle transition based on the competition between stress buildup and stress relaxation via creep at the tips of cracks. In this model, the effects of strain rate, temperature and grain size are incorporated, and the theoretical transitional strain rate under unconfined compression loading is defined as bellow [42]:
where n and B are the creep parameters in the power–law relationship shown in Equation (4), KIC is the fracture toughness, μ is the coefficient of kinetic friction, and c is the characteristic radius (or half–length) of cracks within the ice material.
The n and B related to creep are determined as 5.12 and 2.76 × 10⁻⁶ (MPa)5.12 s−1, respectively, as calculated in Section 3.2. As the fracture toughness of ice is outside the scope of the current study, here the parameter is estimated from previous work on freshwater ice. According to the measured results at −10 °C and −7 °C conducted by Deng et al. [43], KIC at −8.5 °C is taken as 70 kPa m1/2, based on the linear interpolation method. In addition, c, related to crack size, is assumed as average ice grain radius within the sample [19,42]. In this study, the grain diameter of 6.6 mm obtained from the microstructure observation in Section 2.1 is used. In the case of frictional coefficient μ, 0.35 is adopted on the base of the assumption in [42]. Using these parameters, the theoretical critical transitional strain rate is calculated as 4.6 × 10⁻⁴ s−1 based on Equation (5), which is also consistent with the transitional strain obtained in our experiments.
4.2. Effect of Strain Rate on the Uniaxial Compressive Strength and Effective Modulus
The scatter diagram of tested uniaxial compressive strength under strain rates varying from 8.3 × 10⁻⁶ s–1 to 1.7 × 10⁻³ s−1 drawn in the plane, is depicted in Figure 8. It can be seen that when the strain rate is lower than 8.3 × 10⁻⁵ s−1, there is a positive correlation between uniaxial compressive strength and strain rate; While, when the strain rate is higher than 3.3 × 10⁻⁴ s−1, a negative correlation exists between strength and strain rate; The peak uniaxial compressive strength occurs in the ductile-brittle transition zone at a strain rate of 1.7 × 10⁻⁴ s−1. This strain rate dependence of compressive strength for the artificial ice in rink can also be found in other materials, such as sea ice, river ice, snow [44], and ice-rock mixtures [39].
Several empirical functions have been adopted to quantitatively describe the compressive strength at varying strain rates, such as linear function [24], power function [45], and normal distribution function [46]. In the present paper, based on existing sea ice research, the mathematical relationship expression between the uniaxial compressive strength of artificial ice and strain rate both in ductile and brittle regimes is established in the form of power function (Equation (6)).
where, and are the uniaxial compressive strength and strain rate, respectively; and are reference strength and strain rate to maintain dimensional consistency, respectively; a and b are fitting parameters.
The fitting coefficients of artificial ice in ductile and brittle regimes obtained using the least square method is shown in Table 2. The correlation coefficients are greater than 0.9, indicating a good fitting effect.
Using the stress-strain data of the linear elastic stage, the corresponding effective modulus is calculated according to Equation (2). Figure 9a shows the results of effective modulus under different strain rates. At a low strain rate, the developed viscous deformation contributed to the measured deformation due to the dislocation movement of ice crystal, which lowers the effective modulus of ice. However, under a high strain rate, the viscous deformation is insignificant in a short time, and the deformation is mainly composed of elastic deformation caused by extrusion between grains, thus the effective modulus of artificial ice in the brittle region is larger than that in the ductile region. The relationship between effective modulus and strain rate of artificial ice is established in the following expression:
where, and are uniaxial compressive strength and strain rate, respectively; and are reference strength and strain rate, respectively; m and n are fitting parameters.
Figure 9b shows the mean values of the measured effective modulus and the predicted results for artificial ice.
4.3. Effect of Ice Temperature on the Uniaxial Compressive Strength and Effective Modulus
Ice is a temperature sensitive material [16]. The test results of uniaxial compressive strength under different ice temperature from −35 °C to −5 °C, is drawn in Figure 10. The uniaxial compression strength of artificial ice increases gradually with a decrease in ice temperature, without an obvious turning point. This experimental observation is consistent with other research results on sea ice, river ice, lake ice, reservoir ice etc. [15]. However, in a study on the compressive strength of atmospheric ice conducted by Farid et al. [25], it was reported that the ice becomes stronger at temperatures range from −5 °C to −15 °C, but show a decreasing strength at temperatures varying from −15 °C to −20 °C.
To describe the natural ice behavior at varying ice temperatures, expressions in linearity and logarithm are usually adopted by previous research. According to the test results given in Figure 10, the compressive strength increase rate decreases with a decrease in temperature. Meanwhile, since ice has lost its bearing capacity at the temperature near the freezing point, the relationship between the uniaxial compressive strength and temperature of artificial ice is established in this study by using a logarithmic function (Equation (8)).
where, T is the ice temperature, T0 is the reference temperature and taken as −1 °C, and c and d are fitting parameters.
Figure 11 shows the measured uniaxial compressive strength of artificial ice and predicted values using linear function () and logarithmic function, respectively. Compared with the fitting results of the linear function, the logarithmic function accurately predicted the experimental data, and has physical significance when the temperature is 0 °C.
The relationship between ice temperature and effective modulus is given in Figure 12. In addition, a linear function (Equation (9)) is used to describe the increase in effective modulus caused by decreasing ice temperature.
where, T is the ice temperature, T0 is the reference temperature and taken as −1 °C, and p and q are fitting parameters.
In general, the present results of artificial ice are consistent with those of previous researchers. For example, Farid et al. [46] obtained compressive strengths of 3.05 and 3.5 MPa for atmospheric porous ice and the deaerated ice at −5 °C and 10−4 s−1. More recently, Deng et al. [17] presented a strength of 5.99 MPa through the compressive test on cylindrical specimens (made by distilled water) with a diameter of 25 mm and a height of 25 mm at −18 °C and 10−4 s−1. In addition, Wu et al. [12] measured the compressive strength and effective modulus of freshwater ice as 2.59 MPa and 610 MPa at −10 °C and 10−4 s−1. As reported by Luo et al. [18], the compressive strength and effective modulus of freshwater ice is 2.84 MPa and 181.8 MPa at 8.33 × 10⁻⁴ s−1 and −5 °C. The differences between the data obtained in this study and those presented by other researchers can be attributed to the complexity of ice mechanics and dependency of loading direction/rate, temperature, grain size/shape, air bubbles, impurity, sample size, etc. Additional field experiments on artificial ice in rinks would be required for further studies.
4.4. Effect of Ice-Making Mode on the Uniaxial Compressive Strength and Effective Modulus
From the empirical perspective of ice-making experts, artificial ice was built by repeatedly pouring purified water on the frozen ice to ensure the quality of ice sheet in a winter sports rink [8]. Thus, the ice sheet was formed layer by layer with a specified thickness until it reached the design value. To gain a thorough grasp of the ice-making mode, rather than relying on experience, this section examines the relationship between compressive properties and layer thickness.
Figure 13a,b present the compression strength and effective modulus of artificial ice with pouring thickness of 1, 5 and 10 mm during the layer by layer ice-making progress. It appears that under the same test conditions, a higher ice pouring thickness of each layer results in smaller uniaxial compression strength. Similar to how ice strength to varies with the ice-making mode, the effective modulus decreases as the ice pouring thickness increases. These observations can be used to explain the reasons for constructing of artificial ice sheets with strictly controlled ice layer thicknesses, particularly in the rink hosting international competitions. Recently, in the research of Aksenov et al. [47] on ice as material for buildings foundations, the ice specimens for unconfined compression were produced using the layer by layer freezing of freshwater, which is similar to the ice-making method of artificial ice in rinks. An experimental result of the strength of ice specimens decreasing as the thickness of a frozen layer increases was reported, and a power function as (shown in Figure 13a) was adopted to fit the relationship. The differences between the compressive strengths in this present study and the corresponding values obtained by Aksenov et al. [47] can be probably attributed to other factors including loading rate, temperature, specimen size effect, water quality (presented in the next section), etc. In short, the dependency of the uniaxial compressive strength on the layer thickness should be gained much more attention. Moreover, further studies on the bending, fracture toughness, and surface hardness of artificial ice, will be conducted to explore whether there is a relationship between strength/fracture toughness/hardness and layer thickness.
The above observed variation of ice uniaxial compression strength with the ice-making mode is possibly related to the air bubbles in the ice samples. Figure 14a,b show photos of ice samples made of 10 mm/layer and 5 mm/layer, respectively. The bubble content and size in the ice sample prepared by pouring a 10 mm/layer thickness is significantly higher than that of 5 mm/layer thickness. In fact, the porosity in the ice specimen can be regarded as internal defects from the perspective of fracture mechanics, which reduces the effective stress area of the specimen and weakens the overall mechanical properties of the ice. Therefore, the artificial ice displays a decreased bearing capacity as ice thickness/layer increases.
4.5. Effect of Water Quality on the Uniaxial Compressive Strength and Effective Modulus
As any impurities in water, such as salts, acids, ions, and dust, can degrade the quality of ice, water quality is another critical component in the preparation and maintenance of rink ice sheets [8]. In this section, the uniaxial compression strength and effective modulus of artificial ice against water quality (TDS values of 10, 50 and 100 ppm) are plotted in Figure 15a,b, respectively. Both the strength and modulus of artificial ice shows a decreasing trend with an increase in TDS. The slight influence caused by TDS, compared with the significant impact of strain rate and ice temperature, can be explained by referring to the sea ice research results [15]. The soluble solid material in the ice usually exists in the form of brine. As a liquid component, the higher brine content, the greater the porosity and the lower the ice strength.
4.6. Effect of Air Temperature/Humidity on the Uniaxial Compressive Strength and Effective Modulus
Previous studies have emphasized the impact of air temperature and humidity on the physical properties of ice sheets, such as sublimation and frosting [48,49]. However, the relationship between air conditions and the mechanical behavior of ice in rinks remains unclear. This section aims to present the experimental results of compressive strength under different air conditions.
In the present work, tests of AIC-E10/70, AIC-V5, AIC-E22/35 with humidity values of 70%, 50%, and 35%, respectively, were used to explore the effect of air humidity on the mechanical properties. As shown in Figure 16a,b, there was no significant correlation between the uniaxial compressive strength or effective modulus of artificial ice and room temperature/humidity. The average ice strength varies insignificantly within the investigated air temperature/humidity range in the ice-making progress, which is about 1.4~1.5 MPa. Although no comparable research exists on the relationship between humidity and mechanical properties of ice, it is worth noting that Poirier et al. [10] reported an interesting finding of the inconclusive effect of humidity on ice surface hardness. Given that some materials exhibit a linear empirical relationship between strength and hardness [50], the inconclusive effect of humidity on hardness, to a certain extent, can provide support to the present observation of no significant correlation between humidity and strength. However, due to the difficulties in controlling accurately the humidity of ambient air during the ice-making progress without the help of a specialized laboratory, the influence of more varying values of the humidity will be studied in our future work.
5. Conclusions
The compressive properties of artificial ice in rink were studied through a series of uniaxial compression experiments. Factors related to loading conditions (strain rate and ice temperature) and ice-making conditions (water quality, ice-making mode, ice temperature and humidity) were considered in the tests. Furthermore, the relationships between the investigated factors and compressive behavior were presented during the analysis. Based on the experimental observations, the following conclusions can be drawn:
(1) The artificial ice was produced according to the technical guideline of building ice sheets for rinks. Microstructure observation indicated that the ice is an orthotropic typical columnar ice. The grain sizes increase in the freezing direction, which is consistent with the tendency of natural ice.
(2) Strain rate is crucial in the mechanical behavior of the artificial ice. Two typical failure modes, i.e., ductile and brittle failures, at varying strain rates were observed. The ductile-brittle transition was obtained within the range of 8 × 10⁻⁵ s−1 and 3.3 × 10⁻⁴ s−1, in which, the strength reaches a maximum value at 1.7 × 10⁻⁴ s−1. However, the effective modulus appears to continuously increase as the strain rate increases due to the limited creep effect.
(3) An increase in ice temperature could reduce both the uniaxial compressive strength and effective modulus of artificial ice. The relationship between strength and temperature was reasonably well described using a logarithmic function, rather than a linear fitting function.
(4) Compressive strength and effective modulus show obvious dependence on water quality and thickness of spraying water per layer. It appears that increasing the total dissolved solids in water and spraying water thickness per layer both decrease strength and modulus. While the effect of ice temperature and humidity on the compressive behavior is inconclusive, similar to the inconclusive conclusion of humidity on the ice surface hardness.
In summary, the basic knowledge of artificial ice under uniaxial compression at various conditions was obtained. Following several future studies, including triaxial compression, three-point bending, fracture toughness, hardness, and ice sheet loading tests, recommendations for ice-making from an ice mechanics perspective can be made, based on the suggestions of ice makers and athletes. In addition, a comprehensive understanding of artificial ice is beneficial for designing the supporting structures for a prefabricated ice rink and ice sheet.
Author Contributions
“Conceptualization, W.Z. and J.L.; methodology, B.Y.; software, J.L.; validation, B.Y., L.W. and J.L.; formal analysis, J.L.; investigation, B.Y.; resources, B.Y.; data curation, B.Y. and L.W.; writing—original draft preparation, B.Y. and J.L.; writing—review and editing, W.Z.; visualization, J.L.; supervision, W.Z. and Q.Y.; project administration, W.Z. and Q.Y.; funding acquisition, W.Z. and Q.Y. All authors have read and agreed to the published version of the manuscript.”
Funding
The authors gratefully acknowledge the financial support by National Key Research and Development Project of China (2020YFF0304300), science and technology R&D plan of CSCEC (CSCEC–2019–Z–7).
Institutional Review Board Statement
Not applicable.
Informed Consent Statement
Not applicable.
Data Availability Statement
The data presented in this study are available on request from the corresponding author.
Conflicts of Interest
The authors declare that they have no known competing financial interests or personal relationships that could have appeared to influence the work reported in this paper.
References
- Zhang, W.Y.; Li, J.X.; Yang, Q.Y.; Mu, L. Practical application of a novel prefabricated curling ice rink supported by steel–concrete composite floors: In situ measurements of static and dynamic response. Structures 2021, 32, 1888–1906. [Google Scholar] [CrossRef]
- Li, J.X.; Zhang, W.Y.; Yang, Q.Y. Dynamic performance of a novel prefabricated curling ice rink: Human locomotion load measurement and FEM simulation analysis. KSCE J. Civ. Eng. 2021, 25, 4799–4813. [Google Scholar] [CrossRef]
- Yu, T.X. Research on Mechanical Properties of Assembly Structure Used to Support Ice of the Curling Ground. Master’s Thesis, Harbin Institute of Technology, Harbin, China, 2017. [Google Scholar]
- Wei, B. Theoretical Analysis and Finite Element Simulation of the Mechanical Performance of Artificial Ice Rink. Master’s Thesis, Harbin Institute of Technology, Harbin, China, 2020. [Google Scholar]
- Pronk, A.; Luo, P.; Li, Q.; Sanders, F.; Overtoom, M.; Coar, L. Success factors in the realization of large ice projects in education. Int. J. Space Struct. 2021, 36, 4–12. [Google Scholar] [CrossRef]
- Pronk, A.; Mistur, M.; Li, Q.; Liu, X.; Blok, R.; Liu, R.; Dong, Y. The 2017–18 design and construction of ice composite structures in Harbin. Structures 2019, 18, 117–127. [Google Scholar] [CrossRef]
- Wu, Y.; Liu, X.; Luo, P.; Zhang, R. Structural analysis and construction quality assessment of a free–form ice composite shell. Structures 2020, 27, 868–878. [Google Scholar] [CrossRef]
- Braghin, F.; Cheli, F.; Maldifassi, S.; Melzi, S.; Sabbioni, E. The Engineering Approach to Winter Sports; Springer: New York, NY, USA, 2016; pp. 328–331. [Google Scholar]
- ASHRAE. ASHRAE Handbook—Refrigeration, SI ed.; ASHRAE: Atlanta, GA, USA, 2018; pp. 44.1–44.13. [Google Scholar]
- Poirier, L.; Lozowski, E.P.; Thompson, R.I. Ice hardness in winter sports. Cold Reg. Sci. Technol. 2011, 67, 129–134. [Google Scholar] [CrossRef]
- Timco, G.; Frederking, R. Comparative strengths of fresh water ice. Cold Reg. Sci. Technol. 1982, 6, 21–27. [Google Scholar] [CrossRef] [Green Version]
- Wu, Y.; Lou, X.; Liu, X.; Pronk, A. The property of fiber reinforced ice under uniaxial compression. Mater. Struct. 2020, 53, 29. [Google Scholar] [CrossRef]
- Lou, X.; Wu, Y. Splitting tensile mechanical properties of plain ice and fiber–reinforced ice. Cold Reg. Sci. Technol. 2021, 192, 103381. [Google Scholar] [CrossRef]
- Petrovic, J.J. Review mechanical properties of ice and snow. J. Mater. Sci. 2003, 38, 1–6. [Google Scholar] [CrossRef]
- Timco, G.W.; Weeks, W.F. A review of the engineering properties of sea ice. Cold Reg. Sci. Technol. 2010, 60, 107–129. [Google Scholar] [CrossRef]
- Jones, S.J. A review of the strength of iceberg and other freshwater ice and the effect of temperature. Cold Reg. Sci. Technol. 2007, 47, 256–262. [Google Scholar] [CrossRef]
- Deng, K.; Feng, X.; Tan, X.; Hu, Y. Experimental research on compressive mechanical properties of ice under low strain rates. Mater. Today Commun. 2020, 24, 101029. [Google Scholar] [CrossRef]
- Luo, W.; Dan, H.; Zeng, R.; Rong, Y.; Xie, D. Experimental investigation on uniaxial unconfined compressive properties of ice on asphalt pavement surface. Front. Mater. 2020, 7, 294. [Google Scholar] [CrossRef]
- Snyder, S.A.; Schulson, E.M.; Renshaw, C.E. Effects of prestrain on the ductile–to–brittle transition of ice. Acta Mater. 2016, 108, 110–127. [Google Scholar] [CrossRef] [Green Version]
- Renshaw, C.; Schulson, E. Universal behaviour in compressive failure of brittle materials. Nature 2001, 412, 897–900. [Google Scholar] [CrossRef] [PubMed]
- Wang, Q.; Li, Z.; Lei, R.; Lu, P.; Han, H. Estimation of the uniaxial compressive strength of Arctic Sea ice during melt season. Cold Reg. Sci. Technol. 2018, 151, 9–18. [Google Scholar] [CrossRef]
- Zaretsky, Y.K.; Fish, A.M. Effect of temperature on the strength and viscosity of ice. Soil Mech. Found Eng. 1996, 33, 46–52. [Google Scholar] [CrossRef]
- Fish, A.M.; Zaretsky, Y.K. Ice Strength as a function of hydrostatic pressure and temperature. Available online: https://usace.contentdm.oclc.org/digital/api/collection/p266001coll1/id/6095/download (accessed on 24 November 2021).
- Serdar, T.I.; Ankush, K.; Jeom, K.P. A new constitutive equation on ice materials. Ships Offshore Struc. 2017, 12, 610–623. [Google Scholar]
- Farid, H.; Farzaneh, M.; Saeidi, A.; Erchiqui, F. A contribution to the study of the compressive behavior of atmospheric ice. Cold Reg. Sci. Technol. 2016, 121, 60–65. [Google Scholar] [CrossRef]
- Kermani, M.; Farzaneh, M.; Gagnon, R. Compressive strength of atmospheric ice. Cold Reg. Sci. Technol. 2007, 49, 195–205. [Google Scholar] [CrossRef]
- Schwarz, J.; Frederking, R.; Gavrillo, V.; Petrov, I.G.; Hirayama, K.I.; Mellor, M.; Vaudrey, K.D. Standardized testing methods for measuring mechanical properties of ice. Cold Reg. Sci. Technol. 1981, 4, 245–253. [Google Scholar] [CrossRef]
- Kobayashi, T. Studies of the properties of the ice in speed skating rinks. ASHRAE J. 1973, 15, 51–56. [Google Scholar]
- Strub–Klein, L. A statistical analysis of first–year level ice uniaxial compressive strength in the Svalbard Area. J. Offshore Mech. Arct. Eng. 2017, 139, 011503. [Google Scholar] [CrossRef]
- Li, D.; Du, F. Monitoring and evaluating the failure behavior of ice structure using the acoustic emission technique. Cold Reg. Sci. Technol. 2016, 129, 51–59. [Google Scholar] [CrossRef]
- Petrich, C.; Saether, I.; Fransson, L.; Sand, B.; Arntsen, B. Time–dependent spatial distribution of thermal stresses in the ice cover of a small reservoir. Cold Reg. Sci. Technol. 2015, 120, 35–44. [Google Scholar] [CrossRef] [Green Version]
- Duddu, R.; Waisman, H. A temperature dependent creep damage model for polycrystalline ice. Mech. Mater. 2012, 46, 23–41. [Google Scholar] [CrossRef]
- Glen, J.W. The creep of polycrystalline ice. Proc. R. Soc. Lond. A 1955, 228, 519–538. [Google Scholar]
- Cole, M. Deformation and failure of ice under constant stress or constant strain–rate. Cold Reg. Sci. Technol. 1982, 5, 201–219. [Google Scholar]
- Barrette, P.D.; Jordaan, I.J. Pressure–temperature effects on the compressive behavior of laboratory–grown and iceberg ice. Cold Reg. Sci. Technol. 2003, 36, 25–36. [Google Scholar] [CrossRef]
- Petrenko, V.F.; Whitworth, R.W. Physics of Ice; Oxford University Press: New York, NY, USA, 1999; pp. 133–143. [Google Scholar]
- Seifaddini, M.; Aryanpour, G.; Farzaneh, M. Structural properties and simple compression behavior of laboratory–made polycrystalline isotropic ice at high temperatures. J. Offshore Mech. Arct. 2018, 140, 011501. [Google Scholar] [CrossRef]
- Jones, J. The Confined compressive strength of polycrystalline ice. J. Glaciol. 1982, 28, 171–178. [Google Scholar] [CrossRef] [Green Version]
- Yasui, M.; Schulson, E.M.; Renshaw, C.E. Experimental studies on mechanical properties and ductile–to–brittle transition of ice–silica mixtures: Young’s modulus, compressive strength, and fracture toughness. J. Geophys. Res. Solid Earth 2017, 122, 6014–6030. [Google Scholar] [CrossRef]
- Batto, R.A.; Schulson, E.M. On the ductile-to-brittle transition in ice under compression. Acta Metall. Mater. 1993, 41, 2219–2225. [Google Scholar] [CrossRef]
- Golding, N.; Burks, C.E.; Lucas, K.N.; Fortt, A.L.; Synder, S.A.; Schulson, E.M. Mechanical properties of the ice I-magnesium sulfate eutectic: A comparison with freshwater ice in reference to Europa. Icarus 2013, 225, 248–256. [Google Scholar] [CrossRef]
- Schulson, E.M. The brittle compressive fracture of ice. Acta Metall. Mater. 1990, 38, 1963–1976. [Google Scholar] [CrossRef]
- Deng, Y.; Li, Z.K.; Li, Z.J.; Wang, J. The experiment of fracture mechanics characteristics of Yellow River Ice. Cold Reg. Sci. Technol. 2019, 168, 102896. [Google Scholar] [CrossRef]
- Wang, E.; Xiang, F.; Han, H.; Liu, X.; Xiao, Y.; Leng, Y. Study on the mechanical properties of compacted snow under uniaxial compression and analysis of influencing factors. Cold Reg. Sci. Technol. 2020, 182, 103215. [Google Scholar] [CrossRef]
- Zhang, L.; Li, Z.; Jia, Q.; Huang, W. Experimental study on uniaxial compressive strength of reservoir ice. Trans Tianjin Univ. 2012, 18, 112–116. [Google Scholar] [CrossRef]
- Farid, H.; Saeidi, A.; Farzaneh, M.; Erchiqui, F. An atmospheric ice empirical failure criterion. Cold Reg. Sci. Technol. 2018, 146, 81–86. [Google Scholar] [CrossRef]
- Aksenov, V.I.; Gevorkyan, S.G.; Iospa, A.V. Temperature dependence of stress-strain properties of freshwater ice. Soil Mech. Found Eng. 2019, 56, 366–370. [Google Scholar] [CrossRef]
- Daoud, A.; Galanis, N.; Bellache, O. Calculation of refrigeration loads by convection, radiation and condensation in ice rinks using a transient 3D zonal model. Appl. Therm. Eng. 2008, 28, 1782–1790. [Google Scholar] [CrossRef]
- Chen, Q.; Liu, X.; Zhang, T. Effect of air parameters on ice sublimation in ice rink. Build. Environ. 2021, 188, 107470. [Google Scholar] [CrossRef]
- Zhang, P.; Li, S.X.; Zhang, Z.F. General relationship between strength and hardness. Mat. Sci. Eng. A–Struct. 2011, 529, 62–73. [Google Scholar] [CrossRef]
Figure 1.
(a) Photograph of the self–designed equipment to produce artificial ice. (b) Schematic drawing the ice-making device.
Figure 1.
(a) Photograph of the self–designed equipment to produce artificial ice. (b) Schematic drawing the ice-making device.
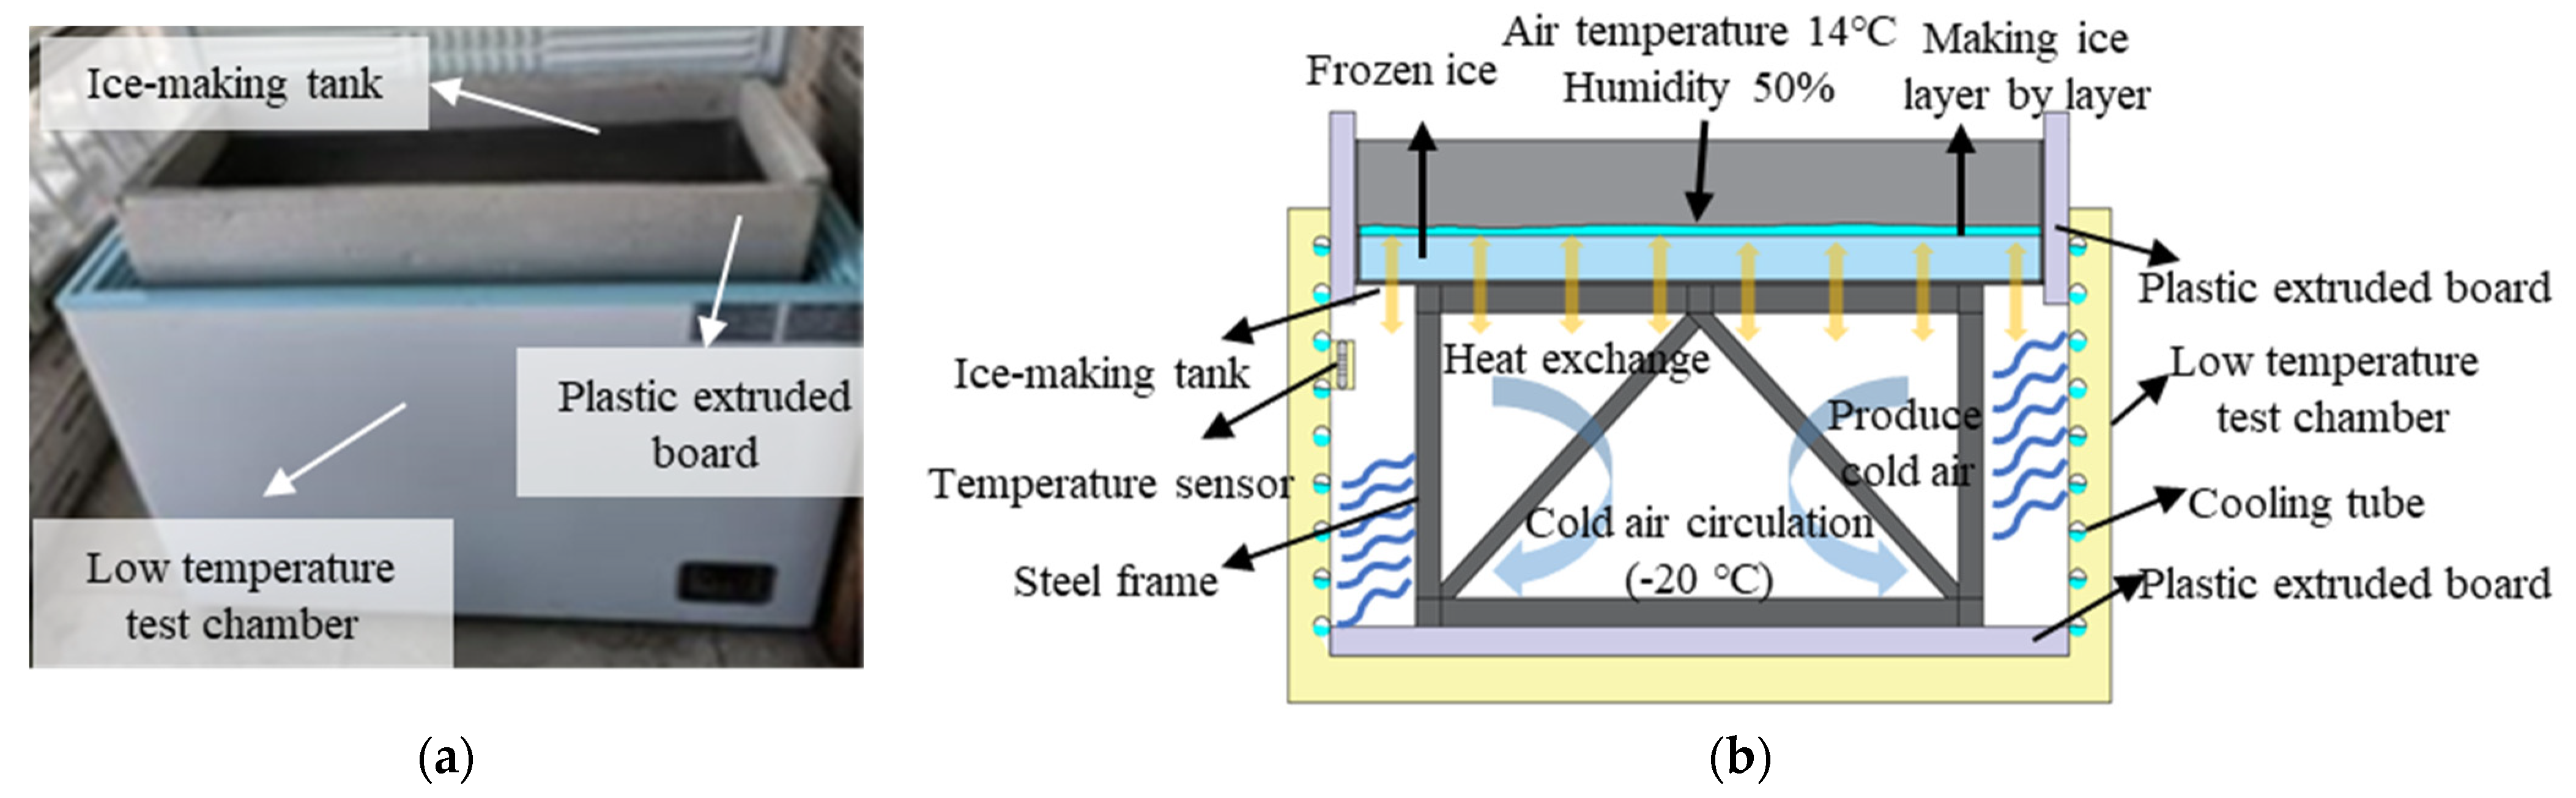
Figure 2.
(a) Horizontal sections of the crystal structure of artificial ice. (b) Vertical section of the crystal structure.
Figure 2.
(a) Horizontal sections of the crystal structure of artificial ice. (b) Vertical section of the crystal structure.

Figure 3.
Electronic universal testing machine.

Figure 4.
Stress-strain curves of ice specimens under uniaxial compression for various parameters. (a) Strain rate, (b) ice temperature, (c) ice-making mode, (d) water quality, (e) air temperature and humidity, (f) typical curves under varying strain rate.
Figure 4.
Stress-strain curves of ice specimens under uniaxial compression for various parameters. (a) Strain rate, (b) ice temperature, (c) ice-making mode, (d) water quality, (e) air temperature and humidity, (f) typical curves under varying strain rate.

Figure 5.
(a) Ductile failure of AIC–V03. (b) Brittle failure of AIC–V5.

Figure 6.
Typical failure mode of ice samples under varying strain rates.

Figure 7.
(a) Correspondence between constant load test and constant strain rate test. (b) Calculation of n using the present test data.
Figure 7.
(a) Correspondence between constant load test and constant strain rate test. (b) Calculation of n using the present test data.

Figure 8.
Results of compressive strength under varying strain rates.

Figure 9.
Relationship between effective modulus and strain rate. (a) Test results, (b) nonlinear function fitting.
Figure 9.
Relationship between effective modulus and strain rate. (a) Test results, (b) nonlinear function fitting.

Figure 10.
Relationship between compressive strength and ice temperature.

Figure 11.
Function fitting of strength and temperature.

Figure 12.
Relationship between effective modulus and temperature.

Figure 13.
Experimental results of compressive properties for artificial ice at different ice-making mode. (a) Compressive strength, (b) effective modulus.
Figure 13.
Experimental results of compressive properties for artificial ice at different ice-making mode. (a) Compressive strength, (b) effective modulus.

Figure 14.
Photos of ice spraying different thicknesses per layer. (a) 10 mm/layer, (b) 5 mm/layer.

Figure 15.
Experimental results of compressive properties for artificial ice at different water quality values. (a) Compressive strength, (b) effective modulus.
Figure 15.
Experimental results of compressive properties for artificial ice at different water quality values. (a) Compressive strength, (b) effective modulus.

Figure 16.
Experimental results of compressive properties for artificial ice at different air temperature/humidity. (a) Compressive strength, (b) effective modulus.
Figure 16.
Experimental results of compressive properties for artificial ice at different air temperature/humidity. (a) Compressive strength, (b) effective modulus.


Table 1.
Parameters of ice specimens for compressive experiments.
| NO. | Loading Rate (mm/min) | Strain Rate | Ice Temperature (°C) | Thickness/Layer (mm) | TDS (mg/L) | Air Temperature and Humidity (°C/%) |
|---|---|---|---|---|---|---|
| AIC–V005 | 0.05 | 8.33 × 10⁻⁶ | –8.5 | 5 | 10 | 14/50 |
| AIC–V015 | 0.15 | 2.5 × 10⁻⁵ | –8.5 | 5 | 10 | 14/50 |
| AIC–V03 | 0.3 | 5 × 10⁻⁵ | –8.5 | 5 | 10 | 14/50 |
| AIC–V05 | 0.5 | 8.33 × 10⁻⁵ | –8.5 | 5 | 10 | 14/50 |
| AIC–V1 | 1 | 1.67 × 10⁻⁴ | –8.5 | 5 | 10 | 14/50 |
| AIC–V2 | 2 | 3.33 × 10⁻⁴ | –8.5 | 5 | 10 | 14/50 |
| AIC–V5 | 5 | 8.33 × 10⁻⁴ | –8.5 | 5 | 10 | 14/50 |
| AIC–V10 | 10 | 1.67 × 10⁻³ | –8.5 | 5 | 10 | 14/50 |
| AIC–T5 | 5 | 8.33 × 10⁻⁴ | –5 | 5 | 10 | 14/50 |
| AIC–T15 | 5 | 8.33 × 10⁻⁴ | –15 | 5 | 10 | 14/50 |
| AIC–T25 | 5 | 8.33 × 10⁻⁴ | –25 | 5 | 10 | 14/50 |
| AIC–T35 | 5 | 8.33 × 10⁻⁴ | –35 | 5 | 10 | 14/50 |
| AIC–H1 | 5 | 8.33 × 10⁻⁴ | –8.5 | 1 | 10 | 14/50 |
| AIC–H10 | 5 | 8.33 × 10⁻⁴ | –8.5 | 10 | 10 | 14/50 |
| AIC–D50 | 5 | 8.33 × 10⁻⁴ | –8.5 | 5 | 50 | 14/50 |
| AIC–D100 | 5 | 8.33 × 10⁻⁴ | –8.5 | 5 | 100 | 14/50 |
| AIC–E10/70 | 5 | 8.33 × 10⁻⁴ | –8.5 | 5 | 10 | 10/70 |
| AIC–E22/35 | 5 | 8.33 × 10⁻⁴ | –8.5 | 5 | 10 | 22/35 |
Note: AIC is the abbreviation of artificial ice under compression; V, T, H, D and E represents the name of variables in each control group, namely loading rate, ice temperature, ice pouring thickness per layer, TDS value of water and the environment temperature humidity, respectively; The number behind the variables represents the value of variables in the control group; AIC–V5 is adopted as the standard condition.
Table 2.
Parameters of fitting functions.
| Strain Rate | a | b | R2 |
|---|---|---|---|
| In ductile regime | 12.300 | 0.195 | 0.921 |
| In brittle regime | 0.169 | −0.302 | 0.990 |
Publisher’s Note: MDPI stays neutral with regard to jurisdictional claims in published maps and institutional affiliations. |
© 2021 by the authors. Licensee MDPI, Basel, Switzerland. This article is an open access article distributed under the terms and conditions of the Creative Commons Attribution (CC BY) license (https://creativecommons.org/licenses/by/4.0/).
Share and Cite
MDPI and ACS Style
Zhang, W.; Li, J.; Yuan, B.; Wang, L.; Yang, Q. Experimental Investigation of Unconfined Compressive Properties of Artificial Ice as a Green Building Material for Rinks. Buildings 2021, 11, 586. https://doi.org/10.3390/buildings11120586
AMA Style
Zhang W, Li J, Yuan B, Wang L, Yang Q. Experimental Investigation of Unconfined Compressive Properties of Artificial Ice as a Green Building Material for Rinks. Buildings. 2021; 11(12):586. https://doi.org/10.3390/buildings11120586
Chicago/Turabian StyleZhang, Wenyuan, Junxing Li, Baojiang Yuan, Lin Wang, and Qiyong Yang. 2021. "Experimental Investigation of Unconfined Compressive Properties of Artificial Ice as a Green Building Material for Rinks" Buildings 11, no. 12: 586. https://doi.org/10.3390/buildings11120586
Note that from the first issue of 2016, this journal uses article numbers instead of page numbers. See further details here.