Mechanical Properties of Direct-Quenched Ultra-High-Strength Steel Alloyed with Molybdenum and Niobium


Materials and Mechanical Engineering, Faculty of Technology, University of Oulu, P.O. Box 4200, 90014 Oulu, Finland
*
Author to whom correspondence should be addressed.
Metals 2019, 9(3), 350; https://doi.org/10.3390/met9030350
Submission received: 6 March 2019
/
Revised: 14 March 2019
/
Accepted: 16 March 2019
/
Published: 19 March 2019
(This article belongs to the Special Issue High-Strength Low-Alloy Steels)
Abstract
:The direct quenching process is an energy- and resource-efficient process for making high-strength structural steels with good toughness, weldability, and bendability. This paper presents the results of an investigation into the effect of molybdenum and niobium on the microstructures and mechanical properties of laboratory rolled and direct-quenched 11 mm thick steel plates containing 0.16 wt.% C. Three of the studied compositions were niobium-free, having molybdenum contents of 0 wt.%, 0.25 wt.%, and 0.5 wt.%. In addition, a composition containing 0.25 wt.% molybdenum and 0.04 wt.% niobium was studied. Prior to direct quenching, finish rolling temperatures (FRTs) of about 800 °C and 900 °C were used to obtain different levels of austenite pancaking. The final direct-quenched microstructures were martensitic and yield strengths varied in the range of 766–1119 MPa. Mo and Nb additions led to a refined martensitic microstructure that resulted in a good combination of strength and toughness. Furthermore, Mo and Nb alloying significantly reduced the amount of strain-induced ferrite in the microstructure at lower FRTs (800 °C). The steel with 0.5 wt.% Mo exhibited a high yield strength of 1119 MPa combined with very low 28 J transition temperature of −95 °C in the as-quenched condition. Improved mechanical properties of Mo and Mo–Nb steels can be attributed to the improved boron protection. Also, the crystallographic texture of the investigated steels showed that Nb and Nb–Mo alloying increased the amount of {112}<131> and {554}<225> texture components. The 0Mo steel also contained the texture components of {110}<110> and {011}<100>, which can be considered to be detrimental for impact toughness properties.
1. Introduction
Thermomechanically controlled processing (TMCP) combined with direct quenching (DQ) is a novel and effective processing route to produce ultrahigh-strength, high-performance steels [1,2,3]. Energy efficiency has become a critical issue in recent times as a result of environmental reasons; hence, the need for making lighter and more energy-efficient structures with high-strength steels has become increasingly important. Quenching directly after hot rolling is an interesting energy-efficient alternative to the conventional processing route, as the re-heating prior to quenching can be omitted.
Conventional offline re-heating and quenching (RQ) has been a well-established process to produce high-strength steel plates for quite some time. The use of microalloying in high-strength steels has become more common because of the possibility to further improve the steel properties. Metallurgically, it is well established that the use of Nb in thermomechanical processing is highly effective as it retards the static recrystallization (SRX) of austenite at high temperatures [4]. It is also known that while Mo alone does not have a very significant impact on recrystallization behaviour, Mo combined with Nb leads to a synergistic increase in the retardation of recrystallization process [5]. Mo reduces the activity of C and N, which retards the amount of Nb precipitation, thus leading to more solute Nb retarding SRX [6]. However, as direct-quenching is a relatively new process industrially, the metallurgical effects of Mo and Nb alloying on direct-quenched steels are not completely understood or established. The purpose of this study was to examine the effects of Mo and Nb additions on the mechanical properties and microstructures of thermomechanically processed, direct-quenched, high-strength low carbon steels.
2. Materials and Methods
The materials used in the present investigation were low carbon (~0.16 wt.%) steels with constant levels of manganese (1.1 wt.%), chromium (0.5 wt.%), and nickel (0.5 wt.%) alloying. Boron contents were also kept constant at ~15 ppm. The compositions studied covered three molybdenum levels without Nb, that is, 0 wt.%, 0.25 wt.%, and 0.5 wt.% Mo. A fourth composition bearing 0.25 wt.% Mo was also alloyed with 0.04 wt.% Nb. Each steel was named after the contents of Mo and Nb, as shown in Table 1. The chosen compositions were vacuum cast into approximately 70 kg slabs at the Tornio Research Centre of Outokumpu Oyj, Finland. Then, 180 mm × 80 mm × 55 mm pieces of the castings were homogenized at 1100 °C for 2 h and thermomechanically rolled into approximately 11 mm thick plates according to the rolling schedule given in Table 2. The temperature of the samples during rolling and direct quenching was monitored by thermocouples placed in holes drilled in the edges of the samples to the mid-width at mid-length. The effective cooling rate at the centre of the plates was ~40 °C/s. Two finish rolling temperatures (FRTs) of 800 and 900 °C (accuracy ± 20 °C) were used prior to quenching in a water bath.
Tensile tests and Charpy-V impact tests were performed to evaluate the strength and toughness properties using specimens with their long axes parallel to the rolling direction, that is, longitudinal specimens. Tensile tests were performed at room temperature using three round-bar specimens/rolled samples with a diameter of 6 mm and parallel length of 40 mm, following the standard ISO 6892-1:2009 [7]. Charpy V-transition curves were obtained using 10 × 10 × 55 mm3 specimens with through-thickness notches tested at various temperatures with two specimens/temperatures in the range 20 to −140 °C, following the European standard EN 10 045-1:1990 [8].
Microstructural characterization was executed using field-emission scanning electron microscopy (Carl Zeiss AG, Oberkochen, Germany) combined with electron backscatter diffraction (FESEM-EBSD). The linear intercept method applied to laser scanning confocal microscopy (LSCM) images from specimens etched with saturated picral in soap solution was used to determine the prior austenite grain sizes in three principal directions: the rolling direction (RD), transverse to the rolling direction (TD), and the plate normal direction (ND) at the quarter-thickness of the specimen. On the basis of these measurements, the aspect ratio (r), total reduction below the recrystallization temperature (Rtot), grain boundary surface area per unit volume (Sv), and average grain size (d) were determined using the equations shown in Table 3 [9].
EBSD measurements and analyses were performed using the EDAX-OIM acquisition and analysis software (7.1.0, Amatek Inc., Berwyn, PA, USA). The FESEM for the EBSD measurements was operated at 15 kV using a step size of 0.15 μm. The scanned area was approximately 90 μm × 90 μm. Lath and effective grain sizes were determined as equivalent circle diameter (ECD) values with low-angle (2.5–15°) and high-angle boundary misorientations (15–63°), respectively. Minimum grain size was determined as three pixels (at least three points to be defined as grains), which corresponds to a grain diameter over 0.27 μm. The confidence index value (CI) was set to be more than 0.1, and clean-up of the data was executed using grain dilatation procedure, which will modify the orientations of points that do not belong to any grains.
X-Ray diffraction (XRD) analyses were carried out using a Rigaku SmartLab 9 kW X-ray diffractometer (Rigaku Corporation, Tokyo, Japan) with Cu Kα radiation. Data analysis was performed using PDXL2 analysis software (PDXL 2.6.1.2, Rigaku Corporation, Tokyo, Japan) to estimate the lattice parameters, microstrains, and crystallite sizes of the investigated steels. Furthermore, dislocation densities were estimated using the Williamson–Hall method (Equation (1)) [10,11].
where ρs is dislocation density calculated from strain broadening and ρp is dislocation density calculated from particle, that is, crystallite size, see Equations (2) and (3). Furthermore, according to Williamson et al. [10,11]:
and
where ε is microstrain, b is the burgers vector, F is an interaction factor assumed to be 1, factor k is assumed as 14.4 for body-centred cubic metals, and D is crystallite size. In the equation, n is dislocations per block face, assumed to be 1 [11].
3. Results and Discussion
3.1. Prior Austenite Grain Structure after Hot Rolling
Table 4 shows the measured austenite grain sizes, calculated Sv values, and corresponding Rtot values for FRTs of 800 and 900 °C. Generally, the Sv values and reduction percentages below the recrystallization temperature were higher when both Mo and Nb were present. The lower FRT of 800 °C led to higher austenite pancaking, that is, higher Rtot values, although calculated Sv values were generally lower, which is probably caused by grain boundary ferrite complicating the grain size calculations. Mo alloying did retard the recrystallization process without the presence of Nb, but the combination of Nb and Mo had a greater effect in delaying recrystallization. In the case of the 0.25Mo–Nb composition, the same level of austenite reduction below the recrystallization temperature was achieved with both FRTs, indicating that the no-recrystallization temperature (TNR) of this composition is higher than 900 °C. Comparing the values of Rtot with the reductions after pass three in Table 2 indicates that the TNR temperature lies close to ~1030 °C in the case of 0.25Mo–Nb steel. Similarly, the TNR temperature of 0.5Mo steel seems to be about 910 °C, considering the case of FRT at 800 °C. Prior austenite grain size measurements confirmed that Mo too affected the recrystallization kinetics as expected and increased the TNR temperature.
The differences in prior austenite grain structures and the influence of Mo and Nb in increasing the amount of austenite pancaking are evident from Figure 1 and Figure 2. In addition, at the low FRT of 800 °C, a significant amount of strain-induced ferrite formed at the prior austenite grain boundaries, which can be seen as bands of white grains along the prior austenite grain boundaries. However, the presence of Mo and Nb significantly reduced the occurrence of strain-induced ferrite, although a small amount of ferrite did also form in the Mo and Nb alloyed steels (Figure 2a–d). Therefore, a combination of Nb–Mo alloying had a stronger effect on hindering ferrite formation compared with only Mo-alloyed steel, as seen when comparing Figure 2b,d. However, an increase in Mo content to 0.5% (0.5Mo steel; Figure 2c) showed a pronounced effect on hindering ferrite formation, if compared with 0.25Mo steel (Figure 2b).
3.2. Transformed Microstructure
On the basis of the chemical compositions of the steels, continuous cooling transformation (CCT) diagrams were constructed using JMatPro 6.0® software to help interpret the results of the hot rolling experiments (Figure 3). This software can be used to predict CCT diagrams only for recrystallized, that is, undeformed, austenite. It can be seen that for such conditions, the addition of Mo is predicted to delay ferrite formation to lower cooling rates. As shown in Figure 3, the predicted equilibrium A3 temperatures for the studied compositions are in the range of 812–821 °C. On the basis of the JMatPro calculations, Nb is predicted to have no effect on the transformation behaviour. At the cooling rates that follow the actual hot rolling experiments, that is, ~40–50 °C/s, microstructures should be fully martensitic with a Vickers hardness of ~420 HV10. However, it is clear from Figure 2 that the low-temperature deformation with an FRT of 800 °C led to the formation of strain-induced ferrite at the prior austenite grain boundaries, either during rolling or subsequent quenching even, to some extent, in the 0.5% Mo composition. Such a deformation in the vicinity of A3 temperature, therefore, leads to accelerated ferrite formation compared with the predictions of Figure 3.
Figure 4 shows typical microstructures of the investigated steels with an FRT of 900 °C in the as-quenched condition at the ¼ depth position. Generally, the microstructures consisted of packets and blocks of martensitic laths refined and randomized in different directions. Auto-tempering of the martensite also occurred in some regions of the microstructures, as is evident from very fine carbides within the martensite laths. On the basis of the microstructural characterizations, the higher FRT of 900 °C produced mainly martensitic microstructures in all cases (Figure 4), however, a slightly coarser lath structure can be seen in 0Mo steel.
The microstructures with an FRT of 900 °C were further characterized using EBSD. The mean effective grain and lath sizes were determined as equivalent circle diameter (ECD) values with low-angle boundary misorientations (2.5–15°), corresponding to lath size and high-angle boundary misorientations (>15°) corresponding to effective grain size. The effective grain size is used to describe the packet/block size of martensite divided by high-angle boundaries Also, the effective coarse high-angle grain sizes at the 90th percentile in the cumulative grain area distribution (d90%) were determined. The results, presented in Figure 5a, revealed no great differences in the various grain sizes of the transformed microstructures. Mo and Mo–Nb microalloying led to a small decrease in the mean effective grain and lath sizes, presumably because of the more pancaked austenite structures, corroborating the results presented in Table 2. However, no significant differences between d90% grain sizes were observed, although the 0.25Mo–Nb steel shows a somewhat higher d90% value. Furthermore, on the basis of the EBSD data, ECD effective high-angle grain sizes at different percentiles in the cumulative grain area distribution of the investigated steels after direct quenching from an FRT of 900 °C are given in Figure 6. Differences can only be seen in the 80th and 90th percentile grain diameters (d80% and d90%), indicating that there are only minor differences in the grain size distributions.
Also, grain misorientation angle distributions were determined using the EBSD data, and the results are presented in Figure 5b. Misorientation peaks at ~7.5° (sub-block boundaries), 16°, 52.5°, and 59° (packet or/and block boundaries) were detected, and they are a result of the different variants of the Kurdjumov–Sachs orientation relationship. Clear peaks at ~7.5° and ~59° are typical peaks for martensite or lower bainite microstructures [12,13]. On the basis of the misorientation distributions, no clear differences between the studied steels are apparent, which further supports the conclusion that all the investigated steels comprised mainly martensite in the direct-quenched condition when an FRT of 900 °C was used, as was also observed in other microstructural investigations. The defined low-angle and high-angle boundaries of investigated steels with an FRT of 900 °C can be seen from Figure 7. The lath-type structure with high density of low-angle boundaries (red lines) are clearly visible in Figure 7. Also slightly more elongated grain structure of 0.25Mo-Nb steel can be seen from Figure 7d.
3.3. Mechanical Properties after Hot Rolling and Direct Quenching
The tensile properties of the investigated steels in the as-quenched condition are presented in Table 5. The FRT of 900 °C resulted in a yield stress (Rp0.2, i.e., 0.2% offset proof stress) in the range of 950–1119 MPa and total elongation to fracture values in the narrow range of 8.6%–10.7%. With the FRT of 900 °C, the 0Mo steel showed rather low yield and tensile strengths, but an addition of 0.25 wt.% Mo enhanced the strength by more than 100 MPa (Table 5). The influence of ferrite can be discerned by comparing the results obtained at the FRT of 800 °C (Table 6). Strength values dropped in the case of steels with 0 wt.%–0.25 wt.% Mo, where significant amounts of ferrite formed at the lower FRT. In the case of the 0.5Mo and 0.25Mo–Nb steels, however, nearly identical yield and tensile strengths were achieved at both FRTs, which indicates that the presence of the very small amounts of strain-induced ferrite (corresponding to 800 °C FRT) had practically no appreciable effect on the yield and tensile strengths. In the case of the two leanest compositions, the presence of larger fractions of strain-induced ferrite seemed to have a negative effect on ductility, thus reducing the total elongations to fracture (A) in comparison with the values obtained at higher FRTs (without ferrite), presumably because of strain concentration and fracture in the softer phase. A corresponding effect is observed in the Rm × A values shown in Table 5.
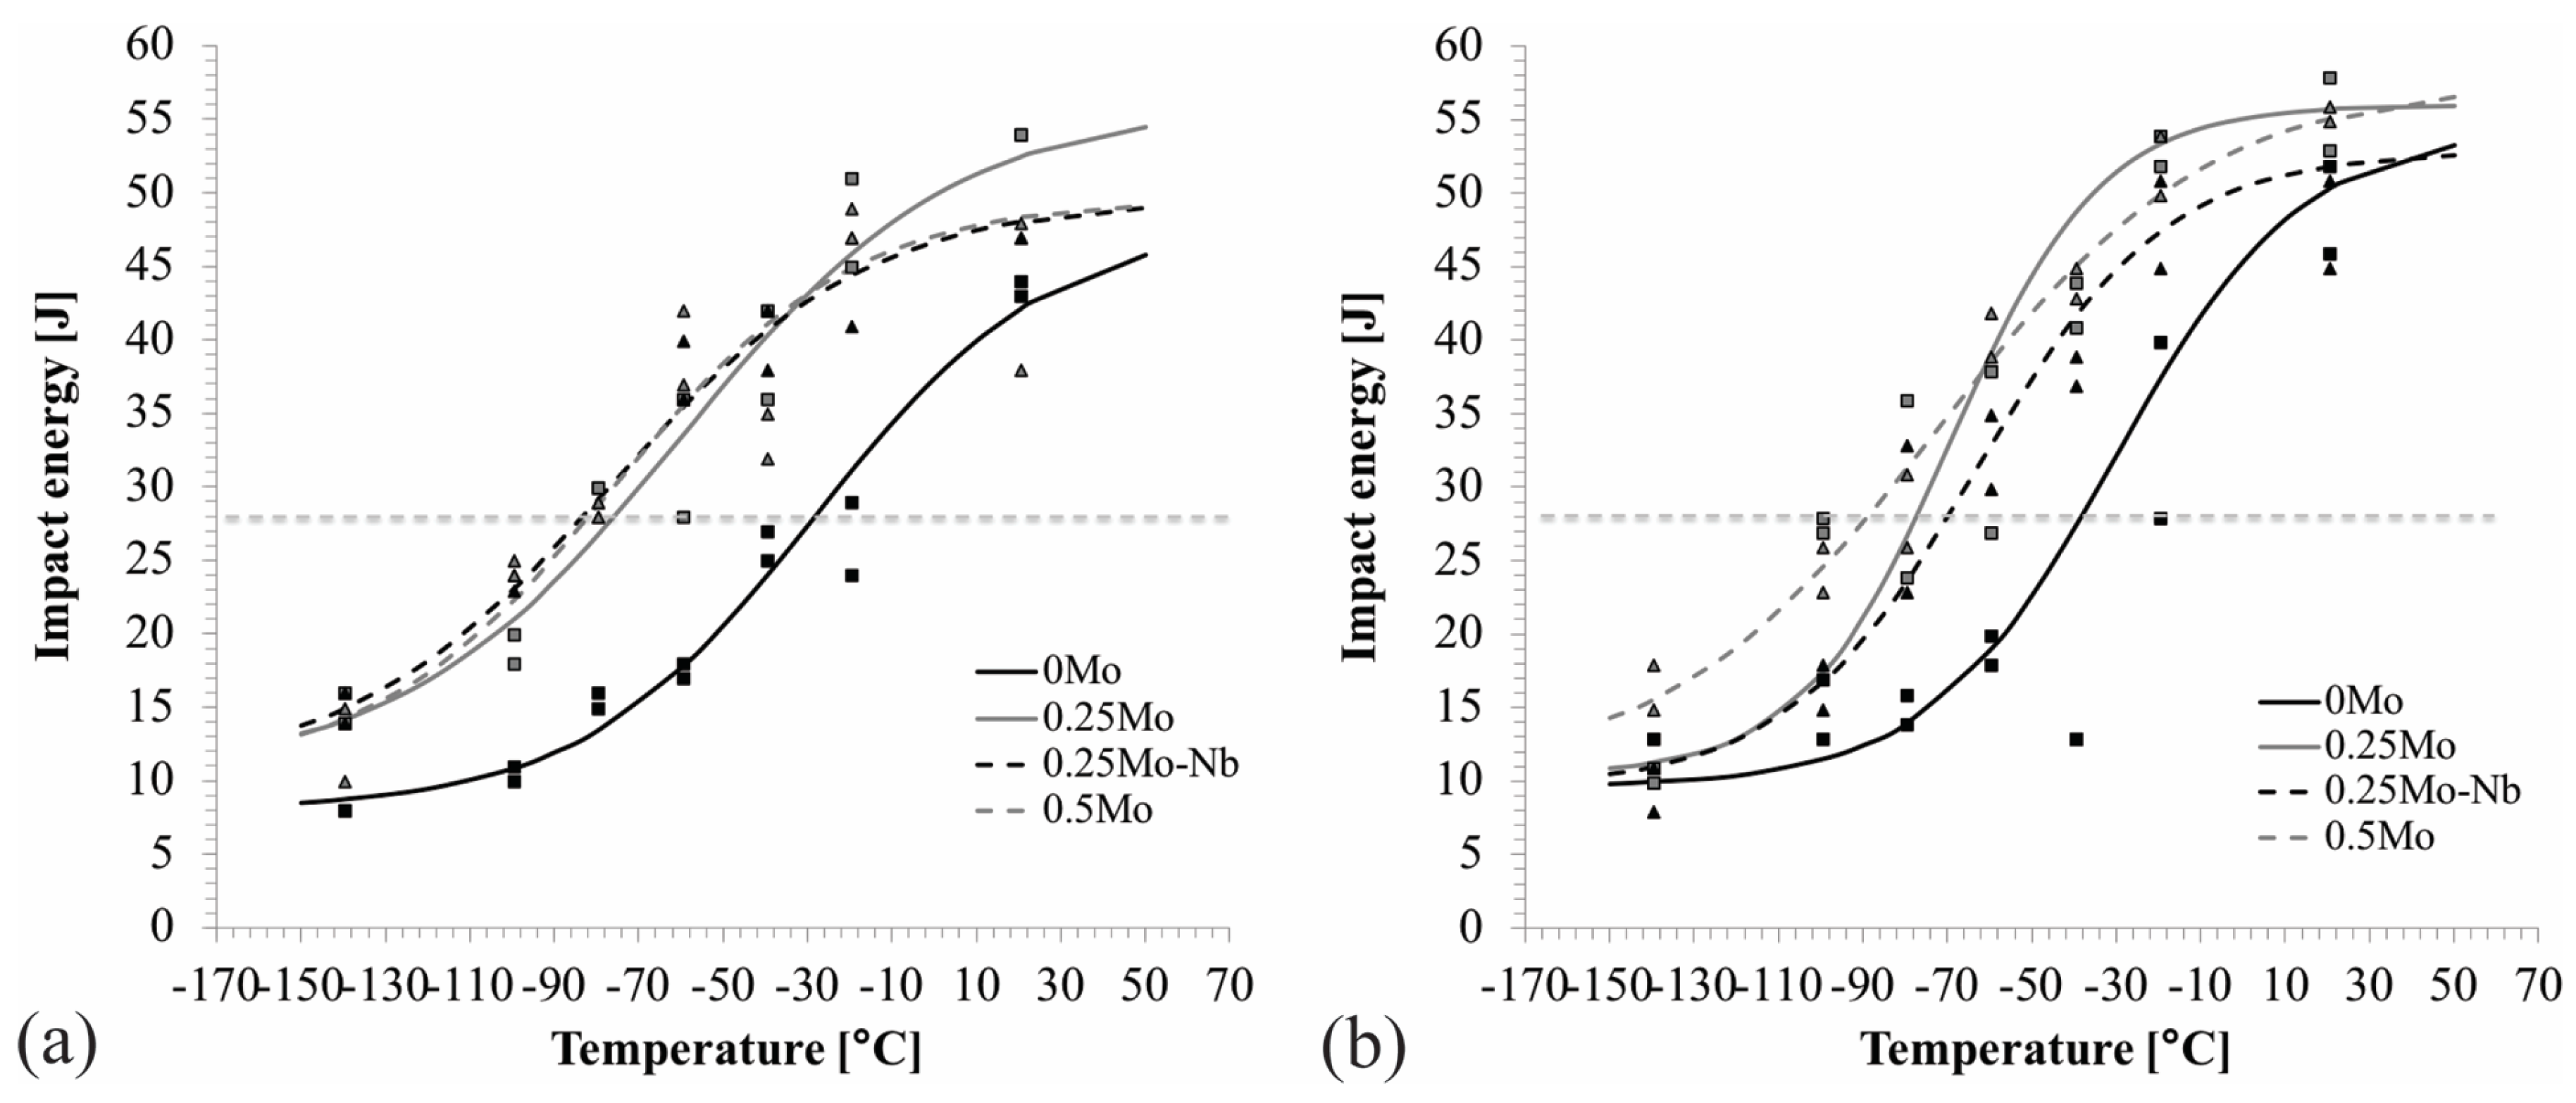
Transition curves were constructed based on the Charpy-V impact test results obtained in the temperature range +20 to −140 °C, see Figure 8. It can be seen that additions of Mo and Nb significantly improved the impact toughness, even though both the yield and tensile strengths were higher compared with those of the unalloyed 0Mo steel. Figure 9 shows how, for both FRTs, excellent combinations of strength and 28 J transition temperatures are obtained with the highest level of Mo or a lower Mo content in combination with Nb.
3.4. Correlation between Mechanical Properties and Microstructural Features
Crystallite sizes, microstrains, and dislocation densities measured using XRD are presented in Table 6 for the materials rolled with the FRT of 900 °C. According to the XRD measurements of the studied steels in the quenched conditions, crystallite sizes and microstrains were almost equal, producing dislocation densities varying in the narrow range 3.52–4.04 × 10¹⁵ m−2. On the basis of earlier studies, it has been reported that dislocation density of lath martensite can be between 1 × 10¹⁵ m−2 and 1 × 10¹⁶ m−2 [14,15]. Also, Saastamoinen [16] et al. have reported similar dislocation densities for martensitic steels with corresponding carbon levels to those in the present study. Slight differences can be noticed when comparing the dislocation densities of the direct-quenched samples, but no statistically acceptable conclusions can be made.
Figure 10 presents the transformation texture of the investigated steels measured by using X-ray diffraction. In the case of the Nb and Nb–Mo alloyed steels, stronger {112}<131> and {554}<225> components were discovered as a result of martensitic ferrite formation from unrecrystallized pancaked austenite. The 0Mo steel showed clear {110}<110> and {011}<100> components, but exhibited only weak {112}<131> and {554}<225> components, see Figure 10a. In previous studies, it has been noticed that {110}<110> texture components can enhance the propagation of cleavage fracture and thus decrease low-temperature toughness [17].
The better properties of Mo alloyed steels can also be a result of boron protection. It is commonly known that soluble boron increases the hardenability by segregating at the prior austenite grain boundaries and thereby reducing the tendency to the formation of grain boundary ferrite [9,10]. In the present study, the addition of Mo and Mo–Nb efficiently reduced the amount of grain boundary ferrite, which can be the result of the segregation of Mo and Nb at the austenite grain boundaries, and at the same time, preventing formation of boron-containing precipitates. The formation of such precipitates at grain boundaries can provide nucleation sites for ferrite, thereby reducing the hardenability and resulting in lower strength and hardness. Further, the precipitates can deteriorate the impact toughness by acting as nucleation sites for fracture [18,19]. Table 7 presents the calculated hardness values using JMatPro® software of 0Mo steel with and without boron alloying to see the effect of boron on the hardenability of this steel. The boron alloying is predicted to increase the hardness by 50 HV, which corresponds to an approximately 150 MPa increase in tensile strength. When comparing the tensile strengths of 0Mo and 0.25Mo steels with FRT of 900 °C to exclude the effect of grain boundary ferrite, the difference between tensile strength values was 126 MPa, which is relatively close to predicted difference based on JMatPro calculations (Table 7). The higher than predicted tensile strengths of the hot-rolled and direct-quenched steels when compared with the predictions of JMatPro can be explained by the finer martensitic microstructure achieved with austenite pancaking during controlled deformation and rapid direct quenching.
Fracture surfaces of Charpy V-notch test samples were characterized to evaluate the crack propagation through the material. Figure 11 presents the brittle fracture surfaces of 0Mo and 0.25Mo steels analyzed with scanning electron microscope (SEM). In the case of 0Mo steel, the fracture type was mainly transgranular fracture, also showing some indications of quasi-cleavage fracture (Figure 11c). However, in the case of 0.25Mo steel, the fracture type was more quasi-cleavage showing more areas with features of ductile fracture, such as tear ridges and dimpled rupture fracture (Figure 11d). No features of intergranular fracture were detected in the case of both steels, indicating that boron was not deteriorating the grain boundary toughness by precipitating at prior austenite grain boundaries. It can be concluded that for 0Mo steel, crack propagation through the specific crystallographic planes is easier than for 0.25Mo steel, which can be attributed to differences in texture components, shown in Figure 10.
4. Summary and Conclusions
The effect of molybdenum and niobium on the microstructures and mechanical properties of laboratory control rolled and direct-quenched 11 mm thick steel plates containing 0.16 wt.% C was studied. Two finish rolling temperatures of 800 and 900 °C were used. The plates were direct quenched to room temperature following thermomechanical processing at a cooling rate of ~40–50 °C/s. On the basis of the results, the following conclusions can be drawn:
- Mo and Nb microalloying raise the no-recrystallization temperature, leading to a more pancaked austenite and higher Sv values. There is a strong synergy between Nb and Mo.
- On the basis of microstructural and SEM-EBSD analyses, microstructures were essentially martensitic when the finish rolling temperature was 900 °C. There were no significant differences in the lath sizes, mean effective grain sizes, or the 10–90th percentile effective grain sizes among the different compositions studied. Also, grain boundary misorientation distributions were identical and typical for martensite.
- The finish rolling temperature of 800 °C led to the formation of strain-induced ferrite at the austenite grain boundaries, which deteriorated yield and tensile strengths, but the addition of Mo and Mo–Nb significantly enhanced hardenability and decreased the amount of ferrite formation, and thereby increased the strength.
- For FRTs of 800 and 900 °C, Mo and Mo–Nb microalloying increased both the strength and impact toughness of the direct-quenched state.
- For the FRT of 900 °C, where the incidence of ferrite is very limited, there is a positive correlation between yield strength and transition temperature and the specific prior austenite grain boundary area Sv. However, EBSD analysis did not show any significant differences in the various martensite grain sizes (lath and effective grain size), thus indicating that a finer grain structure is not the reason for the higher strength. Nor were there significant differences in the dislocation densities of the steels.
- JMatPro calculations indicated that, for the present steel compositions, the increase in strength caused by the addition of Mo is partly explained by an additional hardenability increase caused by boron protection.
- The crystallographic texture of the investigated steels with an FRT of 900 °C showed that Nb and Nb–Mo alloying increased the amount of {112}<131> and {554}<225> texture components, whereas in the absence of Mo and Nb, the texture components {110}<110> and {011}<100> appear, which are detrimental to impact transition temperature. Brittle fracture surfaces of the Charpy V-notch test samples showed that for 0Mo steel, crack propagation through the crystallographic planes was easier, which can be the result of differences in texture components.
- With the addition of Mo, and Mo–Nb microalloying and direct quenching, martensitic steel with over 1400 MPa tensile strength combined with excellent impact toughness properties was produced, which can be used for demanding structural applications.
Author Contributions
Writing—original draft, J.H.; writing—review and editing, A.K., D.P., and M.S.; supervision, J.K.
Funding
This research was funded by IMOA (International Molybdenum Association).
Acknowledgments
Financial support of the IMOA (International Molybdenum Association) is gratefully acknowledged.
Conflicts of Interest
The authors declare no conflict of interest.
References
- Endo, S.; Nakata, N. Development of Thermo-Mechanical Control Process (TMCP) and high performance steel in JFE Steel. JFE Tech. Rep. 2015, 20, 1–7. [Google Scholar]
- Nishioka, K.; Ichikawa, K. Progress in thermomechanical control of steel plates and their commercialization. Sci. Technol. Adv. Mater. 2012, 13, 023001. [Google Scholar] [CrossRef] [PubMed]
- Kaijalainen, A.J.; Suikkanen, P.P.; Limnell, T.J.; Karjalainen, L.P.; Kömi, J.I.; Porter, D.A. Effect of austenite grain structure on the strength and toughness of direct-quenched martensite. J. Alloy. Compd. 2013, 577, S642–S648. [Google Scholar] [CrossRef]
- Palmiere, E.J.; Garcia, C.I.; DeArdo, A.J. Supression of static recrystallization in microalloyed steels by strain-induced precipitation. In Proceedings of the International Symposium on Low-Carbon Steels for the 90s, Warrendale, PA, USA, 17–21 October 1993; Asfahani, R., Tither, G., Eds.; TMS: Pittsburgh, PA, USA, 1993; pp. 121–130. [Google Scholar]
- Pereda, B.; Fernández, A.I.; López, B.; Rodriguez-Ibabe, J.M. Effect of Mo on Dynamic Recrystallization Behavior of Nb-Mo Microalloyed Steels. ISIJ Int. 2007, 47, 860–868. [Google Scholar] [CrossRef]
- Akben, M.G.; Weiss, I.; Jonas, J.J. Dynamic precipitation and solute hardening in A V microalloyed steel and two Nb steels containing high levels of Mn. Acta Metall. 1981, 29, 111–121. [Google Scholar] [CrossRef]
- ISO 6892-12016. Metallic materials—Tensile testing—Part 1: Method of test at room temperature; International Organization for Standardization: Geneva, Switzerland, 2016. [Google Scholar]
- ISO 148-12016. Metallic materials—Charpy pendulum impact test—Part 1: Test method; International Organization for Standardization: Geneva, Switzerland, 2016. [Google Scholar]
- Higginson, R.L.; Sellars, C.M. Worked Examples in Quantitative Metallography; Maney: London, UK, 2003; pp. 45–47. ISBN 1902653807. [Google Scholar]
- Williamson, G.K.; Hall, W.H. X-Ray broadening from filed aluminium and tungsten. Acta Metall. 1953, 1, 22–31. [Google Scholar] [CrossRef]
- Williamson, G.K.; Smallman, R.E. III. Dislocation densities in some annealed and cold-worked metals from measurements on the X-ray debye-scherrer spectrum. Philos. Mag. 1956, 1, 34–46. [Google Scholar] [CrossRef]
- Dong, H.; Sun, X.; Yong, Q.; Li, Z.; Weng, Y.; Yang, Z. Third generation high strength low alloy steels with improved toughness. Sci. China Technol. Sci. 2012, 55, 1797–1805. [Google Scholar]
- Zajac, S.; Schwinn, V.; Tacke, K.H. Characterisation and Quantification of Complex Bainitic Microstructures in High and Ultra-High Strength Linepipe Steels. Mater. Sci. Forum 2005, 500–501, 387–394. [Google Scholar] [CrossRef]
- Kennett, S.C.; Krauss, G.; Findley, K.O. Prior austenite grain size and tempering effects on the dislocation density of low-C Nb-Ti microalloyed lath martensite. Scr. Mater. 2015, 107, 123–126. [Google Scholar] [CrossRef]
- Morito, S.; Nishikawa, J.; Maki, T. Dislocation Density within Lath Martensite in Fe–C and Fe–Ni Alloys. ISIJ Int. 2003, 43, 1475–1477. [Google Scholar] [CrossRef]
- Saastamoinen, A.; Kaijalainen, A.; Porter, D.; Suikkanen, P.; Yang, J.-R.; Tsai, Y.-T. The effect of finish rolling temperature and tempering on the microstructure, mechanical properties and dislocation density of direct-quenched steel. Mater. Character. 2018, 139, 1–10. [Google Scholar] [CrossRef]
- Pallaspuro, S.; Kaijalainen, A.; Mehtonen, S.; Kömi, J.; Zhang, Z.; Porter, D. Effect of microstructure on the impact toughness transition temperature of direct-quenched steels. Mater. Sci. Eng. A 2018, 712, 671–680. [Google Scholar] [CrossRef]
- Taylor, K.A. Grain-boundary segregation and precipitation of boron in 0.2 percent carbon steels. Metall. Trans. A 1992, 23, 107–119. [Google Scholar] [CrossRef]
- Antunes, J.P.G.; Nunes, C.A. Characterization of Impact Toughness Properties of DIN39MnCrB6-2 Steel Grade. Mater. Res. 2017, 21, 2–6. [Google Scholar] [CrossRef]
Figure 1.
Prior austenite grain boundaries of the investigated steels with finish rolling temperature (FRT) of 900 °C: (a) 0Mo, (b) 0.25Mo, (c) 0.5Mo, and (d) 0.25Mo–Nb. RD = rolling direction, ND = normal direction.
Figure 1.
Prior austenite grain boundaries of the investigated steels with finish rolling temperature (FRT) of 900 °C: (a) 0Mo, (b) 0.25Mo, (c) 0.5Mo, and (d) 0.25Mo–Nb. RD = rolling direction, ND = normal direction.

Figure 2.
Prior austenite grain boundaries of the investigated steels with FRT of 800 °C: (a) 0Mo, (b) 0.25Mo, (c) 0.5Mo, and (d) 0.25Mo–Nb. Grain boundary ferrite can also be discerned. RD = rolling direction, ND = normal direction.
Figure 2.
Prior austenite grain boundaries of the investigated steels with FRT of 800 °C: (a) 0Mo, (b) 0.25Mo, (c) 0.5Mo, and (d) 0.25Mo–Nb. Grain boundary ferrite can also be discerned. RD = rolling direction, ND = normal direction.

Figure 3.
CCT diagrams constructed using JMatPro software. (a) 0Mo, (b) 0.5Mo, no deformation, austenite grain size 30 µm.
Figure 3.
CCT diagrams constructed using JMatPro software. (a) 0Mo, (b) 0.5Mo, no deformation, austenite grain size 30 µm.

Figure 4.
Typical microstructures (field-emission scanning electron microscopy (FESEM) after etching in 2% nital) of investigated steels in as-quenched condition, FRT 900 °C. (a) 0Mo, (b) 0.25Mo, (c) 0.5Mo, (d) 0.25Mo–Nb. Red lines show examples of martensite packets in the microstructure.
Figure 4.
Typical microstructures (field-emission scanning electron microscopy (FESEM) after etching in 2% nital) of investigated steels in as-quenched condition, FRT 900 °C. (a) 0Mo, (b) 0.25Mo, (c) 0.5Mo, (d) 0.25Mo–Nb. Red lines show examples of martensite packets in the microstructure.

Figure 5.
Results of the electron backscatter diffraction (EBSD) analysis in the as-quenched condition (FRT 900 °C). (a) Mean effective equivalent circle diameter (ECD) grain and lath sizes, and the ECD size of the coarsest grains (d90%), (b) grain boundary misorientation distributions (>2.5°).
Figure 5.
Results of the electron backscatter diffraction (EBSD) analysis in the as-quenched condition (FRT 900 °C). (a) Mean effective equivalent circle diameter (ECD) grain and lath sizes, and the ECD size of the coarsest grains (d90%), (b) grain boundary misorientation distributions (>2.5°).

Figure 6.
ECD effective high-angle grain sizes at different percentiles in the cumulative grain area distribution of the investigated steels after direct quenching for an FRT of 900 °C.
Figure 6.
ECD effective high-angle grain sizes at different percentiles in the cumulative grain area distribution of the investigated steels after direct quenching for an FRT of 900 °C.

Figure 7.
EBSD maps of investigated steels with an FRT of 900 °C showing low-angle boundaries (2.5–15°, red lines) and high-angle boundaries (>15°, blue lines). (a) 0Mo, (b) 0.25Mo, (c) 0.5Mo, (d) 0.25Mo–Nb.
Figure 7.
EBSD maps of investigated steels with an FRT of 900 °C showing low-angle boundaries (2.5–15°, red lines) and high-angle boundaries (>15°, blue lines). (a) 0Mo, (b) 0.25Mo, (c) 0.5Mo, (d) 0.25Mo–Nb.

Figure 8.
Transition curves in longitudinal direction for the as-quenched specimens: (a) FRT 800 °C, and (b) FRT 900 °C.
Figure 8.
Transition curves in longitudinal direction for the as-quenched specimens: (a) FRT 800 °C, and (b) FRT 900 °C.

Figure 9.
Correlation of the 28 J transition temperatures and the yield strength: (a) FRT 800 °C and (b) FRT 900 °C.
Figure 9.
Correlation of the 28 J transition temperatures and the yield strength: (a) FRT 800 °C and (b) FRT 900 °C.

Figure 10.
φ2 = 45° sections of ODFs for specimen (a) 0Mo, (b) 0.25Mo, (c) 0.5Mo, (d) 0.25Mo–Nb. (Levels: 0.5,1.0,1.5,2.0…).
Figure 10.
φ2 = 45° sections of ODFs for specimen (a) 0Mo, (b) 0.25Mo, (c) 0.5Mo, (d) 0.25Mo–Nb. (Levels: 0.5,1.0,1.5,2.0…).

Figure 11.
Brittle fracture surfaces (scanning electron microscope, SEM) of (a,c) 0Mo steel and (b,d) 0.25Mo steel.
Figure 11.
Brittle fracture surfaces (scanning electron microscope, SEM) of (a,c) 0Mo steel and (b,d) 0.25Mo steel.


Table 1.
Chemical compositions of investigated steels in wt.%.
| Steel | C | Si | Mn | Cr | Ni | Mo | Nb | Al | B | N |
|---|---|---|---|---|---|---|---|---|---|---|
| 0Mo | 0.16 | 0.2 | 1.0 | 0.5 | 0.5 | - | - | 0.03 | 0.0014 | 0.0050 |
| 0.25Mo | 0.16 | 0.2 | 1.1 | 0.5 | 0.5 | 0.25 | - | 0.03 | 0.0015 | 0.0043 |
| 0.5Mo | 0.16 | 0.2 | 1.1 | 0.5 | 0.5 | 0.5 | - | 0.025 | 0.0016 | 0.0051 |
| 0.25Mo–Nb | 0.16 | 0.2 | 1.1 | 0.5 | 0.5 | 0.25 | 0.04 | 0.02 | 0.0016 | 0.0047 |
Table 2.
Hot rolling pass schedules giving finish rolling temperatures (FRTs) of 800 and 900 °C.
| Pass | Thickness (mm) | Temperature (°C) | Reduction per Pass (%) | Total Reduction (%) | Reduction after Pass 3 (%) |
|---|---|---|---|---|---|
| - | 52 | 1100 | - | - | - |
| 1 | 42 | 1100 | 19 | 19 | - |
| 2 | 33 | 1050/1080 | 21 | 37 | - |
| 3 | 26 | 1000/1060 | 21 | 50 | - |
| 4 | 20 | 910/1030 | 23 | 62 | 23 |
| 5 | 15 | 850/960 | 25 | 71 | 42 |
| 6 | 11.2 | 800/900 | 25 | 78 | 57 |
Table 3.
Austenite grain structure parameters [9].
Table 3.
Austenite grain structure parameters [9].
| Parameter | Equation |
|---|---|
| r | dRD/dND |
| Rtot | 1− √(1/r) |
| Sv | 0.429 × (1/dRD) + 0.571 × (1/dTD) + (1/dND) |
| d | (dRD × dTD × dND)⅓ |
Table 4.
Average austenite grain sizes in three principal directions and corresponding d, Sv, and Rtot estimated for different finish rolling temperatures (FRTs).
Table 4.
Average austenite grain sizes in three principal directions and corresponding d, Sv, and Rtot estimated for different finish rolling temperatures (FRTs).
| FRT | Steel | dRD (μm) | dND (μm) | dTD (μm) | d (μm) | Sv (mm2/mm3) | Rtot (%) |
|---|---|---|---|---|---|---|---|
| 900 °C | 0Mo | 19.2 | 14.9 | 19.5 | 17.7 | 119 | 12.0 |
| 0.25Mo | 19.2 | 8.4 | 15.9 | 13.7 | 177 | 33.8 | |
| 0.5Mo | 16.1 | 7.4 | 12.2 | 11.3 | 210 | 32.4 | |
| 0.25Mo–Nb | 23.5 | 5.8 | 14.5 | 12.6 | 229 | 50.2 | |
| 800 °C | 0Mo | 26.7 | 10.7 | 22.2 | 18.5 | 135 | 36.7 |
| 0.25Mo | 36.9 | 11.3 | 23.5 | 21.4 | 125 | 44.7 | |
| 0.5Mo | 30.8 | 7.3 | 21.8 | 16.9 | 178 | 51.4 | |
| 0.25Mo–Nb | 27.8 | 6.0 | 19.4 | 14.8 | 212 | 53.7 |
Table 5.
Tensile properties and hardness of the investigated steels in the as-quenched condition. (0.2% offset proof stress, tensile strength, plastic component of the uniform elongation, and total elongation to fracture with a gauge length of 5× the specimen diameter).
Table 5.
Tensile properties and hardness of the investigated steels in the as-quenched condition. (0.2% offset proof stress, tensile strength, plastic component of the uniform elongation, and total elongation to fracture with a gauge length of 5× the specimen diameter).
| FRT | Steel | Rp0.2 (MPa) | Rm (MPa) | Ag (%) | A (%) | Rm × A (MPa.%) | HV10 |
|---|---|---|---|---|---|---|---|
| 900 °C | 0Mo | 950 | 1310 | 3.5 | 10.7 | 14,661 | 400 |
| 0.25Mo | 1078 | 1436 | 3.2 | 10.0 | 15,096 | 440 | |
| 0.5Mo | 1119 | 1485 | 3.2 | 8.8 | 13,915 | 445 | |
| 0.25Mo–Nb | 1100 | 1473 | 3.3 | 8.6 | 13,497 | 440 | |
| 800 °C | 0Mo | 766 | 1204 | 5.0 | 7.4 | 9488 | 336 |
| 0.25Mo | 1003 | 1400 | 3.4 | 6.6 | 10,011 | 390 | |
| 0.5Mo | 1107 | 1513 | 3.0 | 7.7 | 12,515 | 440 | |
| 0.25Mo–Nb | 1086 | 1496 | 3.2 | 8.2 | 13,087 | 440 |
Table 6.
Crystallite sizes, microstrains, and dislocation densities of investigated steels, FRT 900 °C.
Table 6.
Crystallite sizes, microstrains, and dislocation densities of investigated steels, FRT 900 °C.
| Material | Crystallite Size (Å) | Microstrain (%) | Dislocation Density (× 1015(m−2)) |
|---|---|---|---|
| 0Mo | 341 | 0.377 | 3.6 |
| 0.25Mo | 308 | 0.380 | 4.0 |
| 0.5Mo | 312 | 0.389 | 4.0 |
| 0.25Mo–Nb | 316 | 0.344 | 3.5 |
Table 7.
Calculated hardness values using JMatPro® software with and without B alloying compared to measured hardness values from hot-rolled and direct-quenched (DQ) steels.
Table 7.
Calculated hardness values using JMatPro® software with and without B alloying compared to measured hardness values from hot-rolled and direct-quenched (DQ) steels.
| Steel | Cooling Rate 50 °C/s (JMatPro) | Steel | Hot-rolled and DQ | ||
|---|---|---|---|---|---|
| Hardness (HV) | Rm1 (MPa) | Hardness (HV) | Rm (MPa) | ||
| 0Mo,B-free | 374 | 1234 | 0Mo | 400 | 1310 |
| 0Mo | 424 | 1386 | 0.25Mo | 440 | 1436 |
1 Predicted Rm values are calculated using the same tensile strength/hardness ratio of 3.3 as achieved in actual tensile tests.
© 2019 by the authors. Licensee MDPI, Basel, Switzerland. This article is an open access article distributed under the terms and conditions of the Creative Commons Attribution (CC BY) license (http://creativecommons.org/licenses/by/4.0/).
Share and Cite
MDPI and ACS Style
Hannula, J.; Porter, D.; Kaijalainen, A.; Somani, M.; Kömi, J. Mechanical Properties of Direct-Quenched Ultra-High-Strength Steel Alloyed with Molybdenum and Niobium. Metals 2019, 9, 350. https://doi.org/10.3390/met9030350
AMA Style
Hannula J, Porter D, Kaijalainen A, Somani M, Kömi J. Mechanical Properties of Direct-Quenched Ultra-High-Strength Steel Alloyed with Molybdenum and Niobium. Metals. 2019; 9(3):350. https://doi.org/10.3390/met9030350
Chicago/Turabian StyleHannula, Jaakko, David Porter, Antti Kaijalainen, Mahesh Somani, and Jukka Kömi. 2019. "Mechanical Properties of Direct-Quenched Ultra-High-Strength Steel Alloyed with Molybdenum and Niobium" Metals 9, no. 3: 350. https://doi.org/10.3390/met9030350
Note that from the first issue of 2016, this journal uses article numbers instead of page numbers. See further details here.