Article

Diffraction Line Profile Analysis of 3D Wedge Samples of Ti-6Al-4V Fabricated Using Four Different Additive Manufacturing Processes

1
School of Engineering, Faculty of Science, Engineering and Technology, Swinburne University of Technology, Hawthorn, VIC 3122, Australia
2
Defence Materials Technology Centre, Hawthorn, VIC 3122, Australia
3
The Bragg Institute, Australian Nuclear Science and Technology Organisation (ANSTO), Lucas Heights, NSW 2234, Australia
4
Monash Centre for Additive Manufacturing, Monash University, Notting Hill, VIC 3168, Australia
5
Commonwealth Scientific and Industrial Research Organization (CSIRO), Clayton, VIC 3168, Australia
6
School of Mechanical, Materials, and Mechatronic Engineering, Faculty of Engineering and Information Sciences, University of Wollongong, Wollongong, NSW 2522, Australia
7
Department of Mechanical and Materials Engineering, Queen’s University, Kingston, ON K7L 3N6, Canada
*
Author to whom correspondence should be addressed.
Deceased—12th January 2017.
Metals 2019, 9(1), 60; https://doi.org/10.3390/met9010060
Submission received: 27 November 2018 / Revised: 1 January 2019 / Accepted: 7 January 2019 / Published: 9 January 2019
(This article belongs to the Special Issue Titanium Alloys for Biomedical Implants and Devices)

Abstract

:
Wedge-shaped samples were manufactured by four different Additive Manufacturing (AM) processes, namely selective laser melting (SLM), electron beam melting (EBM), direct metal deposition (DMD), and wire and arc additive manufacturing (WAAM), using Ti-6Al-4V as the feed material. A high-resolution powder diffractometer was used to measure the diffraction patterns of the samples whilst rotated about two axes to collect detected neutrons from all possible lattice planes. The diffraction pattern of a LaB6 standard powder sample was also measured to characterize the instrumental broadening and peak shapes necessary for the Diffraction Line Profile Analysis. The line profile analysis was conducted using the extended Convolution Multiple Whole Profile (eCMWP) procedure. Once analyzed, it was found that there was significant variation in the dislocation densities between the SLMed and the EBMed samples, although having a similar manufacturing technique. While the samples fabricated via WAAM and the DMD processes showed almost similar dislocation densities, they were, however, different in comparison to the other two AM processes, as expected. The hexagonal (HCP) crystal structure of the predominant α-Ti phase allowed a breakdown of the percentage of the Burgers’ vectors possible for this crystal structure. All four techniques exhibited different combinations of the three possible Burgers’ vectors, and these differences were attributed to the variation in the cooling rates experienced by the parts fabricated using these AM processes.

1. Introduction

Additive Manufacturing (AM) of metallic materials is receiving increasing attention worldwide [1,2,3]. There are two main AM approaches, and they are the powder bed approach, and the direct deposition approach. In the powder bed approach, a layer of powder is swept over a platform and the powder is melted together using either a laser or an electron beam, known as selective laser melting (SLM) and electron beam melting (EBM), respectively. The platform is then lowered and a new layer of powder is swept over. The melting process is then performed again according to the G-code given by the pre-processing software. This is repeated until the desired part is formed [4,5]. The direct deposition approach is used to melt either powder blown onto the substrate or wire fed into the melt pool of the substrate, using a heat source that is usually either a high powered laser or an electric arc, known as direct metal deposition (DMD) and wire arc additive manufacturing (WAAM), respectively. Tracks of material are placed side-by-side, layer-upon-layer, until the desired shape is formed. The powder bed approach easily produces complex shapes, with the aid of support structures, while the direct deposition approach produces more basic shapes but can produce much larger sized components because it is not limited by the size of the powder bed chamber [6].
In this study, the titanium alloy Ti-6Al-4V has been investigated, which has been widely used in aerospace and medical applications. Four leading metallic AM processes, namely SLM, EBM, DMD, and WAAM, were employed to manufacture wedge-shaped Ti-6Al-4V samples. While all four of these techniques are relatively mature technologies and have proven capable to build 3D shapes, the metallurgical character of the deposits, in particular differences between the different technologies, is not very well known and may play a role in identifying which of the technologies should be employed for the manufacturing of a particular component. One aspect of the metallurgical character of the deposits is the dislocation content, which has a significant influence on the mechanical properties of the deposits, in particular the strength and ductility. This knowledge aids in understanding why the mechanical properties of these AM processes varies, as that reported by Sames et al. [7] and Frazier [8]. Therefore, diffraction line profile analysis was employed to measure the dislocation contents produced by these AM technologies.
Diffraction line profile analysis (DLPA) is a diffraction analysis technique where the number and type of dislocations present in a structure can be determined quantitatively, together with other microstructural features, such as average sub-grain size, planar fault frequency, and the breakdown of the Burgers’ vectors of the different dislocations and their relative percentages [9,10]. Moreover, DLPA is an indirect method used to derive average microstructural characteristics from neutron or X-ray diffraction patterns. In the case of neutron diffraction, the volume of the diffracting material is in the range of cubic centimetres, which allows a non-destructive and bulk characterization of the microstructure of the investigated material. It is most commonly used during plastic deformation, in parallel with plasticity models to understand the various slip system activities [11,12]. Using neutron DLPA, it has been shown that the initial dislocation density of as-built stainless steel samples depends on the type and the parameters of the applied AM process and can be altered by subsequent heat treatments or plastic deformation [13,14]. Results strongly suggest that the flow strength of the as-built AM stainless steel is primarily controlled by the dislocation density present in the material, making DLPA a useful characterization tool for such materials [13]. This type of analysis, which provides quantitative characteristics on the dislocation structure, deepens the understanding of the deformation mechanisms operating in metals and their correlation with the mechanical properties of the bulk polycrystal. This capability can be particularly useful for materials having hexagonal close-packed (HCP) crystal structures, as that of titanium, which possess anisotropic properties, and their dislocation structures vary with deformation temperature and grain orientation. The main source of dislocations in the metal AM structures form during the martensitic phase transformation occurring due to rapid solidification of the molten metal. As the crystal lattice changes from one crystal structure to another—in the case of Ti-6Al-4V, from β-Ti (HCP crystal structure) to α′-Ti (BCC crystal structure) due to displacive transformation—dislocations are formed at the transformation interface to allow for the misfit between the two crystal lattices, HCP and BCC [15]. Ahmed and Rack [16] have shown that the crystallography of the two types of martensite that forms for Ti-6Al-4V is different and is dependent on the cooling rate. Therefore, the dislocation content is an indication as to the nature and extent of the martensitic phase transformation, which is why the diffraction line profile analysis is vital in understanding the effect of the various AM processes on the microstructure and mechanical properties of Ti-6Al-4V. Moreover, this type of analysis may elucidate this change in the martensite formed by the change in the percentage of dislocations formed, as different orientation relationships at the transforming interface will change the type and number of dislocations formed, as that reported by Carroll et al. [17].
The primary objective of this study is to measure the different dislocation densities that form during four prominent metal AM processes, namely SLM, EBM, DMD, and WAAM, when fabricating Ti-6Al-4V wedge-shaped samples. This titanium alloy has been widely used for both aerospace and medical applications. Hence, in this study, the samples were irradiated with neutrons and the diffraction data was collected and analyzed using DLPA technique.

2. Materials and Methods

2.1. Sample Preparation

A wedge-shaped sample, with dimensions shown in Figure 1, was fabricated using each of the four AM processes, namely SLM, EBM, DMD, and WAAM. The wedge geometry was chosen to manifest changes in the character of the builds as a function of section size (e.g., thinner sections may cool faster than the thicker sections), which may influence microstructure formation and hence the mechanical properties. The processing parameters for the four different techniques were different and were optimized in a separate study by the various research providers.
An EOSINT M280 machine (Electro Optical Systems EOS GmbH, Krailling, Germany) was used to fabricate the titanium wedge-shape sample in the horizontal orientation using the SLM process. Gas atomized Ti-6Al-4V powder with particle size up to 63 µm was used. The process parameters used were: laser power 280 W, scan speed 1200 mm/s, layer thickness 30 µm, and hatch spacing 140 µm.
An Arcam A1 machine (Arcam AB, Mölndal, Sweden) was used for the EBM process. The titanium sample was fabricated using Ti-6Al-4V ASTM Grade 23 powder (average particle size of 73.52 µm). The standard Arcam theme 3.2.121 (Arcam AB, Mölndal, Sweden) was employed, which had an acceleration voltage of 60 kV, beam current of 1–10 mA, beam spot size of 200 µm, speed factor of 98, scanning line offset of 0.1 mm, layer thickness of 50 µm, and preheating temperature of 730 °C.
A 5 kW Trumpf-POM machine was used for the DMD process. A 210 mm × 115 mm × 6 mm titanium base plate in the annealed condition and Ti-6Al-4V powder (average particle size of 60 µm) supplied by TLS Technik were used for deposition. The powder was delivered to the deposition area. The fabrication of the wedge-shaped sample was conducted in an argon and helium gas atmosphere to minimize oxygen contamination. A laser power of 1600 W, laser spot size of about 2.2 mm, laser head traverse speed of 60 mm/min, and powder feed rate of 4.3 g/min were employed for processing.
A gas tungsten arc welding (WAAM) process was used for fabricating the Ti-6Al-4V sample. A 250 mm × 100 mm × 12 mm titanium base plate and a 1 mm diameter hard-drawn Ti-6Al-4V wire were used for deposition. However, the thick track dimensions of the WAAM process made it impossible to produce the wedge sample to the required dimensional tolerances by using only the deposition process. Instead, a rectangular block of material of dimensions 25 mm × 55 mm × 12 mm was deposited and the wedge shape was subsequently produced by wire cutting and machining. A current of 140 Amps, travel speed of 152 mm/min, arc length of 3.5 mm, and wire feed speed of 1.34 m/min (0.28 kg/h) were used as processing parameters. Welding grade argon (99.995% purity) was used as shielding gas at a flow rate of 25 L/min.

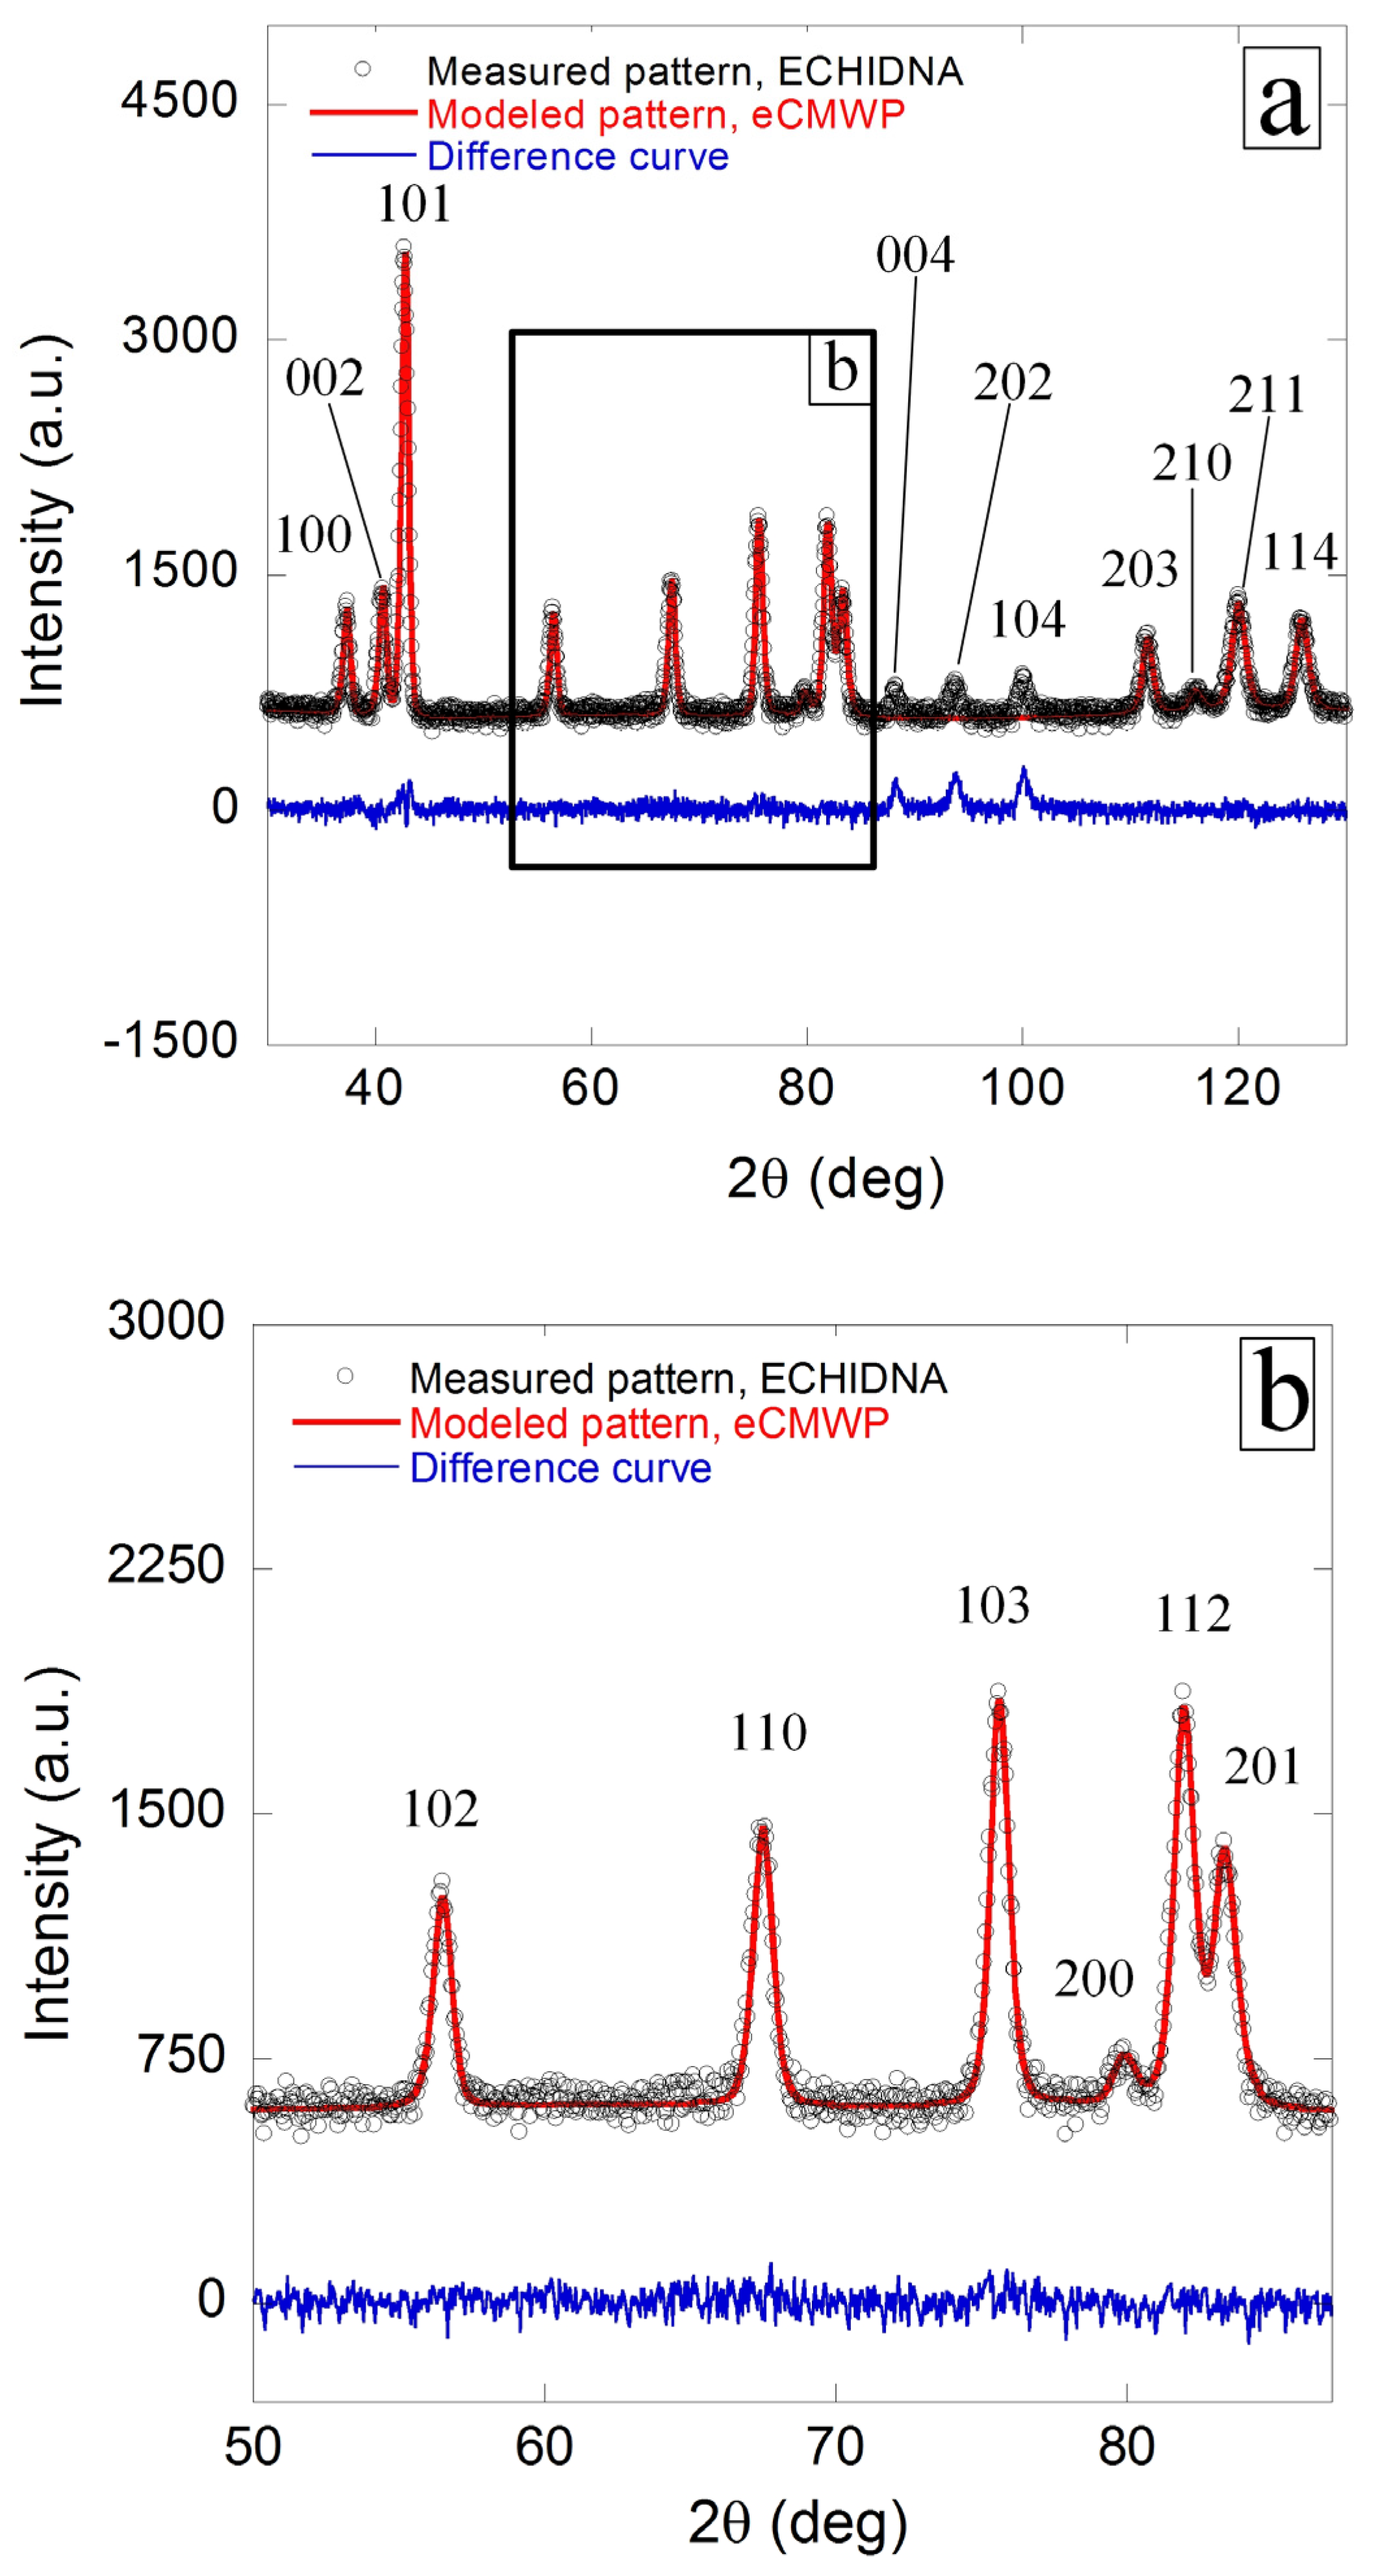
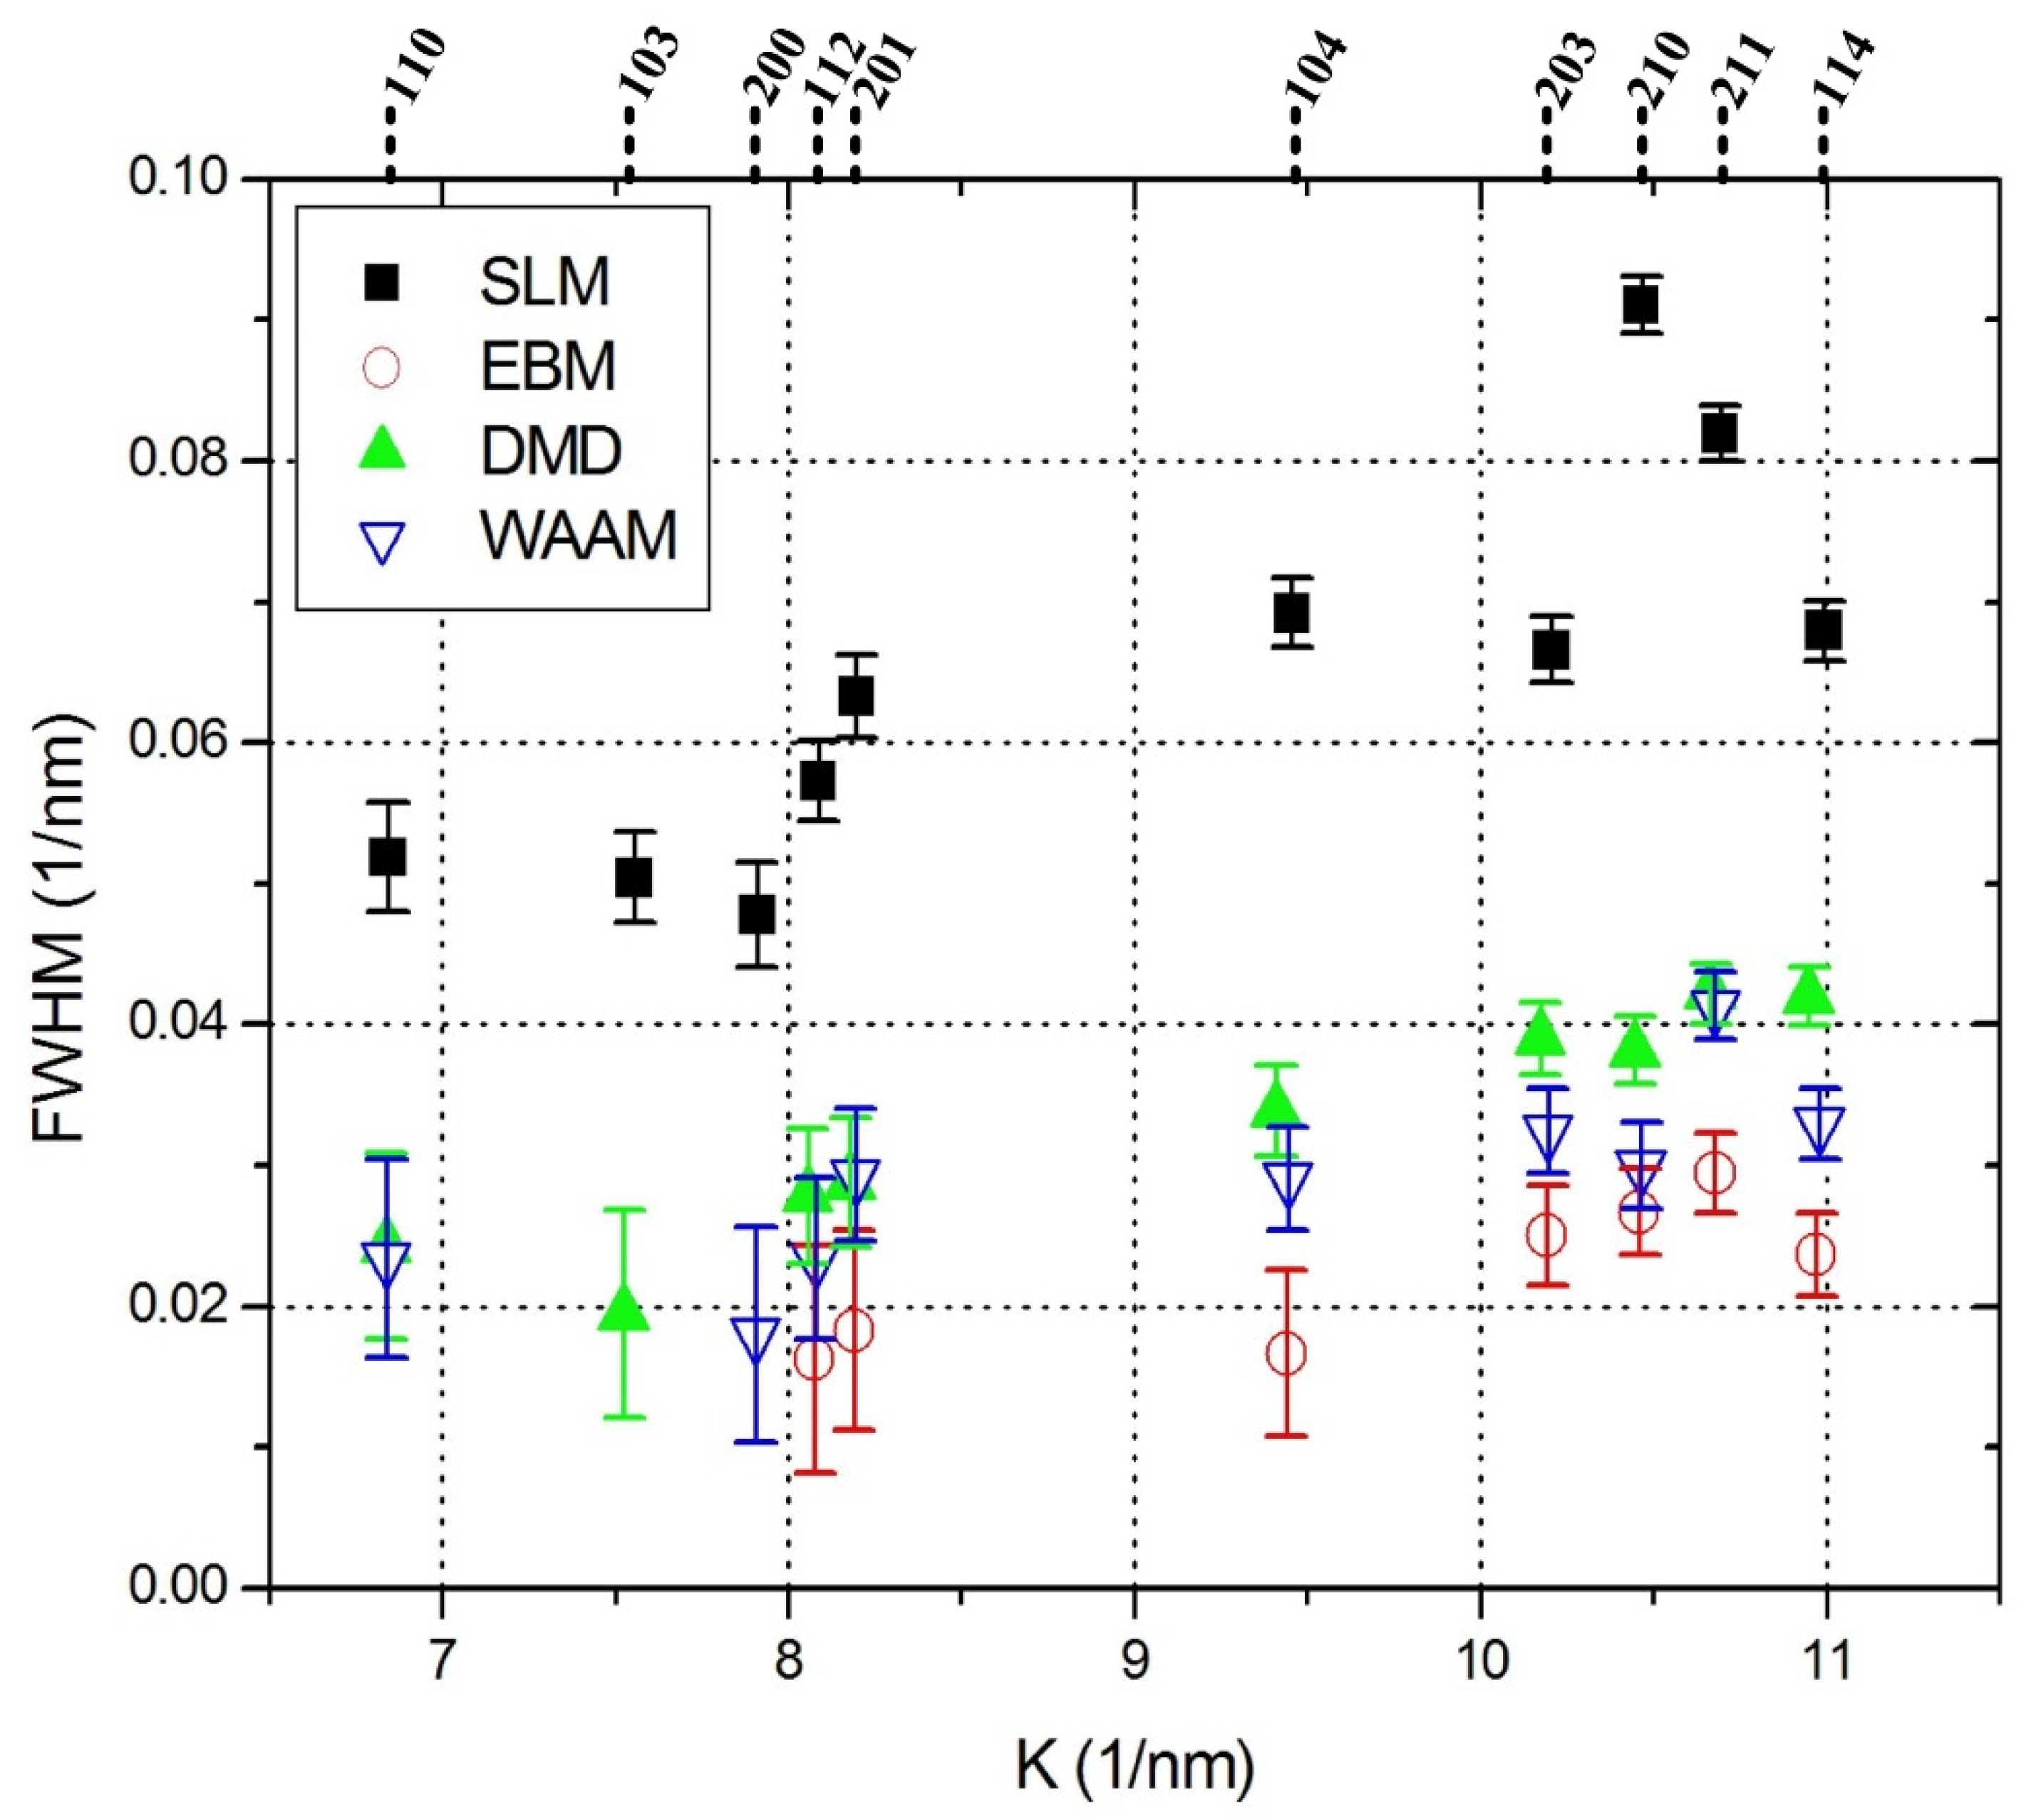
2.2. Neutron Diffraction Set Parameters and Extended Convolution Multiple Whole Profile (eCMWP) Analysis

Neutron diffraction data for the Ti-6Al-4V samples was collected on the high-resolution diffractometer Echidna at the OPAL facility (ANSTO, Lucas Heights, Australia), using neutrons of wavelength 1.6215 Å. During data collection, each sample was rotated around its two-fold axis to reduce the effect of preferred orientation, if any. To determine instrumental contribution to the peak width, calibration data was collected for a powder LaB6 sample (NIST SRM 660c). The entire sample was simultaneously exposed to the neutron beam during the rotations in both orientations.
The analysis in this study was performed using the peak line broadening analysis software package eCMWP (“extended Convolution Multiple Whole Profile” procedure, 2017, G. Ribárik, et al., Budapest, Germany) [9,18]. The eCMWP software constructs a theoretical diffraction pattern based on well-established physical models of the microstructure, e.g., sub-grain size distributions, dislocation structures, and planar faults. The final shape of the various peaks of a diffraction pattern, IPM(2θ), is a convolution of the contribution of various lattice defects and the contribution of the diffraction instrument itself, which is calculated using Equation (1) [9,18].
I P M ( 2 θ ) = h k l I h k l S I h k l D I h k l P D I h k l I N S T + I B G
where the defect related profile functions are the size, I h k l S , represents the dislocation cell or sub-grain size distribution [19], I h k l D , represents the contribution of the dislocations [20,21], I h k l P D , represents the contribution of the planar defects such as twin boundaries or stacking faults [22,23], I h k l I N S T , is the instrumental peak broadening and shape [24], and I B G is the background of the diffraction pattern usually represented by a cubic spline. The instrumental peak shapes, I h k l I N S T , were determined by measuring a LaB6 standard powder sample, which has no detectable microstructure (i.e., it is coarse grained, strain and dislocation free), thereby generating a result which is indicative of the peak broadening caused by the diffraction instrument itself. The resulting theoretical diffraction pattern presented in Equation (1) is fitted to the experimental data using a least-squares algorithm [18]. The fitting variables of the theoretical diffraction pattern are the quantitative features of the microstructure, such as the median and width of the sub-grain size distribution, density, type, and arrangement of the dislocations, and frequency of planar faults. The eCMWP software determines these quantitative characteristics by forward modelling the microstructure until a match is found between the theoretical and measured whole diffraction patterns [9,18].
Figure 2 shows the eCMWP refinement for the SLM sample. The open circles represent the measured data, the continuous line represents the modeled pattern, and the difference between the two is also shown. The 004, 202, and 104 reflections were not included in the analysis due to their low signal-to-noise ratio. Even though 200 and 210 also have low signal-to-noise ratios they were included, because ignoring them would have decreased the quality of the modeling for the overlapping high-intensity reflections. The eCMWP software matches the measured and the modeled full pattern by refining the microstructural parameters. In the present case, the refined microstructural parameters were: area weighted average sub-grain size <X>A, total dislocation density ρ, and ratio of sub-densities having <a>, <c+a>, and <c> Burgers’ vector type, as described by Máthis et al. [10] and Ungár et al. [25]. It is important to note that the area weighted average sub-grain size <X>A represents a domain size which is defined by low-angle grain boundaries or dislocation walls, thus it will be referred to as sub-grain size or dislocation cell size; as reported by Ungár et al. [19]; hence, it is not the grain size defined by high angle grain boundaries visible in an optical microscope or in a low resolution TEM.
In order to qualitatively assess the neutron diffraction measurements, a Williamson-Hall (WH) plot was constructed. The WH plot presents the full width at half maximum (FWHM) of the peaks as a function of peak position. The FWHM values have been corrected for the instrumental broadening, thus, they represent only the broadening induced by the microstructural features found in the samples.

2.3. Residual Stress Analysis

Residual stress measurements were carried out using the contour method. The samples were wire-cut and surface profiles were measured on a Brown and Sharpe coordinate measuring machine (TESA USA, North Kingstown, RI, USA) equipped with a low force touch probe and 1 mm diameter ruby-tipped stylus. Each cut surface was measured with a 0.1 mm × 0.1 mm grid spacing, producing approximately 20,000 data points. The residual stresses were calculated from the raw contour data using MATLAB (Version 8.4, The Mathworks Inc., Natick, MA, USA) scripts and ABAQUS (Version 6.13, Dassault Systèmes Simulia Corp., Johnston, RI, USA) Finite Element code.

2.4. Microstructural Analysis

For microstructural characterization, the samples were cut from the mid-section of the wedge and prepared for metallographic examination. The samples were polished and etched with Kroll’s reagent. The microstructures were examined under the Olympus BX-61 optical microscope (Olympus Corporation, Shinjuku, Japan).

3. Results and Discussion

The representative microstructures of the 3D printed titanium samples, fabricated using four different AM processes, are shown in Figure 3. It was noticed that all the samples consisted of α′-Ti martensitic phase along with α+β-Ti matrix and prior β-Ti grain boundaries. However, the morphology of the α′-Ti martensite phase was slightly different, depending upon the AM process. The SLMed sample consisted of fine martensitic laths resembling a needle-like shape. The EBMed sample consisted of a similar type of fine martensitic laths, as that of the SLMed sample, but these laths were short and less in quantity. On the other hand, the DMDed sample consisted of thick and short martensitic laths with distinct prior β-Ti grain boundaries. The WAAMed sample consisted of a longer prior β-Ti grain boundary.
The Williamson-Hall (WH) plot is shown in Figure 4, and the quantitative results obtained using eCMWP are presented in Table 1. From both the WH plot and the eCMWP data, it can be observed that the SLMed sample consisted of the highest dislocation density, whereas the EBMed sample had the lowest dislocation density in comparison to the DMDed and WAAMed samples, which exhibited similar dislocation densities. In contrast, the FWHM of the different diffraction peaks does not increase monotonously with increasing ’K’, the reciprocal of the lattice spacing. This is due to the well-known effect of strain anisotropy [26], which is an indication of a significant dislocation density present in the material. The mathematical description of strain anisotropy is provided by the dislocation contrast factors, which describe the broadening of a given diffraction peak as a function of the hkl Miller indices and the different dislocation types. The evaluation of the contrast factors is handled internally by the eCMWP line profile analysis software, and the results can be used to determine the ratio of the dislocations densities having <a>, <c+a>, and <c> type Burgers’ vectors [10].
From the eCMWP results presented in Table 1, it is quite evident that there is significant variation in the dislocation sizes and densities, which is process-dependent. It should be noted here that the entire sample was irradiated with neutrons simultaneously, and the values presented in Table 1 are an average across the sample. The WAAMed sample exhibited a large sub-grain size that can be attributed to the high heat input of the gas tungsten arc-welding (GTAW) torch used for its fabrication. While not measured in this study, if the temperature is below the martensite finish temperature but still elevated during processing, it is possible that recovery can occur, thus increasing the sub-grain size [27]. This is further supported by the evidence that the WAAMed sample consisted of long prior β-Ti grain boundaries, which is possible when the cooling rates are low [28]. Likewise, the EBMed sample also has a high sub-grain size, which can be attributed to the high bed temperature, and subsequent slow cooling after deposition, allowing recovery processes to occur (i.e., the temperature allows the dislocations to annihilate each other). Therefore, the EBMed sample consisted of fewer α′-Ti martensitic laths (shown in Figure 3) compared to other samples [29]. On the other hand, the DMDed and SLMed samples exhibit smaller sub-cell sizes that indicates that the cooling rate during the process was higher than WAAM process, as well as the recovery rate being significantly reduced. However, the heat input in the DMD process was considerably higher than the SLM process, which was retained in the sample longer, resulting in thicker martensitic laths, as observed in the microstructures of these samples [15].
The EBMed sample has very low dislocation density, which can be the result of the high powder bed temperature (730 °C) employed during the EBM process. This provides sufficiently large amount of energy to drive recovery of any dislocations that form due the martensitic transformation [27]. However, the dislocation density in the SLMed sample is ~6× larger than in the WAAMed and DMDed samples and ~20× larger than the EBMed sample. This large increase in the dislocation content for the SLMed sample is not evident, given that these samples experience martensitic phase transformation during rapid cooling irrespective of the AM process used. There are three potential sources of the formation of dislocations during fabrication of these four samples, as follows; plastic deformation due to residual stress formation as the sample cools after deposition [30]; the dislocation formation of the displacive martensitic phase transformation [31]; and the plastic strain that the existing martensite laths undergo as new martensite laths form during the phase transformation [32]. As reported by Vasinonta et al. [30], the formation of residual stress in the 3D printing of Ti-6Al-4V is dependent on the process parameters. Therefore, this can be the first potential source of an increase in the dislocation content in the SLMed sample.
The residual stresses present in the Ti-6Al-4V samples along the central cross-section are shown in Figure 5. The SLMed sample contained a significant amount of compressive residual stress in the lower central portion of the wedge sample and tensile residual stress in the top and bottom edges. Such a steep residual stress gradient can result in the increased formation of dislocations in the sample [33,34]. In contrast, the EBMed sample had a more uniform residual stress state across the cross-section, ranging between −200 MPa and 200 MPa. The EBMed sample showed a much lower level of residual stress state compared to the SLMed sample, primarily due to the high powder bed temperature and the vacuum atmosphere maintained during the fabrication process [29]. The DMDed sample also consisted of uniform residual stresses, apart from a couple of pockets of compressive residual stresses and tensile residual stresses closer to the edges of the wedge sample, similar to that reported by Cottam et al. [35]. The WAAMed sample consisted of patches of mild tensile residual stress in the range of 100 to 300 MPa, dispersed throughout the cross-section of the wedge-shaped specimen owing to the much higher heat input than the laser-based DMD process [29,36].
The SLMed and WAAMed samples have approximately the same breakdown of dislocation types, from Table 1. The DMDed sample has a Burgers’ vectors breakdown with more pyramidal, <c+a>, and prismatic (<c>) dislocations, whereas the EBMed sample consists of higher proportion of pyramidal, <c+a> type dislocations. Perhaps, this can be due to easier recovery of <a> type dislocations than the other two types. This is reasonable as the <a> type dislocations make up most of the dislocation content for Ti-6Al-4V samples fabricated using all four processes. Therefore, the probability that two <a> dislocations will meet and annihilate is higher than two <c+a> dislocations, resulting in an increase in the proportion of <c+a> type dislocations with increasing levels of recovery [27].
The crystallography of the strain associated with the martensitic phase transformation is invariant and as such the level of dislocations it introduces will be relatively consistent for the four 3D printing processes. The plastic strain of the existing martensitic laths as new martensitic laths form is dependent on the stress state of the material, as the martensitic transformation proceeds to a level which is a combination of the residual stress state and the local stress in the grain. Therefore, since the residual stress state of the SLMed sample is higher than for the WAAMed and DMDed samples, the plastic strain during the transformation will increase, and as a result, the amount of dislocations that will form in the SLMed sample will increase. Ali et al. [37] reported a decomposition of the α′-Ti martensite structure into a more homogeneous α+β phase upon preheating the SLM powder bed to about 570 °C. Furthermore, each of these AM processes experience different cooling rates, as graphically illustrated in Figure 6. Although not experimentally analyzed, it is expected that the cooling rate of the powder-bed metal AM processes is quite high, and for Ti-6Al-4V could be more than 525 °C/s, whereas for the other two AM processes, DMD and WAAM, the cooling rates are likely to be lower than SLM and EBM. Moreover, due to the high heat input in the WAAM process, the cooling rate can even be below 410 °C/s. Therefore, this explains the resultant microstructures, dislocation densities, and residual stresses of the titanium samples fabricated using these four different AM processes. It should be noted here that there will be process variations associated with each of the above AM processes which might yield a different result to that reported in this work. Therefore, further in-depth investigation is required to comprehend the dependency of the properties of the printed parts in terms of microstructure, phases, and dislocation densities on the process variables.

4. Conclusions

Titanium alloys, such as Ti-6Al-4V, are widely used in aerospace and medical applications. In this work, the variation in the dislocation content of Ti-6Al-4V samples produced by the four metal AM processes, SLM, EBM, DMD, and WAAM, was investigated, and it was attributed to the different process characteristics. The SLMed sample contained a high dislocation content, the source of which was attributed to the volume of the martensitic phase transformation as well as the residual stresses in the sample. The DMDed sample had intermediate dislocation content and a significant amount of <c> and <c+a> dislocations due to the intermediate cooling rate experienced by the sample during this process. The EBMed sample exhibited a low dislocation content and a large dislocation cell size, which was attributed to the high temperature of the powder bed of 730 °C during the printing process, which facilitated recovery of the <a> type dislocations, thereby resulting in a decrease in the α′-Ti martensite phase. The WAAMed sample produced a dislocation content similar to that of the DMDed sample, but the breakdown of the dislocation of Burgers’ vectors was significantly different, which was attributed to the low cooling rate during the process.

Author Contributions

Conceptualization, R.C. and S.P.; data curation, R.C. and M.A.; formal analysis, M.A.; funding acquisition, S.P.; investigation, R.C. and M.A.; methodology, R.C.; project administration, S.P.; resources, S.P., M.A., T.J., C.H., and D.C.; supervision, S.P.; validation, M.A. and L.B.; writing—review and editing, R.A.R.R.

Funding

This research was funded by Defense Materials Technology Centre, Project 1.11.

Acknowledgments

This paper includes research that was supported by DMTC Limited (Australia). The authors have prepared this paper in accordance with the intellectual property rights granted to partners from the original DMTC project. Swinburne University of Technology would also like to thank Girish Thipperudrappa for operating the DMD during the manufacturing of the wedge-shaped sample.

Conflicts of Interest

The authors declare no conflict of interest.

Notations

3DThree Dimensional
AMAdditive Manufacturing
BCCBody Centered-Cubic
EBMElectron Beam Melting
eCMWPextended Convolution Multiple Whole Profile
DLPADiffraction Line Profile Analysis
DMDDirect Metal Deposition
FWHMFull Width at Half Maximum
HCPHexagonal Close-Packed
I P M ( 2 θ ) Convolution of diffraction peaks at 2θ diffraction angle
I h k l S Dislocation cell/sub-grain size distribution at [hkl] crystal plane
I h k l D Contribution of the dislocations at [hkl] crystal plane
I h k l P D Contribution of the planar defects at [hkl] crystal plane
I h k l I N S T Instrumental peak broadening and shape at [hkl] crystal plane
I B G Background of the diffraction pattern
KReciprocal of the lattice spacing
SLMSelective Laser Melting
TEMTransmission Electron Microscope
WAAMWire Arc Additive Manufacturing
WHWilliamson-Hall
<X>AArea weighted average sub-grain size
ρTotalTotal dislocation density

References

  1. Kruth, J.P.; Leu, M.C.; Nakagawa, T. Progress in additive manufacturing and rapid prototyping. CIRP Ann. Manuf. Technol. 1998, 47, 525–540. [Google Scholar] [CrossRef]
  2. Attar, H.; Ehtemam-Haghighi, S.; Kent, D.; Dargusch, M.S. Recent developments and opportunities in additive manufacturing of titanium-based matrix composites: A review. Int. J. Mach. Tools Manuf. 2018, 133, 85–102. [Google Scholar] [CrossRef]
  3. Rashid, R.; Masood, S.H.; Ruan, D.; Palanisamy, S.; Rahman Rashid, R.A.; Elambasseril, J.; Brandt, M. Effect of energy per layer on the anisotropy of selective laser melted AlSi12 aluminium alloy. Addit. Manuf. 2018, 22, 426–439. [Google Scholar] [CrossRef]
  4. Ponnusamy, P.; Masood, S.H.; Palanisamy, S.; Rahman Rashid, R.A.; Ruan, D. Characterization of 17-4PH alloy processed by selective laser melting. Mater. Today 2017, 4, 8498–8506. [Google Scholar] [CrossRef]
  5. Agius, D.; Kourousis, K.; Wallbrink, C. A Review of the As-Built SLM Ti-6Al-4V Mechanical Properties towards Achieving Fatigue Resistant Designs. Metals 2018, 8, 75. [Google Scholar] [CrossRef]
  6. Hoye, N.; Cuiuri, D.; Rahman Rashid, R.A.; Palanisamy, S. Machining of GTAW additively manufactured Ti-6Al-4V structures. Int. J. Adv. Manuf. Technol. 2018, 99, 313–326. [Google Scholar] [CrossRef]
  7. Sames, W.J.; List, F.A.; Pannala, S.; Dehoff, R.R.; Babu, S.S. The metallurgy and processing science of metal additive manufacturing. Int. Mater. Rev. 2016, 61, 315–360. [Google Scholar] [CrossRef]
  8. Frazier, W.E. Metal additive manufacturing: A review. J. Mater. Eng. Perform. 2014, 23, 1917–1928. [Google Scholar] [CrossRef]
  9. Ribárik, G.; Ungár, T. Characterization of the microstructure in random and textured polycrystals and single crystals by diffraction line profile analysis. Mater. Sci. Eng. A 2010, 528, 112–121. [Google Scholar] [CrossRef]
  10. Máthis, K.; Nyilas, K.; Axt, A.; Dragomir-Cernatescu, I.; Ungár, T.; Lukáč, P. The evolution of non-basal dislocations as a function of deformation temperature in pure magnesium determined by X-ray diffraction. Acta Mater. 2004, 52, 2889–2894. [Google Scholar] [CrossRef]
  11. Glavicic, M.G.; Salem, A.A.; Semiatin, S.L. X-ray line-broadening analysis of deformation mechanisms during rolling of commercial-purity titanium. Acta Mater. 2004, 52, 647–655. [Google Scholar] [CrossRef]
  12. Glavicic, M.G.; Semiatin, S.L. X-ray line-broadening investigation of deformation during hot rolling of Ti–6Al–4V with a colony-alpha microstructure. Acta Mater. 2006, 54, 5337–5347. [Google Scholar] [CrossRef]
  13. Brown, D.W.; Adams, D.P.; Balogh, L.; Carpenter, J.S.; Clausen, B.; King, G.; Reedlunn, B.; Palmer, T.A.; Maguire, M.C.; Vogel, S.C. In Situ Neutron Diffraction Study of the Influence of Microstructure on the Mechanical Response of Additively Manufactured 304L Stainless Steel. Metall. Mater. Trans. A Phys. Metall. Mater. Sci. 2017, 48, 6055–6069. [Google Scholar] [CrossRef]
  14. Pokharel, R.; Balogh, L.; Brown, D.W.; Clausen, B.; Gray, G.T., III; Livescu, V.; Vogel, S.C.; Takajo, S. Signatures of the unique microstructure of additively manufactured steel observed via diffraction. Scr. Mater. 2018, 155, 16–20. [Google Scholar] [CrossRef]
  15. Rahman Rashid, R.A.; Palanisamy, S.; Attar, H.; Bermingham, M.; Dargusch, M.S. Metallurgical features of direct laser-deposited Ti6Al4V with trace boron. J. Manuf. Process. 2018, 35, 651–656. [Google Scholar] [CrossRef]
  16. Ahmed, T.; Rack, H.J. Phase transformations during cooling in α+β titanium alloys. Mater. Sci. Eng. A 1998, 243, 206–211. [Google Scholar] [CrossRef]
  17. Carroll, B.E.; Palmer, T.A.; Beese, A.M. Anisotropic tensile behavior of Ti–6Al–4V components fabricated with directed energy deposition additive manufacturing. Acta Mater. 2015, 87, 309–320. [Google Scholar] [CrossRef]
  18. Ribarik, G.; Ungar, T.; Gubicza, J. MWP-fit: a program for multiple whole-profile fitting of diffraction peak profiles by ab initio theoretical functions. J. Appl. Crystallogr. 2001, 34, 669–676. [Google Scholar] [CrossRef] [Green Version]
  19. Ungár, T.; Tichy, G.; Gubicza, J.; Hellmig, R. Correlation between subgrains and coherently scattering domains. Powder Diffr. 2005, 20, 366–375. [Google Scholar] [CrossRef] [Green Version]
  20. Ungár, T.; Tichy, G. The Effect of Dislocation Contrast on X-Ray Line Profiles in Untextured Polycrystals. Phys. Status Solidi 1999, 171, 425–434. [Google Scholar] [CrossRef]
  21. Borbély, A.; Ungár, T. X-ray line profiles analysis of plastically deformed metals. C. R. Phys. 2012, 13, 293–306. [Google Scholar] [CrossRef]
  22. Balogh, L.; Ribárik, G.; Ungár, T. Stacking faults and twin boundaries in fcc crystals determined by x-ray diffraction profile analysis. J. Appl. Phys. 2006, 100, 023512. [Google Scholar] [CrossRef]
  23. Balogh, L.; Tichy, G.; Ungár, T. Twinning on pyramidal planes in hexagonal close packed crystals determined along with other defects by X-ray line profile analysis. J. Appl. Crystallogr. 2009, 42, 580–591. [Google Scholar] [CrossRef]
  24. Stokes, A.R. A numerical Fourier-analysis method for the correction of widths and shapes of lines on X-ray powder photographs. Proc. Phys. Soc. 1948, 61, 382. [Google Scholar] [CrossRef]
  25. Ungár, T.; Balogh, L.; Ribárik, G. Defect-Related Physical-Profile-Based X-Ray and Neutron Line Profile Analysis. Metall. Mater. Trans. A 2010, 41, 1202–1209. [Google Scholar] [CrossRef]
  26. Ungár, T. Dislocation model of strain anisotropy. Powder Diffr. 2008, 23, 125–132. [Google Scholar] [CrossRef]
  27. Humphreys, F.J.; Hatherly, M. Chapter 6 - Recovery After Deformation. In Recrystallization and Related Annealing Phenomena, 2nd ed.; Humphreys, F.J., Hatherly, M., Eds.; Elsevier: Oxford, UK, 2004; pp. 169–213. [Google Scholar]
  28. Dąbrowski, R. The Kinetics of Phase Transformations During Continuous Cooling of the Ti6Al4V Alloy from the Single-Phase β Range. Arch. Metall. Mater. 2011, 56, 703. [Google Scholar] [CrossRef]
  29. Li, C.; Liu, Z.Y.; Fang, X.Y.; Guo, Y.B. Residual Stress in Metal Additive Manufacturing. Proc. CIRP 2018, 71, 348–353. [Google Scholar] [CrossRef]
  30. Vasinonta, A.; Beuth, J.L.; Griffith, M. Process Maps for Predicting Residual Stress and Melt Pool Size in the Laser-Based Fabrication of Thin-Walled Structures. J. Manuf. Sci. Eng. 2006, 129, 101–109. [Google Scholar] [CrossRef]
  31. Bhadeshia, H.K.D.H. Developments in martensitic and bainitic steels: Role of the shape deformation. Mater. Sci. Eng. A 2004, 378, 34–39. [Google Scholar] [CrossRef]
  32. Christien, F.; Telling, M.T.F.; Knight, K.S. Neutron diffraction in situ monitoring of the dislocation density during martensitic transformation in a stainless steel. Scr. Mater. 2013, 68, 506–509. [Google Scholar] [CrossRef]
  33. Mishurova, T.; Cabeza, S.; Artzt, K.; Haubrich, J.; Klaus, M.; Genzel, C.; Requena, G.; Bruno, G. An Assessment of Subsurface Residual Stress Analysis in SLM Ti-6Al-4V. Materials 2017, 10, 348. [Google Scholar] [CrossRef] [PubMed]
  34. Yadroitsev, I.; Yadroitsava, I. Evaluation of residual stress in stainless steel 316L and Ti6Al4V samples produced by selective laser melting. Virtual Phys. Prototyp. 2015, 10, 67–76. [Google Scholar] [CrossRef]
  35. Cottam, R.; Thorogood, K.; Lui, Q.; Wong, Y.C.; Brandt, M. The Effect of Laser Cladding Deposition Rate on Residual Stress Formation in Ti-6Al-4V Clad Layers. Key Eng. Mater. 2012, 520, 309–313. [Google Scholar] [CrossRef]
  36. Szost, B.A.; Terzi, S.; Martina, F.; Boisselier, D.; Prytuliak, A.; Pirling, T.; Hofmann, M.; Jarvis, D.J. A comparative study of additive manufacturing techniques: Residual stress and microstructural analysis of CLAD and WAAM printed Ti–6Al–4V components. Mater. Des. 2016, 89, 559–567. [Google Scholar] [CrossRef]
  37. Ali, H.; Ma, L.; Ghadbeigi, H.; Mumtaz, K. In-situ residual stress reduction, martensitic decomposition and mechanical properties enhancement through high temperature powder bed pre-heating of Selective Laser Melted Ti6Al4V. Mater. Sci. Eng. A 2017, 695, 211–220. [Google Scholar] [CrossRef]
Figure 1. Dimensions of the wedge-shaped sample (in mm) used for the diffraction line profile analysis.
Metals 09 00060 g001
Figure 2. The eCMWP analysis, showing: (a) comparison of the measured and modeled pattern for the SLMed Ti-6Al-4V sample; and (b) diffraction plots between 50–85° (2θ) consisting of 102, 110, 103, 200, 112, and 201 phase reflections.
Metals 09 00060 g002
Figure 3. Microstructures of the 3D printed Ti-6Al-4V samples using four different AM processes.
Metals 09 00060 g003
Figure 4. WH Plot representing the physical peak broadening as a function of peak position ’K’.
Metals 09 00060 g004
Figure 5. Residual stresses in the Ti-6Al-4V samples fabricated using different AM processes.
Metals 09 00060 g005
Figure 6. Schematic continuous cooling diagram for Ti-6Al-4V solution treated at 1050 °C for 30 min and quenched using the Jominey end quench test, showing the fit in terms of the cooling rates experienced during the four AM processes. (Reproduced with permission from Ahmed and Rack, Phase transformations during cooling in α+β titanium alloys, published by Elsevier, 1998 [16]).
Metals 09 00060 g006
Table 1. Dislocation sub-cell sizes <X>A, total dislocation densities ρTOTAL, and the ratios of sub-densities having <a>, <c+a>, and <c> Burgers’ vector types for the Ti-6Al-4V specimen fabricated using four metal AM processes.
AM Process<X>A (nm)ρTOTAL (m−2)<a> %<c+a> %<c> %
SLM100 ± 15(24 ± 3) × 101485 ± 1010 ± 105 ± 10
EBM>500(1.4 ± 0.5) × 101470 ± 1530 ± 150 ± 15
DMD120 ± 20(4.1 ± 0.5) × 101460 ± 1530 ± 1510 ± 15
WAAM>500(4.1 ± 0.5) × 101480 ± 1020 ± 100 ± 10

