Abstract
The paper summarises an experimental study on the fatigue crack propagation and cracks paths in ancient steel—19th-century puddle iron from the Eiffel bridge. The tests were performed with the load R-ratio equal to 0.05 and 0.5. All tests were performed under different notch inclinations (mode I + II). The fatigue crack growth rate in the tested material is significantly higher than its “modern” equivalent—low carbon mild steel. The crack closure phenomenon occurs in specimens during the process of crack growth. Understanding this aspect is crucial for the examination of a stress R-ratio influence on kinetic fatigue fracture diagram (KFFD) description. Both the experimental and numerical approach, using the HP VEE environment, has been applied to the crack closure as well as the crack opening forces’ estimation. These analyses are based on the deformation of the hysteresis loop. The algorithm that was implemented in the numerical environment is promising when it comes to describing the kinetics of fatigue crack growth (taking into consideration the crack closure effect) in old metallic materials.
1. Introduction
Maintaining the usefulness and reliability of ancient bridge structures requires precise methods of diagnostics and evaluation of the technical condition, often deviating from procedures based on technical recommendations for modern steel engineering structures. In the case of buildings erected at the turn of the 19th and 20th century, the diversity of operating conditions and the peculiarities of the materials used for their construction requires an individualised approach in the assessment of their structural conditions. It should be noted that 19th and 20th-century steel structures were made of procedures adopted in normative regulations for modern facilities’ technical. In the case of bridge structures erected at the turn of the 19th and 20th century, the diversity of operating conditions and the peculiarities of the materials used for such types of construction requires an individualised approach in the assessment of their technical condition, with particular regard to the phenomenon of fatigue. Metal bridges erected in the late 19th and early 20th centuries were built from the metallic materials, nowadays called puddled steel or puddle iron. During recent years, there was observed an increasing number of publications on diagnostic methods and evaluation methods of old bridges’ structural conditions. An important document is a publication [1] from 2005 written by the Federal Institute for Material Research and Testing (BAM), which comprehensively incorporates evaluation methods and monitoring systems of old bridges’ structural conditions. This problem has also been taken into account in the framework of the 6th European Research Framework Programme [2] on the safety of steel bridge structures from the 19th and early 20th century. However, in all cases, there is proposed only a simple investigation path involving fatigue fracture phenomenon. It is essential to propose a study focused on the characterisation of the fatigue crack propagation behaviour considering the mean stress effect and crack closure problem—especially in pure mode I and mixed mode (I + II) for puddle iron. In the case of these old steel grades [3,4,5,6], there are also confirmed evidence in the literature [7,8,9,10] of the microstructure degradation processes. The existence of such phenomena causes deterioration of ductile properties of the material. Additionally, in the puddled steels, we observe numerous discontinuities and non-metallic inclusions. Finally, these materials are often used in low-temperature conditions. These factors entail a substantial danger. These circumstances should be considered while estimating the safety of structures built using the mentioned type of materials. These properties are essential in residual life analysis of metal bridges in order to extend the lifetime of these structures. On the other hand, the crack initiation period can be dominating in the fatigue damage, while the fatigue crack propagation has little impact on global forecasts of the P-S-N (Probabilistic–S-N curve) field, especially if it is visible in the HCF (high-cycle) fatigue regime [11]. However, the existing large cracks in old bridge’s (especially cracks emanating from rivet hole) structural members force to physically study the kinetics of fatigue crack growth using experimental data from the ancient objects. Therefore, the main aim of the paper is the description of the fatigue crack growth rate in the long-term operated Eiffel Bridge steel with consideration local phenomenon–fatigue crack closure.
2. Material Investigations
The material under study was obtained from beam elements extracted from the Eiffel Bridge (see Figure 1), designed by Gustavo Eiffel and opened on June 30, 1878. This bridge is located in Viana do Castelo, Portugal, crossing the Lima River, having a total length of 645 m. The bridge consists of two levels, the upper level for road traffic and the lower level for rail traffic.
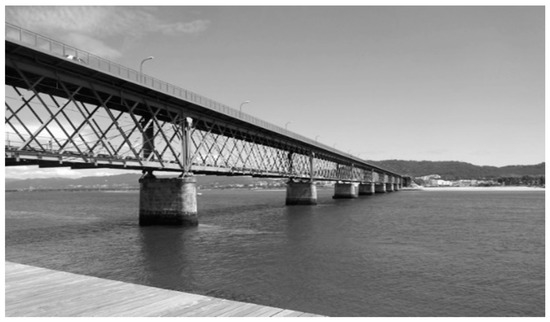
Figure 1.
A view on the Eiffel Bridge.
Initially, the main works in the material examination task focused on the chemical analysis (C, Mn, Si, P, S) of the tested steel using the spectral method on the measurement station (presented in the Table 1, results represent the mean value of three measurements) and the microstructural analysis in the post-operated state. The metallographic inspection was performed in the magnification range from 100× to 1000× in a non-etched and etched state (5%HNO3) following the ASTM E407-07(2015)e1 [12] standard using a metallographic microscope. Images were registered by being coupled with a microscope digital camera, CMOS 15MPx (ToupTek, Hangzhou, China), with the software for image analysis. Hardness measurements were carried out using the Vickers HV10 (Future-Tech, Kanagawa, Japan) method in accordance with the PN-EN ISO 6507-1:2007 [13]. The results are presented in the Table 2.

Table 1.
The chemical composition of the tested steel (in % by weight).
Table 2.
Vickers HV10 hardness measurements results.
Based on the chemical analysis (Table 1), a noticeable high phosphorus content is observed. This indicates a possible classification of the tested material as a puddle iron. Based on the theory of degradation, in an old puddle iron [7], the low carbon content (<0.1%C) and lack of the de-oxidation element, Si, predestines this material for the microstructural degradation processes. The microstructure analysis of the tested material is presented in Figure 2 and Figure 3. All static tensile test results (mean value of four specimens) are collected in Table 3.
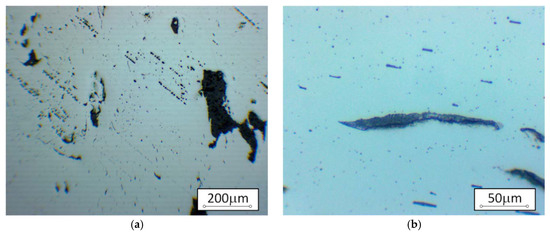
Figure 2.
Typical non-metallic inclusions pattern for Eiffel puddle iron (non-etched state, light microscopy). (a) Typical non-metallic inclusions chains deformed in the rolling direction; (b) noticeable large non-metallic inclusions and slags; the size of the slags often exceeds 10 µm.
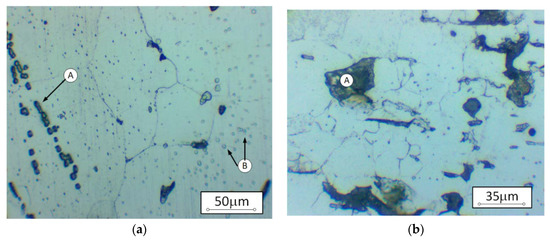
Figure 3.
The microstructure of Eiffel puddle iron (etched 5%HNO3, light microscopy). (a) Enlarged ferrite grains with non-metallic inclusion chains. (A) Noticeable different grain size with the brittle phase precipitations inside ferrite grains (B); (b) magnified ferrite grain structure containing large non-metallic inclusions (A).
Table 3.
Static tensile test results (according to the Portuguese NP10002-1 Standard).
In Table 3, fu is the ultimate tensile strength, fy is the higher yield stress, A is the elongation at fracture, and Z is the reduction in the cross-section at failure.
The microstructure of the investigated material is shaped by numerous non-metallic inclusions (mainly silicates) and consists of ferrite grains with different size levels. The microstructural degradation processes were also observed and confirmed in the brittle phase precipitations inside ferrite grains and on the grain boundaries. The microstructure of the tested material confirms the fact that the present material is an old puddle iron from the 19th century.
3. Fatigue Crack Growth Rate Test Results
The applied test machine, apparatus (e.g., clevises, load cells, grips, etc.), and specimens (Figure 4) were designed based on the standard, ASTM E647 [14]. The graphs of the fatigue crack growth rate are plotted in coordinates, f(logΔK) = log(da/dN). The SIF (stress intensity factor) for the standardised compact tension (CT) specimen can be obtained using the following equation proposed by the ASTM E647 standard [14]:
where: α is the normalised crack length (α = a/W), B is the thickness of the specimen [mm], W is the specimen width [mm], and ∆F is the force amplitude [N].
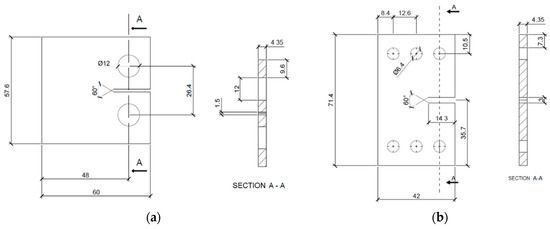
Figure 4.
FCGR (Fatigue Crack Growth Rate) test specimens. (a) CT (Compact Tension) specimen scheme and dimensions (in mm) for mode I test; (b) CTS (Compact Tension Shear) specimen scheme and dimensions (in mm) for mixed mode I + II test.
During the investigations, the following signals were registered: Applied force, F, and crack opening displacements (COD). First, a monotonically increasing load was applied to the specimens. Later, a procedure based on the compliance method was used to obtain the crack length. For CT specimens, the function of the plane stress elastic compliance can be written as follows:
where: a—length of crack; W—width of the specimen (in case of examined CT specimens, W = 48 mm). Coefficients, Ci, for i ∈ {0, 1, 2, 3, 4, 5} are used in the meaning derived from ASTM E647 [14]. Their values depend on the way of the COD measurement. The quantity, ux, is specified as below:
where: B—thickness of specimen [mm], E—modulus of elasticity [MPa]; v—crack opening displacement (COD) [mm]; F—applied force [N]; and v⁄F—slope of displacement versus force curve measured during the experiment [mm/N]. In the tests, two available measurement techniques were used:
- Controlled increase of the ΔK amplitude; and
- constant amplitude of the ΔF parameter (force range).
Before the main experimental procedure, the fatigue pre-crack was prepared to consider all loading conditions specified in the ASTM-E647 standard [14]. Measurement that stand for the mode I test are presented in the Figure 5.
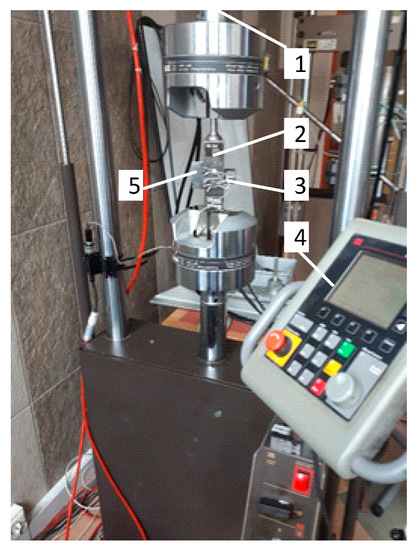
Figure 5.
Fatigue crack growth rate (FCGR) test measurement stand (1—MTS load cell, 2—MTS clevis for fracture mechanics, 3—MTS clip gage—extensometer, 4—MTS remote control panel, 5—specimen).
During the precracking procedure, ΔK did not exceed 13–15 MPa·m0.5. The test started from an initial value of ΔK in order to avoid the plastic zone influence created during the precracking procedure. Experiments were performed for two different mean stress levels characterized by a stress R-ratio equal to 0.05 and 0.5, with a sinusoidal-shaped loading waveform (frequency f = 5 Hz). The quantity of the crack length was obtained using the occurrence of the plane stress elastic compliance (Equation (3)). The computer system was managed by FlexTest (MTS, Minneapolis, MN, USA) console and FCGR (79040 Fatigue Crack Growth, MTS, Minneapolis, MN, USA) software integrated with an MTS (MTS810, MTS, Minneapolis, MN, USA) machine. At intervals of time, the crack length was measured and, if necessary, properly adjusted. Measurements were conducted using a microscope with a digital camera. During the experimental test, for each chosen cycle, at least two hysteresis loops were registered in order to assess the F-COD behavior during the test. According to the experimental procedure described in [9,10], the crack closure point and corresponding Fcl and Kcl levels were estimated with the purpose of determining the effective stress intensity factor range (ΔKeff) based on the Elber concept [15]. The main idea of obtaining Fcl consists of splitting the recorded F-COD curve into two fragments. The first of them is linear and the second is nonlinear. A simplified approach considering the nonlinear part as the quadratic one is shown in Figure 6 and Figure 7.
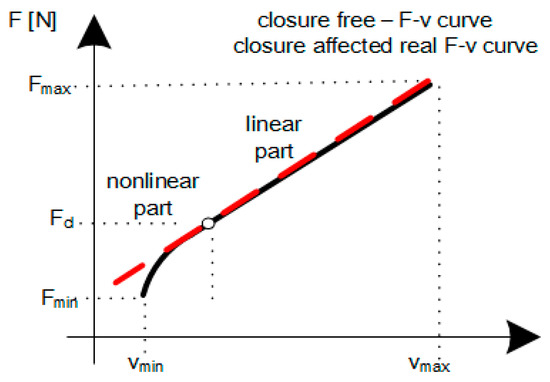
Figure 6.
Simplified decomposition of the registered F (Force)-COD (Crack Opening Displacement) signal [9,10].
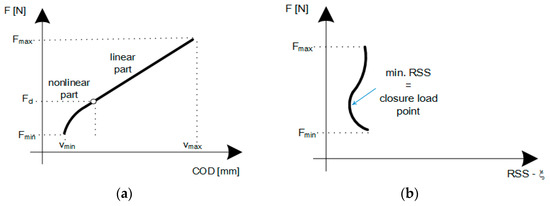
Figure 7.
Closure point identification procedure from the recorded hysteresis loop. (a) Crack closure point laying on the registered F-COD curve; (b) value of Fcl, for which the SSE value is the smallest—ξ [9,10].
The algorithm for determination of the closure point can be described in the following steps [9,10]:
- Registration of F-COD values during proper load cycles;
- splitting of the F-COD line into two parts (i.e., nonlinear and linear) by fitting a first-order polynomial function (with two constants: A0, A1) for the linear part and a second-order polynomial function (with three different constants: B0, B1, and B2) for the nonlinear one; and
- adjustment of the constants of the second-order function by minimizing the sum of squared errors of the prediction squares (or residual sum of squares—RSS).
As it was written above, both parts of the hysteresis loop, the linear vL(F) and quadratic vQ(F), can be described as follows:
Considering the strong linear dependency between the force and opening distance (right part of the curve shown in Figure 7a), we can use a linear regression method to calculate the constants, A0 and A1. On the other hand, the coefficients, B0, B1, and B2, can be obtained by using the conditions below:
According to the above conditions, the following equations can be obtained:
For proper selection of the coefficients, B0, B1, and B2, are necessary to validate the optimal values due to the minimal value of the residual sum of squares, ξ (RSS), defined as:
The value of Fk corresponding to the smallest RSS (the measure of deviation from the point which the F-COD curve splits into two parts) is regarded as the closure loading force, Fcl. Quantities, vmax and vmin, are the extreme values of COD for every cycle. The present method can be easily used in automated experiments. This approach guarantees a solution for Fcl in which ξ is minimal. However, in the case where the obtained data has a large degree of noise, or if a wrong tuning was conducted, the algorithm gives incorrect outputs (inappropriate closure load point [9,10]). Based on the above, the effective stress intensity factor range can be calculated as follows:
where U represents the Elber closure function [15] obtained from F-COD data recorded during the test:
In Equation (12), Fmax(min) represents a maximal (minimal) force in each cycle of loading, Fop—crack opening load force (comparable with Fcl—closure load) obtained from the hysteresis loop analysis.
Fatigue Crack GROWTH Rate Curves for Eiffel Bridge Puddle Iron
All experimental fatigue crack growth results are presented in Figure 8. Noticeable is the stress R-ratio effect (R = 0.05 and 0.5) observed in the KFFD (kinetic fatigue fracture diagram) and represented by shifted da/dN curves. In the case of ΔKeff, this effect can be neglected considering the Paris [16] regime. In order to better understand how fast the crack growth is in puddle iron, additional data of FCGR is shown in Figure 8 for old low carbon mild steel from 1900 (comparable mechanical properties and chemical composition). The broken specimens (Figure 9 and Figure 10) obtained after the tests are shown in Figure 11 and Figure 12 with visible typical crack paths shaped by non-metallic inclusions. A typical lamellar-like fracture surface with multi-origin of fatigue cracks can be observed—typically caused by a non-metallic inclusions’ presence. Based on experimental data, the Paris’ [16] constants are collected in Table 4.
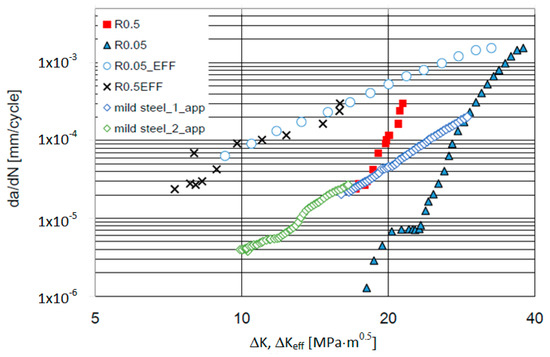
Figure 8.
Fatigue crack growth rate of Eiffel bridge puddle iron under R = 0.05 and 0.5 conditions compared with equivalent old mild steel (data from: [9]).
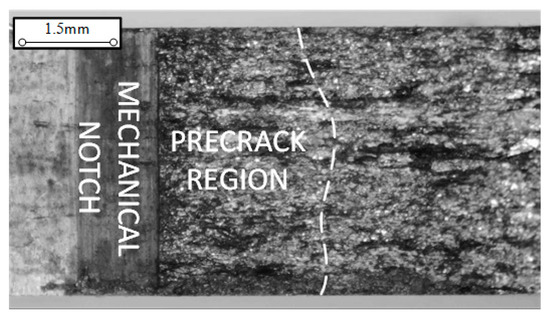
Figure 9.
Macroscopic view on the fracture surface of the broken CT specimen (R = 0.5).
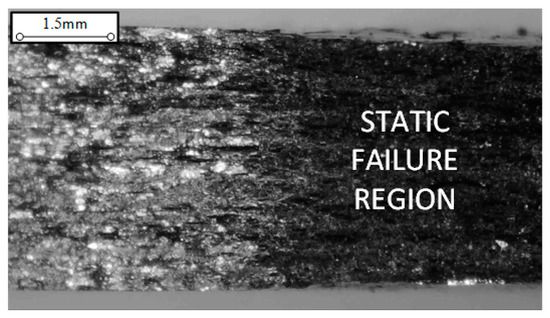
Figure 10.
Macroscopic view on the fracture surface of the broken CT specimen (R = 0.5)—fatigue and static fracture surface.
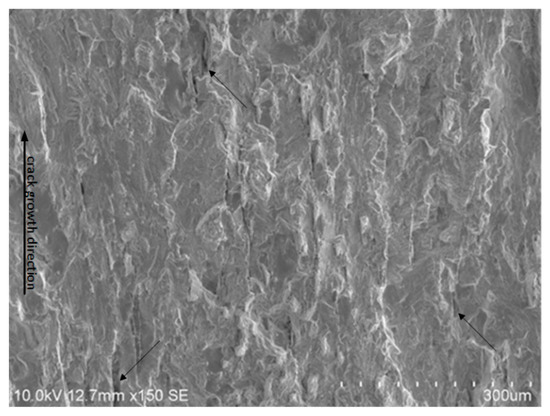
Figure 11.
Representative fatigue fracture surface of the broken specimen tested under mode I condition (R = 0.5)—initial fatigue crack growth phase.
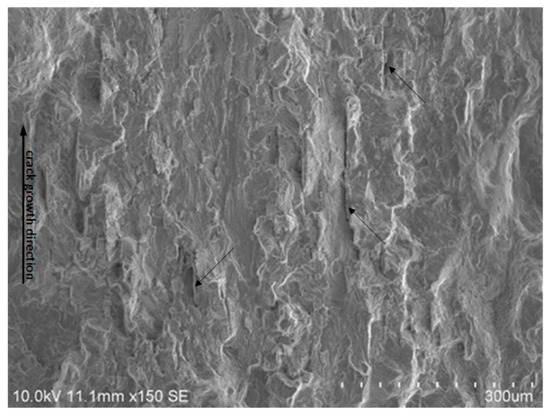
Figure 12.
Representative fatigue fracture surface of the broken specimen tested under mode I condition (R = 0.05)—initial fatigue crack growth phase.
Table 4.
Values of da/dN-ΔK, ΔKeff curves parameters—C, m under R = 0.05 and 0.5 conditions.
Fractography study was performed for the tested specimens (Figure 11, Figure 12, Figure 13 and Figure 14). The fracture surface was characterised by a multiorigin of fatigue crack growth, mainly due to nonmetallic inclusions (indicated by arrows). A noticeably increasing number of the typical secondary cracks can be observed as the tensile stress increases with the crack growth. This is much more visible in the case of R = 0.5, where, during the test, the maximal value, Kmax, was significantly higher. Moreover, it is notorious that the cracks grow along the nonmetallic inclusions due to their brittleness.
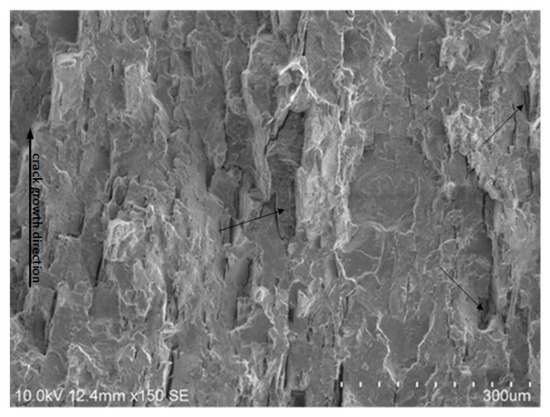
Figure 13.
Representative fatigue fracture surface of the broken specimen tested under mode I condition (R = 0.5)—approximately 6 mm from notch.
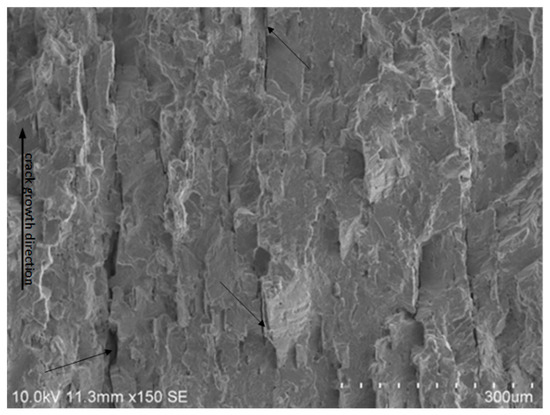
Figure 14.
Representative fatigue fracture surface of the broken specimen tested under mode I condition (R = 0.5)—approximately 6mm from notch.
4. Mixed-Mode Fatigue Crack Propagation Behaviour (Crack Inclination Angle, α = 30°)
Mixed-mode (I + II) fatigue crack growth tests considering the crack inclination angle, α, equal to 30°, were performed using special fixtures designed by Richard [17] for the CTS specimen (Figure 4b). The different mixity (I + II) levels were achieved due to changing the loading angles, from 0 degrees (pure mode I) up to 90 degrees (pure mode II) with a 15 degrees step. The experimental set-up is presented in Figure 15. During the experiments, the constant force amplitude was maintained for different stress R-ratios equal to 0.05 and 0.5. All specimens were loaded with the sinusoidal waveform with the maximum values, F = 6.5 kN and F = 10 kN, for stress R-ratios equal to 0.05 and 0.5, respectively, with the frequency of 10 Hz.
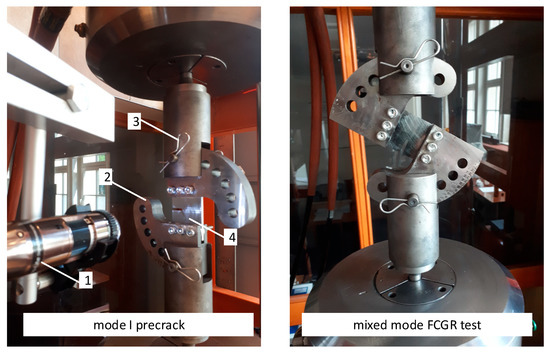
Figure 15.
Mixed mode fatigue crack growth test (1—DinoLite digital microscope, 2—Richard’s fixture, 3—upper clevis, 4—specimen).
The crack length was monitored using an optical method by the digital microscope, Dino-Lite, with an automated system that captures images in a specific period. The crack tip location was recorded in the X-Y grid system of the camera. The origin of the coordinate system was located at the end of the pre-crack tip, as shown in Figure 16. In Figure 17, the observed initial crack angle was 28.9°. After approximately 1.5 mm of the crack length, a deviation was observed and the angle (from the flat notch) changed to approximately 14.1°. Non-metallic inclusions caused this effect. The results of the experimental studies of the crack growth under mixed mode (I + II) for the mixity represented by α = 30° are presented in Table 5.
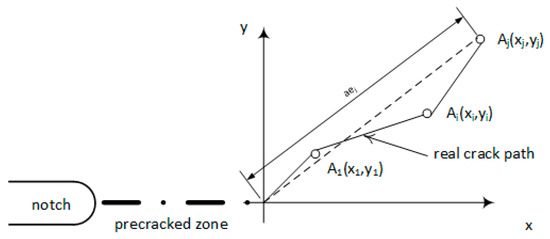
Figure 16.
The coordinate system with the scheme of recording the X-Y crack tip location and crack length increment calculation; aej—mixed mode fatigue crack growth length [18].
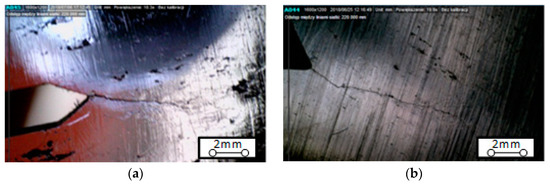
Figure 17.
Mixed mode fatigue crack path in the CTS specimen (a) for R = 0.5; (b) for R = 0.05.
Table 5.
Summary of data obtained under mixed mode loading for crack angle of α = 30°.
The results of the experimental studies of the crack growth under mixed mode (I + II) for the mixity represented by α = 30° are presented in Table 5.
Figure 18 shows the a(N) curve, (with the crack length, a, as a function of the number of cycles, N) corresponding to the level of mixity represented by α = 30° for the stress R-ratios equal to 0.05 and 0.5.
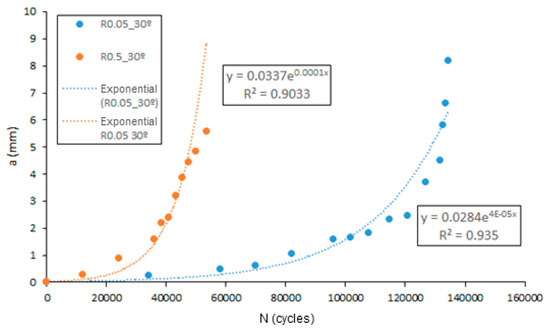
Figure 18.
Fatigue crack length as a function of the number of cycles to failure for the initial crack angle of α = 30° and stress ratios of R = 0.05 and 0.5.
5. Concluding Remarks
The effects of the study of 19th-century structural elements derived from the Eiffel Bridge were presented. In this study, the most important mechanical properties of the material collected from the Eiffel bridge were obtained using metallographic inspections and a simple uniaxial tensile test. Based on the executed fatigue fracture tests (mode I), including low-level mixity, the following conclusions can be formulated:
- The Paris’ [16] exponent, m (slope of the FCGR curve), for Eiffel Bridge steel is significantly higher than for modern bridge constructional steel, even for the early 20th century steel;
- the observed fatigue crack closure phenomenon strongly influence the kinetics of fatigue crack growth in the tested puddle iron (decreases the Paris’-m exponent and consolidated data from different R-ratios into one curve); and
- under a mixed mode condition (I + II), a significant R-ratio influence was observed.
Based on the performed analysis, further steps of fatigue crack growth modelling in an ancient puddle iron material should be focused on the crack closure phenomenon investigation under a mixed mode condition and the generalization of fatigue fracture models based on a new, effective-equivalent stress intensity factor.
Author Contributions
G.L. and J.A.F.O.C. conceived and designed the concept of the research and methodology. M.S. and M.D. performed material investigations and contribute to paper editing. G.L. performed the FCGR measurements, further data analysis and interpretation. P.A.M. and J.A.F.O.C. contributed in fatigue crack closure analysis. A.M.P.D.J. and R.A.B.C. supervised and substantively revised all works and the article text. All authors participated in writing the paper.
Funding
This research was funded by grant number POCI-01-0145-FEDER-030103 FiberBridge—Fatigue strengthening and assessment of railway metallic bridges using fiber-reinforced polymers by FEDER funds through COMPETE2020 (POCI) and by national funds (PIDDAC) through the Portuguese Science Foundation (FCT/MCTES), and the Portuguese Science Foundation (FCT/MCTES) through the post-doctoral grant SFRH/BPD/ 107825/2015 the for their collaboration, financial and technical support during this research works. The APC was funded by Authors’ own sources.
Conflicts of Interest
The authors declare no conflict of interest.
References and Note
- Helmerich, R. Alte Stähle und Stahlkonstruktionen. Materialuntersuchungen, Ermüdungsversuche an Orginalen Brükenträgern und Messungen von 1990 bis 2003; Bundesanstalt für Materialforschung und Prüfung (BAM): Berlin, Germany, 2005. (In German)
- Cremona, C.; Patron, A.; Johansson, B.; Larsson, T.; Eichler, B.; Hóhler, S. Improved Assessment Methods for Static and Fatigue Resistance of Old Steel Railway Bridges. Background Document D4.6, Final Draft 30.11.2007. In “Sustainable Bridges—Assessment for Future Traffic Demands and Longer Lives” Project TIP3-CT-2003-001653 (2003-12-01–2007-11-30) Co-Founded by the European Commission within the Sixth Framework Programme (2002–2006).
- Hołowaty, J. Assessment of Structural Steel’s Properties in a Railway Plate Girder Bridge. Struct. Eng. Int. 2017, 27, 441–448. [Google Scholar] [CrossRef]
- Hołowaty, J. Toughness tests on steels from old railway bridges. Procedia Struct. Integr. 2017, 5, 1043–1050. [Google Scholar] [CrossRef]
- Wichtowski, B.; Hołowaty, J. Assessment of fatigue limits in historical welded railway bridges in Poland. Procedia Struct. Integr. 2017, 5, 1035–1042. [Google Scholar] [CrossRef]
- Sieber, L.; Stroetmann, R. The brittle fracture behavior of old mild steels. Procedia Struct. Integr. 2017, 5, 1019–1026. [Google Scholar] [CrossRef]
- Lesiuk, G.; Szata, M.; Bocian, M. The mechanical properties and the microstructural degradation effect in an old low carbon steels after 100-years operating time. Arch. Civ. Mech. Eng. 2015, 15, 786–797. [Google Scholar] [CrossRef]
- Lesiuk, G.; Kucharski, P. Inicjacja wzrostu pęknięć w długotrwale eksploatowanych stalach mostowych z punktu widzenia metod energetycznych. TTS Technika Transportu Szynowego 2015, 22, 920–927. [Google Scholar]
- Lesiuk, G.; Szata, M.; Correia, J.A.; De Jesus, A.M.P.; Berto, F. Kinetics of fatigue crack growth and crack closure effect in long term operating steel manufactured at the turn of the 19th and 20th centuries. Eng. Fract. Mech. 2017, 185, 160–174. [Google Scholar] [CrossRef]
- Lesiuk, G.; Correia, J.A.; De Jesus, A.M.P.; Kucharski, P. Fatigue crack propagation behavior of old puddle iron including crack closure effects. Procedia Struct. Integr. 2016, 2, 3218–3225. [Google Scholar] [CrossRef]
- Raposo, P.; Correia, J.A.F.O.; De Jesus, A.M.P.; Calçada, R.A.B.; Lesiuk, G.; Hebdon, M.; Fernández-Canteli, A. Probabilistic fatigue S-N curves derivation for notched components. Frattura ed Integrità Strutturale 2017, 42, 105–118. [Google Scholar] [CrossRef]
- ASTM E407-07(2015)E1 Standard Practice for Microetching Metals and Alloys; ASTM International: West Conshohocken, PA, USA, 2015. [CrossRef]
- PN-EN ISO 6507-1:2007: Metale. Pomiar Twardości Sposobem Vickersa—Część 1: Metoda Badania; Polski Komitet Normalizacyjny: Warszawa, Poland, 2007.
- ASTM E647: Standard Test Method for Measurement of Fatigue Crack Growth Rates, Annual Book of ASTM Standards; ASTM: West Conshohocken, PA, USA, 2000.
- Elber, W. Fatigue crack closure under cyclic tension. Eng. Fract. Mech. 1970, 2, 37–45. [Google Scholar]
- Paris, P.C.; Gomez, M.; Anderson, W.E. A rational analytic theory of fatigue. Trend Eng. 1961, 13, 9–14. [Google Scholar]
- Richard, H.A. Bruchvorhersagen bei Überlagerter Normal- und Schubbeanspruchung von Rissen; VDI Forschungsheft 631; VDI-Verlag: Düsseldorf, Germany, 1985; pp. 1–60. (In German) [Google Scholar]
- Lesiuk, G.; Kucharski, P.; Correia, J.A.; De Jesus, A.M.P.; Rebelo, C.; da Silva, L.S. Mixed mode (I + II) fatigue crack growth in puddle iron. Eng. Fract. Mech. 2017, 185, 175–192. [Google Scholar] [CrossRef]
© 2019 by the authors. Licensee MDPI, Basel, Switzerland. This article is an open access article distributed under the terms and conditions of the Creative Commons Attribution (CC BY) license (http://creativecommons.org/licenses/by/4.0/).