1. Introduction
Metal molds are some of the tools most used in the industry today. They are used to shape thermoplastic materials through different techniques [
1]: injection (parts for the car industry), thermoforming (packaging), rotational molding (kayaks), and compression molding and blow molding (food containers).
The molds are produced by milling, in a machining center with a three- or five-axis [
2]. The machining of the molds is undertaken in two stages. The first stage, known as roughing, is for the elimination of the main mold cavity without being concerned with the surface roughness obtained. This operation is usually carried out with a robust flat-end tool. The second stage, known as finishing, permits a fine surface roughness, eliminating the remaining material. This is usually carried out with tools of a smaller diameter and hemispherical end.
The tool-path that the tool has to follow during both phases of milling is undertaken by a pocketing strategy. There are multiple types of strategies, although the most used and studied are the raster (zig-zag, ZZ) and 3-D offset (contour-parallel, CP) [
3].
In the manufacturing of a mold, the most important parameter is the surface roughness obtained [
4]. In the literature, there is an abundance of references on the study of technical parameters with greater influence on surface finishing [
5,
6,
7,
8]. Normally, geometrically simple molds are chosen, and the roughness is measured at the bottom of the pocket [
9]. Nevertheless, little attention is paid to the roughness of the walls of the mold [
10].
Some authors have studied the impact of the finishing strategies on the quality of the surface roughness obtained. For 2.5-D milling, Gologlu and Sakarya [
11] studied, via the Taguchi method, three types of strategies (one-direction, ZZ, and CP) and four cutter parameters (cutting velocity, feed rate, depth of cut, and stepover). Also, Romero et al. [
12] compared the ZZ and CP strategy for three different pocket geometries (concave, and convex with and without islands). For complex geometries, Ramos, Relvas, and Simões [
13] compared different strategies for finishing (ZZ, CP, and radial) using the same strategies for roughing in every case, while Fagili de Souza et al. [
14] studied four different finishing strategies (3-D offset, spiral, radial path, and ZZ) for mold applications. Schützer, Helleno, and Castellari [
15] compared a ZZ strategy (45°) in finishing with a mix formed by four strategies adapted to the different regions of the geometry. Normally, the studies found in the literature are focused on finishing strategies and do not analyze the influence of roughing strategies on the surface roughness obtained on the complex surface [
13,
14,
15,
16].
In recent years, a large number of authors have focused their work on reducing the electrical energy used in the manufacturing processes [
17,
18]. Yoon et al. [
19] have compared which method (bulk forming, substractive process, or additive process) consumes less electrical energy to manufacture the same part. Priarone [
20] has evaluated the electrical consumption of a shaping grinding process for different process parameters via a full factorial experimental plan. Eden and Mativenga [
21] have quantified the electrical consumption of a milling machine for different linear paths (G1) and circular paths (G2 and G3) in order to predict the electric demand of the machine during the execution of a NC program. Guerra-Zubiaga et al. [
22] have studied different cutting trajectories and cutting parameters (feed rate, spindle speed, and depth of cut) in a slot milling process to analyze its influence on electrical consumption of the machining center. Kant and Sangwan [
23] have developed a predictive model for the minimization of EEC and surface roughness during the machining of AISI 1045 steel. Based on simulations, Xu and Tang [
24] have proposed two energy-saving strategies for rough milling tool path planning. Pavanasar et al. [
25] have proposed a toolpath strategy that consumes at least 20% less energy than any conventional toolpath.
The present study has the following main objective: to study different cutting strategies and cutting parameters during the machining of a mold to determine which combination allows one to reach a better surface roughness on the bottom and walls of the cavity with the least possible EEC. For this purpose, an orthogonal design of experiments (DOE) was developed, made up of 32 tests. The variables included in the DOE were: strategy on roughing, axial depth of cut on roughing, strategy on finishing, spindle-speed in finishing, feed-rate in finishing, and step-over in finishing. All the tests were undertaken on EN AW 7075 T6 prismatic parts, using a machining center of a three-axis and coolant.
The work layout is in the following manner:
Section 2 describes the materials and the methodology used throughout the tests.
Section 3 will show the results obtained; those results will then be discussed in
Section 4. Finally, the conclusions will be presented in
Section 5.
2. Materials and Methods
The molds designed for the experiments have a particular geometry in order to oblige the tool to work with different parts of its edge (
Figure 1): the bottom shows a step and is assembled with planes of different gradients, and the walls have a certain slope (they are not vertical). The 3-D pocket is open on one side to facilitate the readings of the roughness meter.
The cavities were machined with a machining center of a three-axis, a Chevalier, QP2026-L model, whose spindle worked at a maximum of 8000 rpm. The machine was equipped with a numerical control unit, a Fanuc, 0i-MC model, which worked with the look-ahead function activated. All the tests were carried out with refrigerant, based on an oil emulsion Besal 5 (Brugarolas, Rubí, Barcelona, Spain), diluted in water in a proportion of 5% [
26].
The material used to machine the molds was an EN AW 7075 T6. It is an Al-Zn-Mg-(Cu) alloy, hardened by precipitation and with a high resistance to tensile strength (500–530 MPa). It is used to manufacture molds used in the plastic industry [
27].
Each cavity was machined in two stages (
Figure 2). The roughness stage was carried out with a tungsten-carbide cylindrical flat-end milling tool with an 8 mm diameter, and two cutting edges with a helical angle of 45° (DIN 6527). The finishing stage was carried out with a tungsten-carbide hemispherical tool, titanium nitride coated (TiN), with a 5 mm diameter. The path and working numerical control (NC) code was generated by means of a Mastercam software program (Version v10.2 MR2, CNC Software Inc., Tolland, CT, USA) [
28].
During the roughing stage, the tool worked according to the manufacturer recommendations: spindle-speed equal to 6366 rpm, feed-rate in radial direction equal to 764 mm/min, feed-rate in axial direction equal to 382 mm/min, and step-over equal to 4 mm. The values used for the rest of the parameters for roughing and finishing are shown in
Table 1. To study the influence of these parameters on the output variables, an orthogonal design of experiments was developed, as seen in
Table 2 [
29].
The EEC of the machining center was measured on each test by Chauvin Arnoux PEL 103 equipment (Chauvin Arnoux, Paris, France) [
20]. The EEC during a milling process depended on the electrical power of the machining center and the machining time:
According Yoon et al. [
19], the energy consumed by a machining center has the following distribution: basic consumption (52%), coolant pump (19%), stage movement (1%), spindle rotation (21%), cutting (7%). During the tests, the terms basic consumption, coolant pump, and stage movement did not change, so the data logger measures allowed us to know the differences in the terms spindle rotation and cutting.
In the other hand, every strategy (ZZ, CP, ZZ 0°, and ZZ 45°) generated a particular machining time. This fact produced different EEC for the same feed-rate of spindle speed.
The surface roughness was measured by a Mitutoyo roughness meter, SJ-201P model (Mitutoyo Corporation, Sakado, Japan) (
Figure 2). Five measurements were taken in each plane of the bottom of the 3-D pocket. The cut-off value was selected as recommended by ISO 4288 [
30].
To analyze the influence of each parameter or strategy, the Taguchi method was used [
31]. This method allows one to find optimal process values for improving the quality characteristics in a manufacturing process [
9]. Through the use of orthogonal arrays, the Taguchi method allows one to completely study the space within a parameter with a reduced amount of experiments. Taguchi recommends using the signal-to-noise ratio (S/N ratio) in order to determine the quality characteristics implemented in problems that arise in design engineering (in this instance, “the smaller the better” was used).
In addition to the S/N ratio, a statistical analysis of variance (ANOVA) was used to certify the influence of studied parameters and strategies on surface roughness and EEC. In this way, the optimal levels of process parameters and strategies could be estimated.
Author Contributions
Conceptualization, O.R.-A., G.G.-V. and P.E.R.; Methodology, O.R.-A. and P.E.R.; Software, O.R.-A. and P.E.R.; Validation, P.E.R.; Formal Analysis, M.T.B. and P.E.R.; Investigation, O.R.-A., M.T.B. and P.E.R.; Data Curation, M.T.B. and P.E.R.; Writing-Original Draft Preparation, O.R.-A., M.T.B. and P.E.R.; Writing-Review & Editing, O.R.-A., G.G.-V. and P.E.R.; Supervision, P.E.R.; Project Administration, P.E.R.
Funding
This research received no external funding.
Conflicts of Interest
The authors declare no conflict of interest.
References
- Groover, M.P. Fundamentals of Modern Manufacturing; Wiley: Hoboken, NJ, USA, 2015. [Google Scholar]
- Krajnik, P.; Kopač, J. Modern machining of die and mold tools. J. Mater. Process. Technol. 2004, 157–158, 543–552. [Google Scholar] [CrossRef]
- Romero-Carrillo, P.; Torres-Jimenez, E.; Dorado, R.; Daz-Garrido, F. Analytic construction and analysis of spiral pocketing via linear morphing. CAD Comput. Aided Des. 2015, 69, 1–10. [Google Scholar] [CrossRef]
- Wang, M.Y.; Chang, H.Y. Experimental study of surface roughness in slot end milling AL2014-T6. Int. J. Mach. Tools Manuf. 2004, 44, 51–57. [Google Scholar] [CrossRef]
- Öktem, H.; Erzurumlu, T.; Kurtaran, H. Application of response surface methodology in the optimization of cutting conditions for surface roughness. J. Mater. Process. Technol. 2005, 170, 11–16. [Google Scholar] [CrossRef]
- Petek, A.; Kuzman, K.; Kopac, J. Deformations and forces analysis of single point incremental sheet metal forming. Arch. Mater. Sci. Eng. 2009, 35, 107–116. [Google Scholar]
- Kopac, J.; Krajnik, P. Robust design of flank milling parameters based on grey-Taguchi method. J. Mater. Process. Technol. 2007, 191, 400–403. [Google Scholar] [CrossRef]
- Jiang, F.; Li, J.; Yan, L.; Sun, J.; Zhang, S. Optimizing end-milling parameters for surface roughness under different cooling/lubrication conditions. Int. J. Adv. Manuf. Technol. 2010, 51, 841–851. [Google Scholar] [CrossRef]
- Öktem, H.; Erzurumlu, T.; Çöl, M. A study of the Taguchi optimization method for surface roughness in finish milling of mold surfaces. Int. J. Adv. Manuf. Technol. 2006, 28, 694–700. [Google Scholar] [CrossRef]
- Yao, C.; Tan, L.; Yang, P.; Zhang, D. Effects of tool orientation and surface curvature on surface integrity in ball end milling of TC17. Int. J. Adv. Manuf. Technol. 2018, 94, 1699–1710. [Google Scholar] [CrossRef]
- Gologlu, C.; Sakarya, N. The effects of cutter path strategies on surface roughness of pocket milling of 1.2738 steel based on Taguchi method. J. Mater. Process. Technol. 2008, 206, 7–15. [Google Scholar] [CrossRef]
- Romero, P.E.; Dorado, R.; Díaz, F.A.; Rubio, E.M. Influence of pocket geometry and tool path strategy in pocket milling of UNS A96063 alloy. Procedia Eng. 2013, 63, 523–531. [Google Scholar] [CrossRef]
- Ramos, A.M.; Relvas, C.; Simões, J.A. The influence of finishing milling strategies on texture, roughness and dimensional deviations on the machining of complex surfaces. J. Mater. Process. Technol. 2003, 136, 209–216. [Google Scholar] [CrossRef]
- De Souza, A.F.; Machado, A.; Beckert, S.F.; Diniz, A.E. Evaluating the roughness according to the tool path strategy when milling free form surfaces for mold application. Procedia CIRP 2014, 14, 188–193. [Google Scholar] [CrossRef]
- Schützer, K.; Helleno, A.L.; Pereira, S.C. The influence of the manufacturing strategy on the production of molds and dies. J. Mater. Process. Technol. 2006, 179, 172–177. [Google Scholar] [CrossRef]
- Krimpenis, A.; Fousekis, A.; Vosniakos, G. Assessment of sculptured surface milling strategies using design of experiments. Int. J. Adv. Manuf. Technol. 2005, 25, 444–453. [Google Scholar] [CrossRef]
- O’Driscoll, E.; Kelly, K.; O’Donnell, G.E. Intelligent energy based status identification as a platform for improvement of machine tool efficiency and effectiveness. J. Clean. Prod. 2015, 105, 184–195. [Google Scholar] [CrossRef]
- Kong, D.; Choi, S.; Yasui, Y.; Pavanaskar, S.; Dornfeld, D.; Wright, P. Software-based tool path evaluation for environmental sustainability. J. Manuf. Syst. 2011, 30, 241–247. [Google Scholar] [CrossRef] [Green Version]
- Yoon, H.S.; Lee, J.Y.; Kim, H.S.; Kim, M.S.; Kim, E.S.; Shin, Y.J.; Chu, W.S.; Ahn, S.H. A comparison of energy consumption in bulk forming, subtractive, and additive processes: Review and case study. Int. J. Precis. Eng. Manuf. Green Technol. 2014, 1, 261–279. [Google Scholar] [CrossRef] [Green Version]
- Priarone, P.C. Quality-conscious optimization of energy consumption in a grinding process applying sustainability indicators. Int. J. Adv. Manuf. Technol. 2016, 86, 2107–2117. [Google Scholar] [CrossRef]
- Edem, I.F.; Mativenga, P.T. Modelling of energy demand from computer numerical control (CNC) toolpaths. J. Clean. Prod. 2017, 157, 310–321. [Google Scholar] [CrossRef]
- Guerra-Zubiaga, D.A.; Al Mamun, A.; Gonzalez-Badillo, G. An energy consumption approach in a manufacturing process using design of experiments. Int. J. Comput. Integr. Manuf. 2018, 1–11. [Google Scholar] [CrossRef]
- Kant, G.; Sangwan, K.S. Prediction and optimization of machining parameters for minimizing power consumption and surface roughness in machining. J. Clean. Prod. 2014, 83, 151–164. [Google Scholar] [CrossRef]
- Xu, K.; Tang, K. An energy saving approach for rough milling tool path planning. Comput. Aided Des. Appl. 2016, 13, 253–264. [Google Scholar] [CrossRef]
- Pavanaskar, S.; Pande, S.; Kwon, Y.; Hu, Z.; Sheffer, A.; McMains, S. Energy-efficient vector field based toolpaths for CNC pocketmachining. J. Manuf. Process. 2015, 20, 314–320. [Google Scholar] [CrossRef]
- Brugarolas Besal 5. Available online: http://portal.suministrosherco.com/herco/doc/HERCO__DOC0004813_HT-BESAL_5_(08.02.13).pdf (accessed on 17 August 2018).
- Oktem, H.; Erzurumlu, T.; Uzman, I. Application of Taguchi optimization technique in determining plastic injection molding process parameters for a thin-shell part. Mater. Des. 2007, 28, 1271–1278. [Google Scholar] [CrossRef]
- Mastercam, Version 10.2 MR2; CNC Software Inc.: Tolland, CT, USA, 2005.
- Montgomery, D. Design and Analysis of Experiments; John Wiley & Sons Inc.: Hoboken, NJ, USA, 2012; ISBN 978-1-118-14692-7. [Google Scholar]
- Geometrical Product Specifications (GPS). Surface Texture: Profile Method. Rules and Procedures for the Assessment of Surface Texture (ISO 4288:1996); International Standard Organization: Geneva, Switzerland, 1998. [Google Scholar]
- Roy, R. A Primer on Taguchi Method; Society of Manufacturing Engineers (SME): Dearborn, Michigan, 2010; ISBN 978-0872638648. [Google Scholar]
- Baptista, R.; Antune Simões, J.F. Three and five axes milling of sculptured surfaces. J. Mater. Process. Technol. 2000, 103, 398–403. [Google Scholar] [CrossRef]
- Oda, Y.; Mori, M.; Ogawa, K.; Nishida, S.; Fujishima, M.; Kawamura, T. Study of optimal cutting condition for energy efficiency improvement in ball end milling with tool-workpiece inclination. CIRP Ann. Manuf. Technol. 2012, 61, 119–122. [Google Scholar] [CrossRef]
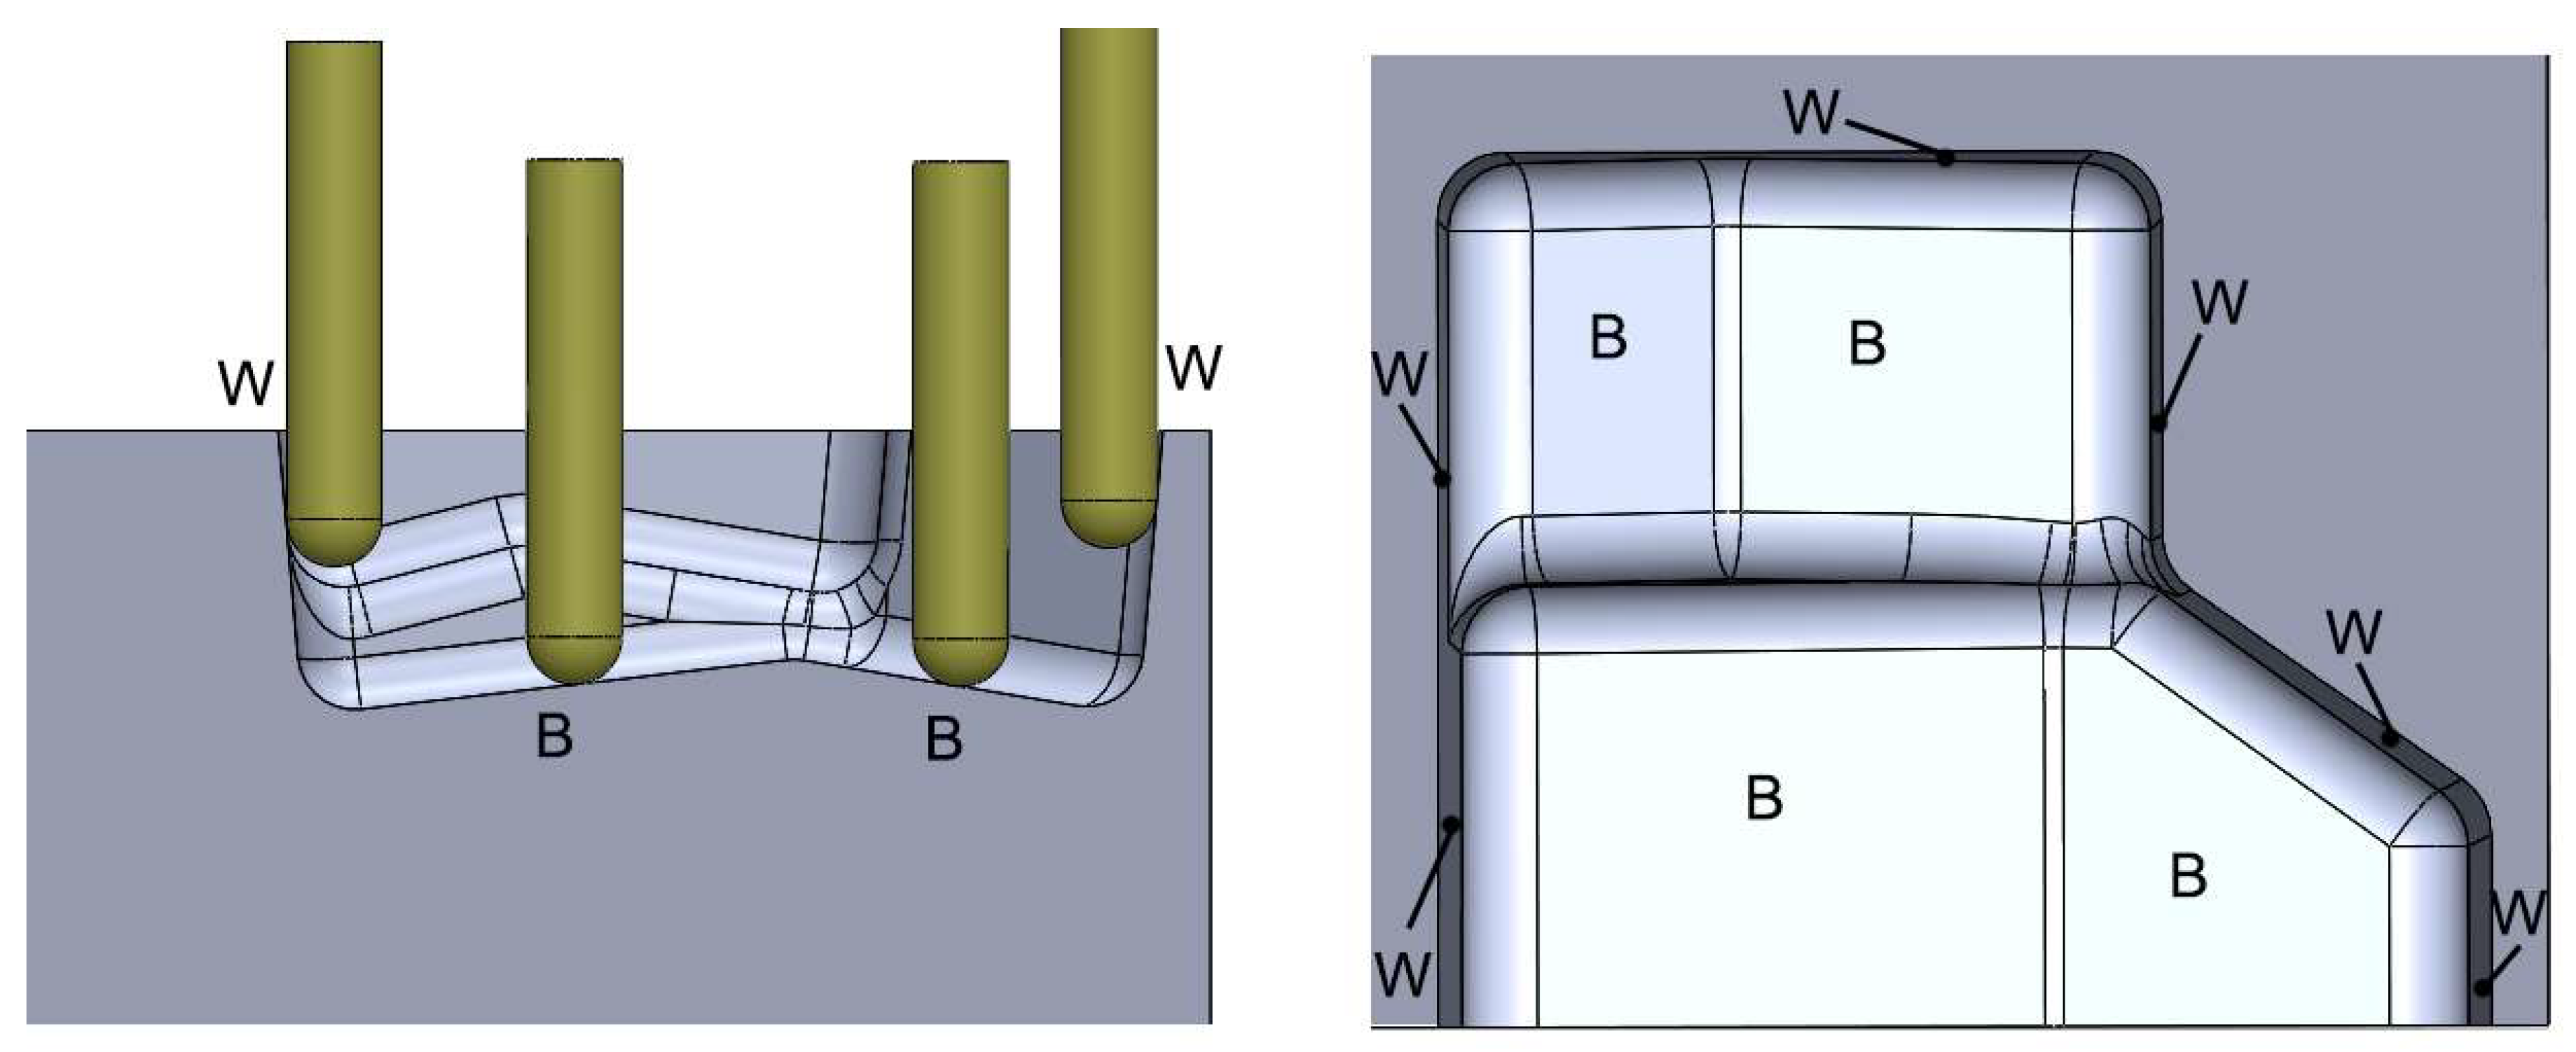
Figure 1.
Diagram of the mold used in the tests: section where the gradient of the bottom (B) and the wall (W) are evident (left), and top view of the cavity (right).
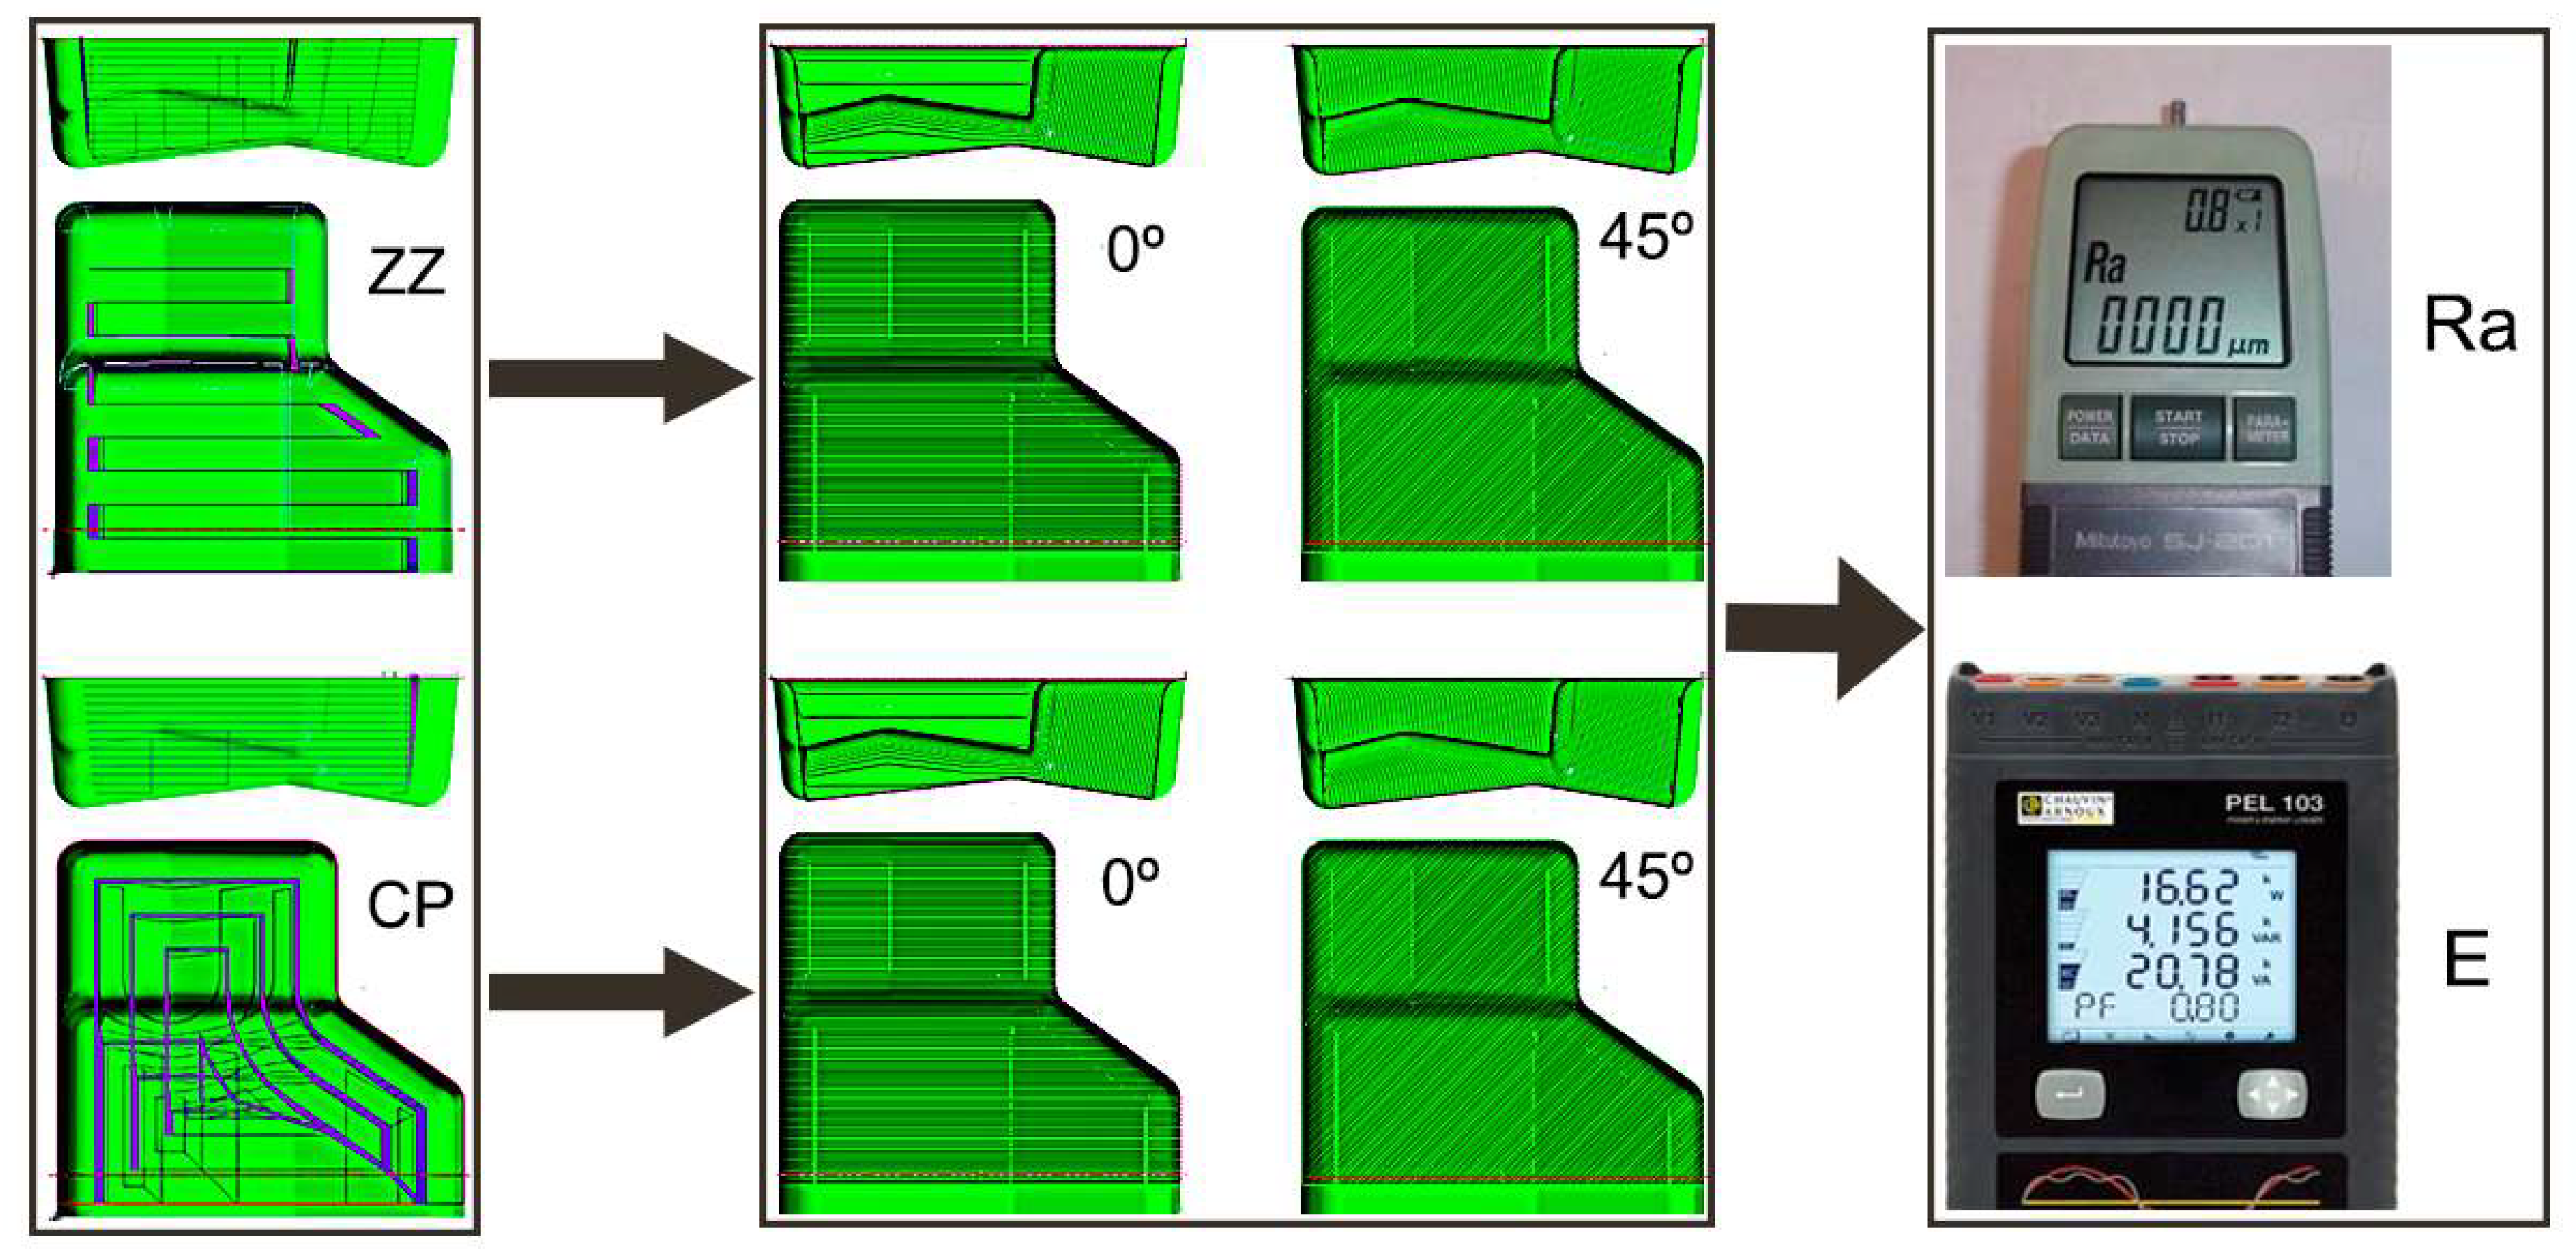
Figure 2.
Scheme of the experiments: the strategies used in the roughing stage are zig-zag (ZZ) and contour-parallel (CP) (left), the strategies used in finishing stage are ZZ 0° and ZZ 45° (centre), and Mitutoyo roughness meter and energy data logger employed in the measurements (right).
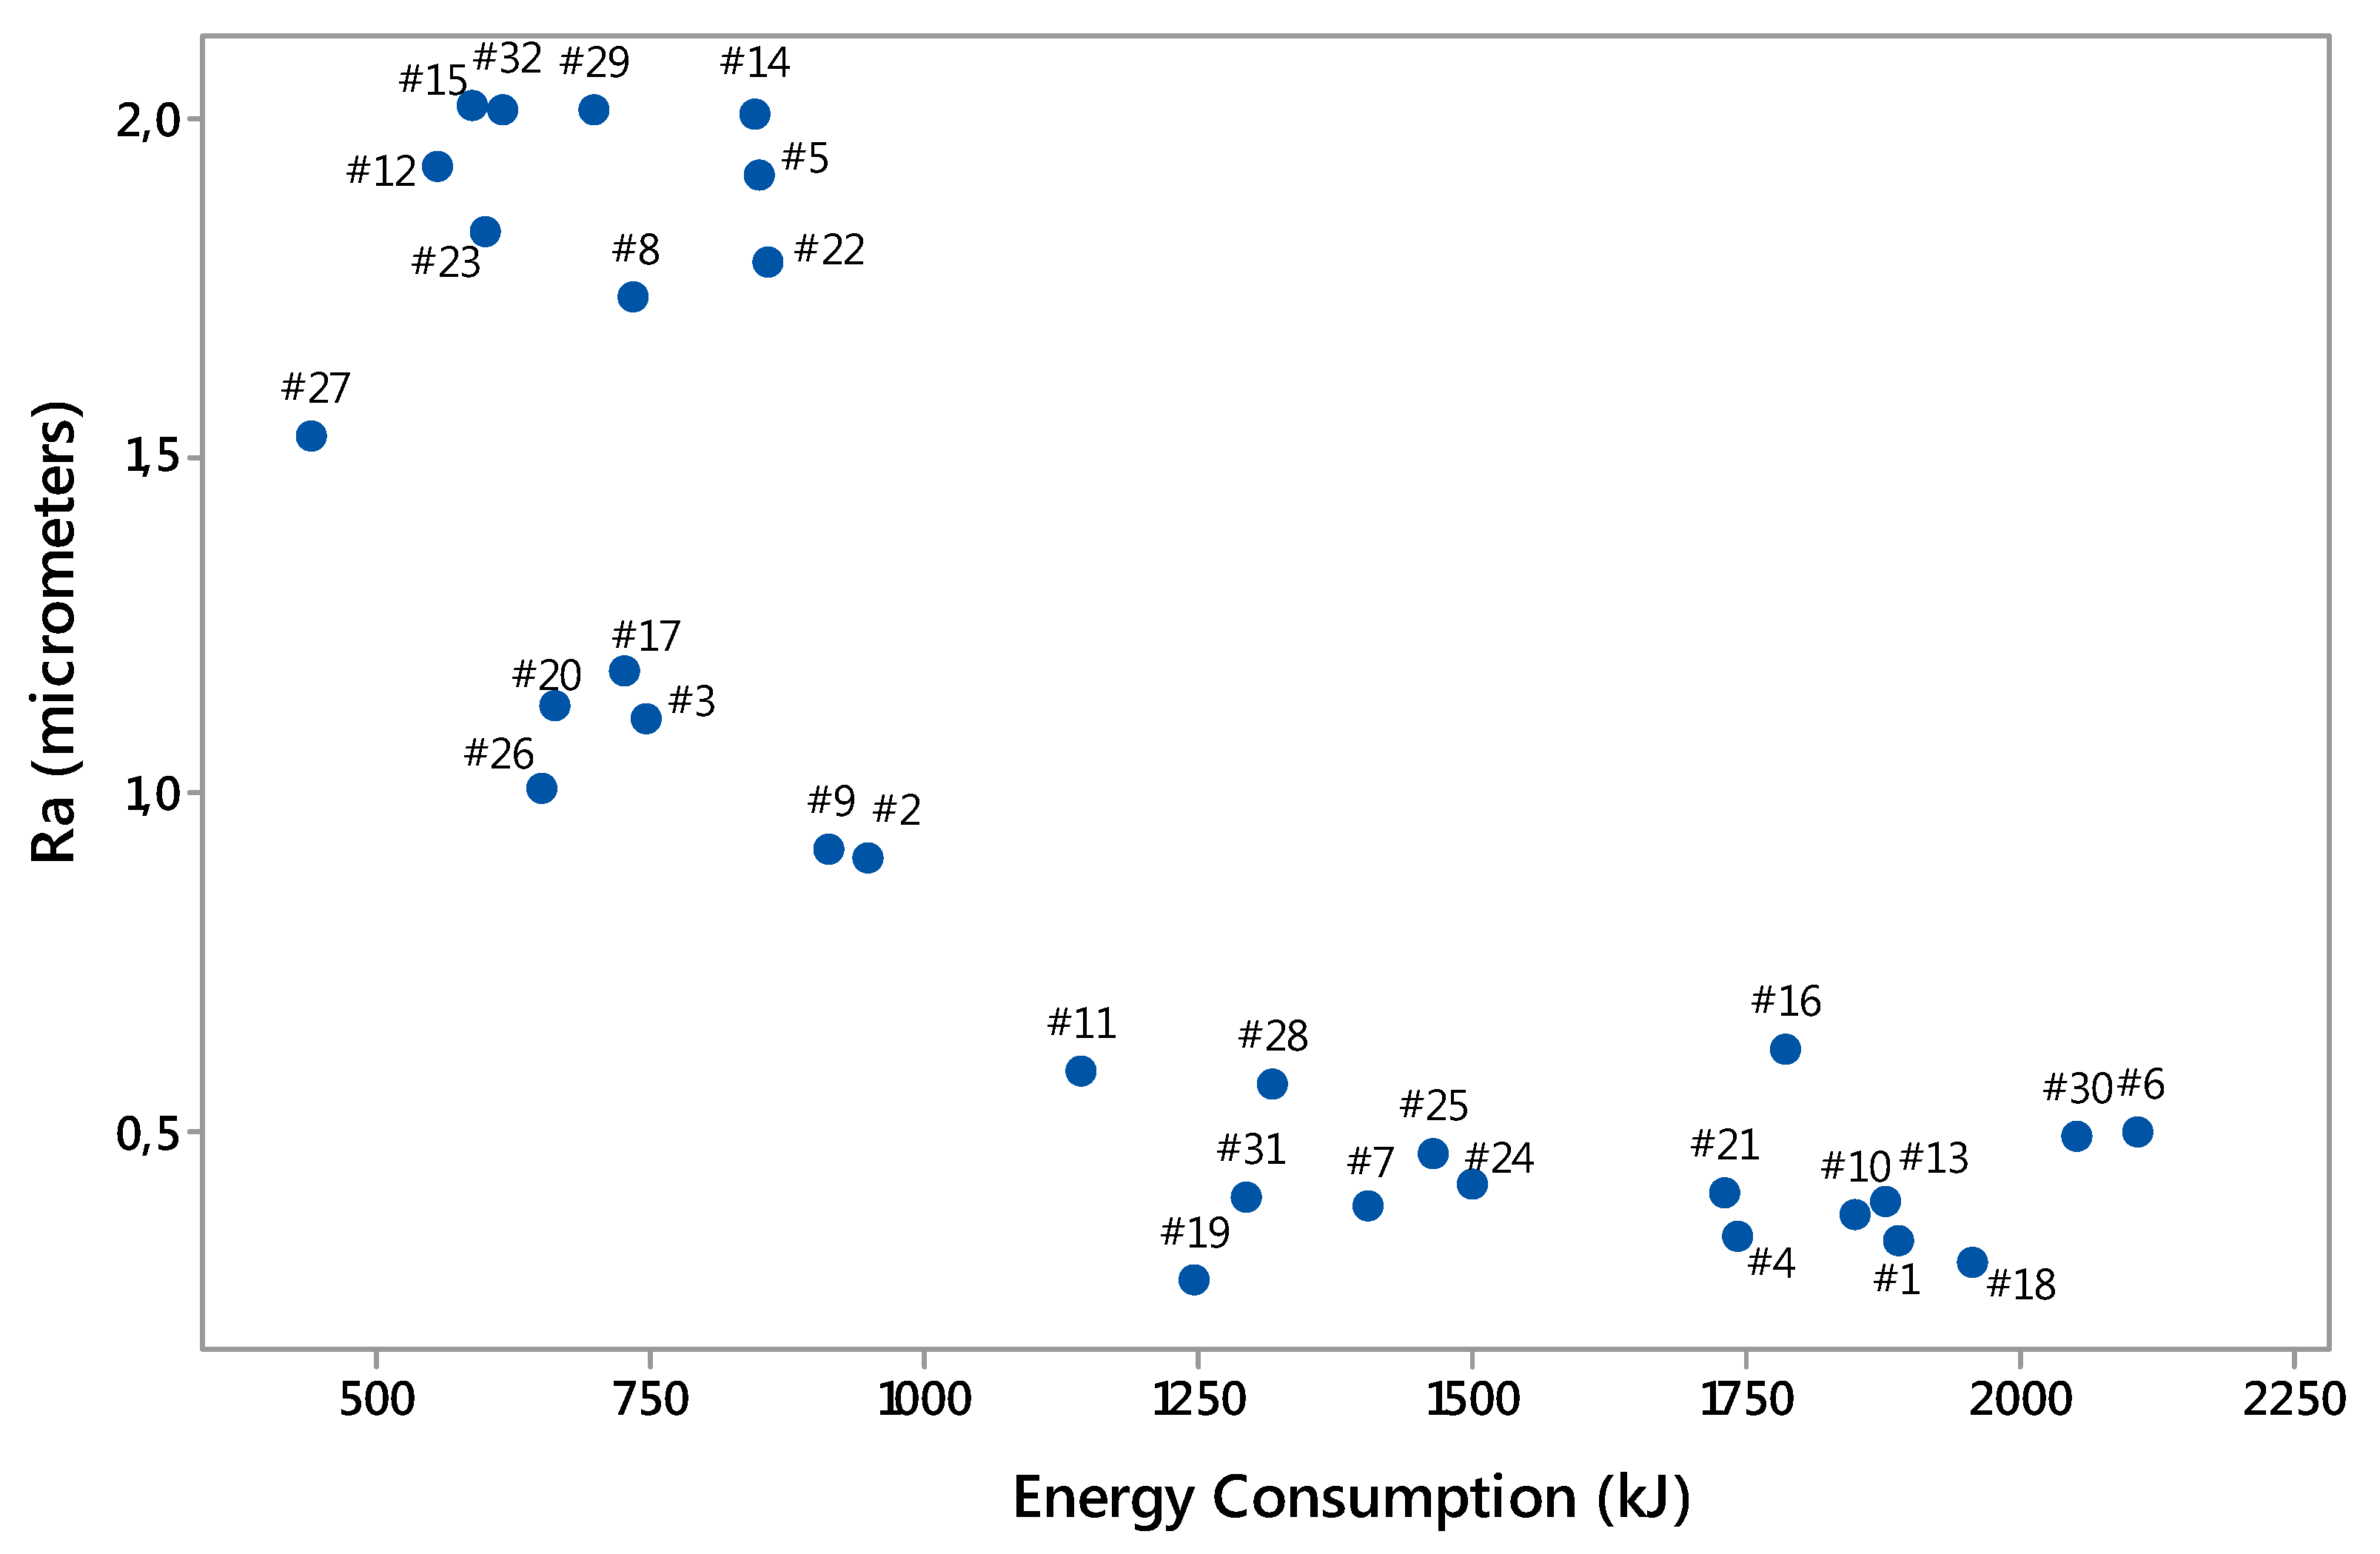
Figure 3.
Electrical energy used in milling in each mold against the surface roughness obtained at the bottom of each one (each point corresponds to one of the tests undertaken in this study).
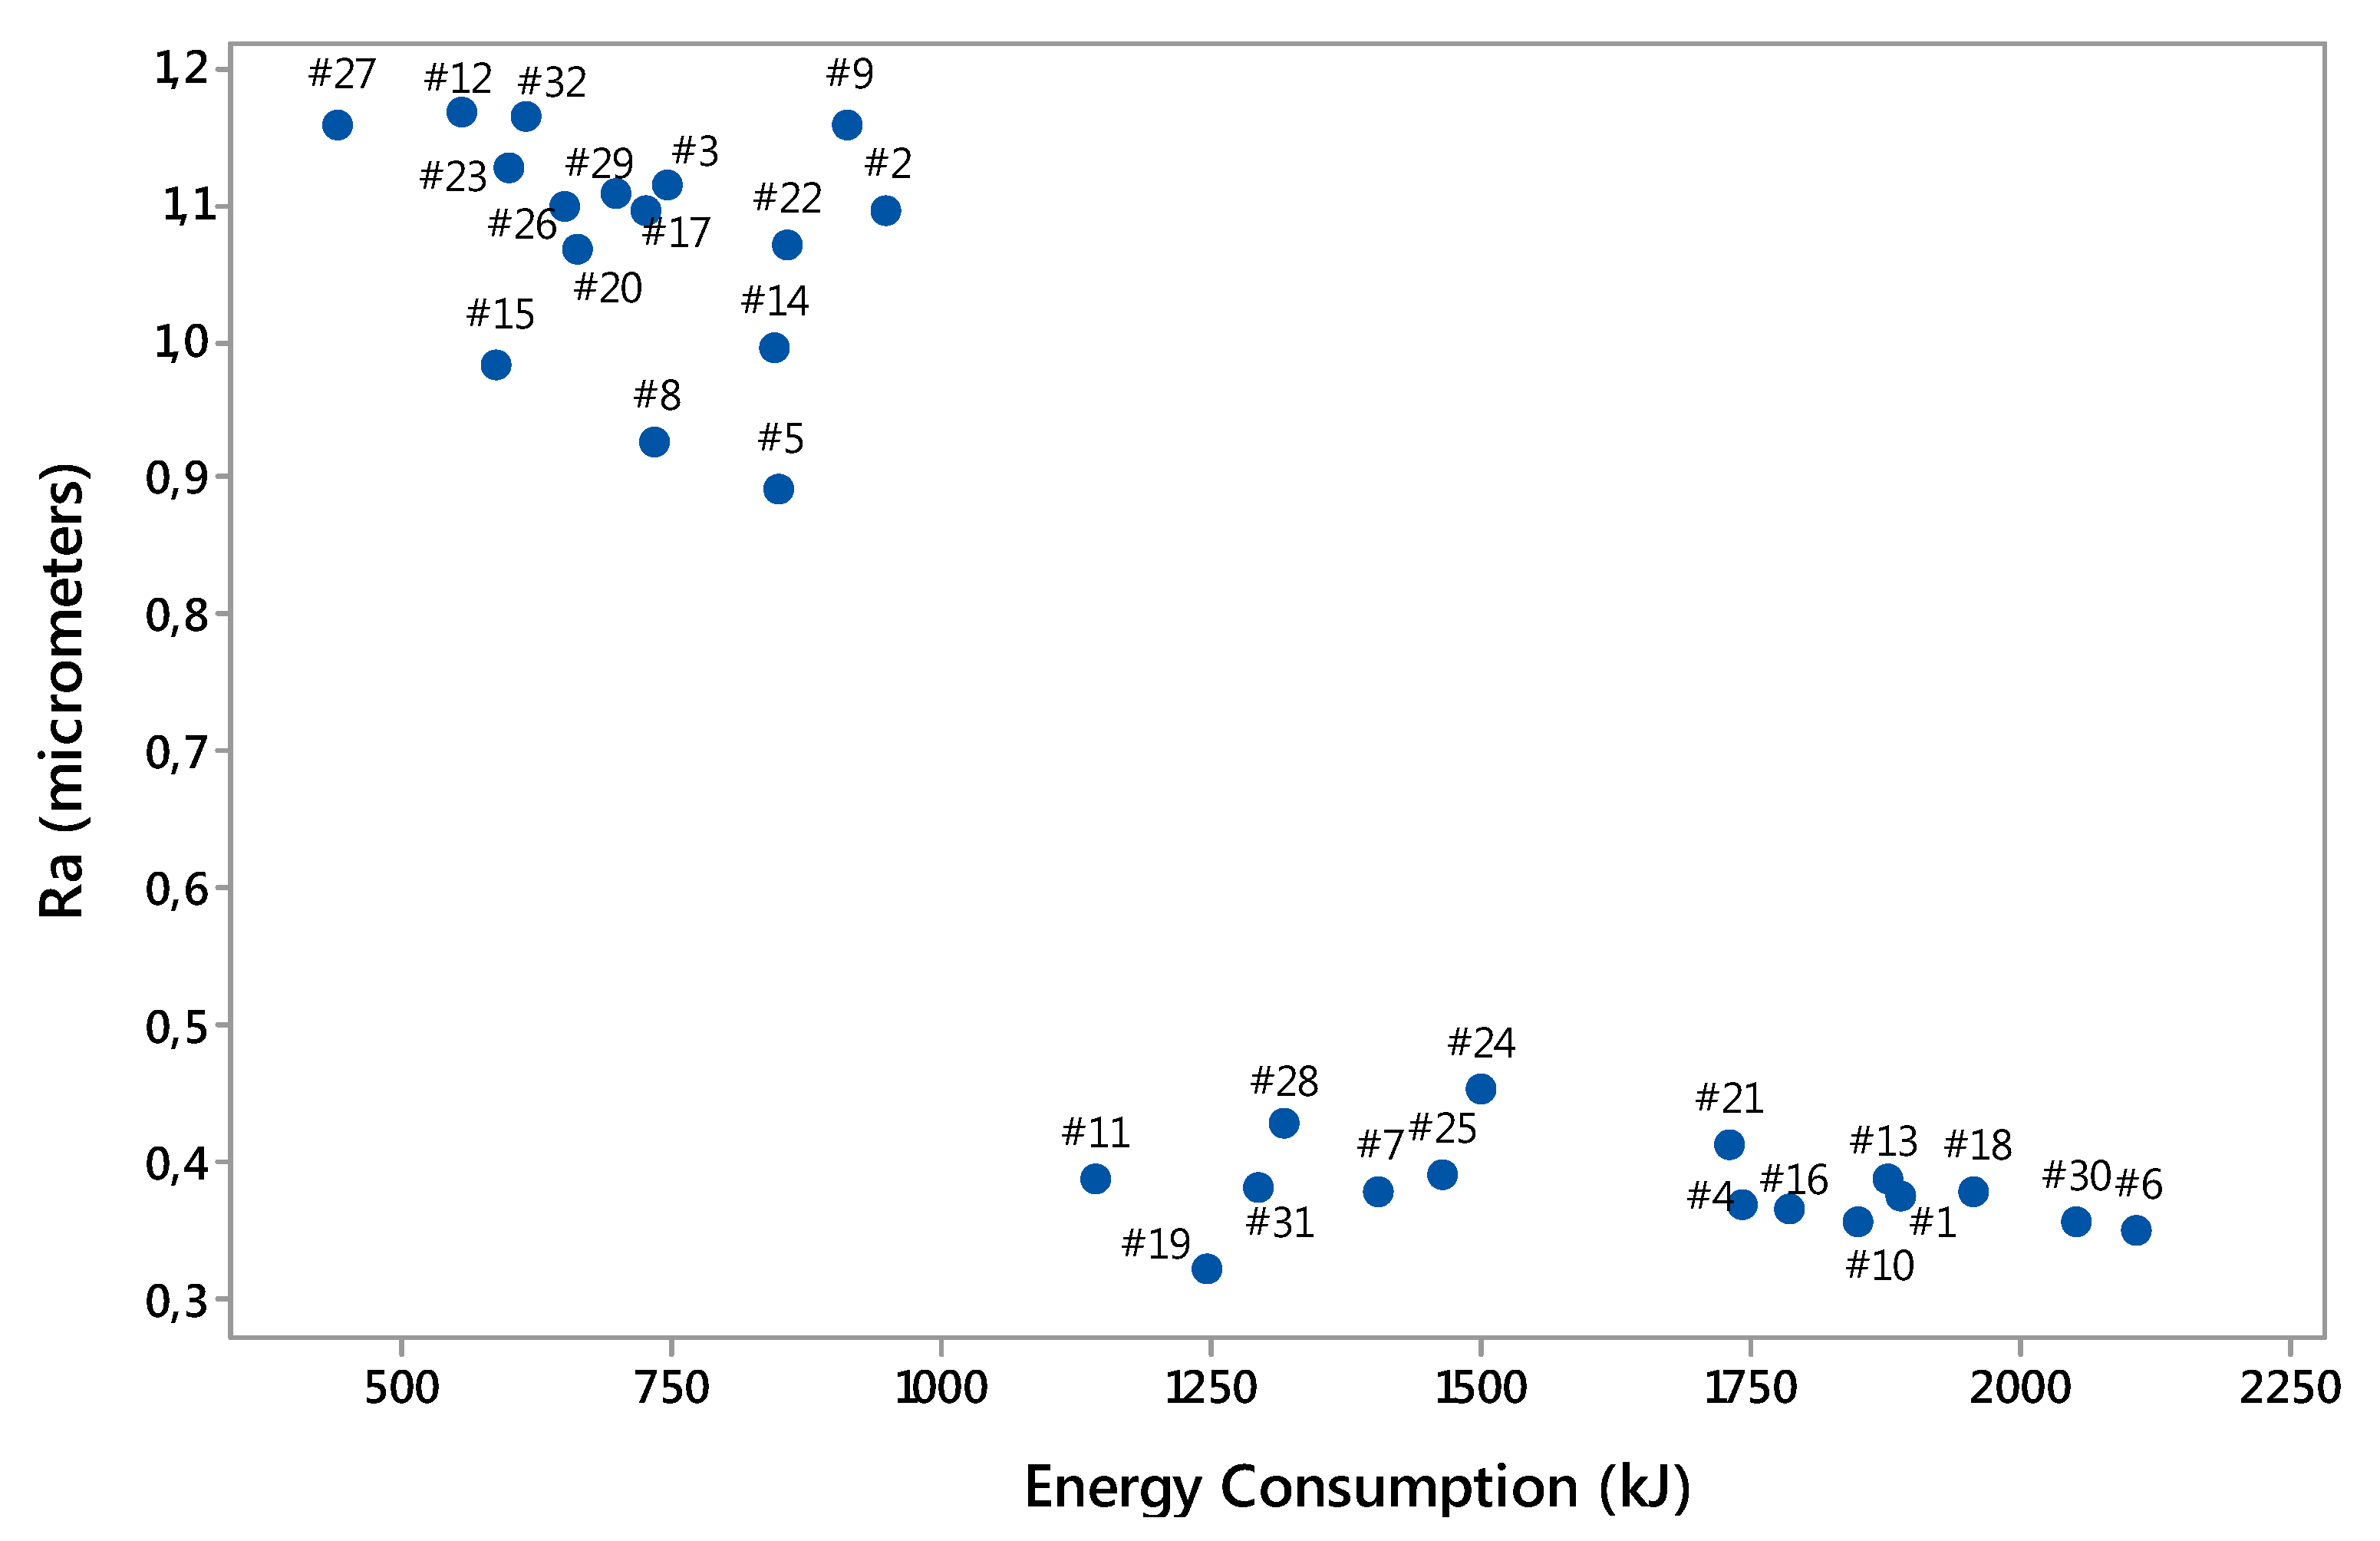
Figure 4.
Electrical energy used in milling in each mold against the surface roughness obtained on the walls of each one (each point corresponds to one of the tests undertaken in this study).
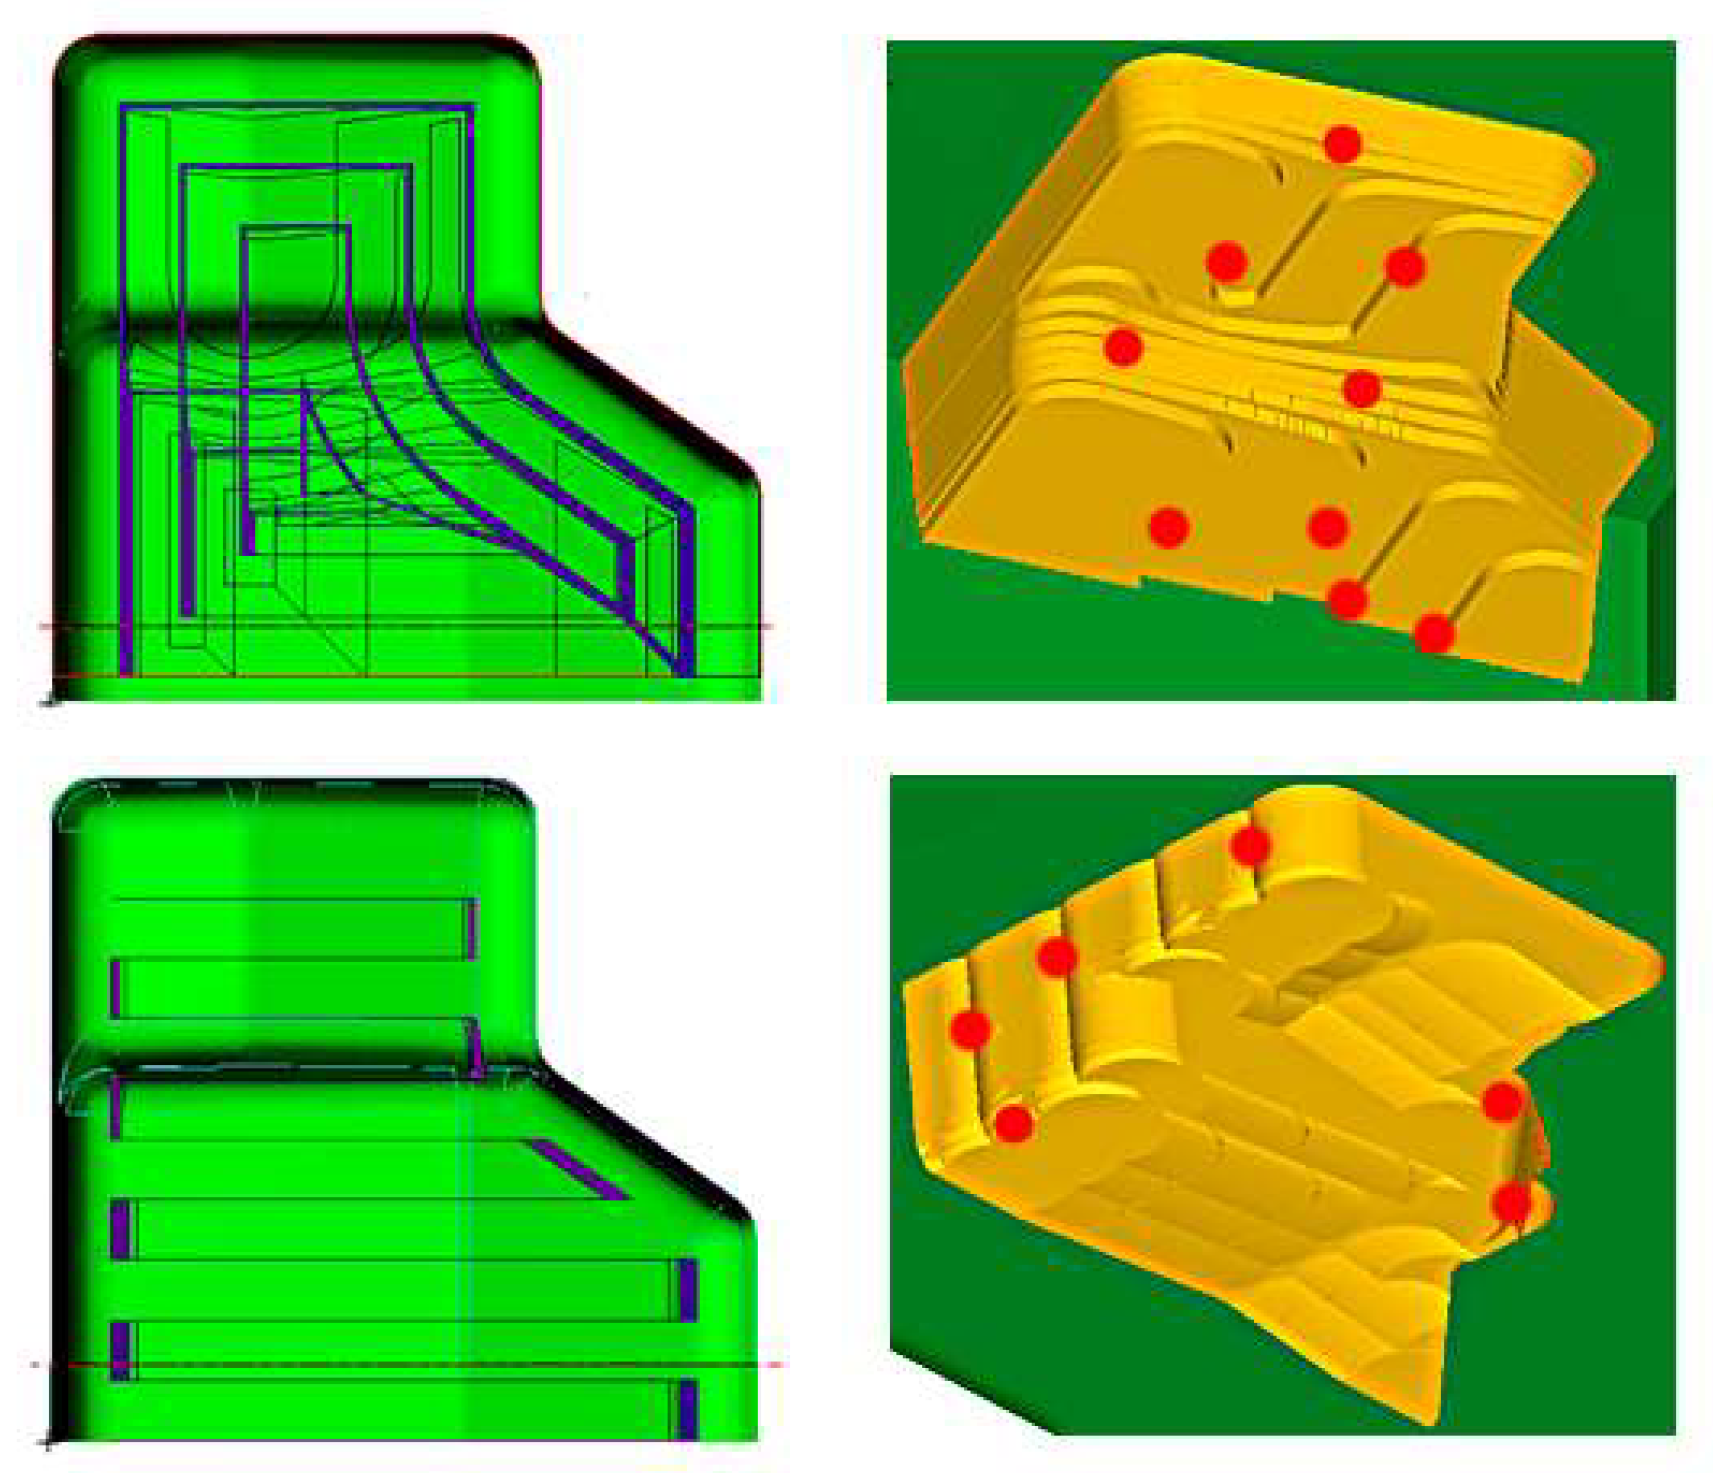
Figure 5.
Scheme of the morphology and points of discontinuity presented in the remaining material after roughing strategies, with contour parallel (up) and zig-zag (down).
Table 1.
Process parameters and levels.
| Roughing | Finishing |
|---|
| Level | Strategy (A) | Axial Depth of Cut, mm (B) | Strategy (C) | Spindle Speed, rpm (D) | Feed Rate, mm/min (E) | Step-over, mm (F) |
|---|
| −1 | Zig-Zag | 1 | Zig-Zag (0°) | 6366 | 764 | 0.1 |
| +1 | Contour-Parallel | 3 | Zig-Zag (45°) | 8000 | 1146 | 0.3 |
Table 2.
Taguchi orthogonal array.
| Roughing | Finishing |
|---|
| No. | (A) | (B) | (C) | (D) | (E) | (F) |
|---|
| 1 | −1 | −1 | −1 | −1 | −1 | −1 |
| 2 | −1 | −1 | −1 | +1 | −1 | +1 |
| 3 | −1 | −1 | −1 | −1 | +1 | +1 |
| 4 | −1 | −1 | −1 | +1 | +1 | −1 |
| 5 | −1 | −1 | +1 | −1 | −1 | +1 |
| 6 | −1 | −1 | +1 | +1 | −1 | −1 |
| 7 | −1 | −1 | +1 | −1 | +1 | −1 |
| 8 | −1 | −1 | +1 | +1 | +1 | +1 |
| 9 | −1 | +1 | −1 | −1 | −1 | +1 |
| 10 | −1 | +1 | −1 | +1 | −1 | −1 |
| 11 | −1 | +1 | −1 | −1 | +1 | −1 |
| 12 | −1 | +1 | −1 | +1 | +1 | +1 |
| 13 | −1 | +1 | +1 | −1 | −1 | −1 |
| 14 | −1 | +1 | +1 | +1 | −1 | +1 |
| 15 | −1 | +1 | +1 | −1 | +1 | +1 |
| 16 | −1 | +1 | +1 | +1 | +1 | −1 |
| 17 | +1 | −1 | −1 | −1 | −1 | +1 |
| 18 | +1 | −1 | −1 | +1 | −1 | −1 |
| 19 | +1 | −1 | −1 | −1 | +1 | −1 |
| 20 | +1 | −1 | −1 | +1 | +1 | +1 |
| 21 | +1 | −1 | +1 | −1 | −1 | −1 |
| 22 | +1 | −1 | +1 | +1 | −1 | +1 |
| 23 | +1 | −1 | +1 | −1 | +1 | +1 |
| 24 | +1 | −1 | +1 | +1 | +1 | −1 |
| 25 | +1 | +1 | −1 | −1 | −1 | −1 |
| 26 | +1 | +1 | −1 | +1 | −1 | +1 |
| 27 | +1 | +1 | −1 | −1 | +1 | +1 |
| 28 | +1 | +1 | −1 | +1 | +1 | −1 |
| 29 | +1 | +1 | +1 | −1 | −1 | +1 |
| 30 | +1 | +1 | +1 | +1 | −1 | −1 |
| 31 | +1 | +1 | +1 | −1 | +1 | −1 |
| 32 | +1 | +1 | +1 | +1 | +1 | +1 |
Table 3.
Parameters and strategies studied in the work using an orthogonal design of experiments.
| Exp. No. | Bottom Ra (μm) | Wall Ra (μm) | Electrical Energy Consumpt. (kJ) | Exp. No. | Bottom Ra (μm) | Wall Ra (μm) | Electrical Energy Consumpt. (kJ) |
|---|
| 1 | 0.375 | 0.340 | 1892.295 | 17 | 1.096 | 1.180 | 726.544 |
| 2 | 1.096 | 0.906 | 952.221 | 18 | 0.378 | 0.302 | 1959.509 |
| 3 | 1.115 | 1.112 | 746.164 | 19 | 0.321 | 0.280 | 1246.159 |
| 4 | 0.367 | 0.342 | 1745.124 | 20 | 1.067 | 1.130 | 665.313 |
| 5 | 0.893 | 1.916 | 852.554 | 21 | 0.411 | 0.410 | 1730.213 |
| 6 | 0.349 | 0.496 | 2108.123 | 22 | 1.071 | 1.792 | 857.676 |
| 7 | 0.378 | 0.386 | 1407.184 | 23 | 1.127 | 1.836 | 599.942 |
| 8 | 0.925 | 1.734 | 736.073 | 24 | 0.453 | 0.420 | 1500.760 |
| 9 | 1.160 | 0.918 | 914.459 | 25 | 0.391 | 0.464 | 1466.522 |
| 10 | 0.356 | 0.378 | 1850.367 | 26 | 1.097 | 1.010 | 651.152 |
| 11 | 0.387 | 0.588 | 1143.106 | 27 | 1.159 | 1.528 | 443.197 |
| 12 | 1.167 | 1.934 | 558.109 | 28 | 0.426 | 0.568 | 1317.950 |
| 13 | 0.387 | 0.392 | 1877.920 | 29 | 1.109 | 2.012 | 698.821 |
| 14 | 0.996 | 2.010 | 846.666 | 30 | 0.356 | 0.492 | 2051.546 |
| 15 | 0.984 | 2.020 | 590.787 | 31 | 0.381 | 0.402 | 1296.372 |
| 16 | 0.363 | 0.618 | 1787.599 | 32 | 1.165 | 2.016 | 618.689 |
Table 4.
Ra response table for surface roughness at the bottom (μm).
| Levels | A | B (mm) | C | D (rpm) | E (mm/min) | F (mm) |
|---|
| −1 | 0.7505 | 0.7139 | 0.7475 | 0.7297 | 0.7201 | 0.3801 |
| +1 | 0.7063 | 0.7429 | 0.7093 | 0.7270 | 0.7366 | 1.0767 |
| Δmax−min | 0.0442 | 0.0290 | 0.0383 | 0.0027 | 0.0165 | 0.6966 |
| Classification | 2 | 4 | 3 | 6 | 5 | 1 |
Table 5.
S/N response table for surface roughness at the bottom.
| Levels | A | B (mm) | C | D (rpm) | E (mm/min) | F (mm) |
|---|
| 1 | 3.6584 | 4.0406 | 3.7795 | 3.9017 | 3.9996 | 8.4293 |
| 2 | 4.1559 | 3.7736 | 4.0348 | 3.9125 | 3.8147 | −0.6150 |
| Δmax−min | 0.4974 | 0.2670 | 0.2553 | 0.0108 | 0.1849 | 9.0443 |
| Classification | 2 | 3 | 4 | 6 | 5 | 1 |
Table 6.
Ra response table for surface roughness at the wall (μm).
| Levels | A | B (mm) | C | D (rpm) | E (mm/min) | F (mm) |
|---|
| −1 | 0.9901 | 0.9114 | 0.8113 | 0.9865 | 0.9386 | 0.4299 |
| +1 | 1.0056 | 1.0844 | 1.1845 | 1.0092 | 1.0571 | 1.5659 |
| Δmax−min | 0.0155 | 0.1730 | 0.3733 | 0.0227 | 0.1185 | 1.1360 |
| Classification | 6 | 3 | 2 | 5 | 4 | 1 |
Table 7.
S/N response table for surface roughness at the wall.
| Levels | A | B (mm) | C | D (rpm) | E (mm/min) | F (mm) |
|---|
| 1 | 2.1013 | 2.9030 | 3.3421 | 2.2105 | 2.5153 | 7.5513 |
| 2 | 1.9234 | 1.1217 | 0.6826 | 1.8142 | 1.5094 | −3.5266 |
| Δmax−min | 0.1778 | 1.7812 | 2.6594 | 0.3963 | 1.0059 | 11.0779 |
| Classification | 6 | 3 | 2 | 5 | 4 | 1 |
Table 8.
Response table for EEC (kJ).
| Levels | A | B (mm) | C | D (rpm) | E (mm/min) | F (mm) |
|---|
| −1 | 1114.4 | 1232.9 | 1142.4 | 1102.0 | 1339.8 | 1648.8 |
| +1 | 1250.5 | 1132.1 | 1222.6 | 1262.9 | 1025.2 | 716.1 |
| Δmax−min | 136.1 | 100.8 | 80.2 | 160.9 | 314.6 | 932.6 |
| Classification | 4 | 5 | 6 | 3 | 2 | 1 |
Table 9.
S/N response table for EEC.
| Levels | A | B (mm) | C | D (rpm) | E (mm/min) | F (mm) |
|---|
| 1 | −60.01 | −61.05 | −60.28 | −60.05 | −61.75 | −64.19 |
| 2 | −61.12 | −60.08 | −60.85 | −61.08 | −59.38 | −56.94 |
| Δmax−min | 1.12 | 0.97 | 0.57 | 1.04 | 2.37 | 7.26 |
| Classification | 3 | 5 | 6 | 4 | 2 | 1 |
Table 10.
ANOVA results for surface roughness at the bottom of the mold.
| Source of Variation | Degree of Freedom | Sum of Squares | F Ratio | p Value |
|---|
| A | 1 | 0.01561 | 4.54 | 0.043 |
| B | 1 | 0.00673 | 1.96 | 0.174 |
| C | 1 | 0.01170 | 3.41 | 0.077 |
| D | 1 | 0.00006 | 0.02 | 0.899 |
| E | 1 | 0.00218 | 0.63 | 0.434 |
| F | 1 | 3.88183 | 1129.33 | 0.000 |
| Error | 25 | 0.08593 | - | - |
| Total | 31 | 4.00403 | - | - |
Table 11.
ANOVA results for surface roughness at walls.
| Source of Variation | Degree of Freedom | Sum of Squares | F Ratio | p Value |
|---|
| A | 1 | 0.0019 | 0.03 | 0.864 |
| B | 1 | 0.2394 | 3.73 | 0.065 |
| C | 1 | 1.1145 | 17.37 | 0.000 |
| D | 1 | 0.0041 | 0.06 | 0.802 |
| E | 1 | 0.1123 | 1.75 | 0.198 |
| F | 1 | 10.3240 | 160.86 | 0.000 |
| Error | 25 | 1.6045 | - | - |
| Total | 31 | 13.4009 | - | - |
Table 12.
ANOVA results for EEC.
| Source of Variation | Degree of Freedom | Sum of Squares | F Ratio | p Value |
|---|
| A | 1 | 148,292 | 8.43 | 0.008 |
| B | 1 | 81,264 | 4.62 | 0.041 |
| C | 1 | 51,419 | 2.92 | 0.100 |
| D | 1 | 207,149 | 11.78 | 0.002 |
| E | 1 | 791,929 | 45.02 | 0.000 |
| F | 1 | 6,958,669 | 395.62 | 0.000 |
| Error | 25 | 439,727 | - | - |
| Total | 31 | - | - | - |
© 2018 by the authors. Licensee MDPI, Basel, Switzerland. This article is an open access article distributed under the terms and conditions of the Creative Commons Attribution (CC BY) license (http://creativecommons.org/licenses/by/4.0/).

 ,
, 


