Prediction Model of Iron Ore Pellet Ambient Strength and Sensitivity Analysis on the Influence Factors


1
School of Metallurgy, Northeastern University, Shenyang 110819, China
2
School of Metallurgical Engineering, Anhui University of Technology, Ma’anshan 243002, China
*
Authors to whom correspondence should be addressed.
Metals 2018, 8(8), 593; https://doi.org/10.3390/met8080593
Submission received: 2 July 2018
/
Revised: 23 July 2018
/
Accepted: 25 July 2018
/
Published: 30 July 2018
(This article belongs to the Special Issue Ironmaking and Steelmaking)
Abstract
:The Ambient Compressive Strength (CS) of pellets, influenced by several factors, is regarded as a criterion to assess pellets during metallurgical processes. A prediction model based on Artificial Neural Network (ANN) was proposed in order to provide a reliable and economic control strategy for CS in pellet production and to forecast and control pellet CS. The dimensionality of 19 influence factors of CS was considered and reduced by Principal Component Analysis (PCA). The PCA variables were then used as the input variables for the Back Propagation (BP) neural network, which was upgraded by Genetic Algorithm (GA), with CS as the output variable. After training and testing with production data, the PCA-GA-BP neural network was established. Additionally, the sensitivity analysis of input variables was calculated to obtain a detailed influence on pellet CS. It has been found that prediction accuracy of the PCA-GA-BP network mentioned here is 96.4%, indicating that the ANN network is effective to predict CS in the pelletizing process.
1. Introduction
Iron-bearing materials should enable the reliable production of hot metal (HM) from a blast furnace (BF) or directly reduced iron (DRI) from a shaft furnace [1], particularly at minimum cost and at a large scale. Pellets are roughly spherical, thermally and/or chemically bonded agglomerates with 10 to 16 mm in diameter. They have several preferred metallurgical properties [2]. For instance, the particle size of a pellet is relatively uniform, which is favorable for burden permeability in the BF process; the pellet iron-grade is higher, favorable for effective iron content input in burden column and enhancing production efficiency; the reduction of pellet is easy, favorable for increasing gas utilization rate of a BF/shaft furnace, etc. Therefore, the consumption of pellets in BF is gradually increasing in many ironmaking plants—20% in China and even 100% in some BFs in Europe and North America.
At present, the pellet induration processes can be carried out by a straight grate indurating machine or grate-rotary kiln [3]. However, no matter which induration facility is used, the production process of iron ore pellets can be summarized as the following four stages: agglomeration of green pellets, drying of green pellets, firing of green pellets obtaining fired pellets, and cooling of fired pellets. Generally, in the BF or shaft furnace process, the pellets undertake double forces containing the extrusion force from the top layer and the friction force by high-speed gas flow beneath the furnace [4]. Consequently, the compressive strength (CS) of fired pellets is often referred to as a principal metallurgical property that helps withstand these two forces. A lower pellet CS may lead to pellet disintegration in the BF process, negatively affecting the permeability of the burden column. Obviously, pellets with higher strength can decrease fines and dust generation, and this in turn helps increase the productivity of the ironmaking unit. The CS standard [5] in China rules that CS should be higher than 2200 N/pellet for the BF process and higher than 2500 N/pellet for a gas-based shaft furnace process.
Previous papers have identified several factors in the pelletizing process that affect pellet CS [6]; they include particle size of ore, bentonite dosage, moisture of green pellet, basicity (CaO/SiO2), and firing temperature, among others. It is a challenge to comprehensively control CS in pelletizing production. Furthermore, the pelletizing process is a complex physical and chemical process [7] including mass transfer, heat transfer, gas-solid reaction, and crystalline grain change. It is therefore difficult to simulate the whole process of pellet induration. Batterham [8] attempted to predict the strength using shrinking models and thereby deriving the shrinkage-to-strength relationship, but the universality of the model is limited due to various operation conditions in different ironmaking plants. No single cogent metallurgical theory is available to numerically describe the development of CS, and few models can directly work out the effect of critical operational parameters on CS. ANN [9], as an attractive technique, is available to capture complex and non-linear relationships between the input and output in the complex industry system. The ANN model, via enough learning and training, are computationally efficient and no prior domain knowledge is required for the process to be modeled [9]. The BP network is one of the most widely used ANN. It is a multilayer feed forward network, trained by error inverse propagation. It includes an input layer, a hidden layer, and an output layer [10]. Several successful examples have been reported in metallurgical modeling processes using the BP network. For example, Stanford University Neural Network Corporation and North Star Steel Corporation cooperatively developed an intelligent electric arc furnace [11]. The BP network was adopted to predict the temperature distribution of BF top gas at Kobe steel, Japan [12]. Similarly, the BF heat mode and hot air volume mode were carried out based on BP neural network at Kawasaki Steel, Japan [13]. However, with progress of ANN technology, two obvious drawbacks of the BP model were found [14]. The first one is that the BP network appears to converge slowly and with difficultly, as the input variables are too many or some of them are actually correlative. The second is that the weights and thresholds of the BP network may stay at local optima in the training process, which may also limit the convergence of the network. Thus, in order to make the BP model accurate and stable, some necessary measures should be carried out to achieve dimensionality reduction of correlative variables and avoid local optima in the training process.
PCA [15,16] is a method that can be used to reduce the dimensionality of input samples. The new PCA samples after dimensionality reduction are uncorrelated. There is no double that the PCA is available to solve the challenge of the first drawback of the BP network mentioned above. Furthermore, Genetic algorithm (GA) [17] belongs to a class of heuristic methods known collectively as evolutionary computation. It depends on the concept of evolving a more optimal solution to a problem through the repeated application of selection, crossover, and mutation operation. GA shares the ability to escape from local optima by moving through valleys of lower fitness in the search space. Obviously, GA can be utilized to optimize the initial weights in the BP network and escape the local optima in the training process.
In the present work, a prediction model based on the ANN was developed to predict pellets’ CS. Firstly, the PCA was applied to fulfill dimensionality reduction of correlative variables. Secondly, the new PCA variables were used as the input variables for the BP network, which was upgraded by the GA; after training and testing with production data in a typical ironmaking plants of China, the PCA-GA-BP neural network was built. Finally, the prediction accuracy of the PCA-GA-BP network mentioned here was investigated. Moreover, sensitivity analysis was carried out to identify the critical factors that affect CS. The target of this work is to provide a reliable CS control strategy in the pelletizing process.
2. Materials and Methods
2.1. Pelletizing Process
The pelletizing process of iron ore is a consolidation method to obtain high-strength pellet; this includes granulation of the mixed materials (such as iron ore, bentonite and flux), drying of green pellet, firing of green pellet with combustion of fuel in burden bed, and cooling. The schematic diagram of the pelletizing process is shown in Figure 1.
The pellet is indurated with high CS, which is detected according to the standard ISO4700 [5]. The general method is this: 64 selected pellets with diameter of 10–12.5 mm are tested in a compressive tester, and the two maximum values and two minimum values are deleted; the average of the remaining 60 values is regarded as the final pellet CS. Several factors in a pelletizing unit can substantially affect CS. Therefore, the prediction of CS should highly consider influencing factors. Based on previous practical experience at the typical ironmaking plants of China, 19 factors were selected as the initial input variables, including particle size of ore, bentonite dosage, moisture of green pellet, CS of green pellet, dropping strength, pellet diameter, porosity of green pellet, FeO%, MgO%, CaO%, Al2O3%, basicity (CaO/SiO2), burst temperature of green pellet, CS of drying pellet, bed depth of burden, firing temperature, firing time, gas consumption, and charging rate. The annual averages (the typical ironmaking plants) of the input variables are listed in Table 1.
2.2. Principal Component Analysis
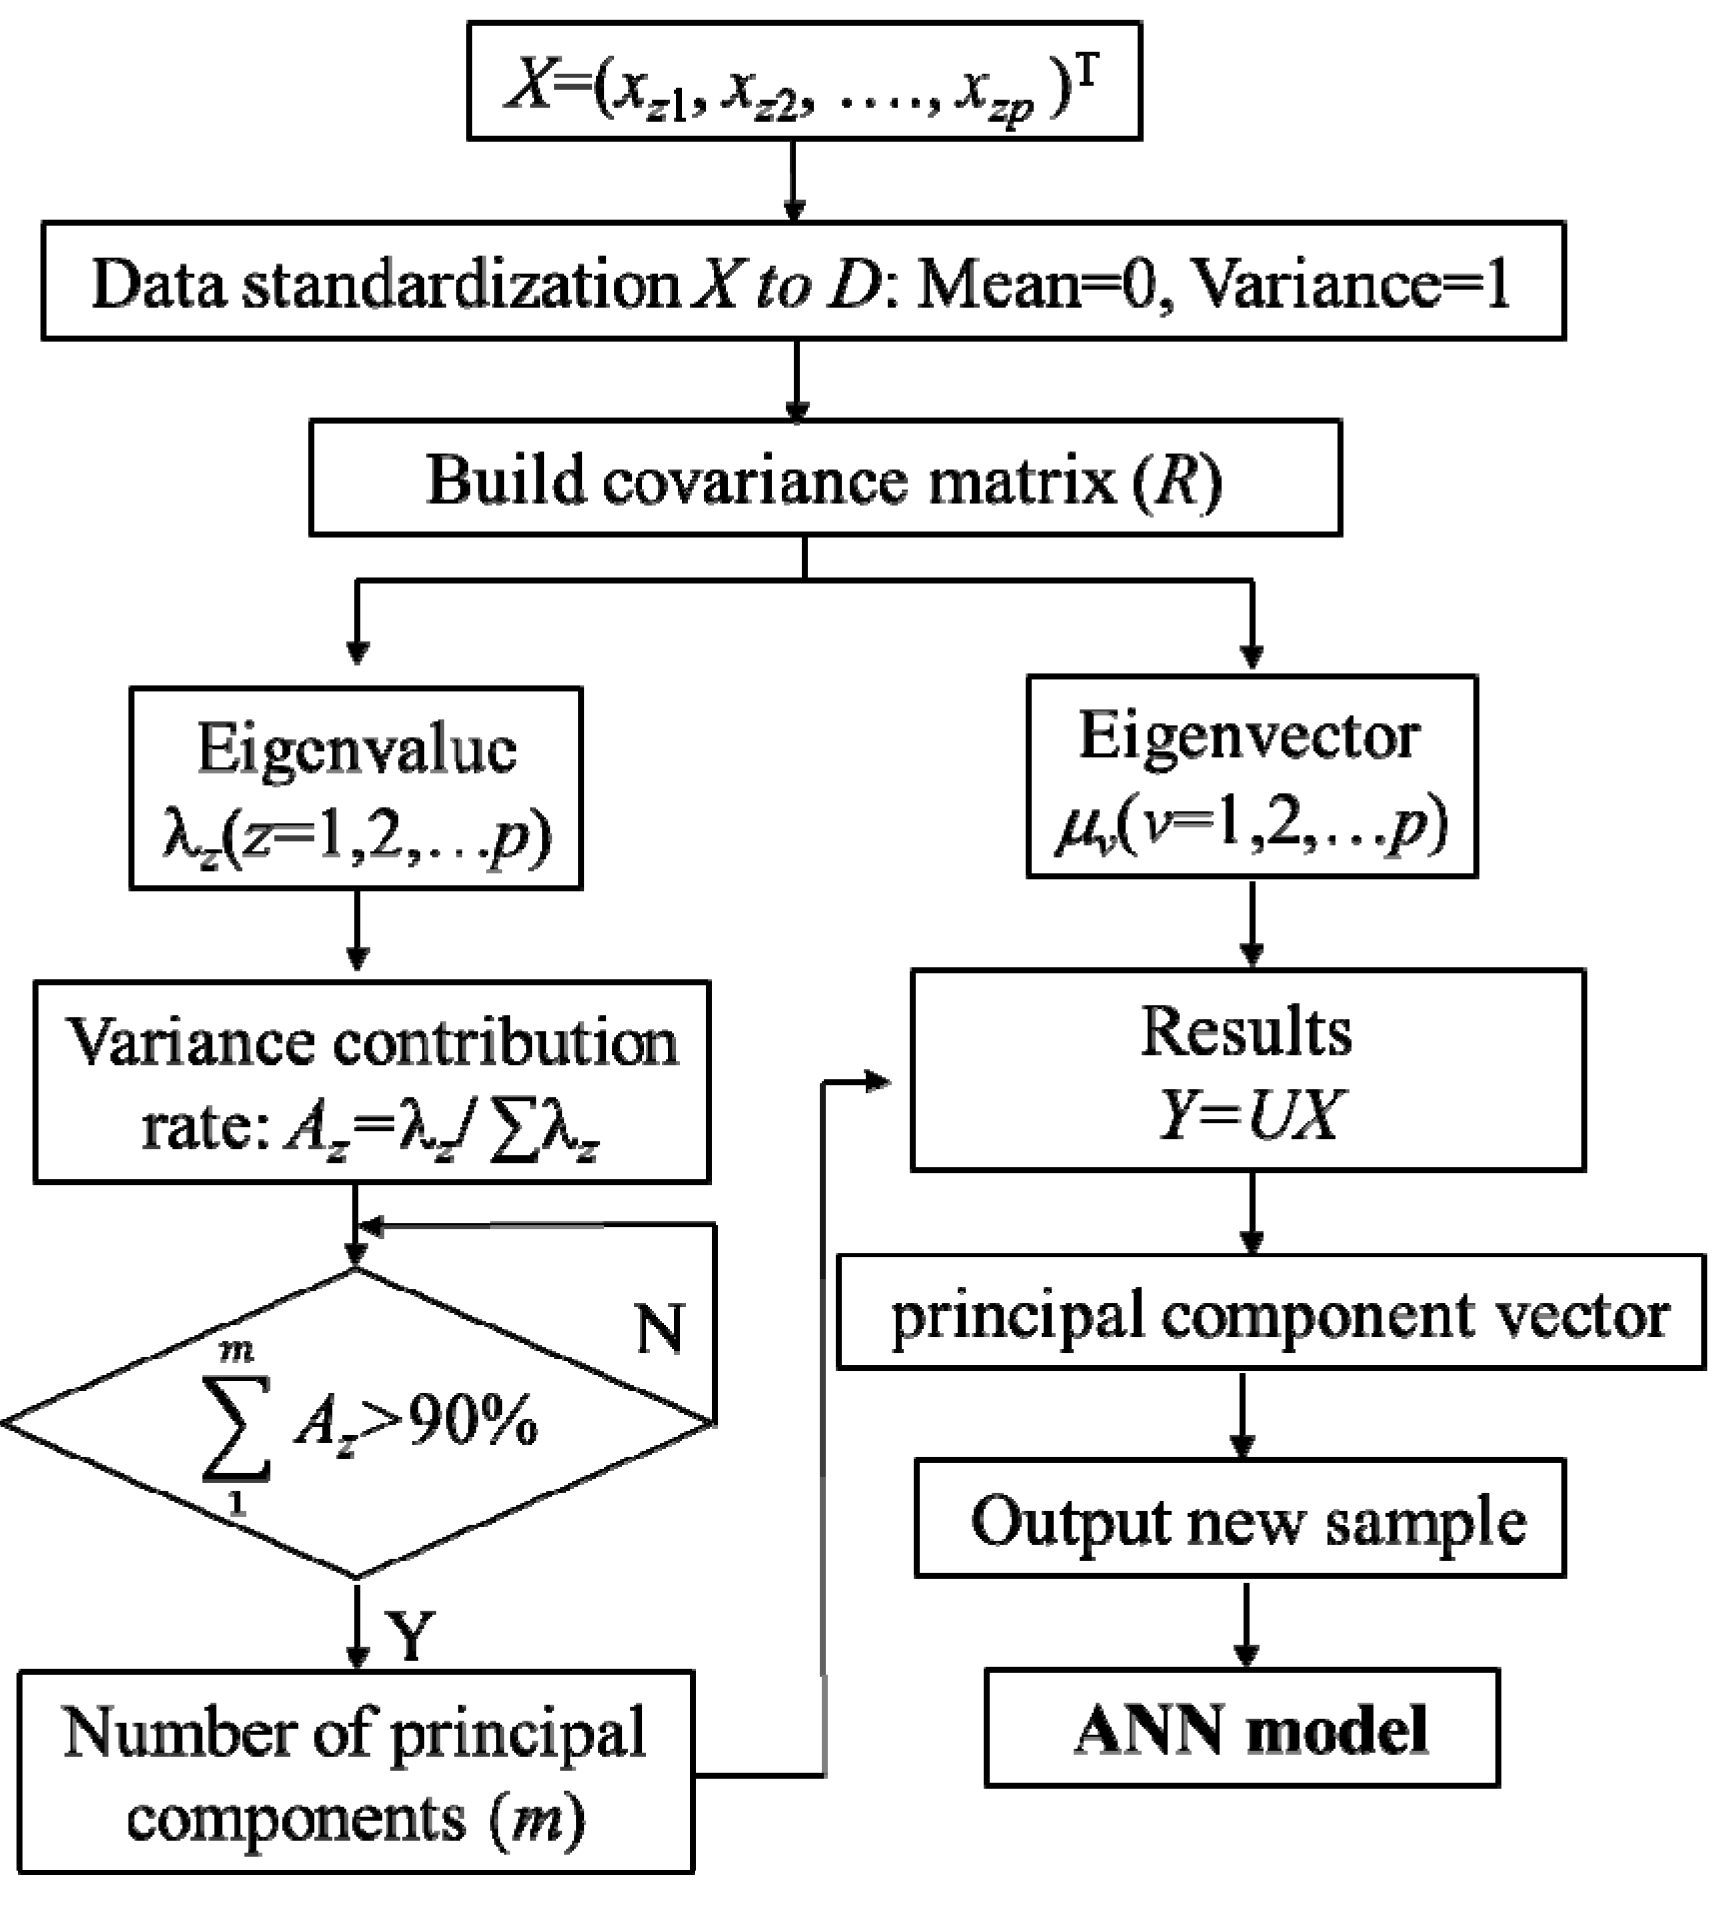
The PCA is a method [16] used to achieve dimensionality reduction of initial variables (19 variables mentioned in Table 1). The new non-linear PCA variables can be brought out to substitute the initial variables. The PCA operation creates linear combinations of initial input variables, so all the input information is retained in the new variables. In order to achieve the dimensionality reduction, only a subset of new variables is chosen as the PCA variables, so there is a loss of initial variables. It is worthwhile mentioning that the lost information is very limited and thus will not affect the accuracy of the following results due to the fact that the cumulative contribution rate of the PCA variables is required to be more than 90%. In summary, the merit of the PCA is that the information, expressed by initial variables, will be retained in the new PCA variables as much as possible. It is acknowledged that copious factors could affect CS, and part of them are correlative, such as firing temperature match with fuel gas consumption, and basicity match with CaO%. Overabundant initial variables without PCA operation will make the model more complex and decrease prediction accuracy. In the present work, the new independent PCA variables based on the PCA operation were finalized as the input variables in the BP model. The flow chart of PCA operation is shown in Figure 2.
(1) The sample matrix is collected as shown in Equation (1):
where X is the sample matrix, n is number of samples, z = 1, 2, …, n, 300 days production date were used in present work, n = 300, p is the number of initial variables, p = 19.
(2) Date standardization of initial variable matrix (X) to normalization matrix (D) as shown in Equation (2):
where , .
(3) Obtain the correlation coefficient matrix (R) based normalization matrix using Equation (3):
(4) Obtain the eigenvalue (λz) and the eigenvector (μv) based on the characteristic equation of R in Equation (4):
(5) Obtain the contribution rate , and cumulative contribution rate . As the cumulative contribution rate:
The m is obtained based on the cumulative contribution rate. In addition, m is the new variable number after dimensionality reduction.
(6) Output the new sample matrix after PCA in Equation (6):
where U is the eigenvector matrix comprised m eigenvectors.
Y = UX
2.3. Artificial Neural Network
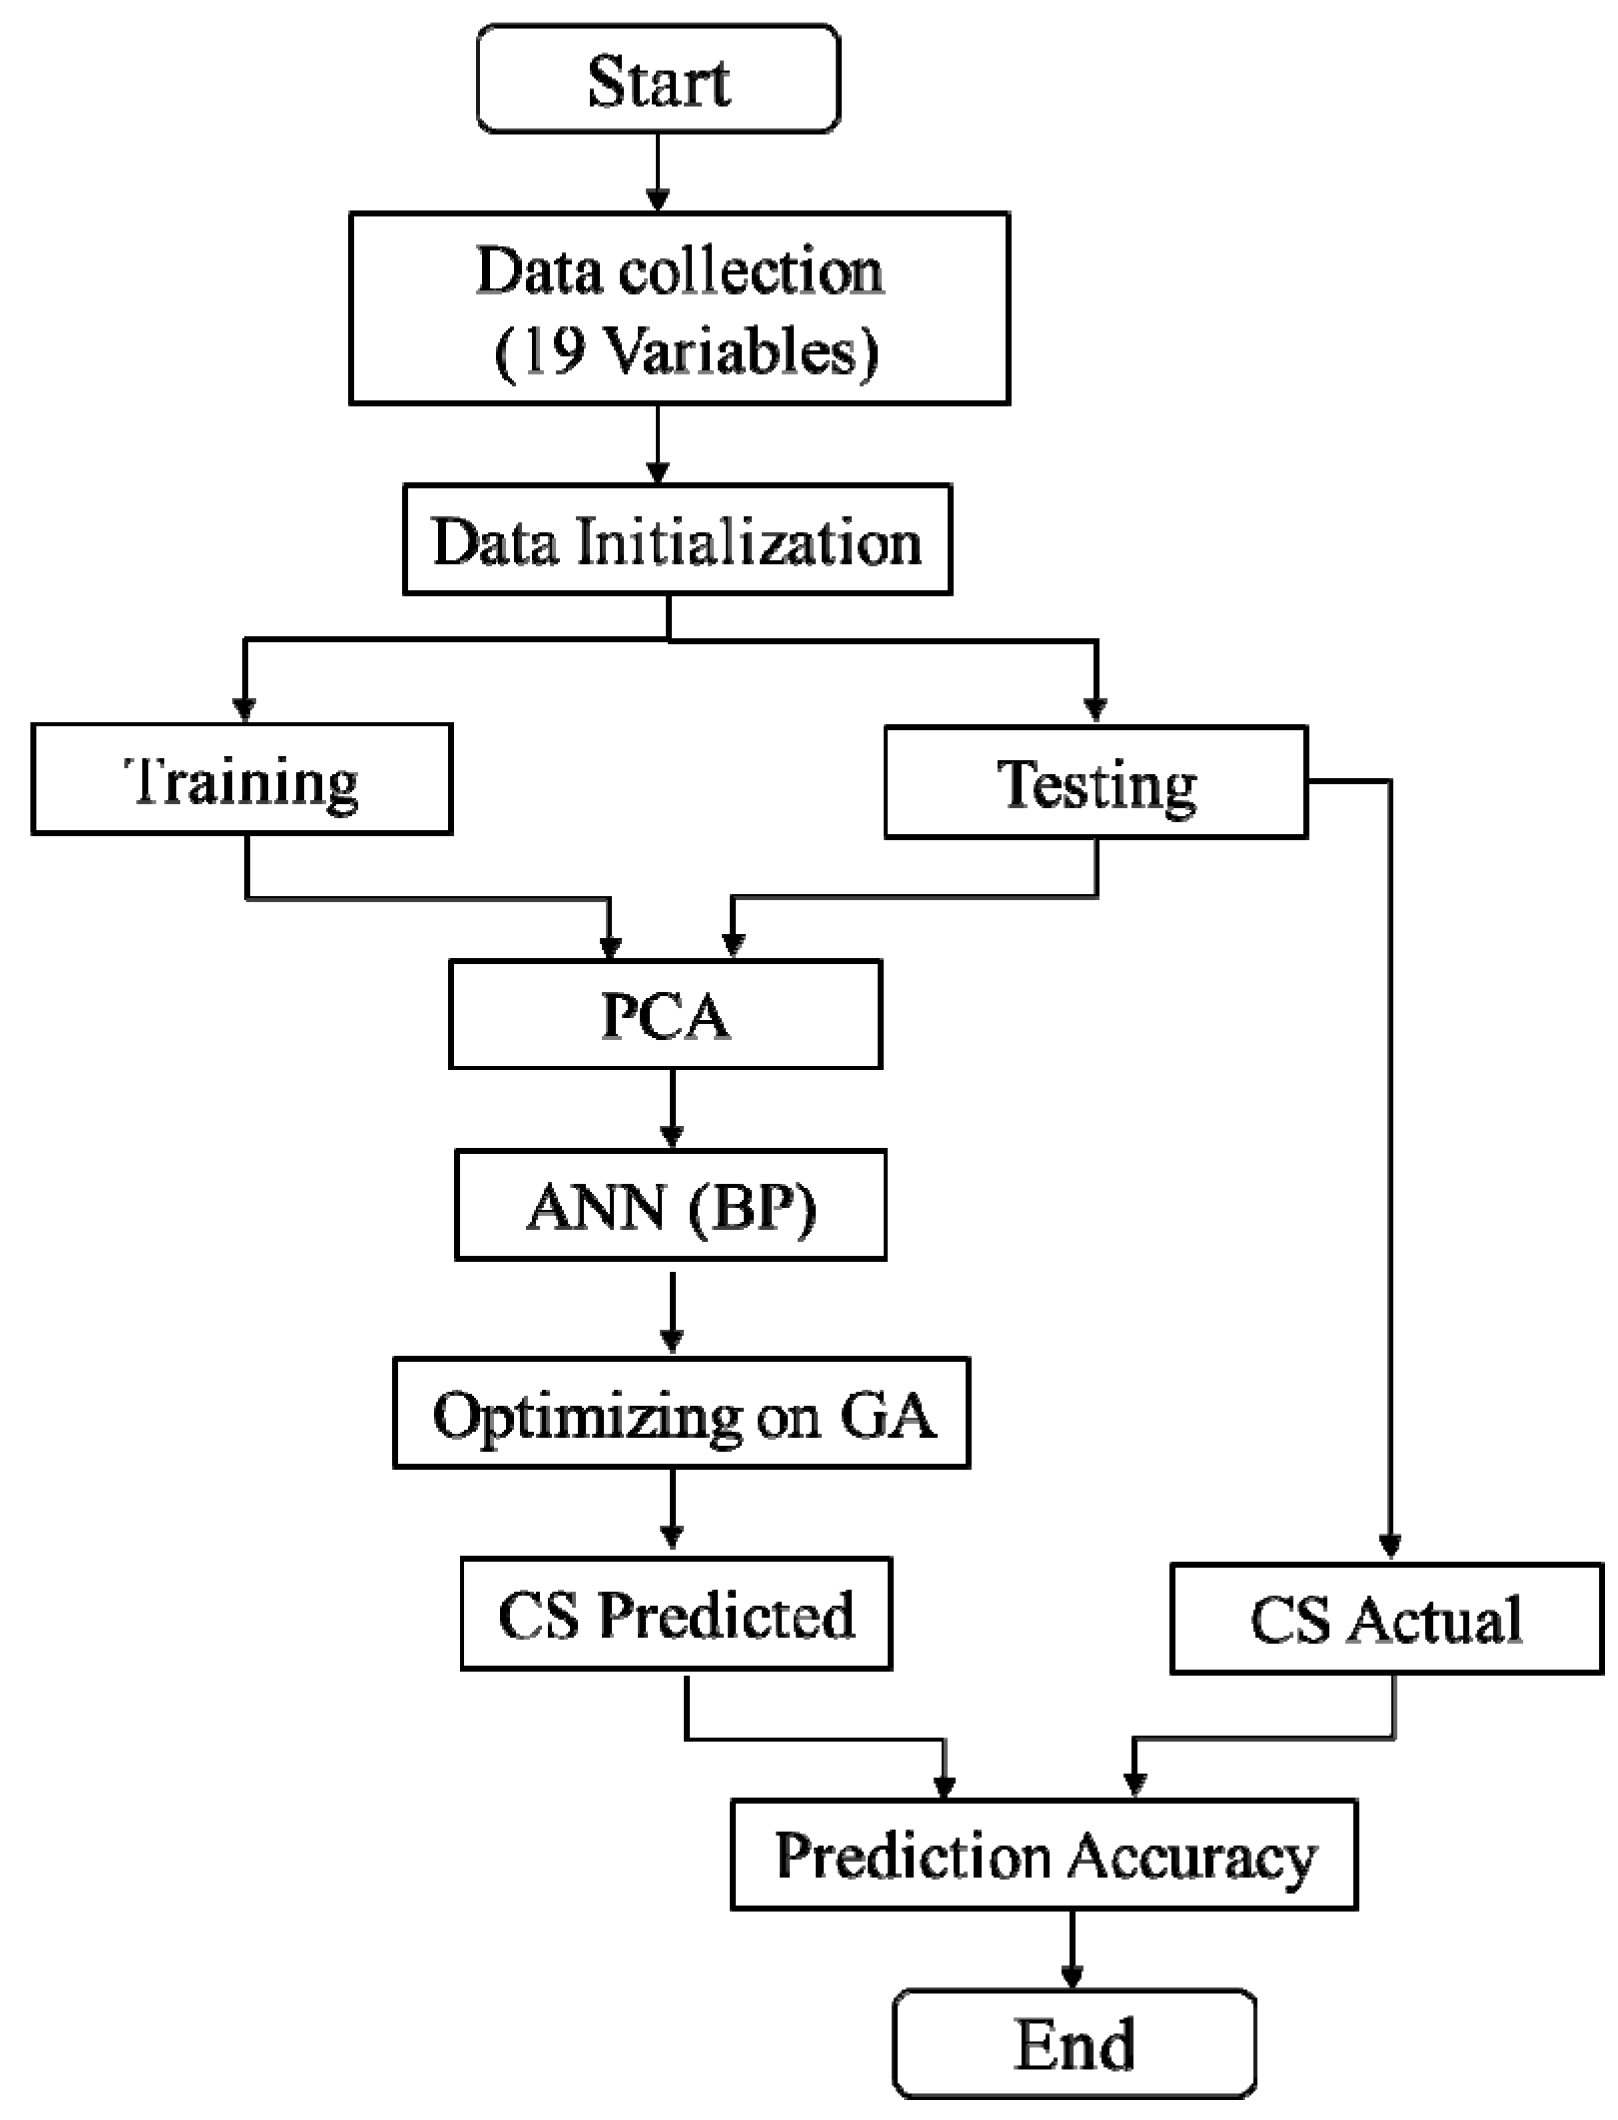
The new m variables obtained from the PCA were utilized as the input variables in the BP model. The BP network has a merit that the information feeds forward and the error is inverse propagation [18]. In order to make the model accurate and stable, the GA was adopted to optimize the initial weights and thresholds in the BP network. The flow chart of the ANN model is shown in Figure 3. Three operations were adopted consisting of PCA, GA, and BP.
2.3.1. Information Forward Propagation of BP Network
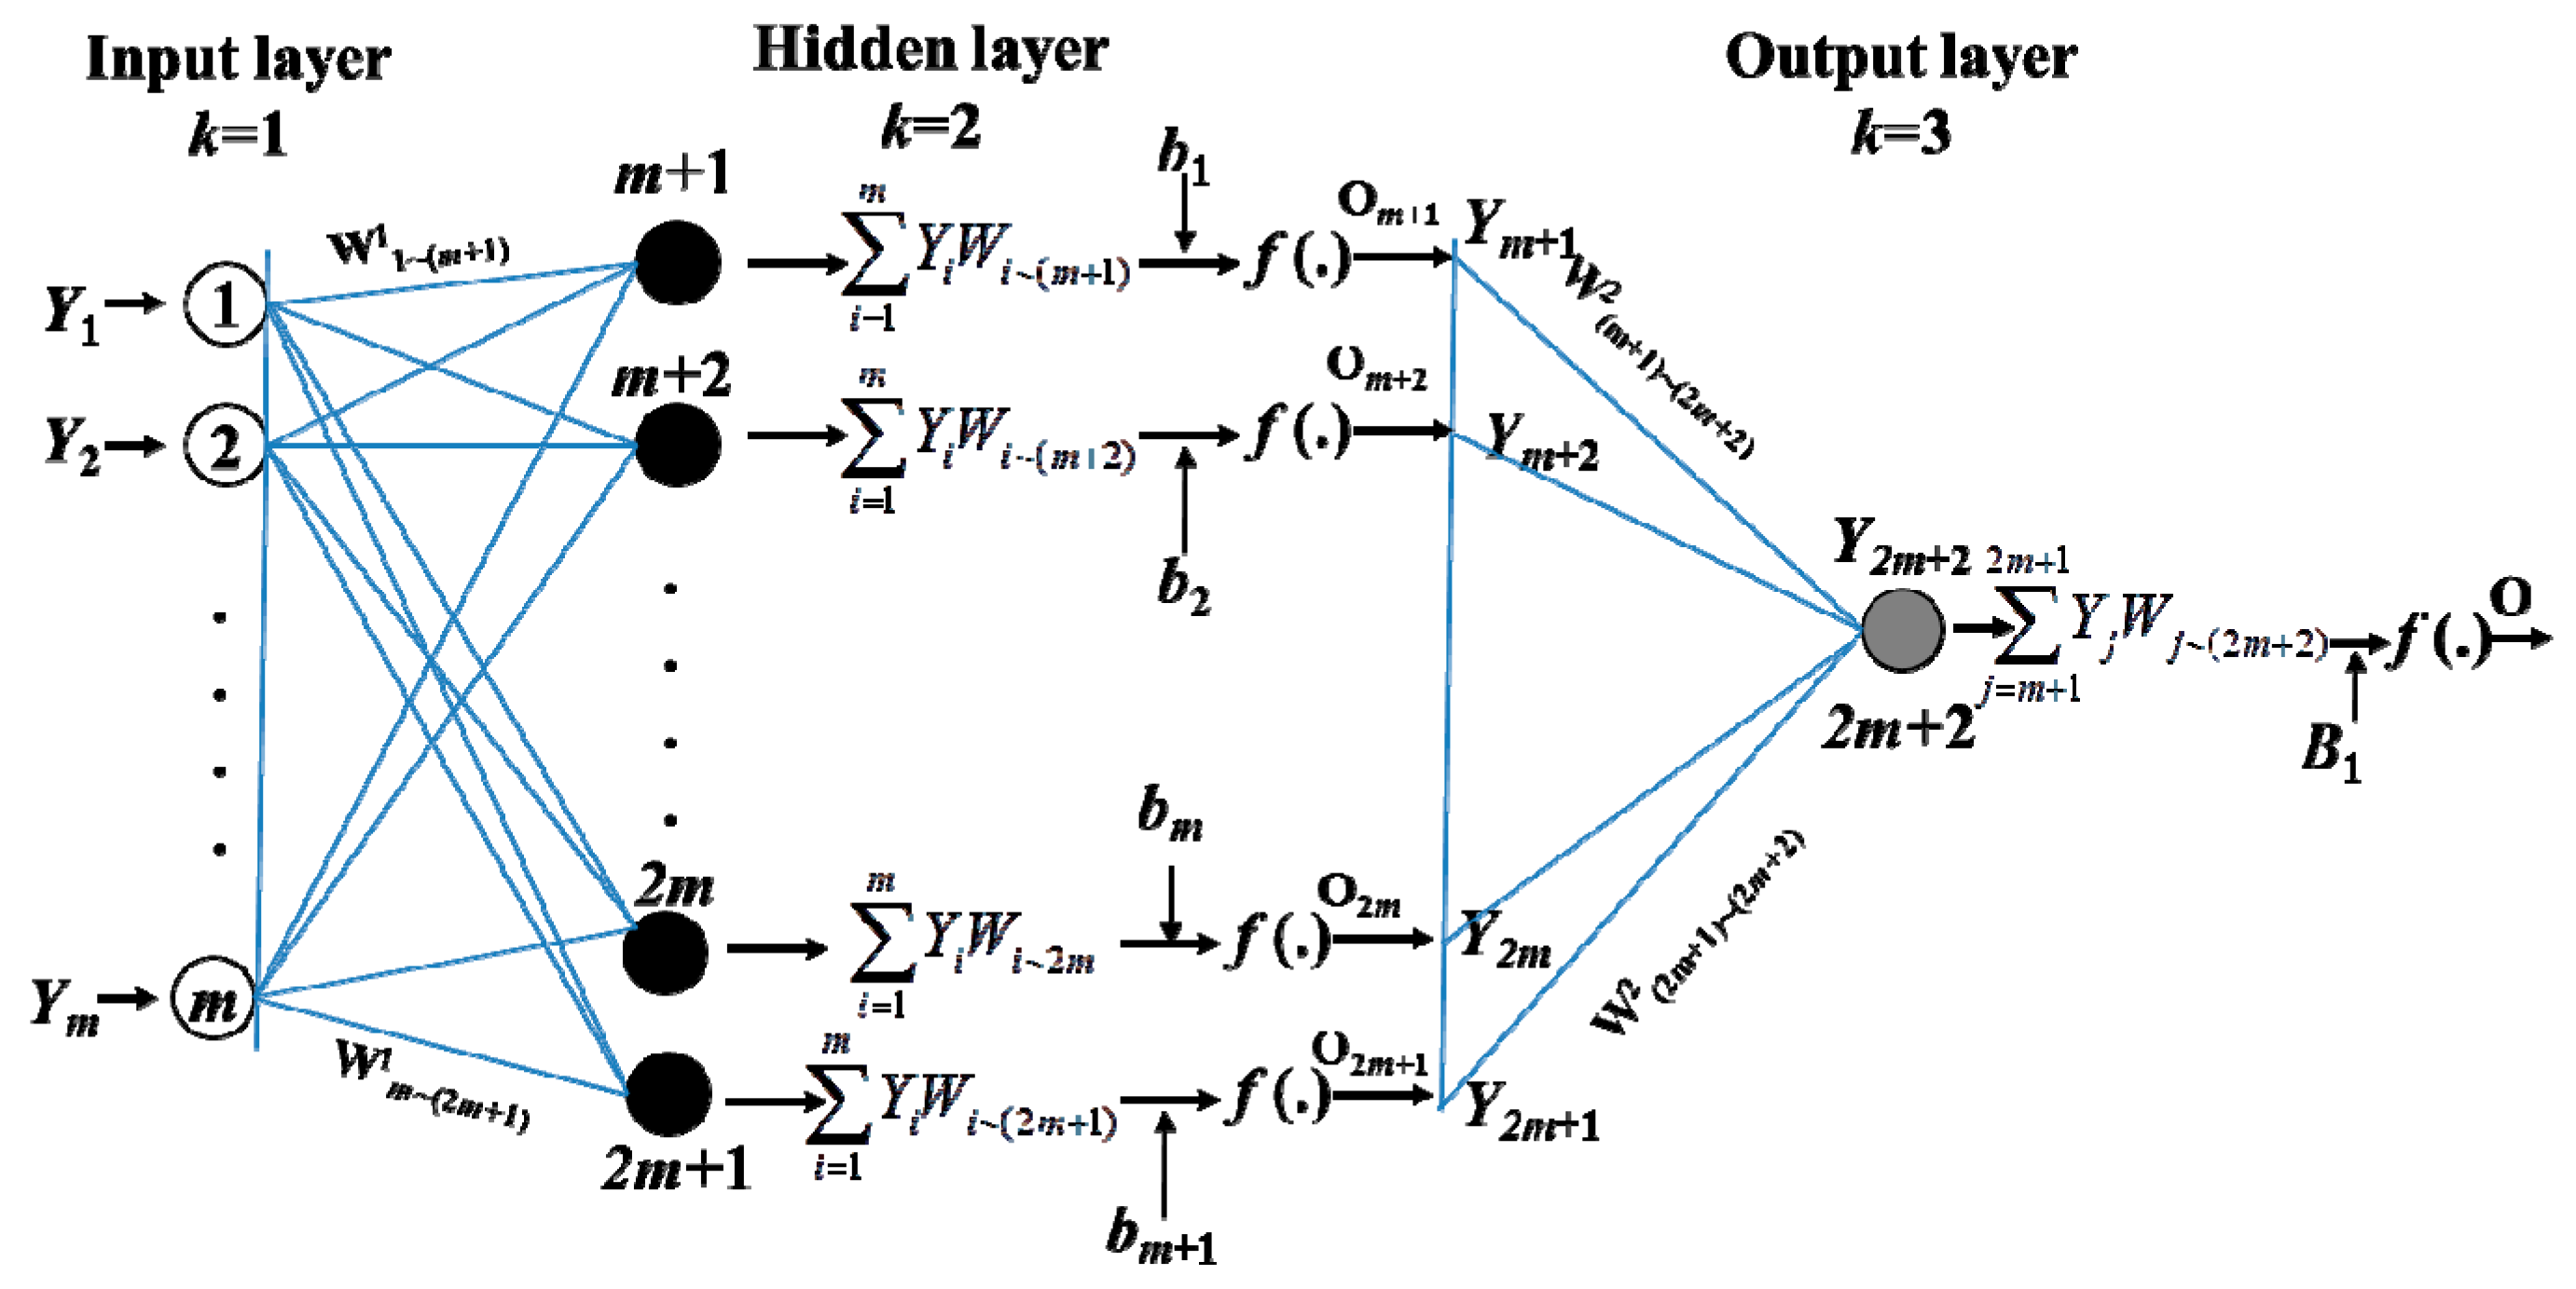
In the BP network mentioned here, a three-layer network structure, m~(m+1)~1 (where, m is the number of new PCA variables obtained by the PCA operation), used in the present modeling, has been shown in Figure 4. The numbers of input variables here were m. The number of input neurons in the hidden layer, designed according a serial of model validations, is assured at m+1, and the neuron in output layer is 1, which represents the CS.
In Figure 4, the input to the neurons in the hidden layer and the output layer is the sum of all the input neurons as shown in Equation (7):
where Yi: input sum of ith neuron in the k layer, k = 2, 3.
Yj: input sum of jth neuron in the k−1 layer.
i: ith neuron in k layer (k = 2, 3), for k = 2, i = 1, 2, …, m+1; k = 3, i = 1.
j: jth neutron in k−1 layer, j = 1, 2, …, m for input layer, j = m+1, m+2, …, 2m+1 for the hidden layer.
Wj~i: weight of between jth neuron in k−1 layer and ith neuron in k layer.
bi: threshold of ith neuron in k layer(k = 2), (bi = Bi, k = 3).
Basing on preliminary experiments, it was found that the Tan-Sigmoid function [19] was accurate to obtain target results; thus, it was arranged as a candidate transfer function of adjacent neurons (Equation (8)):
where Oi: output of ith in k layer (k = 2, 3).
Therefore, using the weights and thresholds of the neurons in hidden, signals transferred by each neuron to the proceeding neuron can be estimated by Equation (9):
Thus, using transfer function Om+1 output Ym+1. The total input of neuron in the output layer can be given by Equation (10):
Again, using transfer function O2m+2, Y2m+2 can be converted to output CS.
2.3.2. Error Inverse Propagation of BP Network
All the weights (W) and thresholds (b) are randomized at the first training step. The network generates weights, while training and producing output. Its output is then compared with the target output of all the neurons of the output layer; the error is back propagated by changing the interconnect weights (W) and thresholds (b), in case of any discrepancy. In the BP method here, the least square error () is given by Equation (11):
where ti: targeted output in k layer; Oi: predicted output in k layer.
2.3.3. Optimize the BP Network with GA
It is acknowledged that the weights and thresholds of the BP network may stay at a local minimum in the training process, which may limit network convergence. In order to make the model accurate, the GA was conducted to optimize the initial weights and thresholds of the BP network. Generally, the GA includes selection operation, crossover operation, and mutation operation [20]. The details are listed as follows:
(1) The weights (W) and thresholds (b) of the whole neural network are regarded as a group of chromosomes, as shown in Equation (12):
where Wwhole is an assemblage of weights and thresholds.
(2) Obtain the fitness of the chromosomes (fi) in Equation (13):
where M is a constant, is the absolute error in the training model.
(3) Select some individuals whose fitness is larger. The selection probability (Pk) is shown in Equation (14):
For the sake of preventing degradation of the best sample, individuals with the maximum fi are put to the next generation directly, without any genetic operations such as crossover and mutation.
(4) A new generation of sample will be generated after crossover and mutation operation.
(5) According to the GA operation, the weights and thresholds given the minimum error are picked up as the new weights and thresholds for the ANN network.
3. Results and Discussion
3.1. PCA
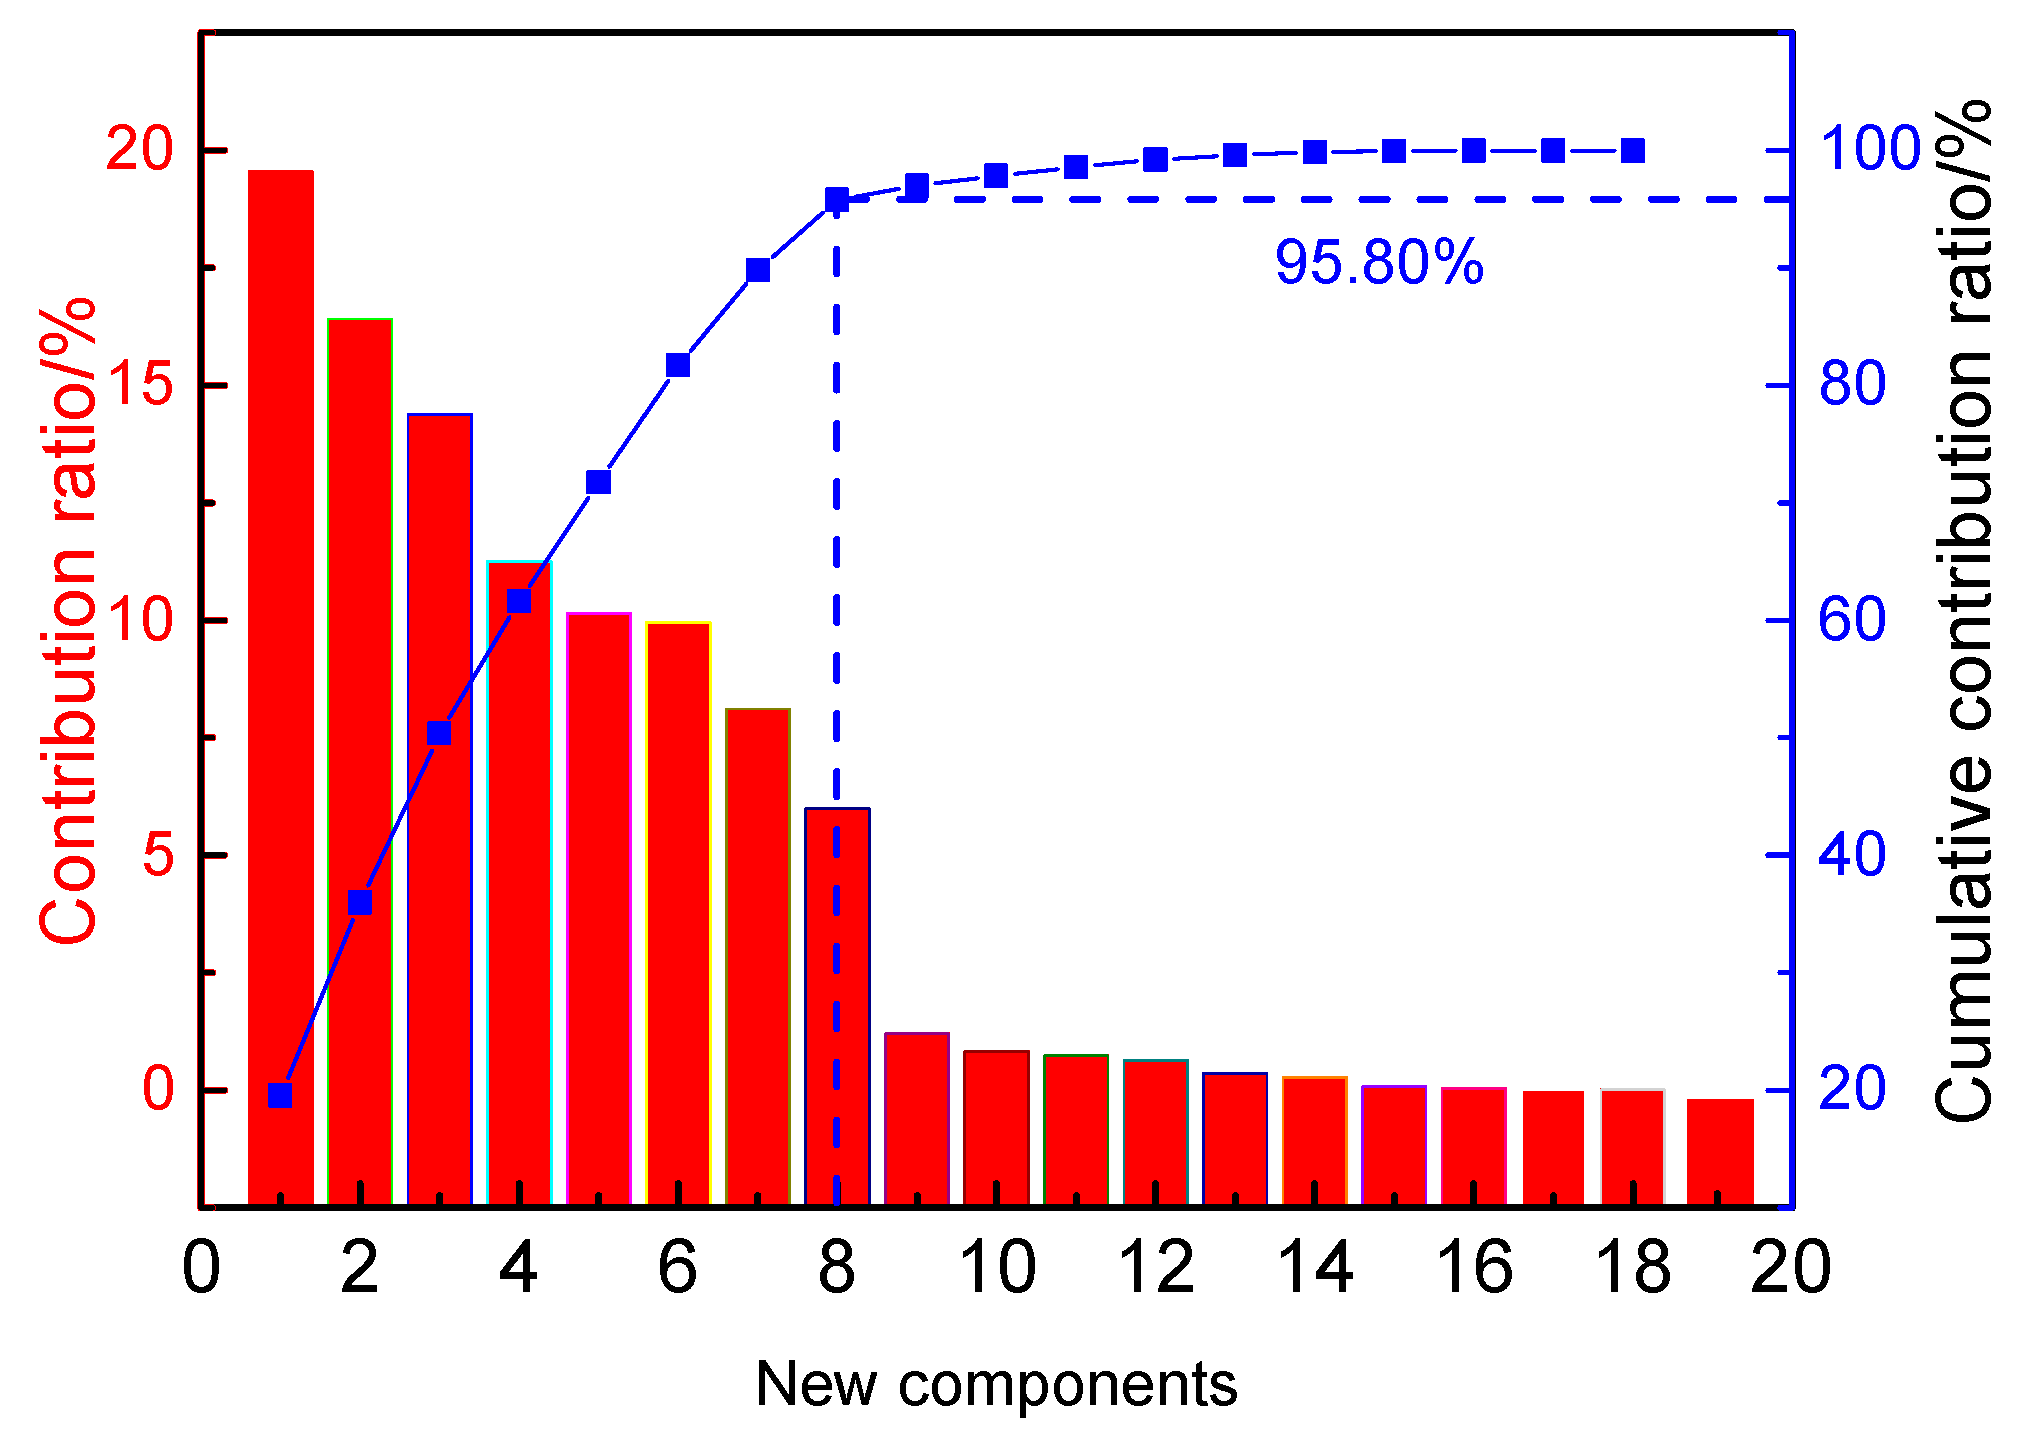
The 19 new components shown in Table 2 are produced basing on the PCA operation. It should be noted that the new 19 components here are different from the initial 19 variables, and the new components are numbered base on the eigenvalue (λ), from large to small. Besides, each new component is independent and contains one or more correlative initial variables information. In addition, the contribution rate and cumulative contribution rate of the new components are listed in Table 2. The contribution rate is shown in Figure 5.
In this paper, PCA variables are assured when the cumulative contribution rate of the new components is more than 90% (as mentioned in Equation (5)). From Figure 5, it can be seen that the cumulative contribution rate of the first eight components is 95.80% (>90%), which means that the first eight components can adequately describe the information existing in the 19 initial variables. Other contribution rates are too small and therefore omitted. We chose the first eight components as the new PCA variables to serve the BP network. Thus, m = 8 in the following BP network.
The score coefficient matrix of the eight components (PCAi (i = 1~8) variables) is listed in Table 3. It can be seen that (1) PCA1 contains the initial variable information: bentonite%, CS of green pellet, dropping strength, and CS of drying pellet; (2) PCA2 contains the initial variable information: FeO%, firing temperature, and gas consumption; (3) PCA3 contains the initial variable information: pellet diameter, bed depth, firing time, and charging rate; (4) PCA4 contains the initial variable information: particle size (−74 μm%), and porosity of green pellet; (5) PCA5 contains the initial variable information: MgO%; (6) PCA6 contains the initial variable information: CaO%, and basicity; (7) PCA7 contains the initial variable information: moisture, and burst temperature; (8) PCA8 contains the initial variable information: Al2O3%.
3.2. Training and Testing of the BP Network
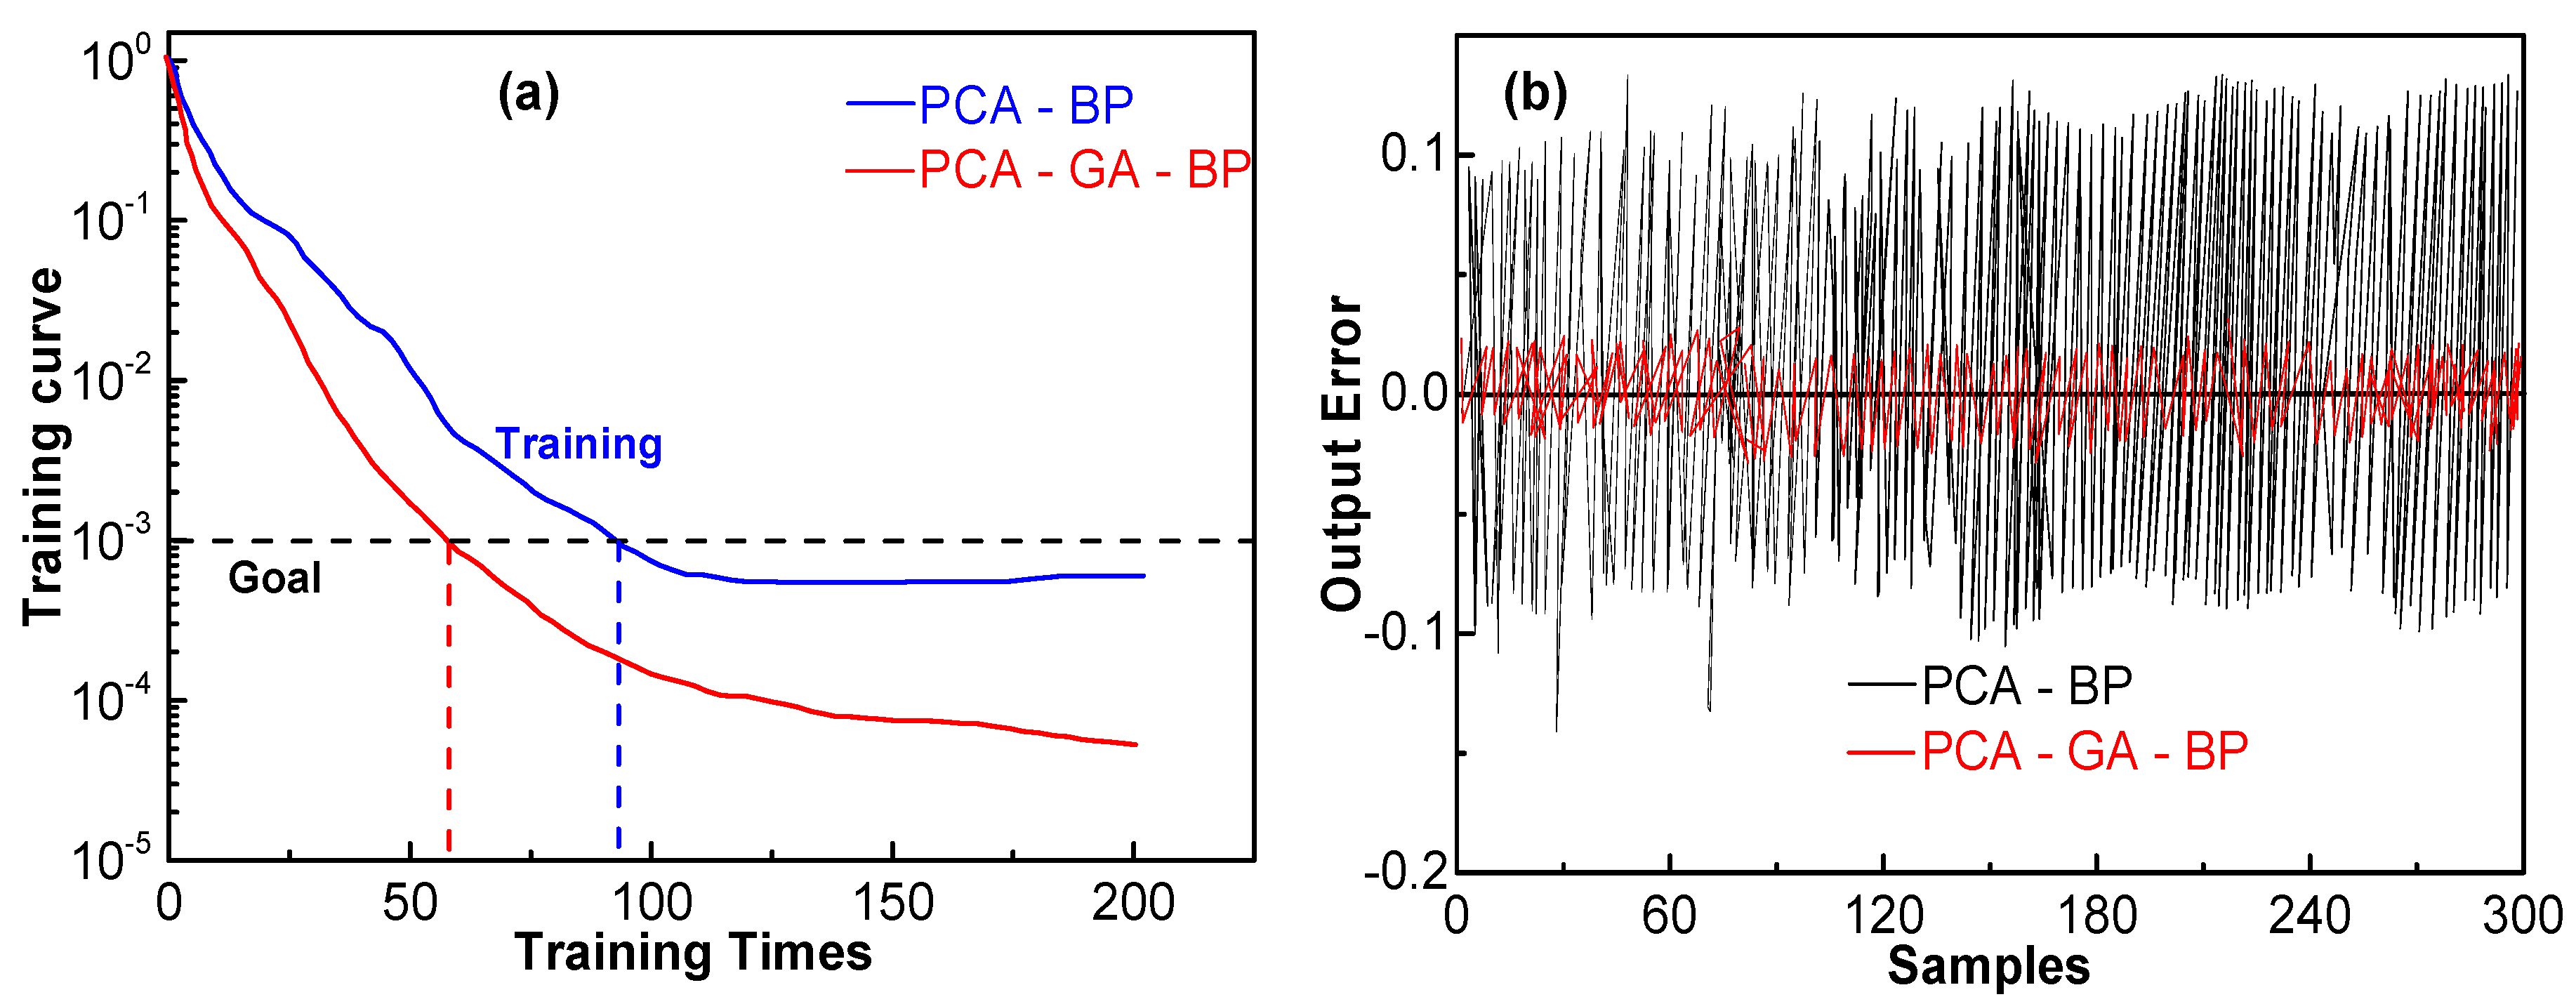
For modeling purposes, operational data for 365 days were collected from the pellet plant. After preprocessing the data to eliminate noise and considering stable operating data, 300 data sets were finalized for training and testing of the network. The data were split into 260 for training and 40 for testing. The GA was conducted to optimize the initial weights and thresholds of the BP network. The training performance of the PCA-BP network and PCA-GA-BP network are shown in Figure 6. One can conclude from Figure 6a that the training speed of the PCA-GA-BP network is faster than that of the PCA-BP. For the PCA-GA-BP network, it takes 60 training times to obtain the target, while 90 training times is needed to meet the target goal for the PCA-BP network. In addition, the output error of the PCA-GA-BP network is smaller than that of the PCA-BP network (Figure 6b). Consequently, the GA operation for optimizing the BP network is virtually effective.
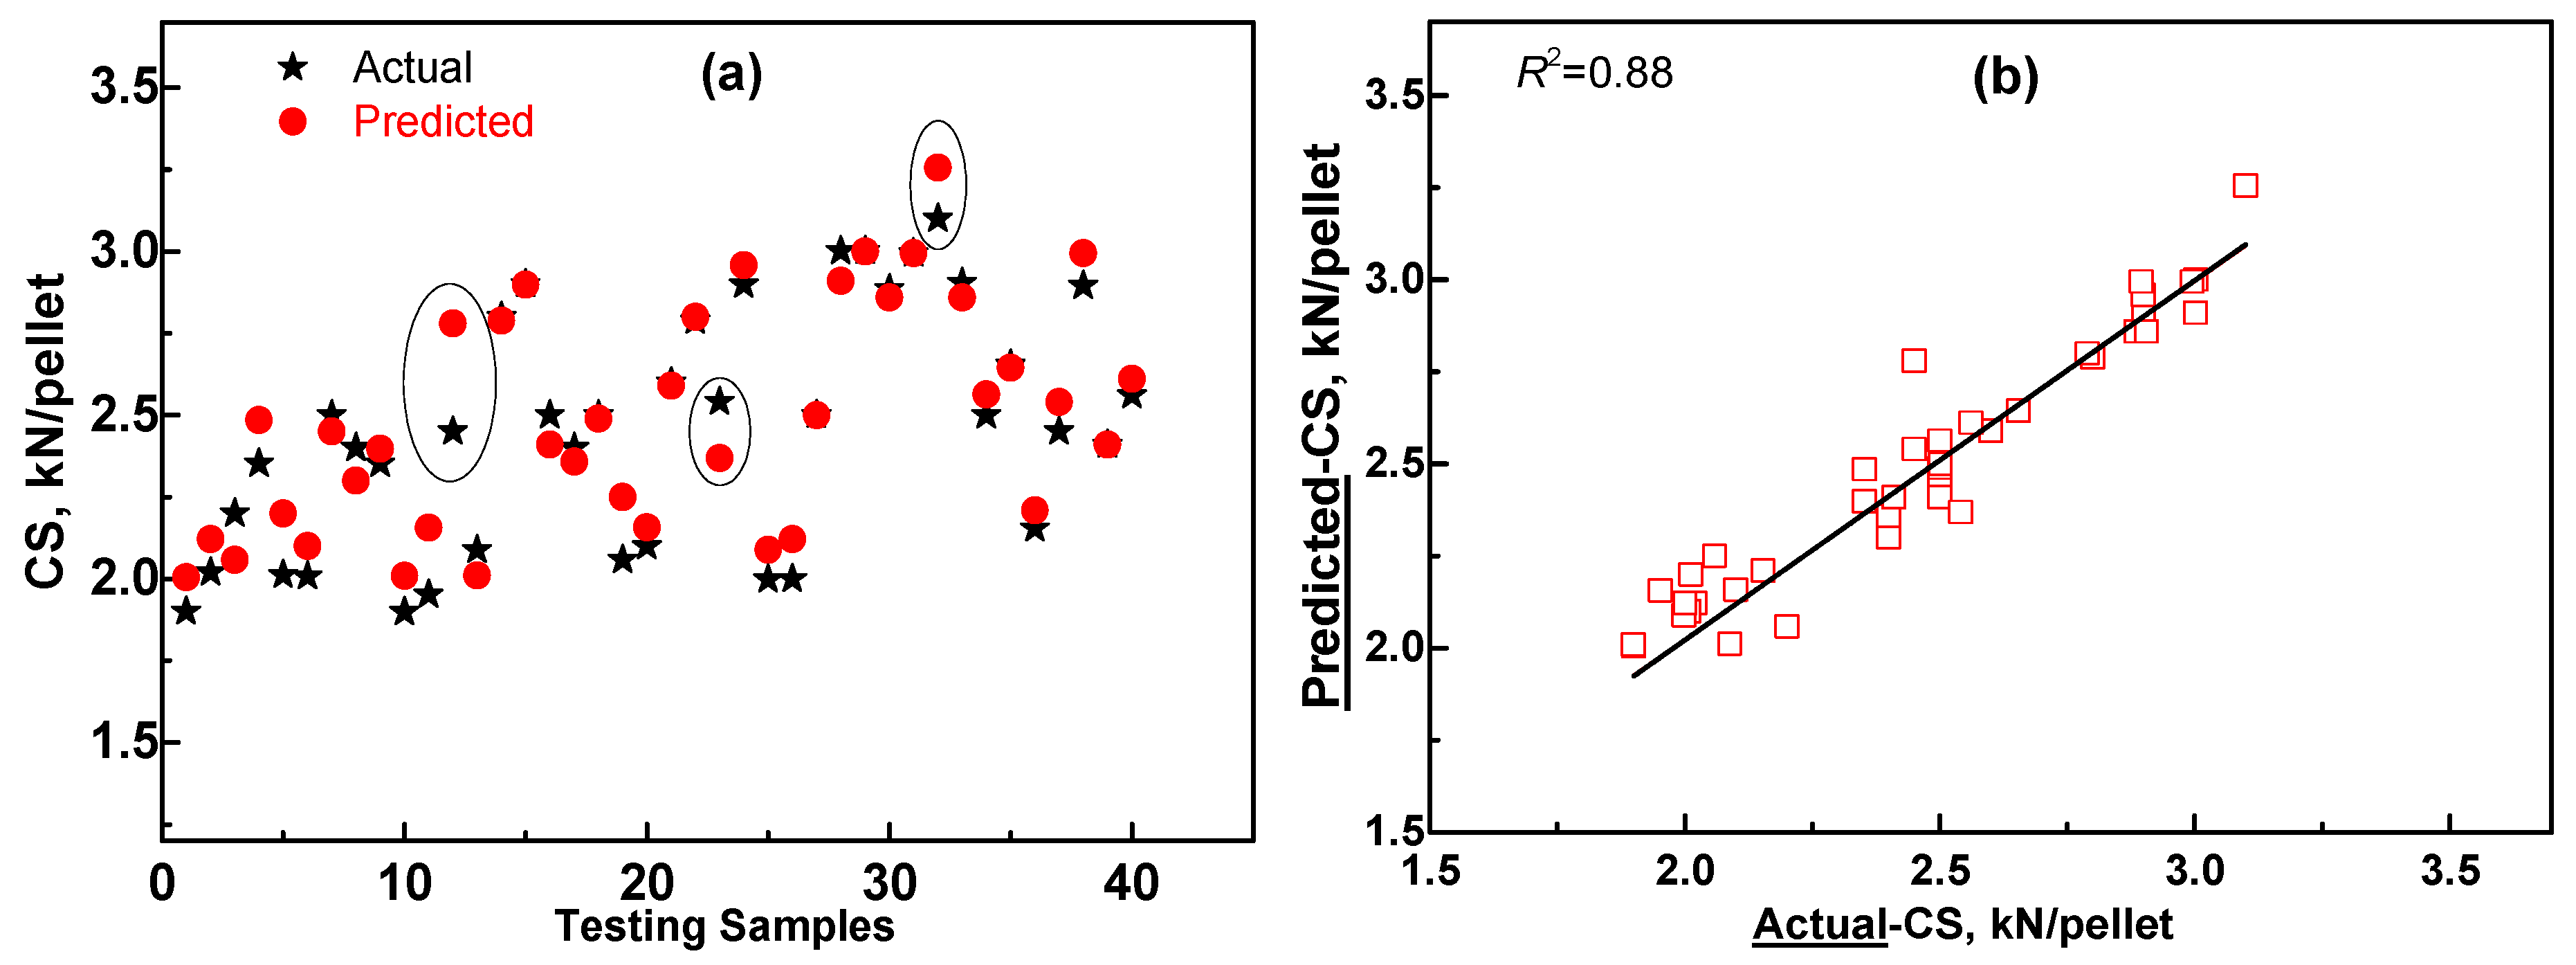
The network was trained till the minimum desired error was achieved. After the training operation, the PCA-GA-BP neural network was used to predict the testing samples; the testing results of the CS are shown in Figure 7. It has been found in Figure 7 that the prediction accuracy of the PCA-GA-BP network mentioned here is 96.4% and the regression coefficient (R2) is 0.85, indicating that the ANN network can beneficially predict CS in the pelletizing process.
3.3. Sensitivity Analysis of the Influence Variables of CS
Obtaining the sensitivity of influence variables is a target for the PCA-GA-BP network referred to here. Therefore, the sensitivity analyses of some variables were carried out to understand their effect. Based on these results, we can obtain the detailed influence of an input variable on CS. Therefore, it is useful to form a CS control strategy in advance for the pelletizing process.
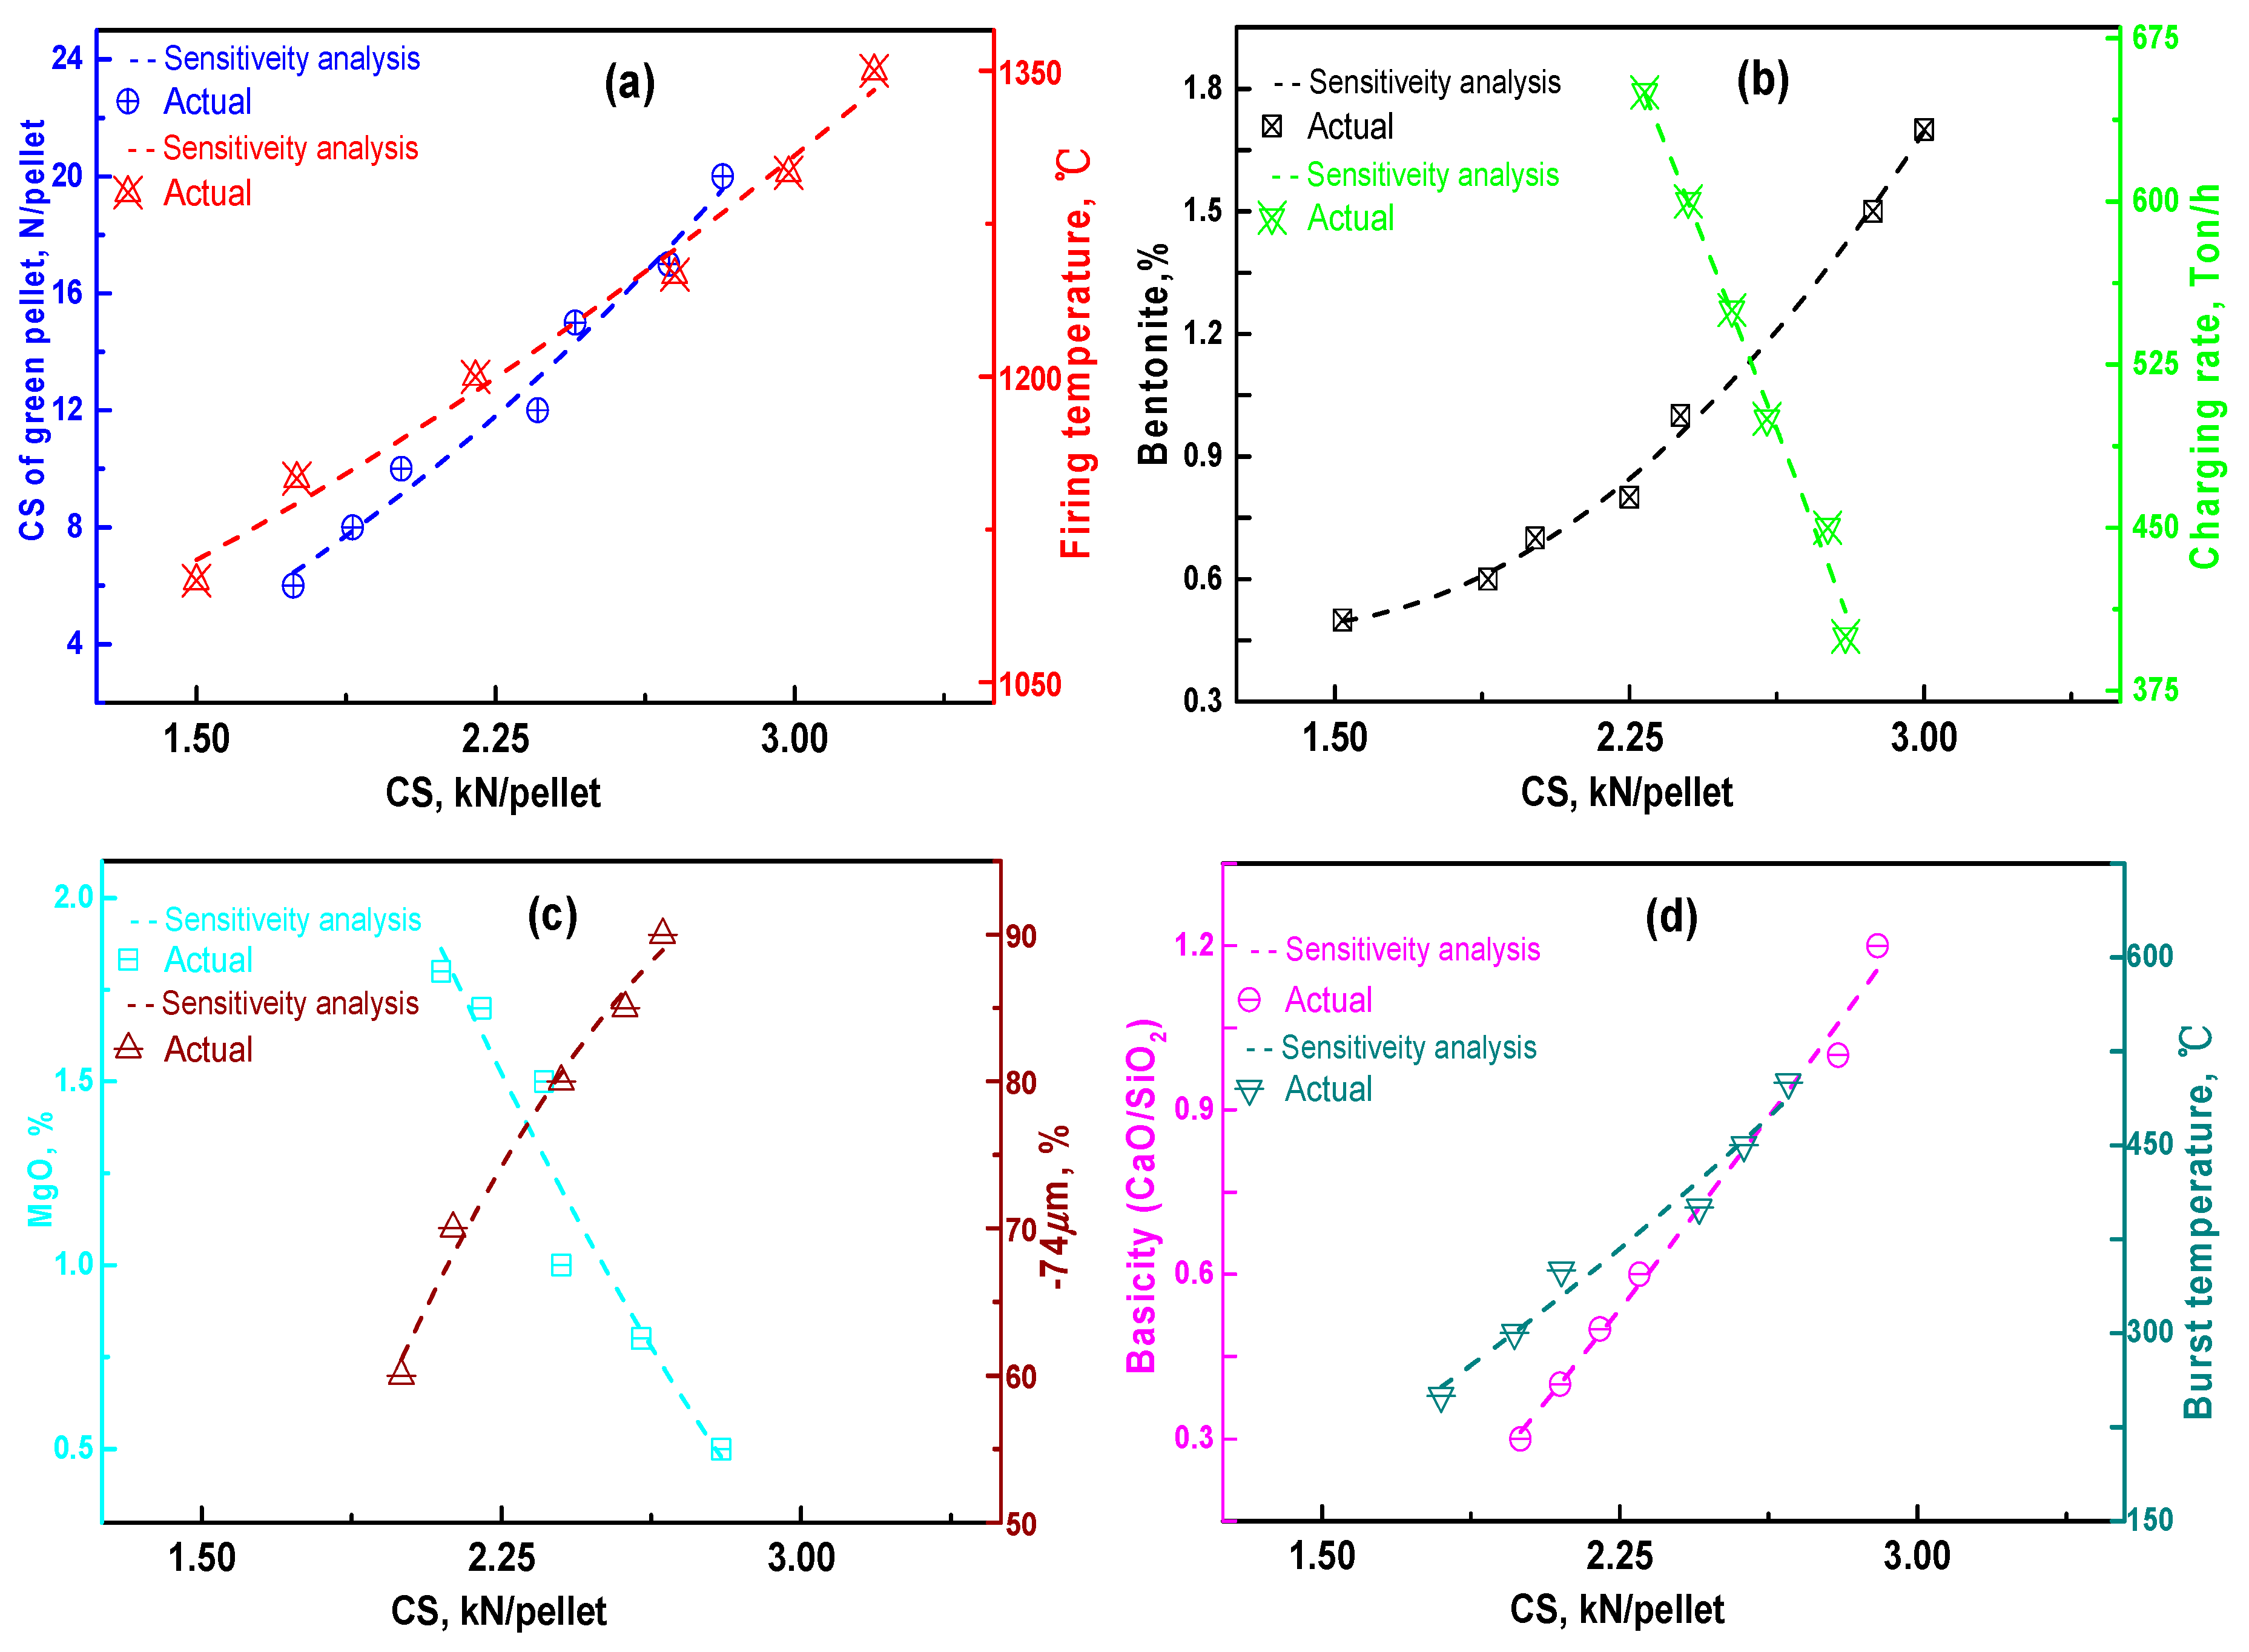
In the present study, the PCA process revealed that some input variables have a correlative relationship and those variables can comprise of a set of correlative variables. Therefore, only one or two variables in a correlative variable set were chosen to carry out the sensitivity analysis. The variables using sensitivity analysis in the present work include CS green pellet, bentonite%, firing temperature, charging rate, MgO%, basicity, −74 μm%, and burst temperature. The sensitivity analysis results are shown in Figure 8.
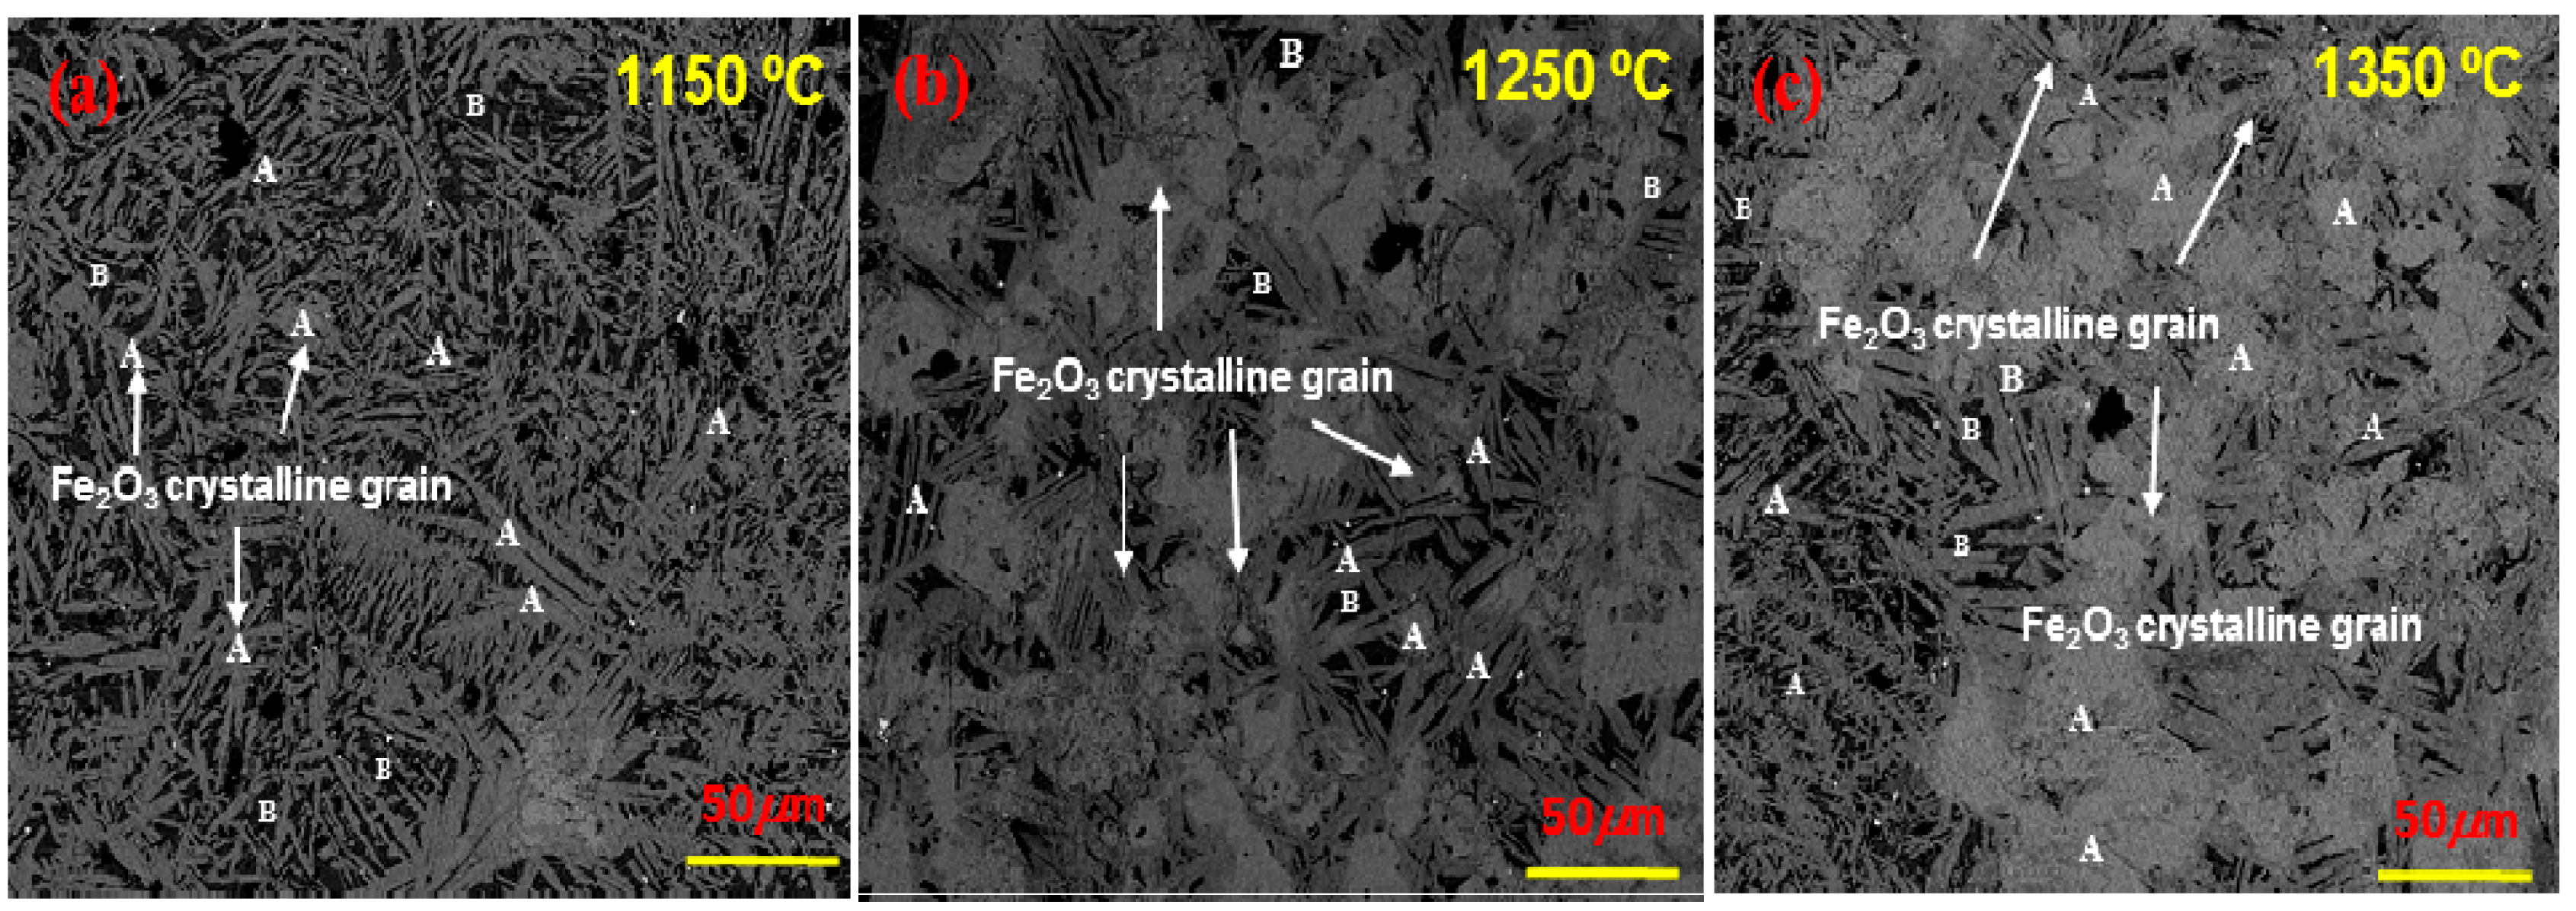
Figure 8a,b prove the following: (I) Increasing the bentonite dosage of green pellets can contribute to growth of the CS; the sensitivity analysis is also consistent with actual testing. This can be attributed to the addition of a dosage of bentonite (an efficient binder), which can highly enhance the CS of green pellets, leading to a higher CS. (II) High firing temperature improves CS because the induration process of pellet includes the oxidation of Fe3O4 and re-crystallization of Fe2O3, while high firing temperature simultaneously accelerates the oxidation of Fe3O4 and re-crystallization of Fe2O3, and obtains high strength [21]. The pellet samples in different firing temperatures (1150 °C, 1250 °C, and 1350 °C) were observed using a metallographic microscope, and the results are shown in Figure 9. For pellets indurated at higher temperatures (1250 °C, 1350 °C), the re-crystallization of Fe2O3 was completed; the crystalline grain of Fe2O3 compactly connected with each other and were evenly distributed. For pellets in lower indurated temperatures (at 1150 °C, Figure 9a), the re-crystallization of Fe2O3 was not complete. (III) A higher charging rate is found to decrease pellet strength. This can be attributed to a high charging rate, which can reduce the residence time of pellets in high temperature firing regions, resulting in low strength.
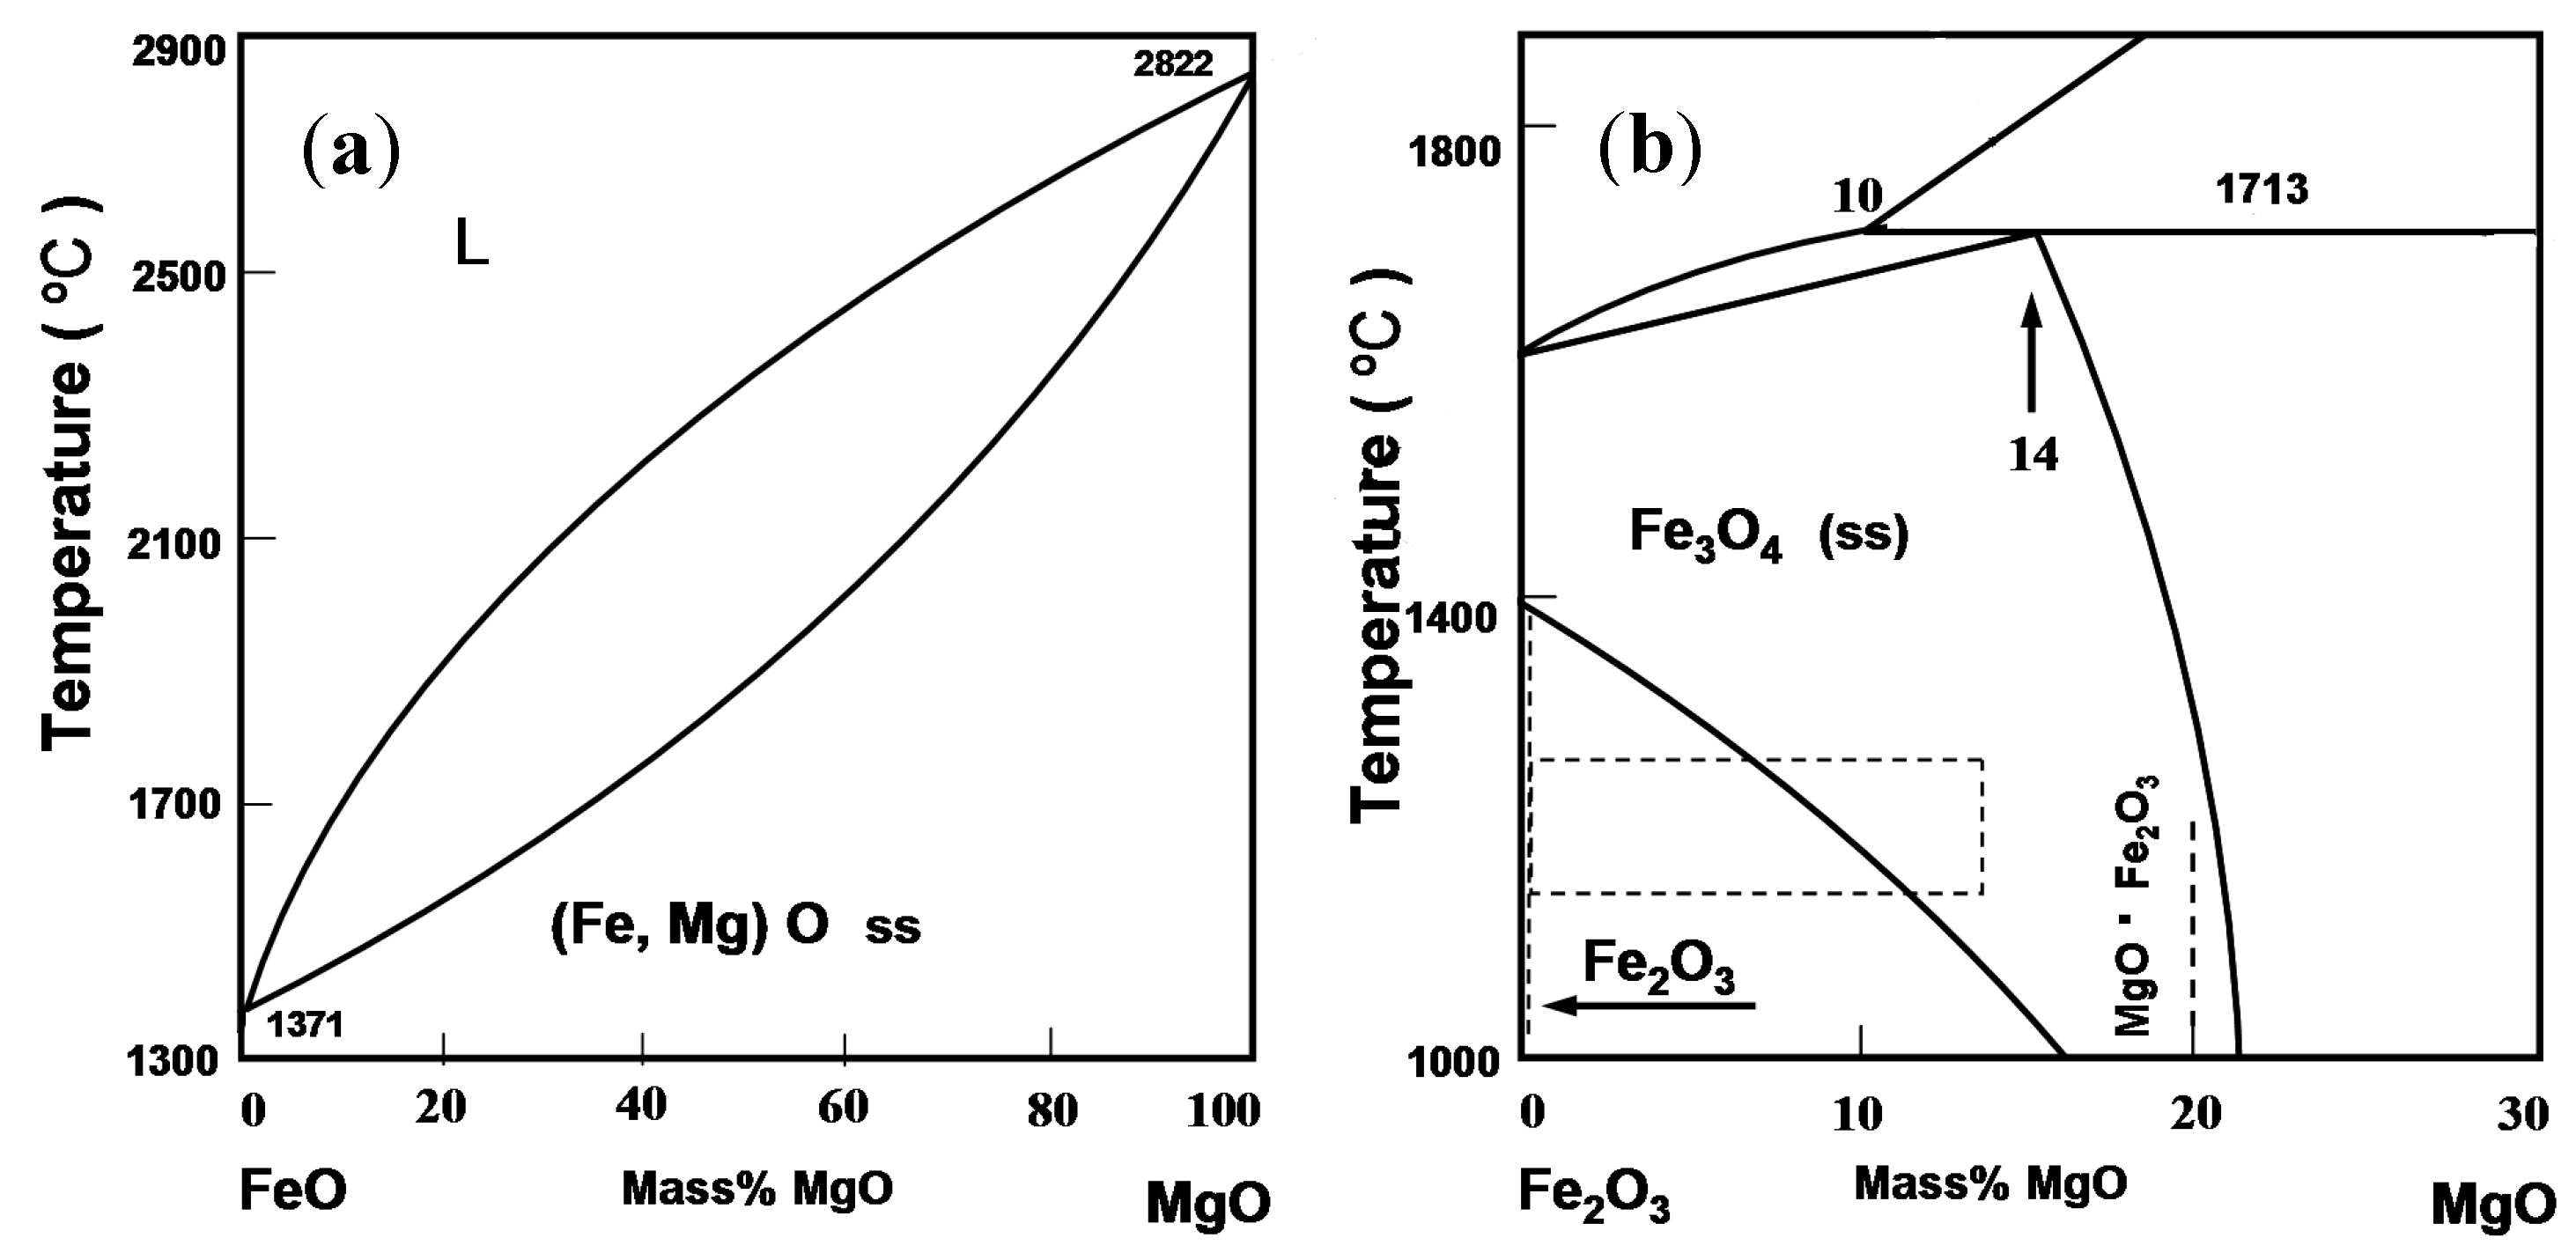
From Figure 8c: (IV) High MgO content appears to attenuate pellet strength. It was pointed out by Shen et al. [22] that increasing MgO content has a negative effect on filling of Fe2O3 crystalline grain in the pore of the pellet.
From the FeOx–MgO phase diagram [23] (Figure 10), it is evident that FeO and MgO are unlimitedly mutually soluble (Figure 10a). Fe2+ and Mg2+ can be partially replaced with each other, and there is a large homogeneous zone meeting the induration of oxidized pellets (dotted line rectangle in Figure 10b). During the induration process, the reactions between MgO and Fe2O3 can produce MF minerals—{(Fex Mg1−x) O · Fe2O3}. Similar to the structure of magnetite (Fe3O4), MF is also a reverse spinel structure. Consequently, MgO can restrain the crystal transition from Fe3O4 to Fe2O3, resulting in incomplete re-crystallization and low strength. (V) The high strength of a large portion of −74 μm iron ore can be attributed to the fact that it is easier for iron ore with low particle size to be pulled together and indurated adequately.
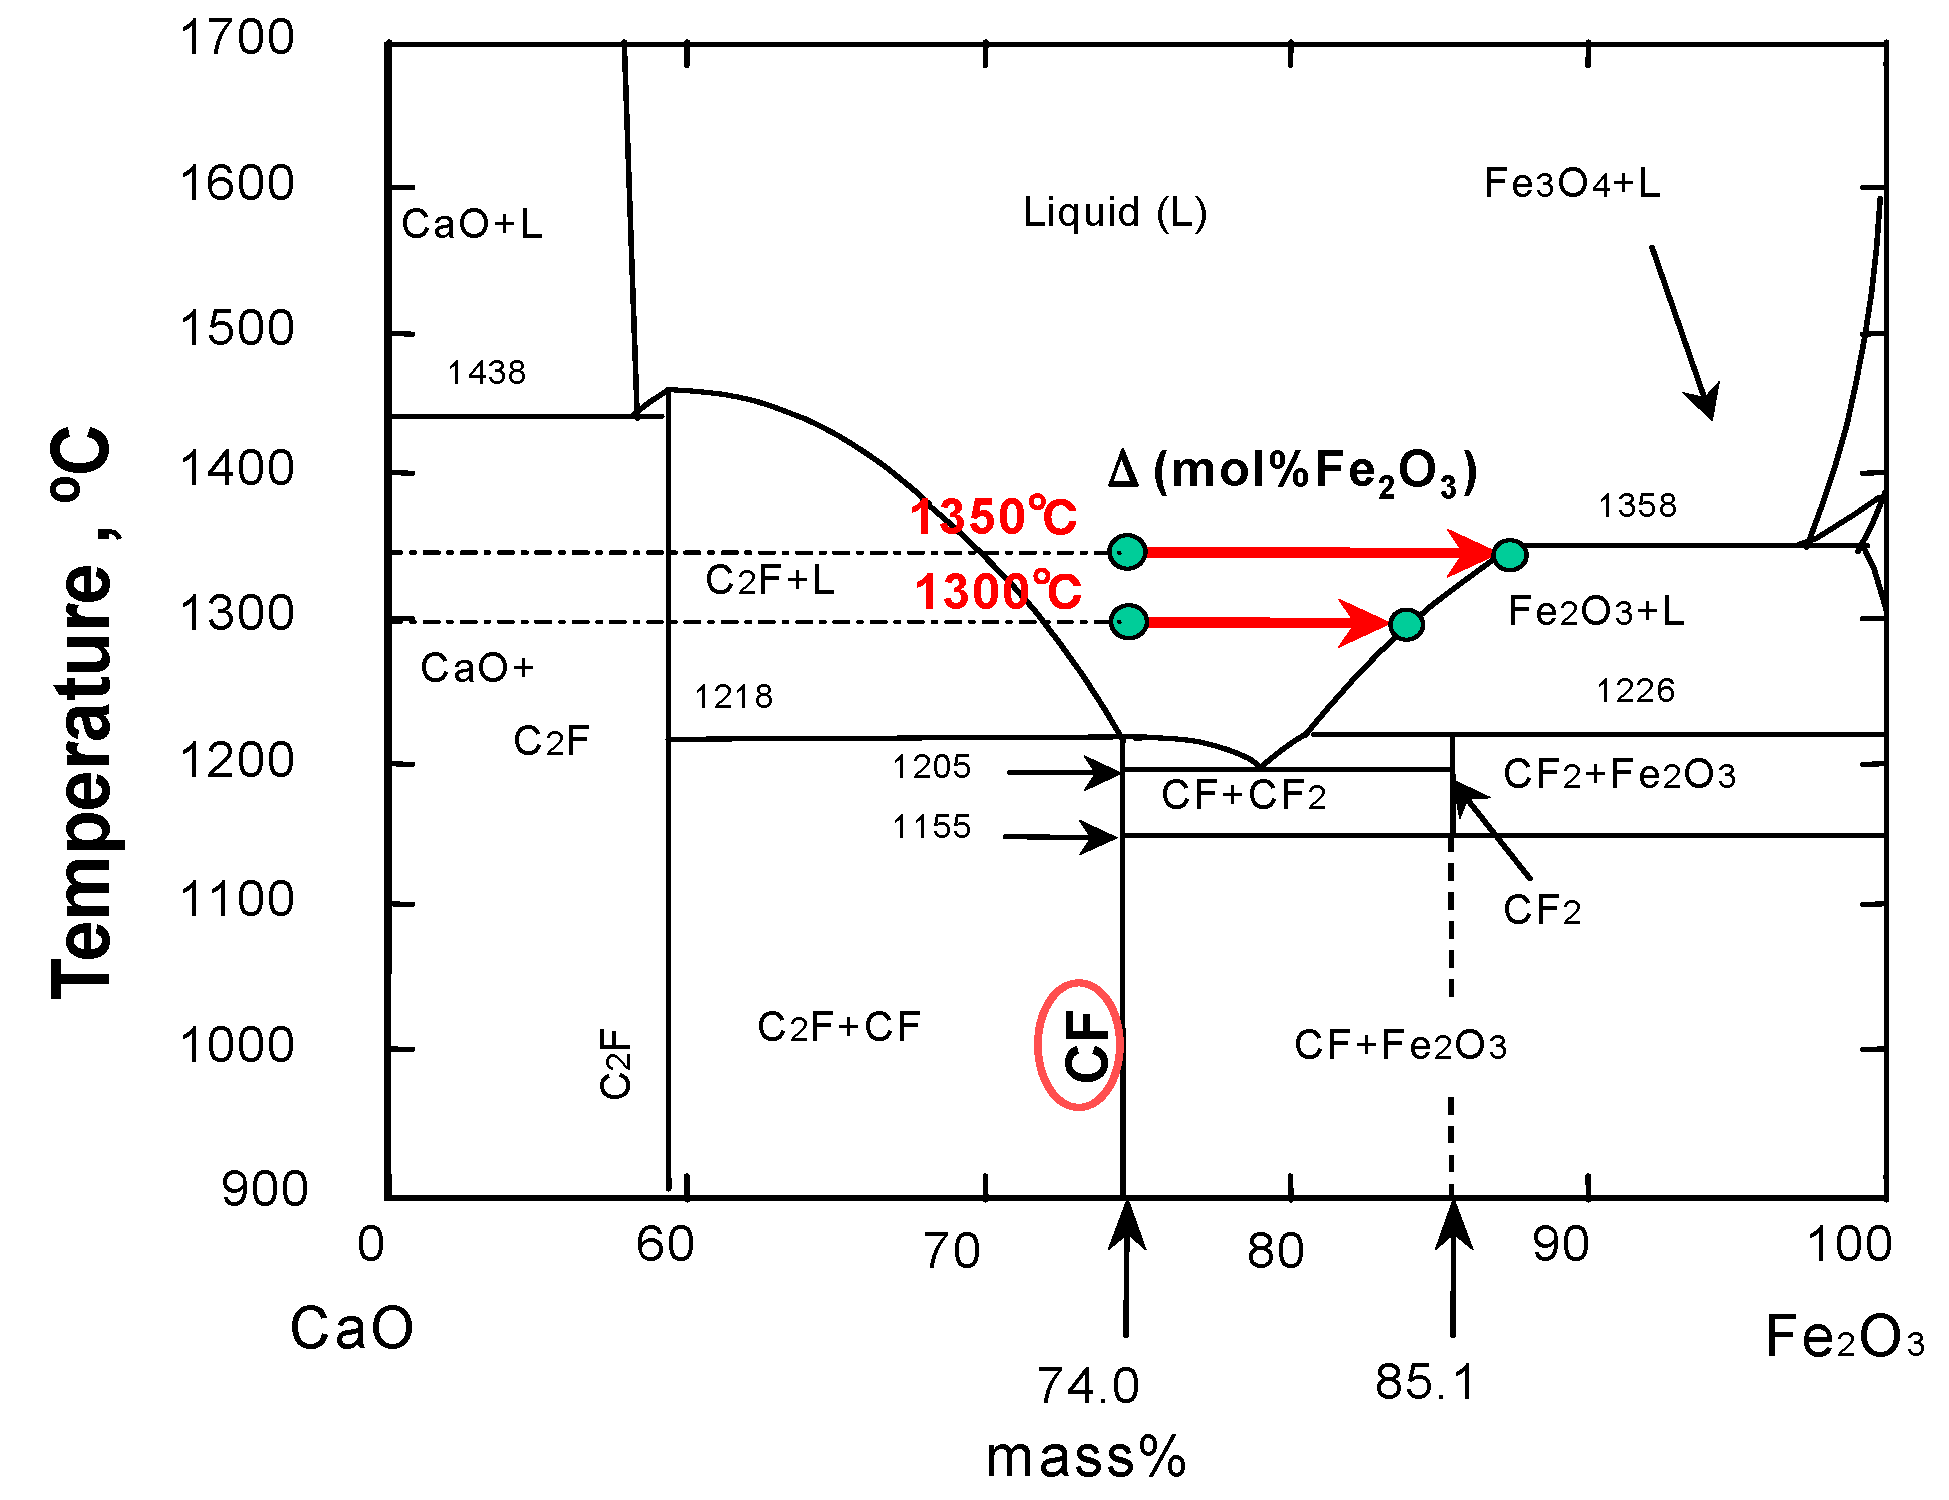
In addition, from Figure 8d: (VI) Increase in pellet basicity has a major impact on CS. This could be attributed to the fact that higher CaO results in the formation of a stronger calcium ferrite phase by a reaction between calcium oxide and iron oxide [24]. The CaO–Fe2O3 phase diagram [23] is shown in Figure 11; the calcium ferrite phase (CF) is thus generated, as the firing temperature is higher than 1200 °C.
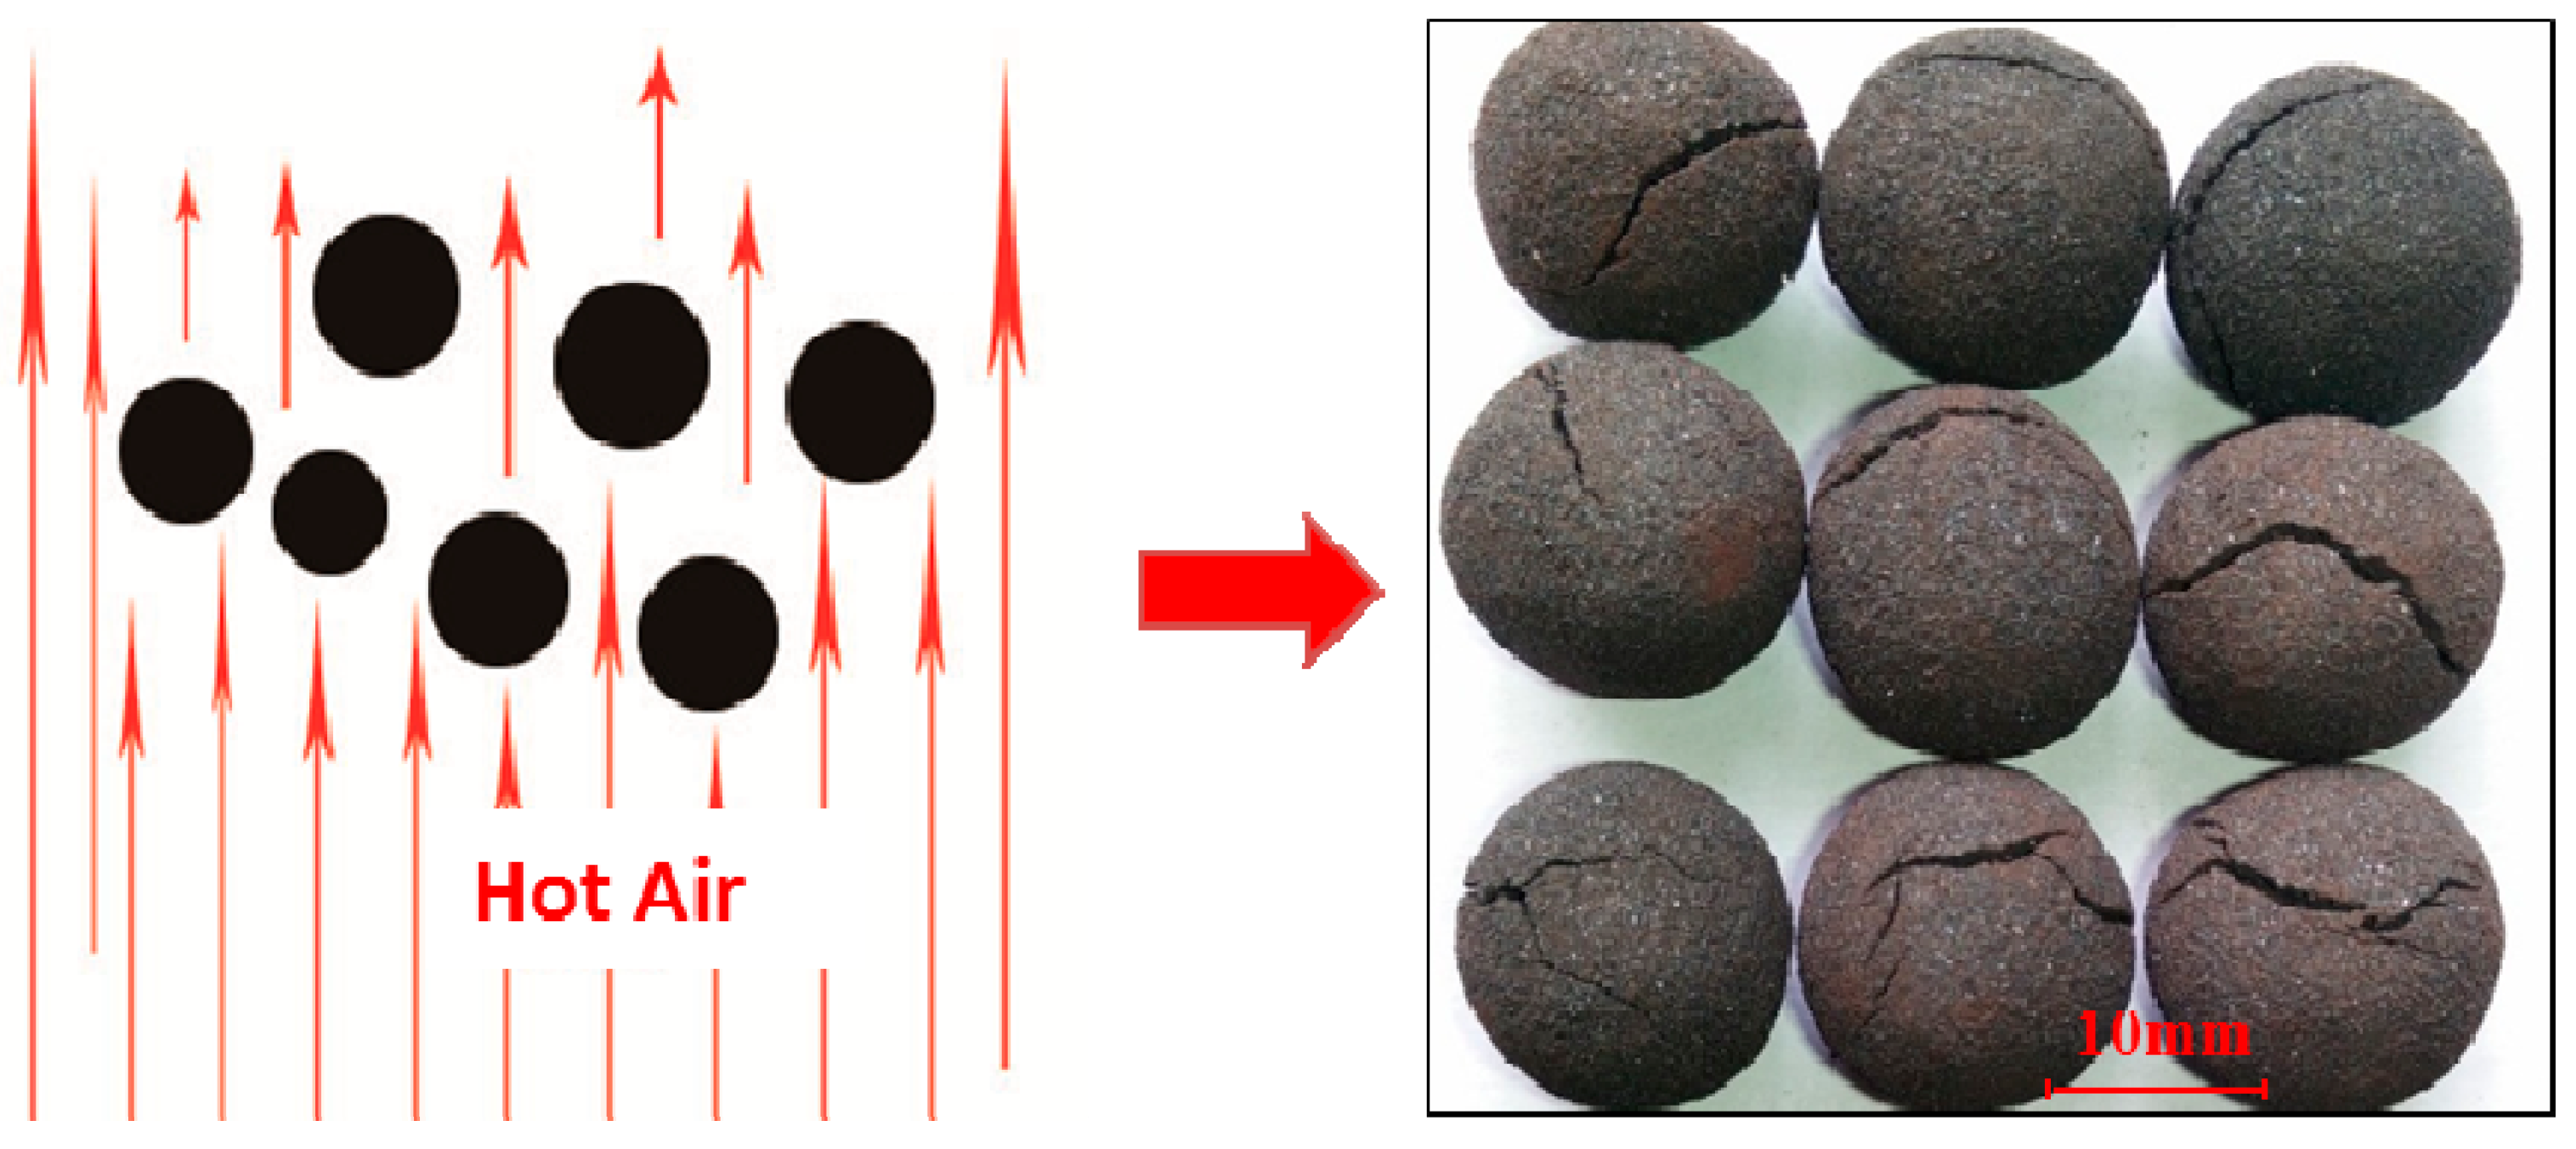
(VII) Higher burst temperatures offer substantial improvement in pellet strength. Green pellets are susceptible to bursting during the drying process (Figure 12), if the burst temperature is too low. Therefore, enhancing the burst temperature (especially onset temperature) can help limit the same in the drying and firing processes. Similarly, the PCA operation has shown that the burst temperature and the moisture of green pellets have a negative correlation, and low moisture dosage is found to improve CS. Gao et al. [25] maintained that low moisture content in green pellets can improve burst temperature, thus increasing CS.
3.4. Discussion
The CS of a pellet is of significance in the BF process. Therefore, the influence factors and control strategy of a pellet’s CS should be explored with comprehensive consideration. The model mentioned here has a high accuracy and can be well used in the industry to predict and control pellet CS. Based on the different sets of input variables (≤19, for the initial variables in Table 1), the model can predict pellet CS in advance. In addition, the model is available to optimize the existing pelletizing process, based on a target CS. For instance, if we set the target CS in 2500 N/pellet, the model will adjust the input variables to product pellets with desired CS. Also, the adjustment of the variables is permitted to a finite level to avoid operation fluctuations and maintain stable production. Moreover, the model can be used to deal with emergencies in production. Based on sensitivity analysis results of influence variables, we can tinker with high sensibility parameters to assure continuous production.
4. Conclusions
In order to provide a reliable control strategy in the production process and predict pellet CS, a prediction model based on the PCA-GA-BP network was proposed. The main findings are summarized as follows:
(1) The dimensionality influence factors of the CS were reduced by the PCA operation. The new independent PCA variables containing adequate information of the initial variables can also be brought out to substitute the initial variables.
(2) The GA was provided to offer accuracy and stability of the model and to optimize the initial weights and thresholds of the BP network. The prediction accuracy of the PCA-GA-BP network mentioned here is 96.4%, indicating that the ANN network was effective to predict CS in the pelletizing process.
(3) Sensitivity analyses of some variables were carried out to understand their effect on CS. Large bentonite dosage, high CS of green pellets, and high firing temperature increase the CS of pellets. Enhancing the charging rate and high MgO content of pellets are found to decrease pellet CS. Higher basicity, small particle size of iron ore (−74 μm%), and high burst temperature positively affect pellet CS.
Author Contributions
Q.G. and Y.Z. designed the experiments; Q.G. performed the experiments, analyzed the data, and compiled the text; X.J., H.Z. and F.S. supervised the experimental work and reviewed the manuscript.
Funding
This research was funded by the National Science Foundation of China (51604069 and 51604049), the Fundamental Research Funds for the Central Universities, China (N162504004) and the National Key R&D Program of China (2017YFB0603800 and 2017YFB0603802).
Acknowledgments
The authors wish to acknowledge the contributions of associates and colleagues at Northeastern University of China. The financial support of the National Science Foundation of China (51604069 and 51604049), the Fundamental Research Funds for the Central Universities, China (N162504004) and the National Key R&D Program of China (2017YFB0603800 and 2017YFB0603802) are also appreciated.
Conflicts of Interest
The authors declare no conflict of interest.
References
- Biswas, A.K. Principles of Blast Furnace Ironmaking; Cootha Publishing House: Brisbane, Australia, 1981; pp. 33–39. ISBN 10:0949917001. [Google Scholar]
- Fu, J.Y.; Zhu, D.Q. Basic Principles, Techniques and Equipment of the Iron Ore Oxidized Pellets; Central South University Press: Changsha, China, 2005; pp. 323–336. ISBN 9787811050516. [Google Scholar]
- Gao, Q.; Shen, F.; Jiang, X.; Wei, G.; Zheng, H.Y. Gas-solid reduction kinetic model of MgO-fluxed pellets. Int. J. Miner. Metall. Mater. 2014, 21, 12–17. [Google Scholar] [CrossRef]
- Nabeel, M.; Karasev, A.; Jönsson, P.G. Evaluation of dust generation during mechanical wear of iron ore pellets. ISIJ Int. 2016, 56, 960–966. [Google Scholar] [CrossRef]
- China Metallurgical Construction Association. Code for Design of Iron Pelletizing Engineering; China Planning Press: Beijing, China, 2009; pp. 20–25. ISBN 1580177244. [Google Scholar]
- Shen, F.; Gao, Q.; Jiang, X.; Wei, G.; Zheng, H. Effect of magnesia on the compressive strength of pellets. Int. J. Miner. Metall. Mater. 2014, 21, 431–437. [Google Scholar] [CrossRef]
- Sadrnezhaad, S.K.; Ferdowsi, A.; Payab, H. Mathematical model for a straight grate iron ore pellet induration process of industrial scale. Comp. Mater. Sci. 2009, 44, 296–302. [Google Scholar] [CrossRef]
- Batterham, R.J. Modeling the development of strength in pellets. Metall. Mater. Trans. B. 1986, 17, 479–485. [Google Scholar] [CrossRef]
- Gardner, M.; Dorling, S.R. Artificial neural network (Multilayer Perceptron)—A review of applications in atmospheric sciences. Atmos. Environ. 1998, 32, 2627–2636. [Google Scholar] [CrossRef]
- Shuang, C.; Wei, X. Design and selection of construction, parameters and training method of BP network. Comput. Eng. 2001, 92, 336–337. [Google Scholar]
- Markward, S.W.; Lu, Y.Z. Integrated Neural System for coating weight control of a hot Dip Galvanizing Lina. Iron Steel Eng. 1995, 72, 45–49. [Google Scholar]
- Portman, N.F.; Lindhoft, D. Application of neural networks in rolling mill automation. Iron Steel Eng. 1995, 72, 33–36. [Google Scholar]
- Pomerleau, D.; Hodouin, D.; Poulin, É. A first principle simulator of an iron oxide pellet induration furnace–an application to optimal tuning. Can. Metall. Quart. 2013, 44, 571–582. [Google Scholar] [CrossRef]
- Fan, X.; Yang, G.; Chen, X.; Gao, L.; Huang, X.; Li, X. Predictive models and operation guidance system for iron ore pellet induration in traveling grate-rotary kiln process. Comp. Chem. Eng. 2015, 79, 80–90. [Google Scholar] [CrossRef]
- Im, H.J.; Song, B.C.; Park, Y.J.; Song, K. Classification of materials for explosives from prompt gamma spectra by using principal component analysis. Appl. Radiat. Isotopes. 2009, 67, 1458–1462. [Google Scholar] [CrossRef] [PubMed]
- Wang, B.; Ma, J.H.; Wu, Y.P. Application of artificial neural network in prediction of abrasion of rubber composites. Mater. Des. 2013, 49, 802–807. [Google Scholar] [CrossRef]
- Hartmann, S. A competitive genetic algorithm for resource-constrained project scheduling. Nav. Res. Log. 2015, 45, 733–750. [Google Scholar] [CrossRef]
- El Kadi, H.; Al-Assaf, Y. Prediction of the fatigue life of unidirectional glass fiber/epoxy composite lamina using different neural network paradigms. Compos. Struct. 2002, 55, 239–246. [Google Scholar] [CrossRef]
- Selvakumar, S.; Arulshri, K.P.; Padmanaban, K.P.; Sasikumar, K.S.K. Design and optimization of machining fixture layout using ANN and DOE. Int. J. Adv. Manuf. Technol. 2013, 65, 1573–1586. [Google Scholar] [CrossRef]
- Brauer, M.J.; Holder, M.T.; Dries, L.A.; Zwickl, D.J.; Lewis, P.O.; Hillis, D.M. Genetic algorithms and parallel processing in maximum-likelihood phylogeny inference. Mol. Biol. Evol. 2002, 19, 1717–1726. [Google Scholar] [CrossRef] [PubMed]
- Chen, Y.; Li, J. Crystal rule of Fe2O3 in oxidized pellet. J. Cent. South Univ. Technol. 2007, 38, 70–73. [Google Scholar]
- Shen, F.; Gao, Q.; Wei, G.; Jiang, X.; Shen, Y. Densification process of MgO bearing pellets. Steel Res. Int. 2015, 86, 644–650. [Google Scholar] [CrossRef]
- Eisenhüttenleute, V.D.; Allibert, M. Slag Atlas, 2nd ed.; Verlag Stahleisen GmbH: Düsseldorf, Germany, 1995; p. 128. ISBN 3514004579. [Google Scholar]
- Matsumura, M.; Hoshi, M.; Kawaguchi, T. Improve of sinter softening property and reducibility by controlling chemical compositions. ISIJ Int. 2005, 45, 598–607. [Google Scholar] [CrossRef]
- Gao, Q.; Wei, G.; Jiang, X.; Shen, F. Effect of calcinated magnesite on burst temperature of green pellet. J. Northeastern Univ. Nat. Sci. 2013, 34, 542–544. [Google Scholar]
Figure 1.
Schematic diagram of the pelletizing process.

Figure 2.
Flow chart of PCA.

Figure 3.
Flow chart of ANN model.

Figure 4.
Schematic diagram of BP neural network.

Figure 5.
Contribution rate and cumulative contribution rate of new components.

Figure 6.
Training performance of PCA-BP network and PCA-GA-BP network (a) Training curve; (b) output error of the ANN network.
Figure 6.
Training performance of PCA-BP network and PCA-GA-BP network (a) Training curve; (b) output error of the ANN network.

Figure 7.
Testing results of PCA-GA-BP network for CS (a) Actual Vs Predicted results through ANN; (b) Actual Vs Predicted results for CS.
Figure 7.
Testing results of PCA-GA-BP network for CS (a) Actual Vs Predicted results through ANN; (b) Actual Vs Predicted results for CS.

Figure 8.
Sensitivity analysis of variables on CS. (a) CS of green pellet, firing temperature; (b) bentonite%, charging rate; (c) MgO%, particle size (−74 μm%); (d) basicity, burst temperature.
Figure 8.
Sensitivity analysis of variables on CS. (a) CS of green pellet, firing temperature; (b) bentonite%, charging rate; (c) MgO%, particle size (−74 μm%); (d) basicity, burst temperature.

Figure 9.
Micro-structure of pellets: (a) 1150 °C; (b) 1250 °C; (c) 1350 C. A is (Fe2O3 crystalline grain); B is (Un-oxidation Fe3O4).
Figure 9.
Micro-structure of pellets: (a) 1150 °C; (b) 1250 °C; (c) 1350 C. A is (Fe2O3 crystalline grain); B is (Un-oxidation Fe3O4).

Figure 10.
Phase diagram of FeOx–MgO (a) FeO–MgO; (b) Fe2O3–MgO.

Figure 11.
Phase diagram of CaO–Fe2O3.

Figure 12.
Burst process of green pellets in hot air.


Table 1.
Initial input variables of the pelletizing process.
| Input Variables | Average/Year | Standard Deviation | |
|---|---|---|---|
| Raw Materials | Particle size of ore, −74 μm/% | 76.88 | 5.3 |
| Bentonite, % | 1.22 | 0.1 | |
| Green Pellet | Moisture of green pellet, % | 8.0 | 0.36 |
| CS of green pellet, N/pellet | 15 | 2.0 | |
| Dropping strength, Times/pellet | 6 | 0.6 | |
| Pellet diameter, mm | 13 | 1.0 | |
| Porosity of green pellet, % | 30 | 1.9 | |
| Chemical Composition | FeO, % | 0.7 | 0.02 |
| MgO, % | 0.6 | 0.03 | |
| CaO, % | 0.5 | 0.01 | |
| Al2O3, % | 1.5 | 0.04 | |
| Basicity (CaO/SiO2), Dimensionless | 0.09 | 0.001 | |
| Drying Process | Burst temperature, C | 450 | 20.0 |
| CS of drying pellet, N/pellet | 80 | 5.0 | |
| Bed depth, mm | 540 | 10.0 | |
| Firing Process | Firing temperature, C | 1250 | 15.0 |
| Firing time, min | 30 | 2.0 | |
| Gas consumption, m3/t | 50 | 3.5 | |
| Charging rate, ton/h | 600 | 15.0 | |
Table 2.
λ and contribution rate of each new component.
| New Components | λ | Contribution Rate (%) | Cumulative Contribution Rate (%) |
|---|---|---|---|
| 1 | 2.12 | 19.548 | 19.55 |
| 2 | 1.78 | 16.413 | 35.96 |
| 3 | 1.56 | 14.385 | 50.35 |
| 4 | 1.22 | 11.249 | 61.60 |
| 5 | 1.1 | 10.143 | 71.74 |
| 6 | 1.08 | 9.959 | 81.70 |
| 7 | 0.88 | 8.114 | 89.81 |
| 8 | 0.65 | 5.994 | 95.80 |
| 9 | 0.13 | 1.199 | 97.00 |
| 10 | 0.09 | 0.830 | 97.83 |
| 11 | 0.08 | 0.738 | 98.57 |
| 12 | 0.07 | 0.645 | 99.22 |
| 13 | 0.04 | 0.369 | 99.59 |
| 14 | 0.03 | 0.277 | 99.86 |
| 15 | 0.008 | 0.074 | 99.94 |
| 16 | 0.005 | 0.046 | 99.97 |
| 17 | 0.001 | 0.009 | 99.98 |
| 18 | 0.0009 | 0.007 | 99.99 |
| 19 | 0.0001 | 0.001 | 100.00 |
Table 3.
Score coefficient between the PCAi (i = 1~8) and initial variables.
| Initial Variables: | Score Coefficient | |||||||
|---|---|---|---|---|---|---|---|---|
| PCA1 | PCA2 | PCA3 | PCA4 | PCA5 | PCA6 | PCA7 | PCA8 | |
| Particle size | ~ | ~ | ~ | 0.654 | ~ | ~ | ~ | ~ |
| Bentonite | 0.536 | ~ | ~ | ~ | ~ | ~ | ~ | ~ |
| Moisture | ~ | ~ | ~ | ~ | ~ | ~ | 0.859 | ~ |
| CS of green pellet | 0.639 | ~ | ~ | ~ | ~ | ~ | ~ | ~ |
| Dropping strength | 0.551 | ~ | ~ | ~ | ~ | ~ | ~ | ~ |
| Pellet diameter | ~ | ~ | 0.589 | ~ | ~ | ~ | ~ | ~ |
| Porosity | ~ | ~ | ~ | 0.789 | ~ | ~ | ~ | ~ |
| FeO | ~ | −0.669 | ~ | ~ | ~ | ~ | ~ | ~ |
| MgO | ~ | ~ | ~ | ~ | 0.898 | ~ | ~ | ~ |
| CaO | ~ | ~ | ~ | ~ | ~ | 0.898 | ~ | ~ |
| Al2O3 | ~ | ~ | ~ | ~ | ~ | ~ | ~ | 0.458 |
| Basicity (CaO/SiO2) | ~ | ~ | ~ | ~ | ~ | 0.758 | ~ | ~ |
| Burst temperature | ~ | ~ | ~ | ~ | ~ | ~ | −0.856 | ~ |
| CS of drying pellet | 0.655 | ~ | ~ | ~ | ~ | ~ | ~ | ~ |
| Bed depth | ~ | ~ | 0.985 | ~ | ~ | ~ | ~ | ~ |
| Firing temperature | ~ | 0.858 | ~ | ~ | ~ | ~ | ~ | ~ |
| Firing time | ~ | ~ | 0.854 | ~ | ~ | ~ | ~ | ~ |
| Gas consumption | ~ | 0.746 | ~ | ~ | ~ | ~ | ~ | ~ |
| Charging rate | ~ | ~ | −0.850 | ~ | ~ | ~ | ~ | ~ |
~ the score coefficient value is <0.1.
© 2018 by the authors. Licensee MDPI, Basel, Switzerland. This article is an open access article distributed under the terms and conditions of the Creative Commons Attribution (CC BY) license (http://creativecommons.org/licenses/by/4.0/).
Share and Cite
MDPI and ACS Style
Gao, Q.; Zhang, Y.; Jiang, X.; Zheng, H.; Shen, F. Prediction Model of Iron Ore Pellet Ambient Strength and Sensitivity Analysis on the Influence Factors. Metals 2018, 8, 593. https://doi.org/10.3390/met8080593
AMA Style
Gao Q, Zhang Y, Jiang X, Zheng H, Shen F. Prediction Model of Iron Ore Pellet Ambient Strength and Sensitivity Analysis on the Influence Factors. Metals. 2018; 8(8):593. https://doi.org/10.3390/met8080593
Chicago/Turabian StyleGao, Qiangjian, Yingyi Zhang, Xin Jiang, Haiyan Zheng, and Fengman Shen. 2018. "Prediction Model of Iron Ore Pellet Ambient Strength and Sensitivity Analysis on the Influence Factors" Metals 8, no. 8: 593. https://doi.org/10.3390/met8080593
Note that from the first issue of 2016, this journal uses article numbers instead of page numbers. See further details here.