4. Discussions
As is reported in
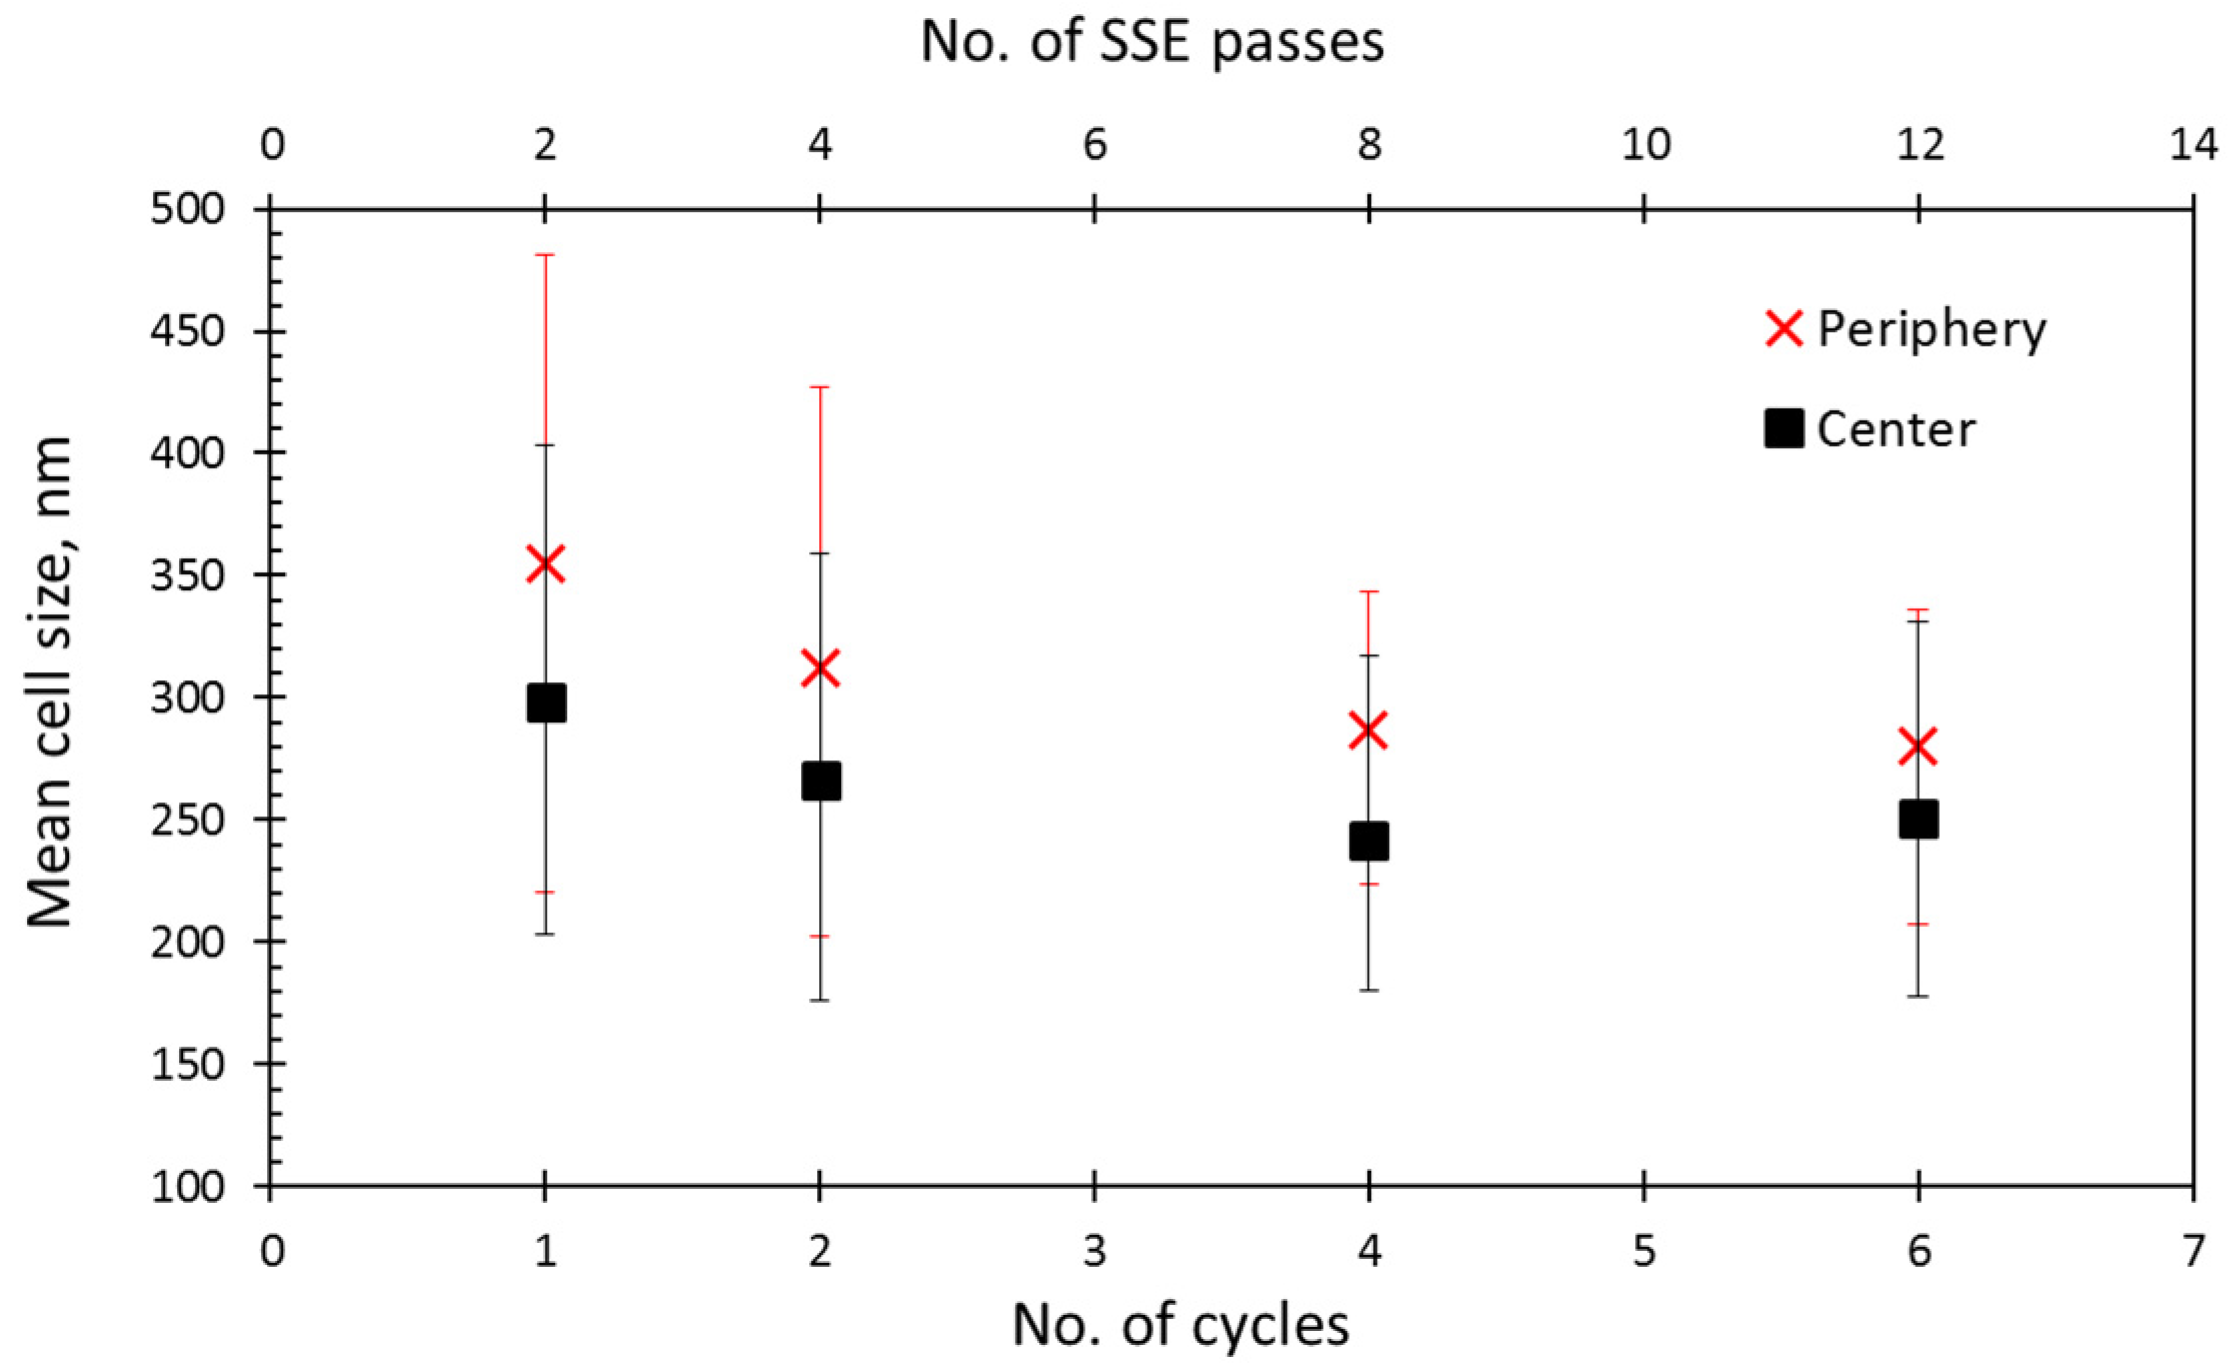
Section 3.1 and shown in
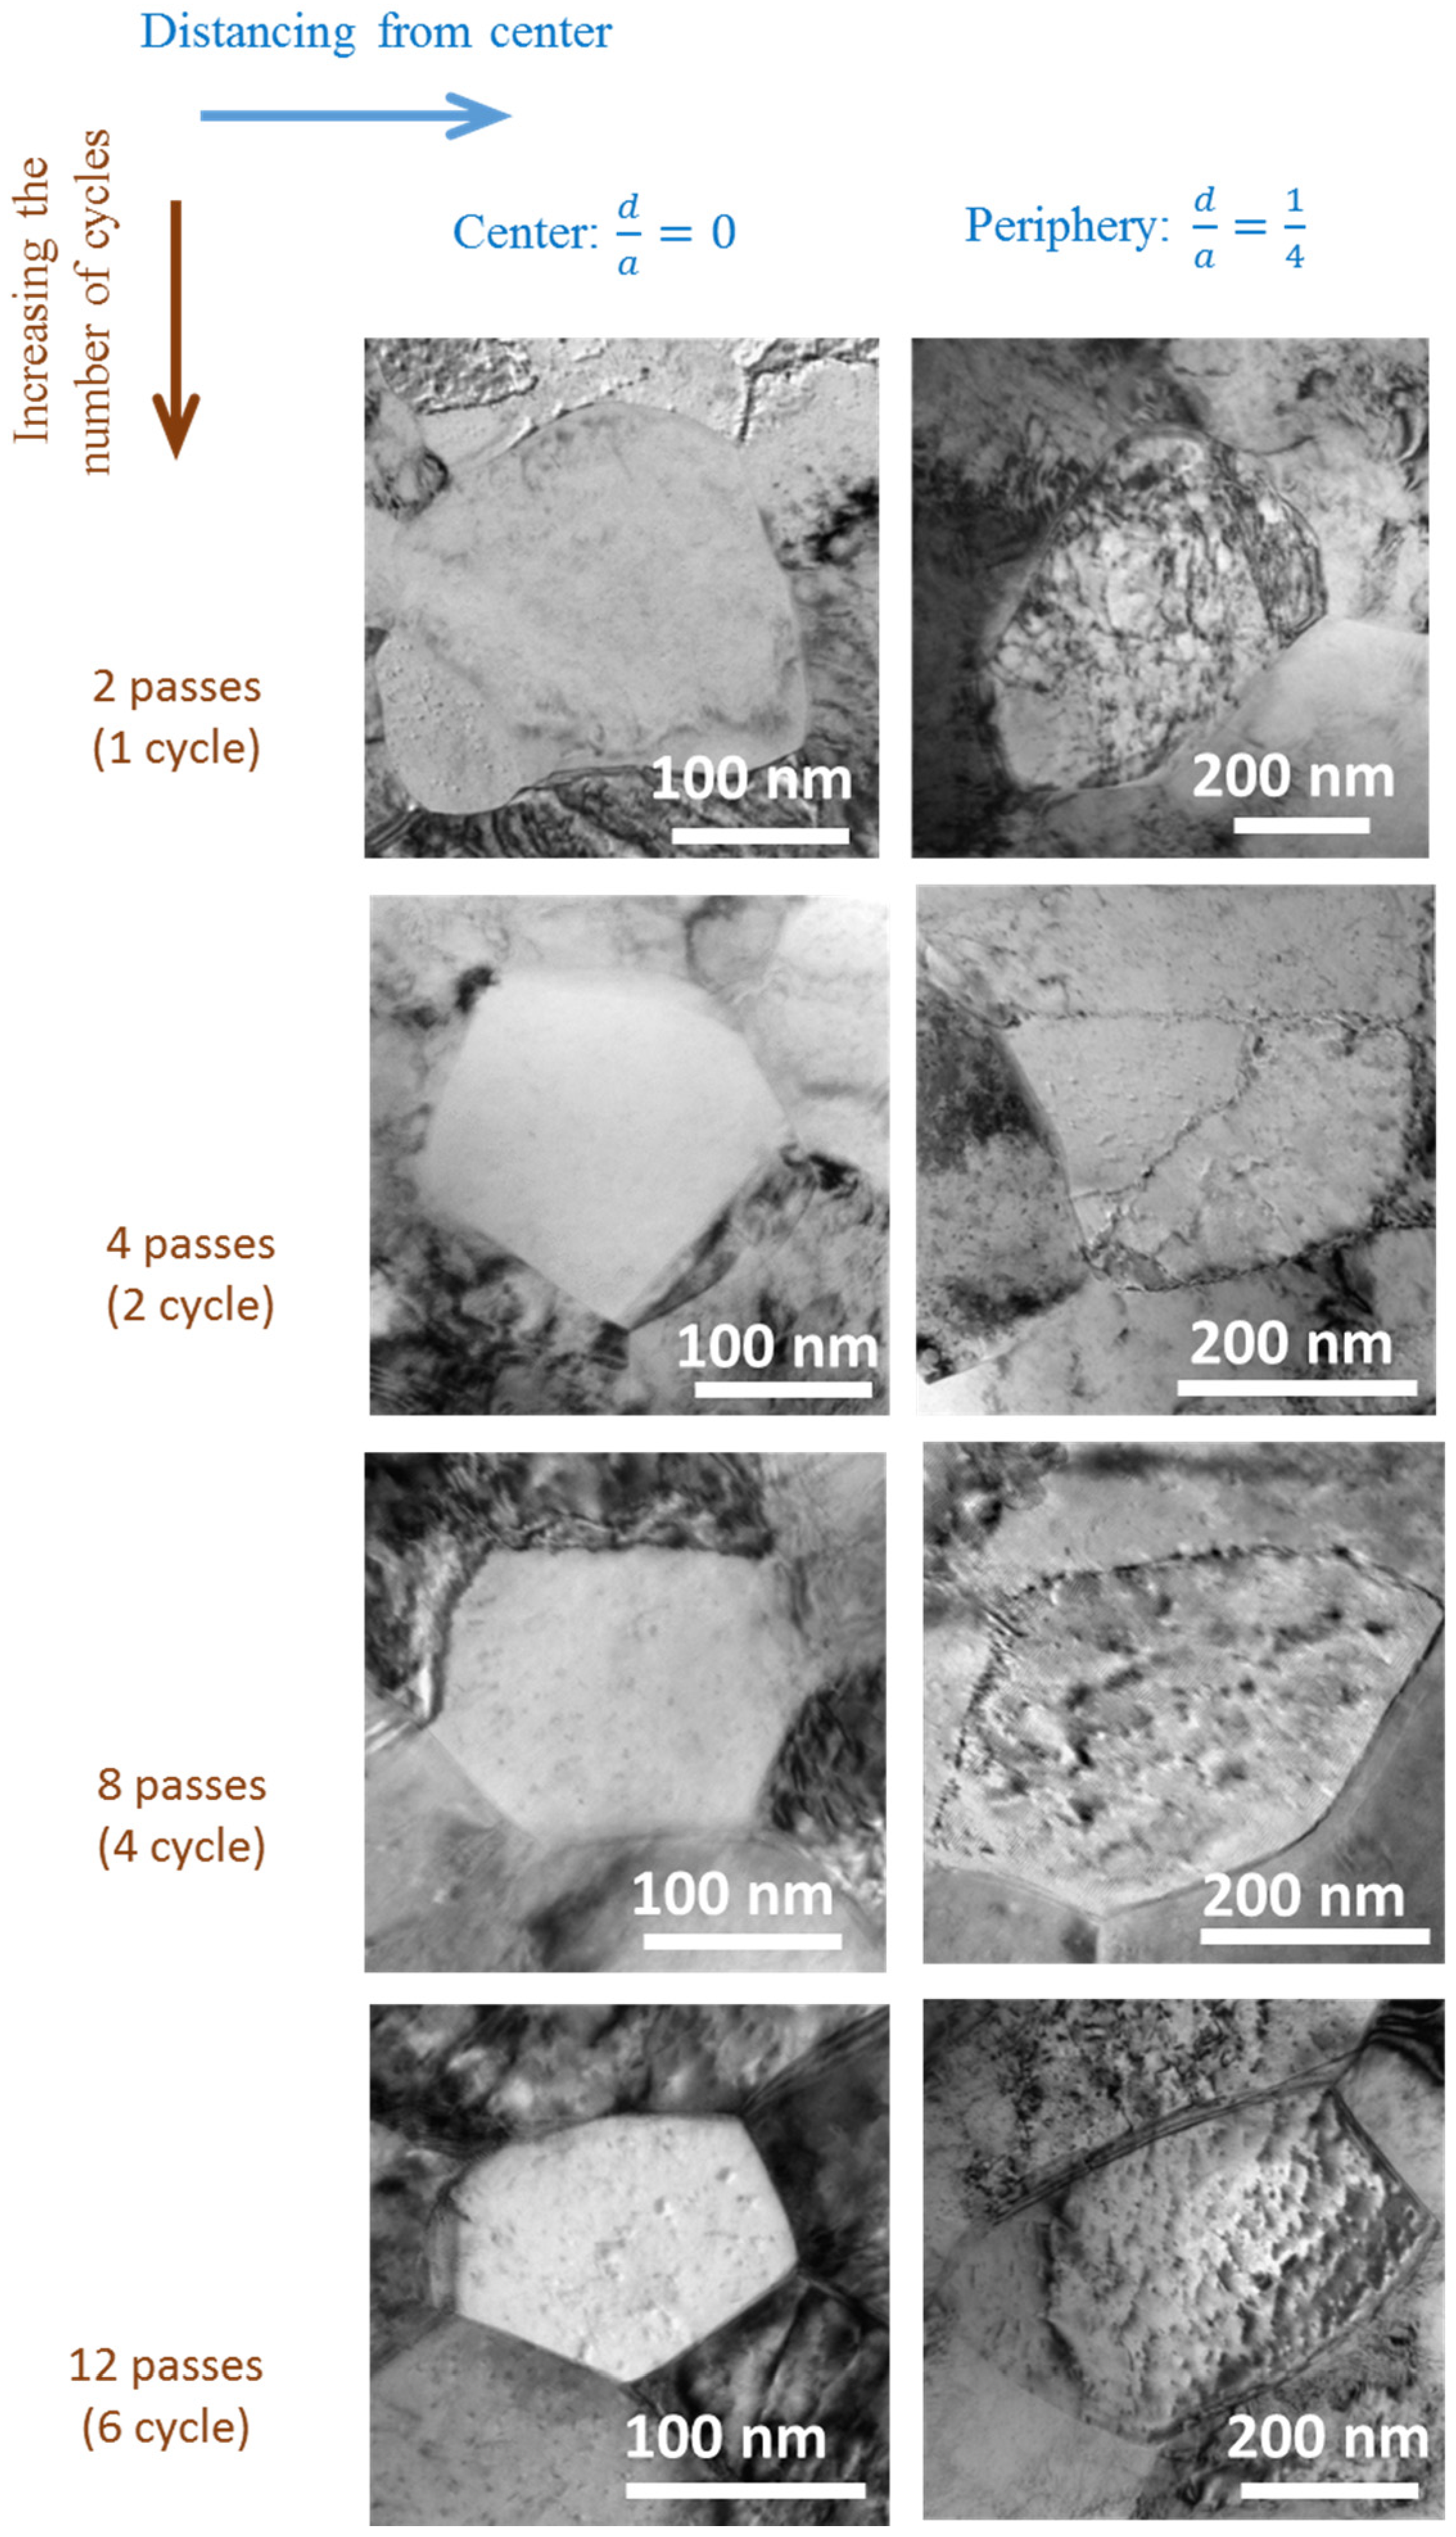
Figure 5, the minimum mean cell size of the center region was achieved after four cycles, whereas the decrease in the cell size of the periphery continued until the sixth cycle. The smaller grain size of the periphery is attributed to the lower strain in this region. This was reported previously for pure Al [
5,
10], pure Cu [
7,
8,
9], and twinning induced plasticity (TWIP) steel [
16,
17] in non-monotonic shear strains, both experimentally and by simulations. Different values of strain in the cross-section of the specimens can be described by the geometry of the process. At each quarter of a cycle, the die geometry forced the sample to move laterally in a simple shear manner. Consequently, the strain developed along a diagonal of the initial square cross-section. At the second quarter of a cycle, this phenomenon occurred in a reverse manner, in which strain contours proliferated along the other diagonal. As a result, the strain at the center was the highest, and decreasesd gradually from the center to the periphery symmetrically.
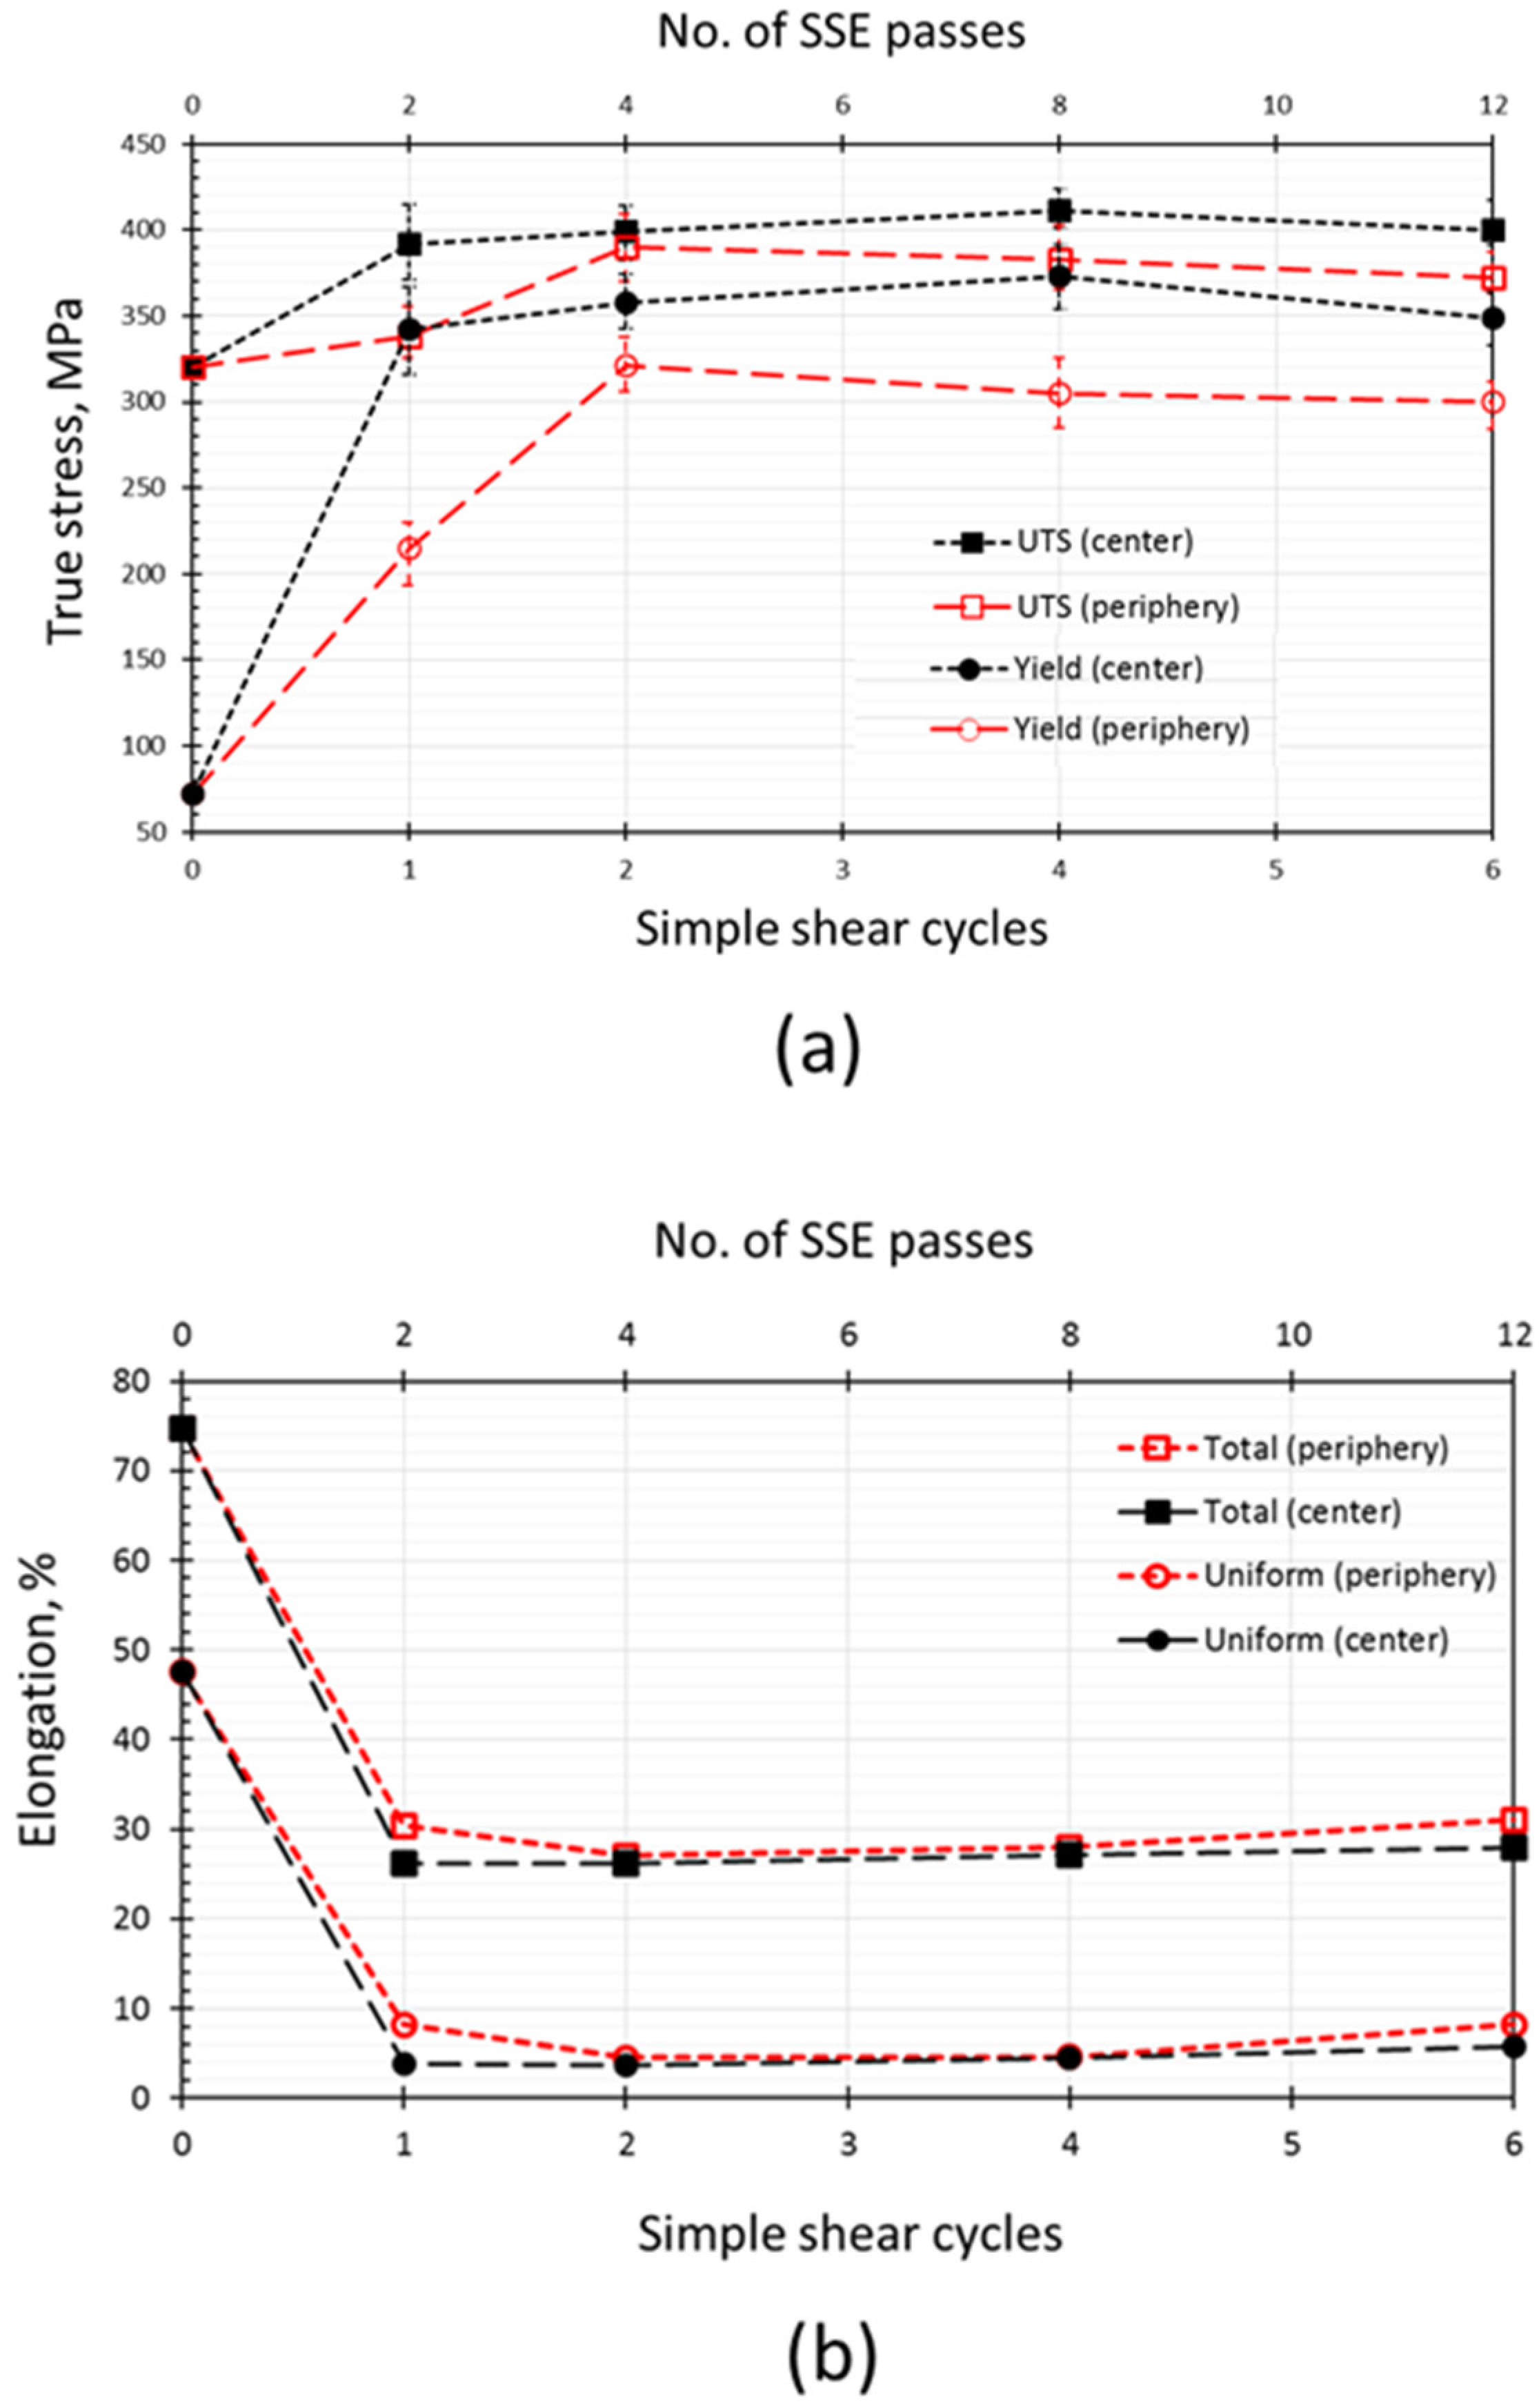
Paying attention to
Figure 10a, the yield strength increased as the strain increased, cycle by cycle; it reached a maximum value, and then a small drop took place steadily. That the yield strength of the periphery is lower than that of the center is due to the lower effective strain in the periphery compared to the center. However, the point that these maximum values (yield strength) are not equal in the center and the periphery does not seem justifiable. In other words, since the theoretical accumulated strain of the periphery reaches that of the center but in higher passes, normally it is expected that the yield strength in the periphery reaches that of the center, but with a delay. However, it never reaches that value. This shows that the deformation mode is not the same in all of the regions of the cross-section of the sample. In addition, although in the center region, the variation of the tensile properties is consistent with the cell size changes; by distancing from the center, there are some deviations from the behavior that is predictable from the grain size (see
Figure 10). According to the Hall–Petch relationship [
18,
19], the flow stress of a material corresponds inversely to the square root of its mean grain size. Therefore, it is reasonable to expect the ongoing increase in the strength of the periphery from 0 to six cycles where the cell size decreases gradually within this range. Nevertheless, unexpectedly, the maximum strength in the periphery was achieved after two cycles, and the yield strength and UTS decreased from two to six cycles. To justify these contradictions, note that beyond the proportion of the grain boundaries (high fraction of grain boundaries corresponds to the smaller grain size), other mechanisms and parameters can affect the strength of a material.
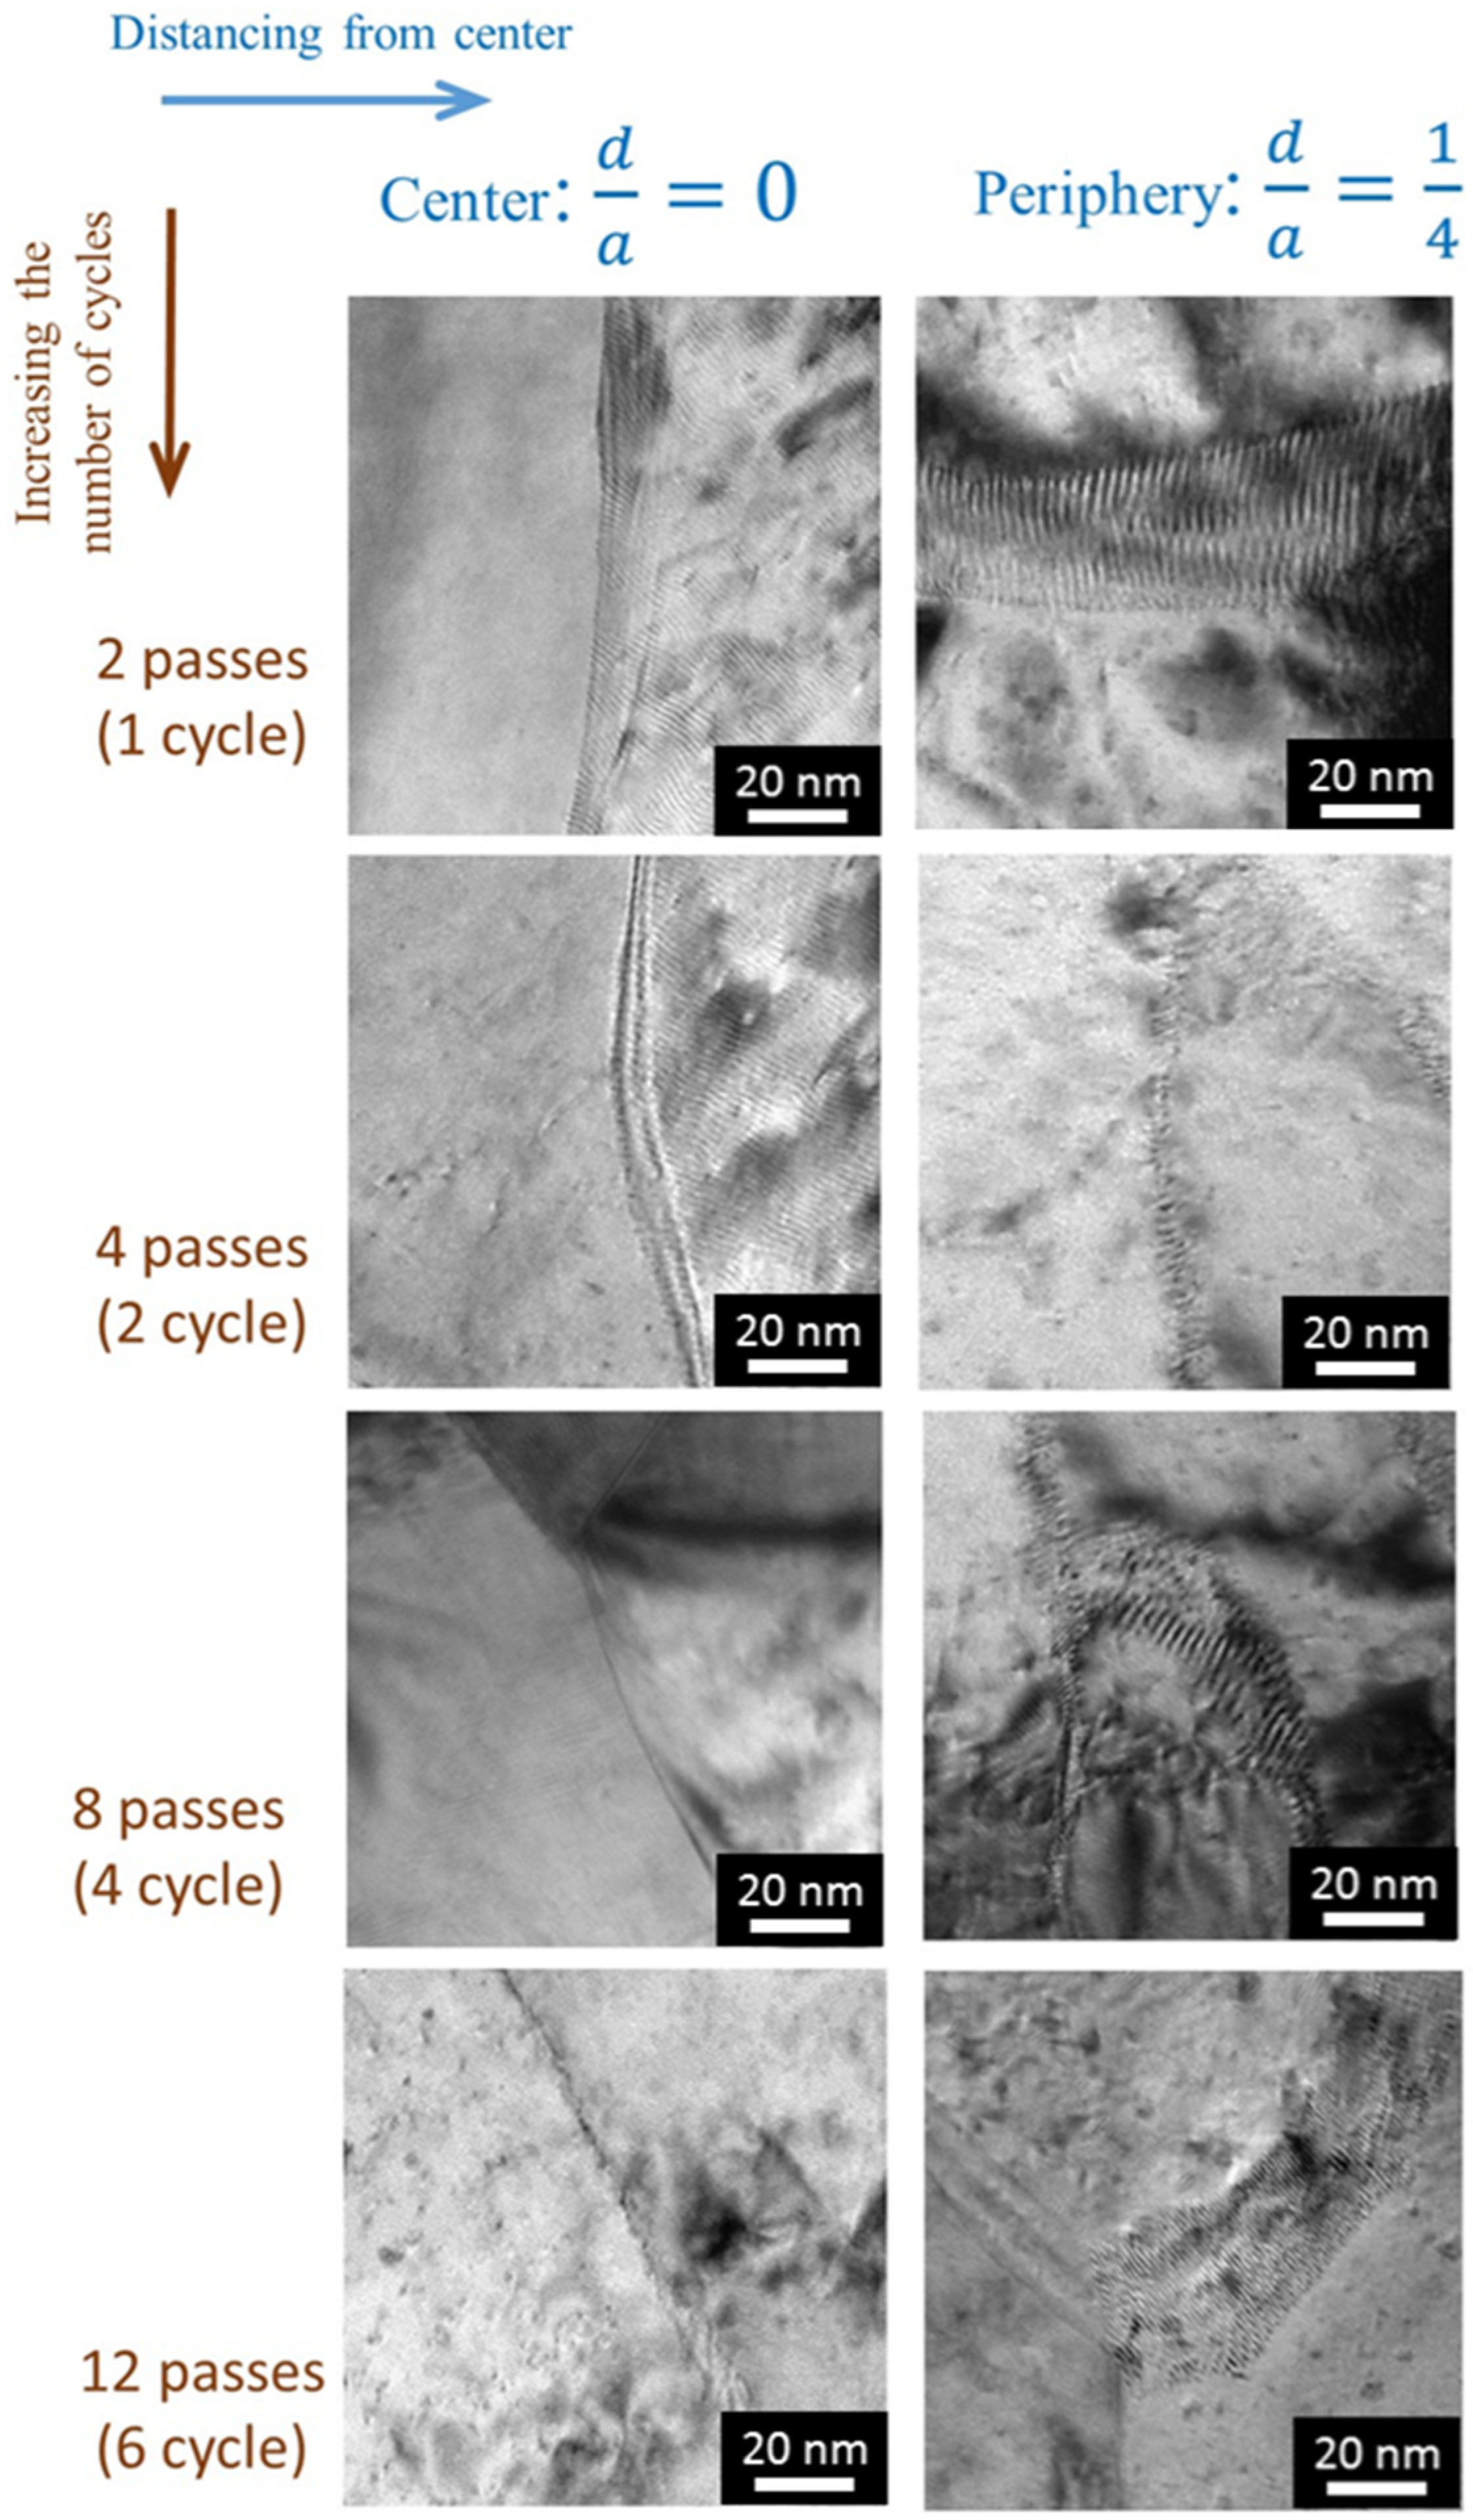
Cells morphology is the fundamental issue that should be taken into account. In FCC metals, large grains tend to refine by dislocation activities such as dislocation gliding, accumulation, interaction, tangling, and spatial rearrangement. According to the grain subdivision mechanism [
20], through plastic deformation, dislocation accumulation results in the formation of the non-equilibrium grain boundaries [
21], which introduces an excess energy and elastic stresses into the structure. The development of the accumulation of dislocations into the dislocation boundaries results in the formation of two types of dislocation boundaries with different morphologies: the incidental dislocation boundaries (IDBs) and the geometrically necessary boundaries (GNBs) [
22]. The IDBs have mainly a tangled dislocation structure, are formed by the reciprocated trapping of glide dislocations, and subdivide the grains into cells. On the other hand, the activation of different slip system in adjacent grains or the partitioning of total shear strain among a set of slip planes results in the formation of GNBs. More plastic strain leads to a decrease in the boundary spacing of both IDBs, and GNBs increases in the misorientation angle. The gradual change of the dislocation boundaries that were produced at low strains into the high-angle boundaries at large strains is called the in situ or continuous dynamic recrystallization [
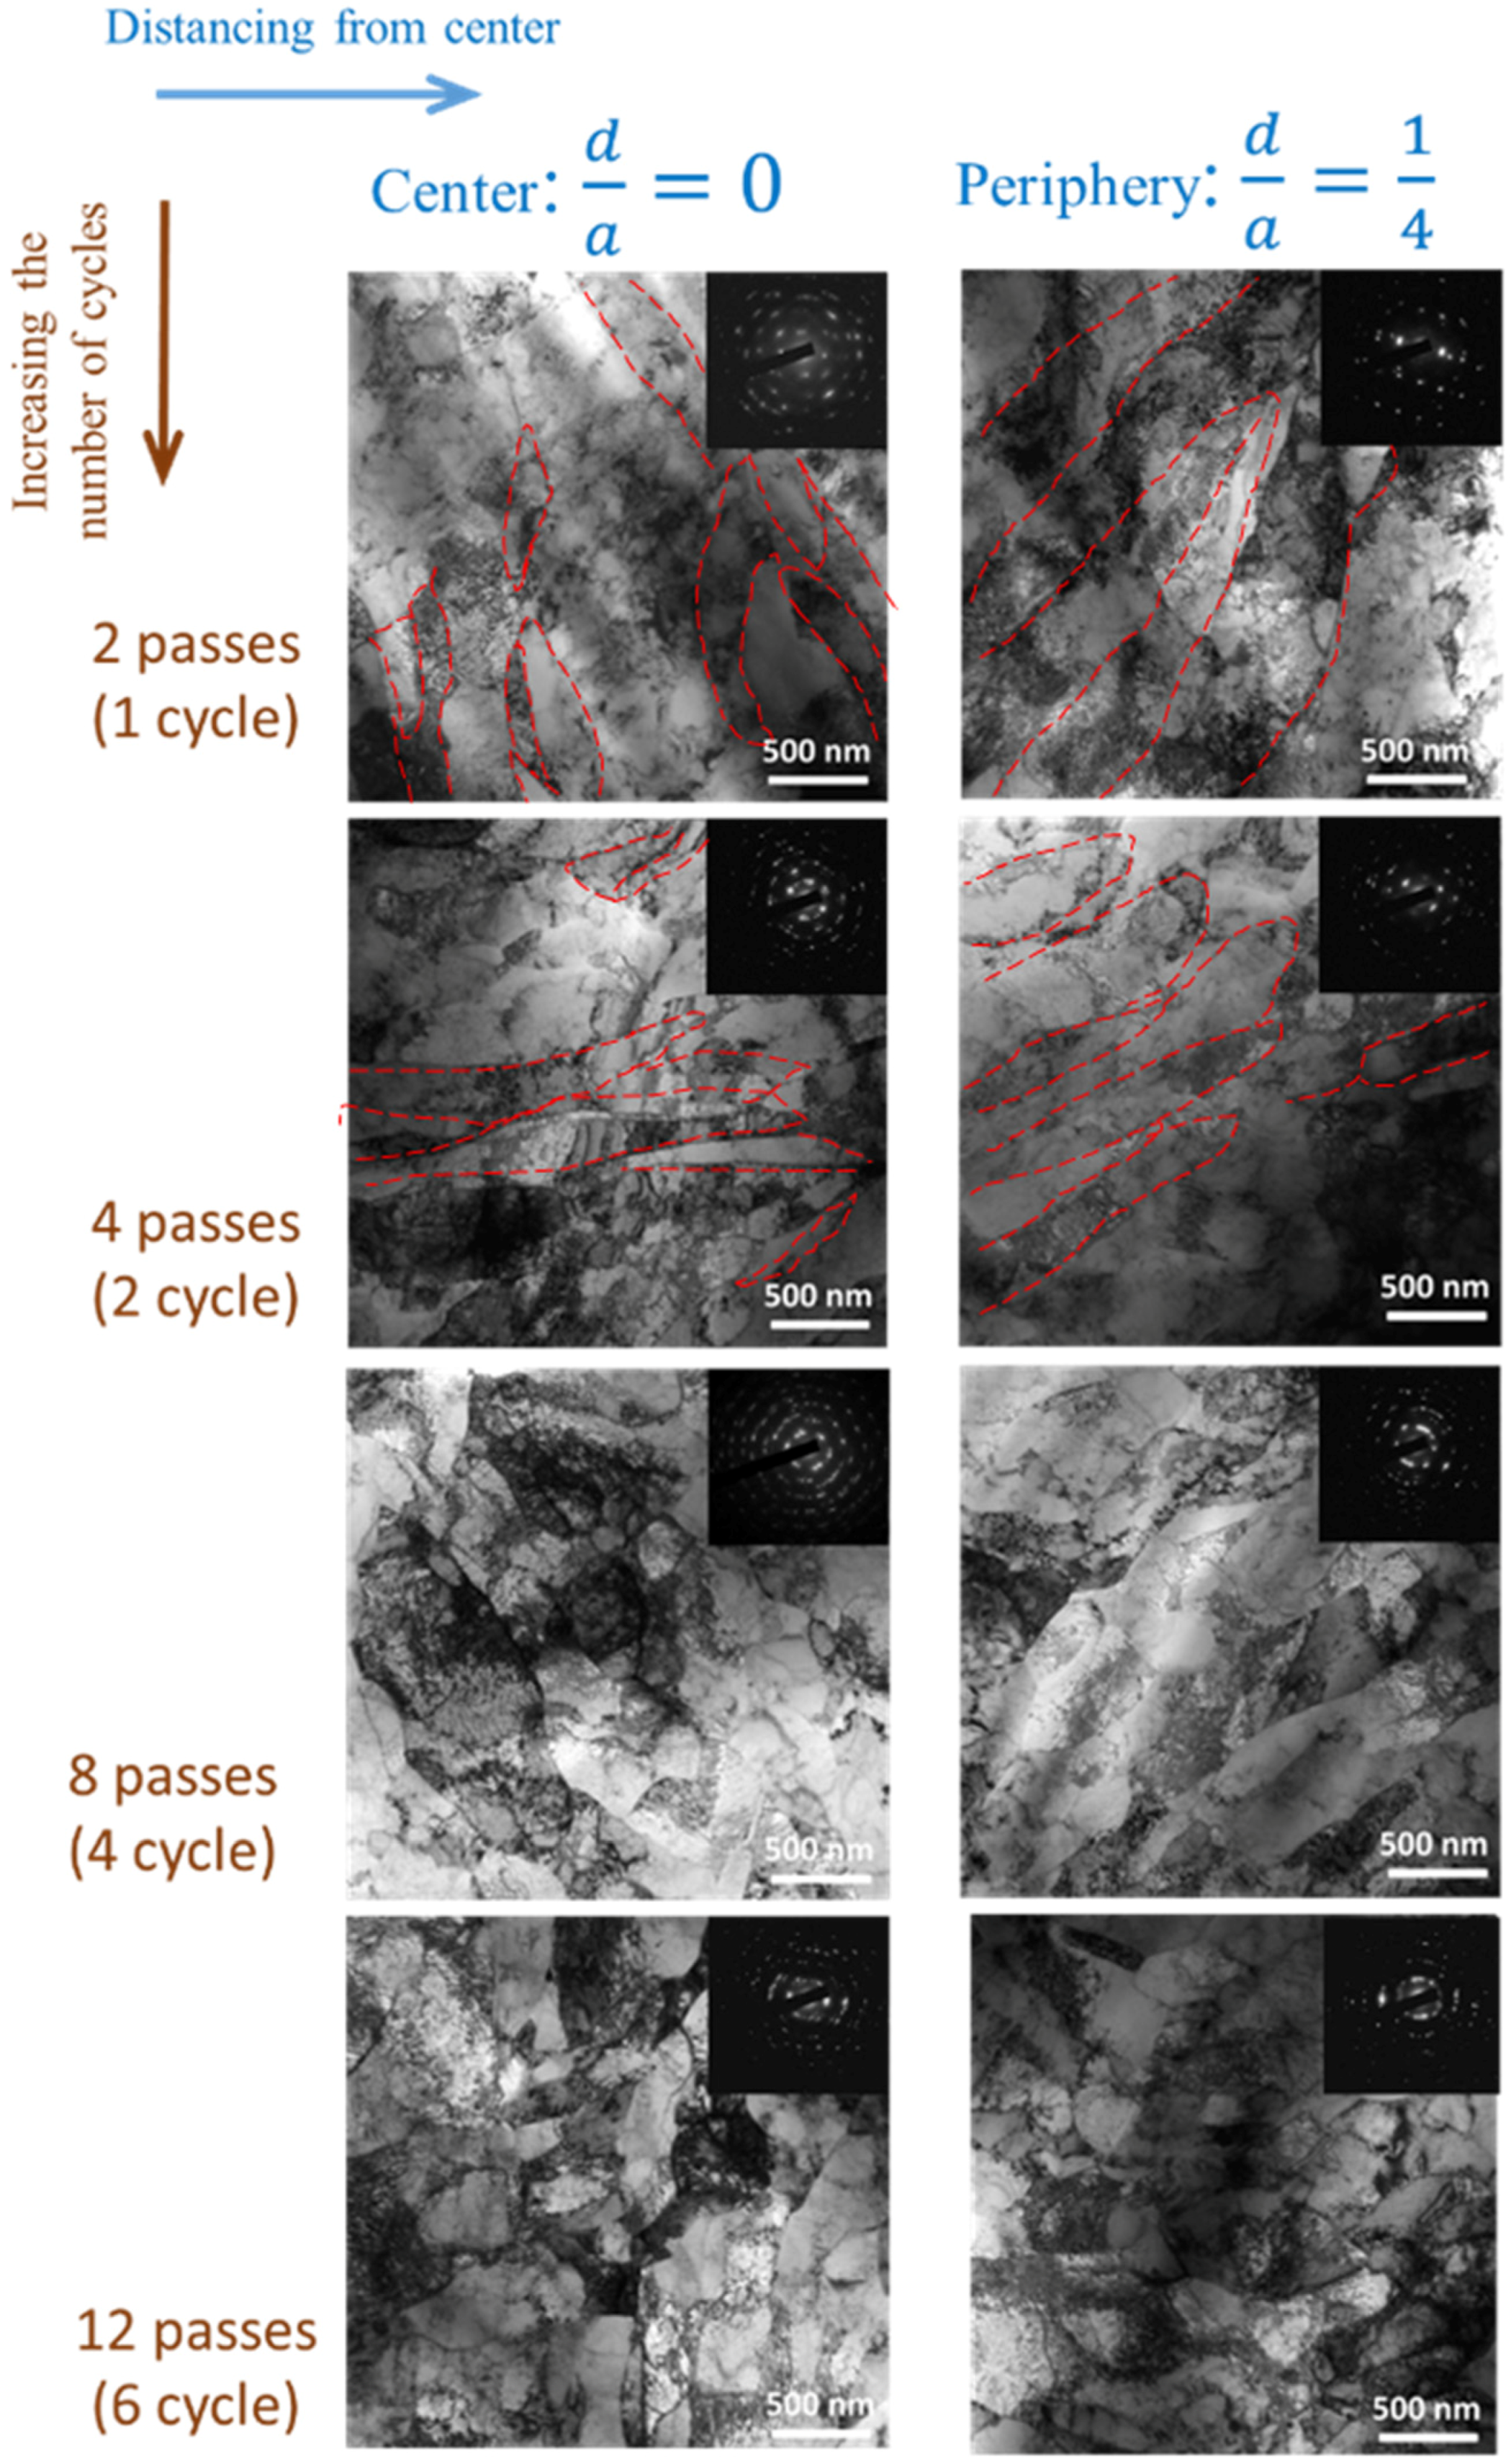
23]. This mechanism is responsible for the grain refinement in the forward shear. Therefore, in large strains, smaller grains (cells) show more resistance to the grain refinement. As shown in
Figure 6, the smallest detected cells in the center of the samples are mostly free of dislocations with sharp, high-angle boundaries. The trend of change in the size of smallest cells (see the lower range of error bars in
Figure 8) in the center region is same as the variation of mean cell size. On the other hand, several dislocations are visible in the smallest cells in the periphery, which is achieved after two cycles (see the lower range of error bars in
Figure 8). Also, this cell has lower dislocations. Besides, two of its boundaries are high-angle boundaries. Finally, it can be concluded that the variation in the strength in each region is similar to the variation in the size of the smallest cells in that region.
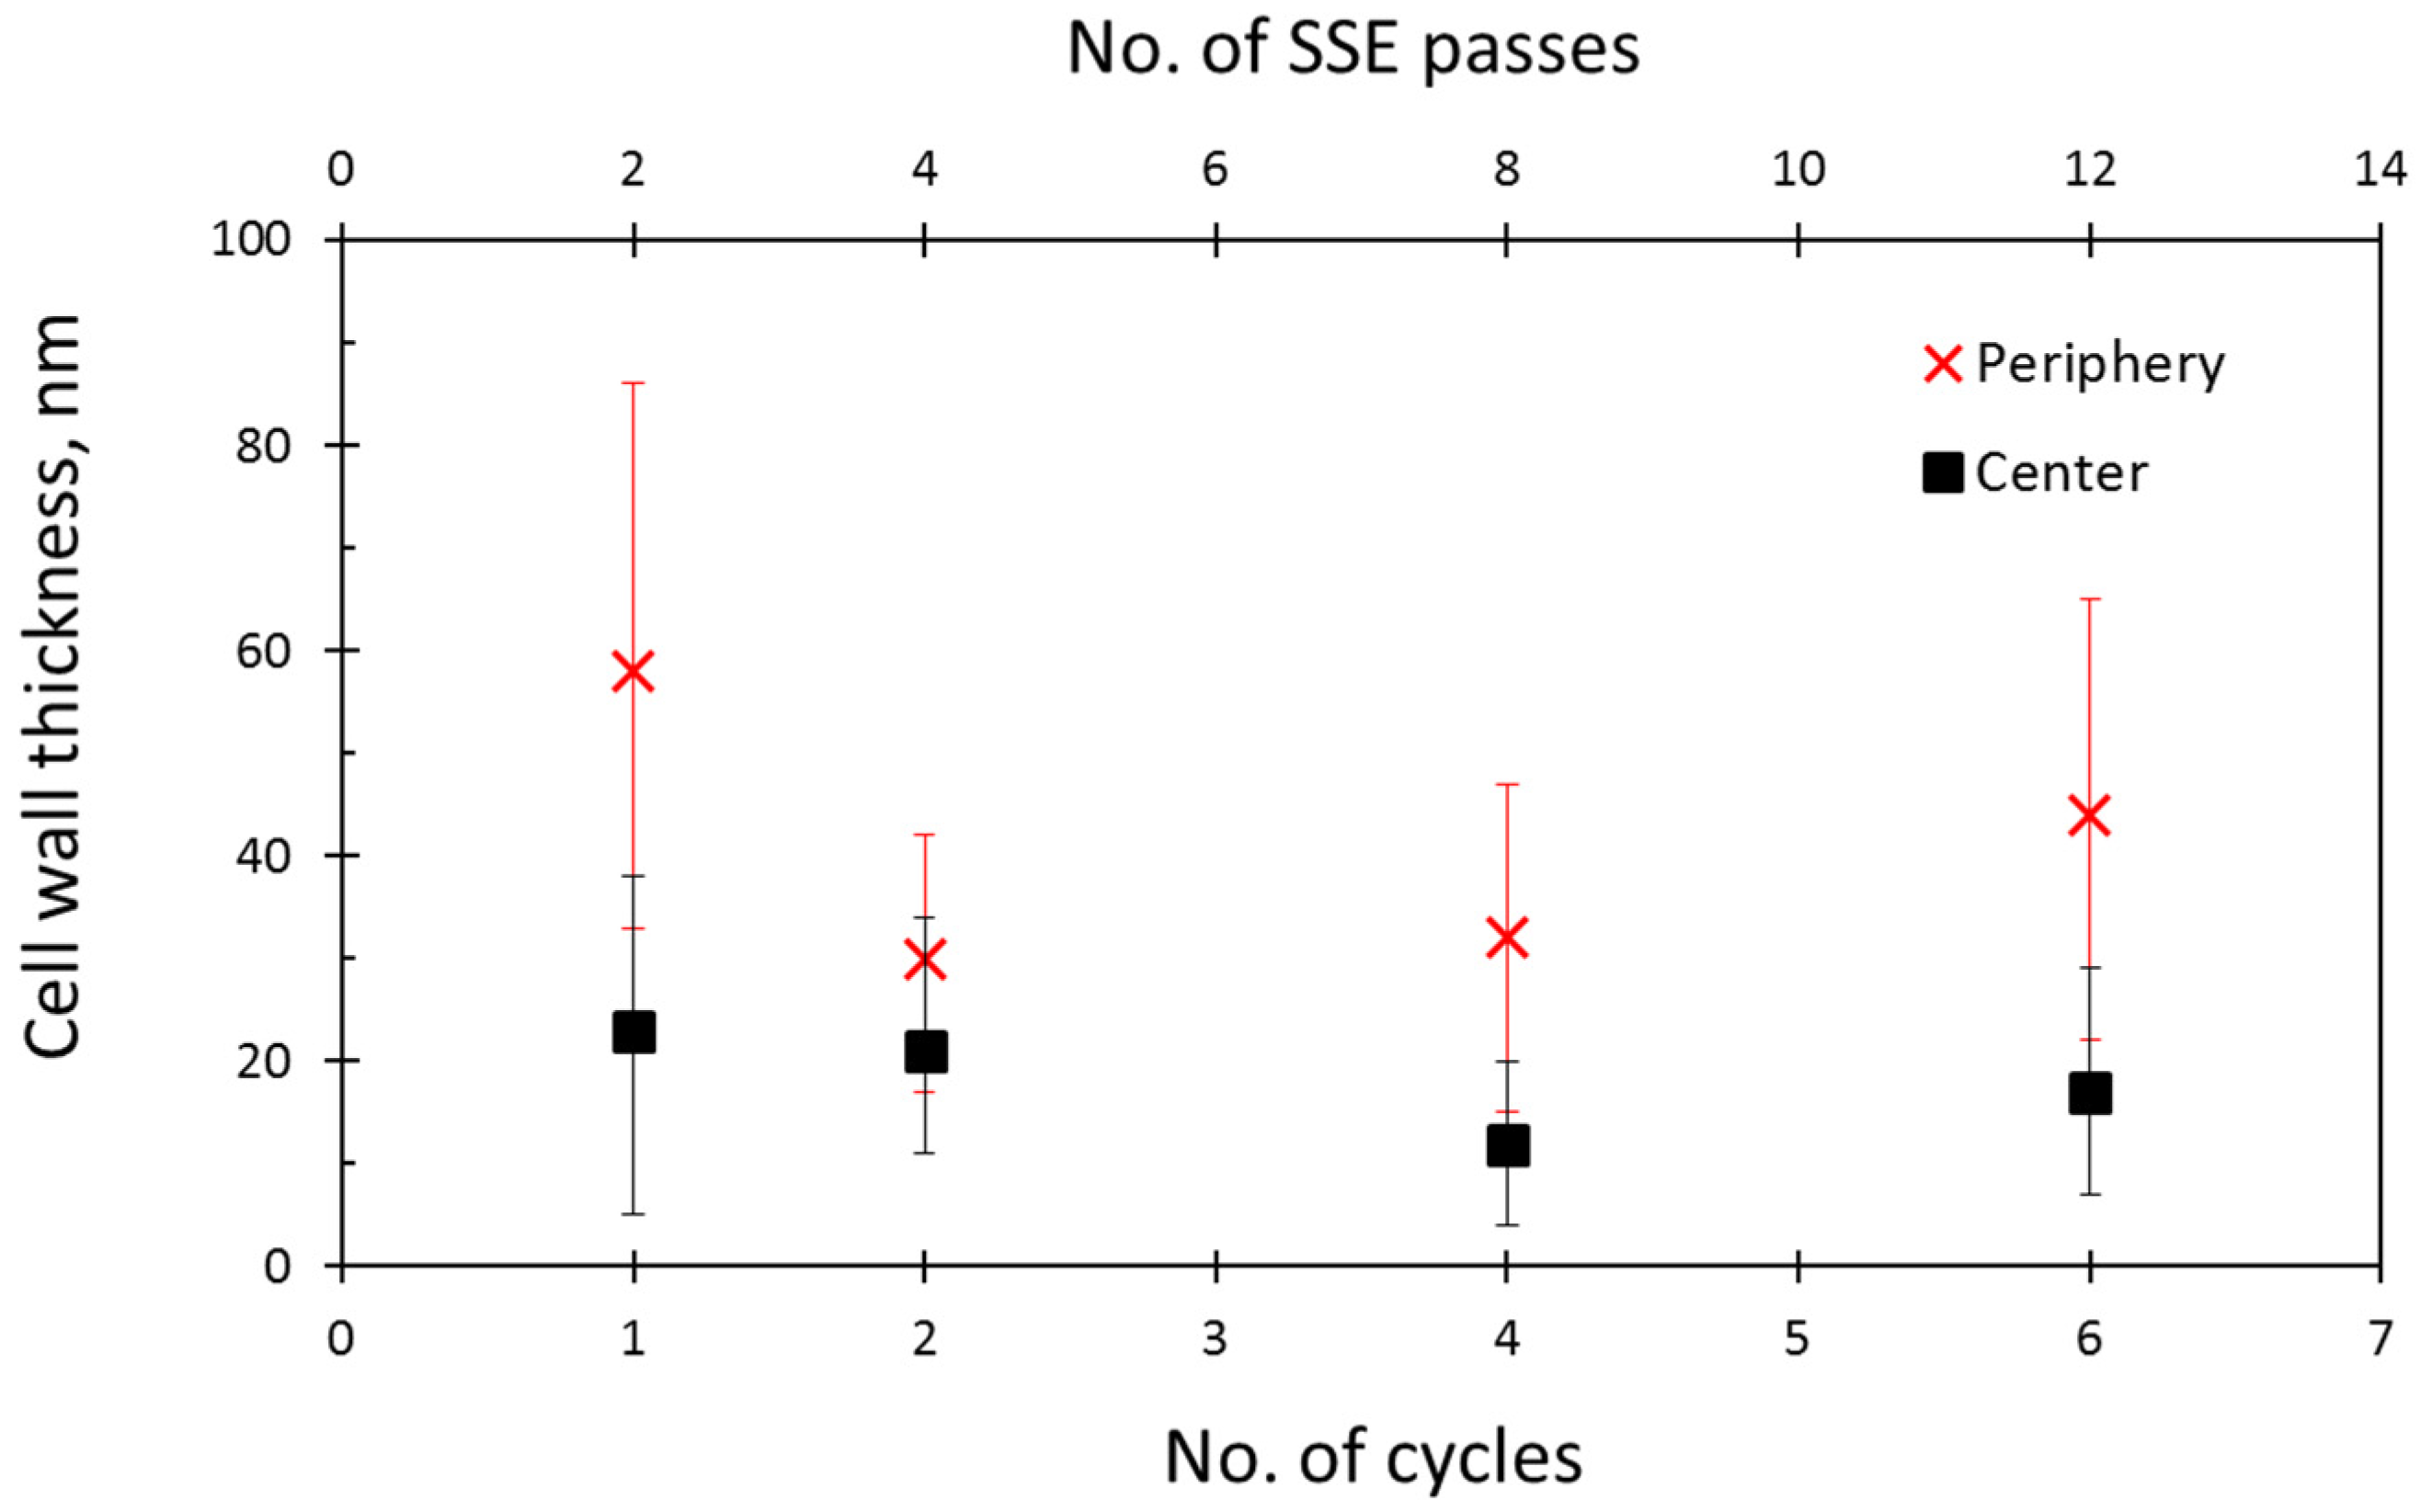
The second parameter that is responsible for the dissemination of the tensile behavior is the CWT. As discussed in
Section 3.1, for the center and the periphery, the cell walls became thinner from 0 to four cycles and from 0 to two cycles, respectively. For the center, the trend of variation in the CWT is similar to the trend of change in the cell size. On the other hand, in the periphery, the CWT changes in a different manner from the grain size. The minimum CWT was achieved after four and two cycles for the center and the periphery, respectively. Since thinner cell walls are better obstacles for the dislocation activities, higher strength is seen in the specimens or regions with thinner cell walls.
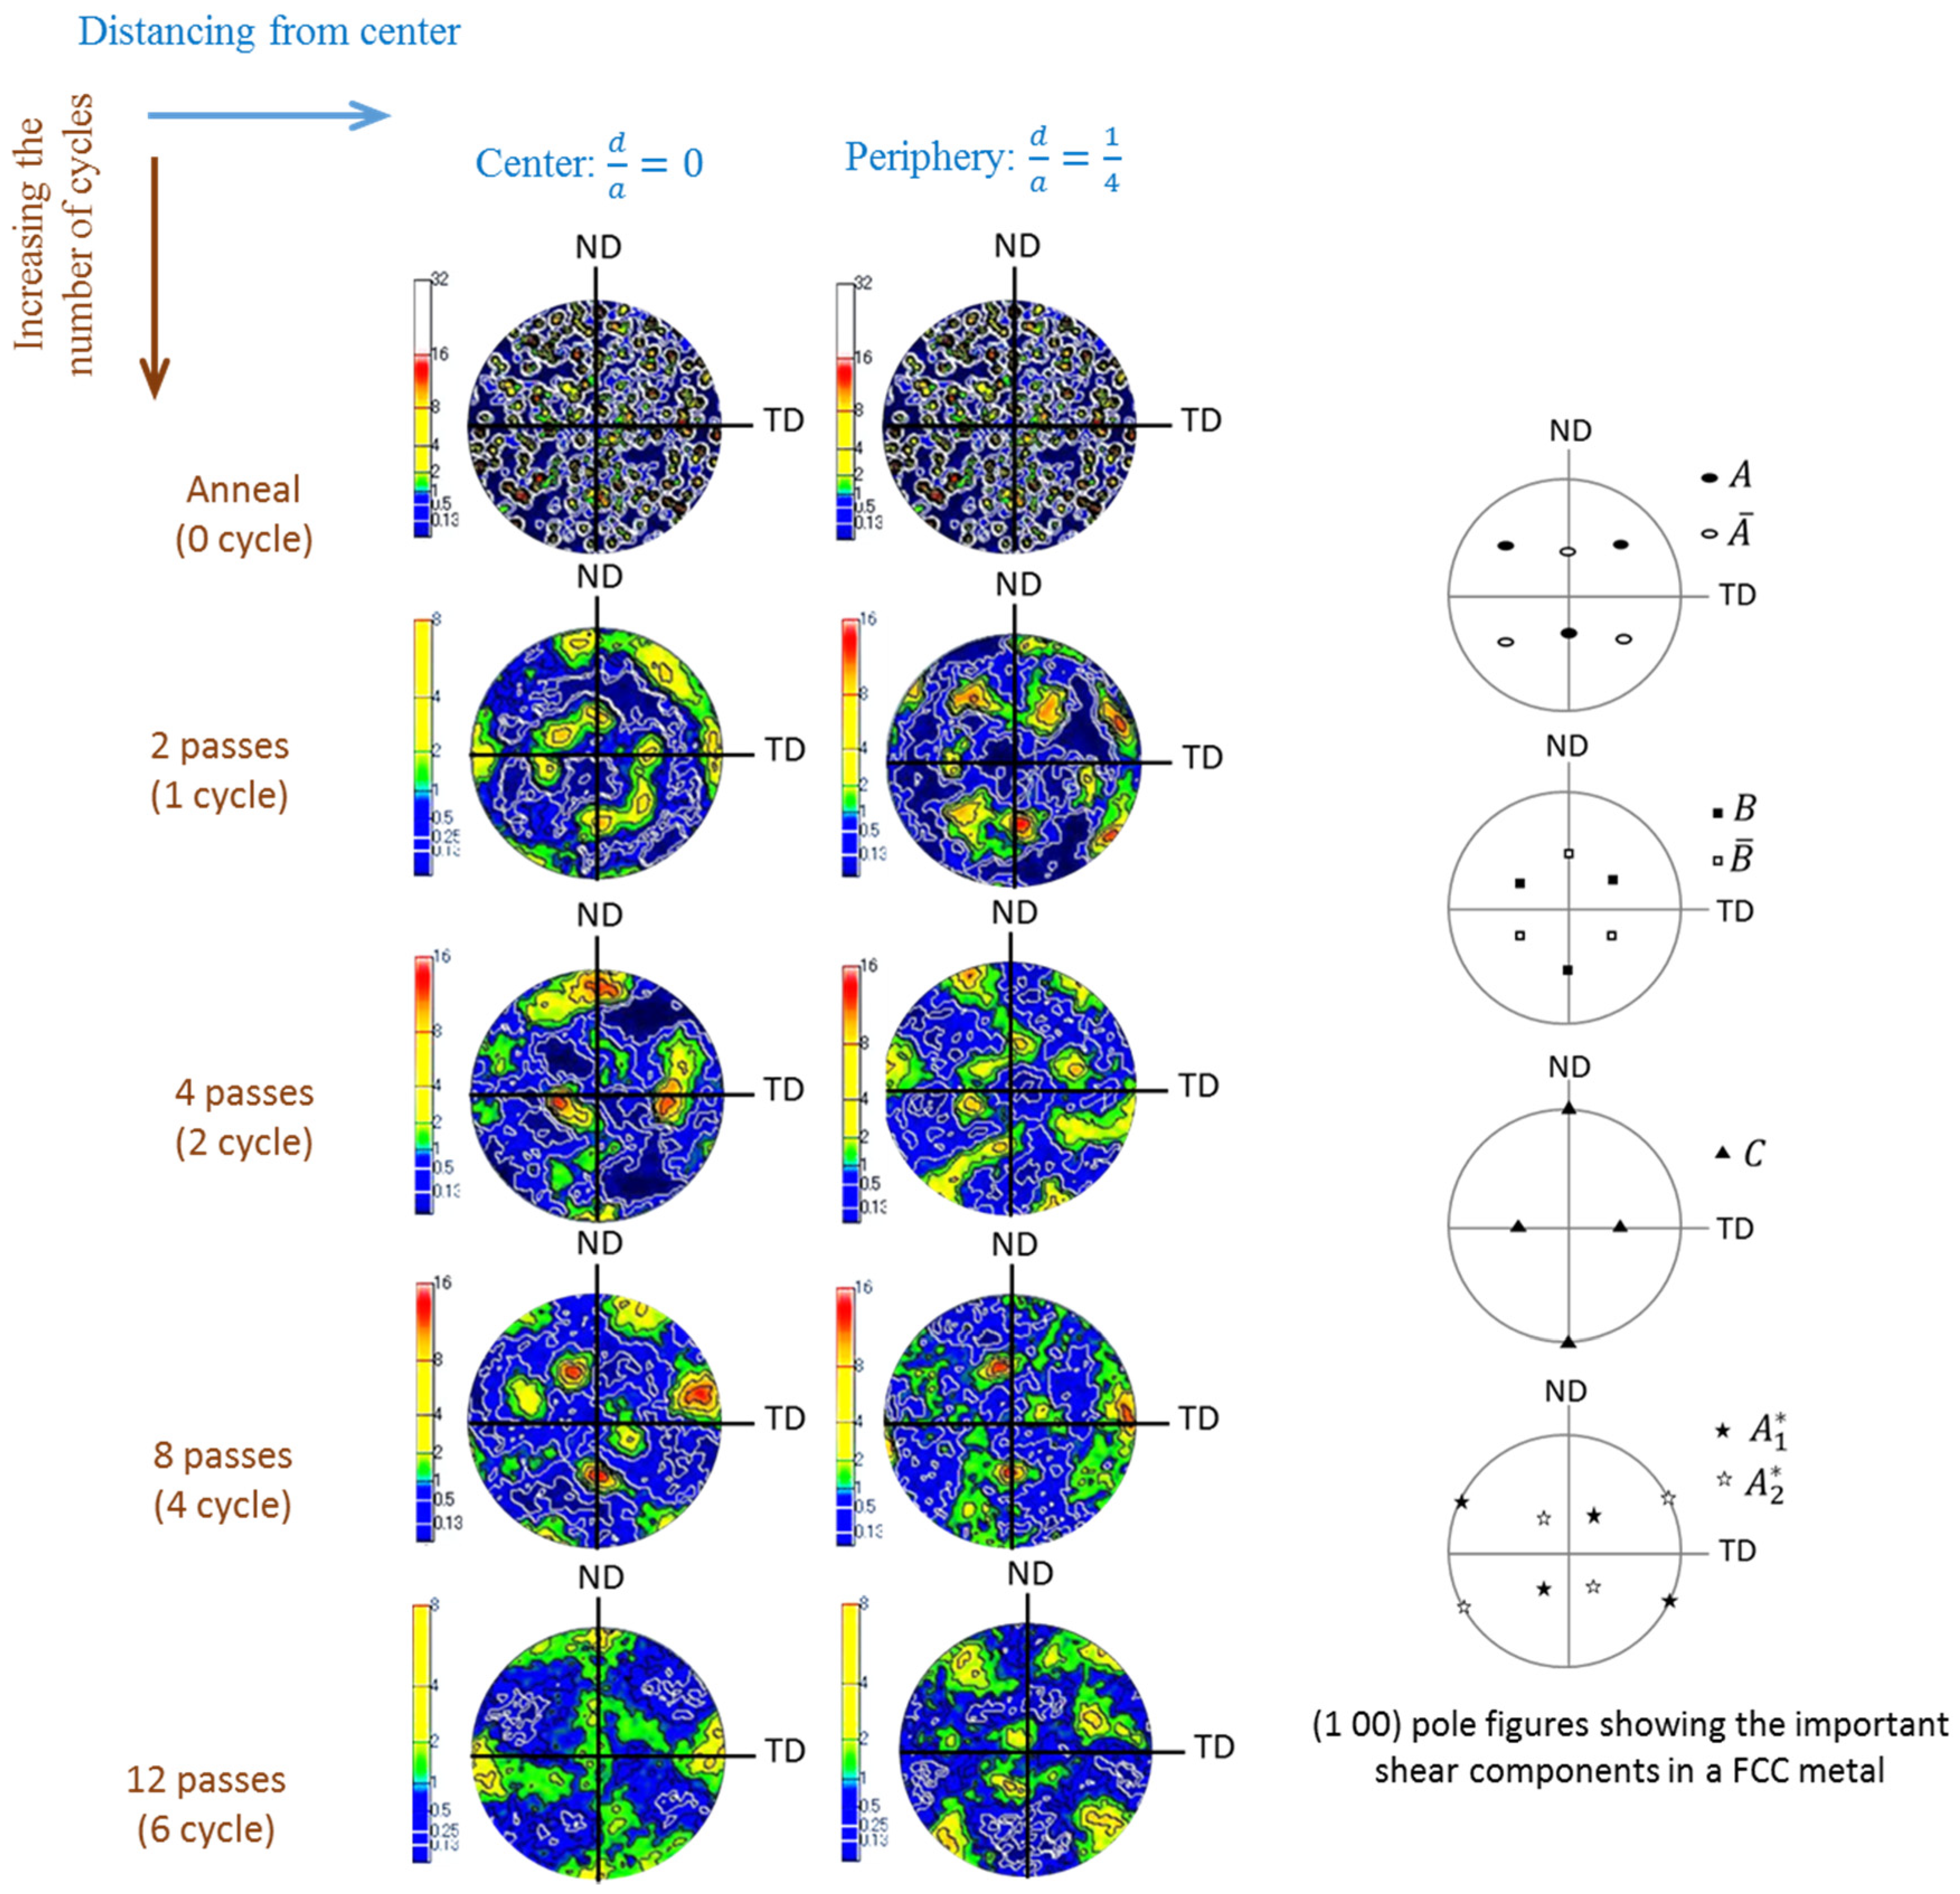
The last parameter involving the tensile behavior of a material is its texture. From the results of
Section 3.2, it is obvious that after multi-cycles of non-monotonic shear straining, the subsequent texture of the samples is more random, and resembles the dominant textures in simple shear less. In both the center and the periphery of the Cu sample after large non-monotonic shear strains, the dominant shear textures were
and
orientations, but with different intensities. The intensity of the simple shear textures was higher in the periphery. However, despite the lower intensity of the shear textures in the periphery, that of the
component (C component) of the simple shear texture is equal to the intensity of the aforementioned textures of
and
. To relate the texture of a material to its mechanical behavior, the qualitative analysis of the texture is not sufficient, and it is important to investigate the texture quantitatively.
According to the Taylor model [
24], during the deformation of a polycrystalline material, all of the grains experience the same shape change in order to minimize the energy consumed in the slip. The aforementioned model reveals that the general shape change achieved a homogeneous slip on five independent slip systems, assuming the same critical resolved shear stress for all of the active slip systems. Having the critical resolved shear stress on each of the activated slip systems (
) and the externally applied stress (
), Taylor factor (M) has been defined as
. It is clear that the Taylor factor is supposed to determine the stresses required to activate a slip system, which essentially means that M plays an important role in the tensile behavior of a polycrystalline material. The importance of M in the strengthening of a material can be concluded from its contribution in the dislocation strengthening (
[
25,
26] as follows:
in which
G is the shear modules,
α is a numerical factor,
b is the Burgers vector, and
ρ is the dislocation density that is stored in both the cells’ boundaries and the cells’ interiors.
Figure 11 shows the variation of the Taylor factor by increasing the non-monotonic cyclic shear strains in the center and periphery of the Cu samples. As observed, for all of the passes, the value of the
M is higher for the center region. The least difference between the Taylor factor of the center and the periphery is seen in the sample of two cycles (four passes), which is consistent with the variation of the tensile behavior (see
Figure 10). For both the center and the periphery, the Taylor factor increases in the first cycle, where it achieves its highest value, and decreases sharply after that, from one to two cycles. Interestingly, in the center region after two cycles, the
M value remains approximately constant. On the other hand,
M decreases gradually from two to six cycles in the periphery. The discussed behavior can describe the dissimilar tensile behavior of the center and the periphery of the samples well.
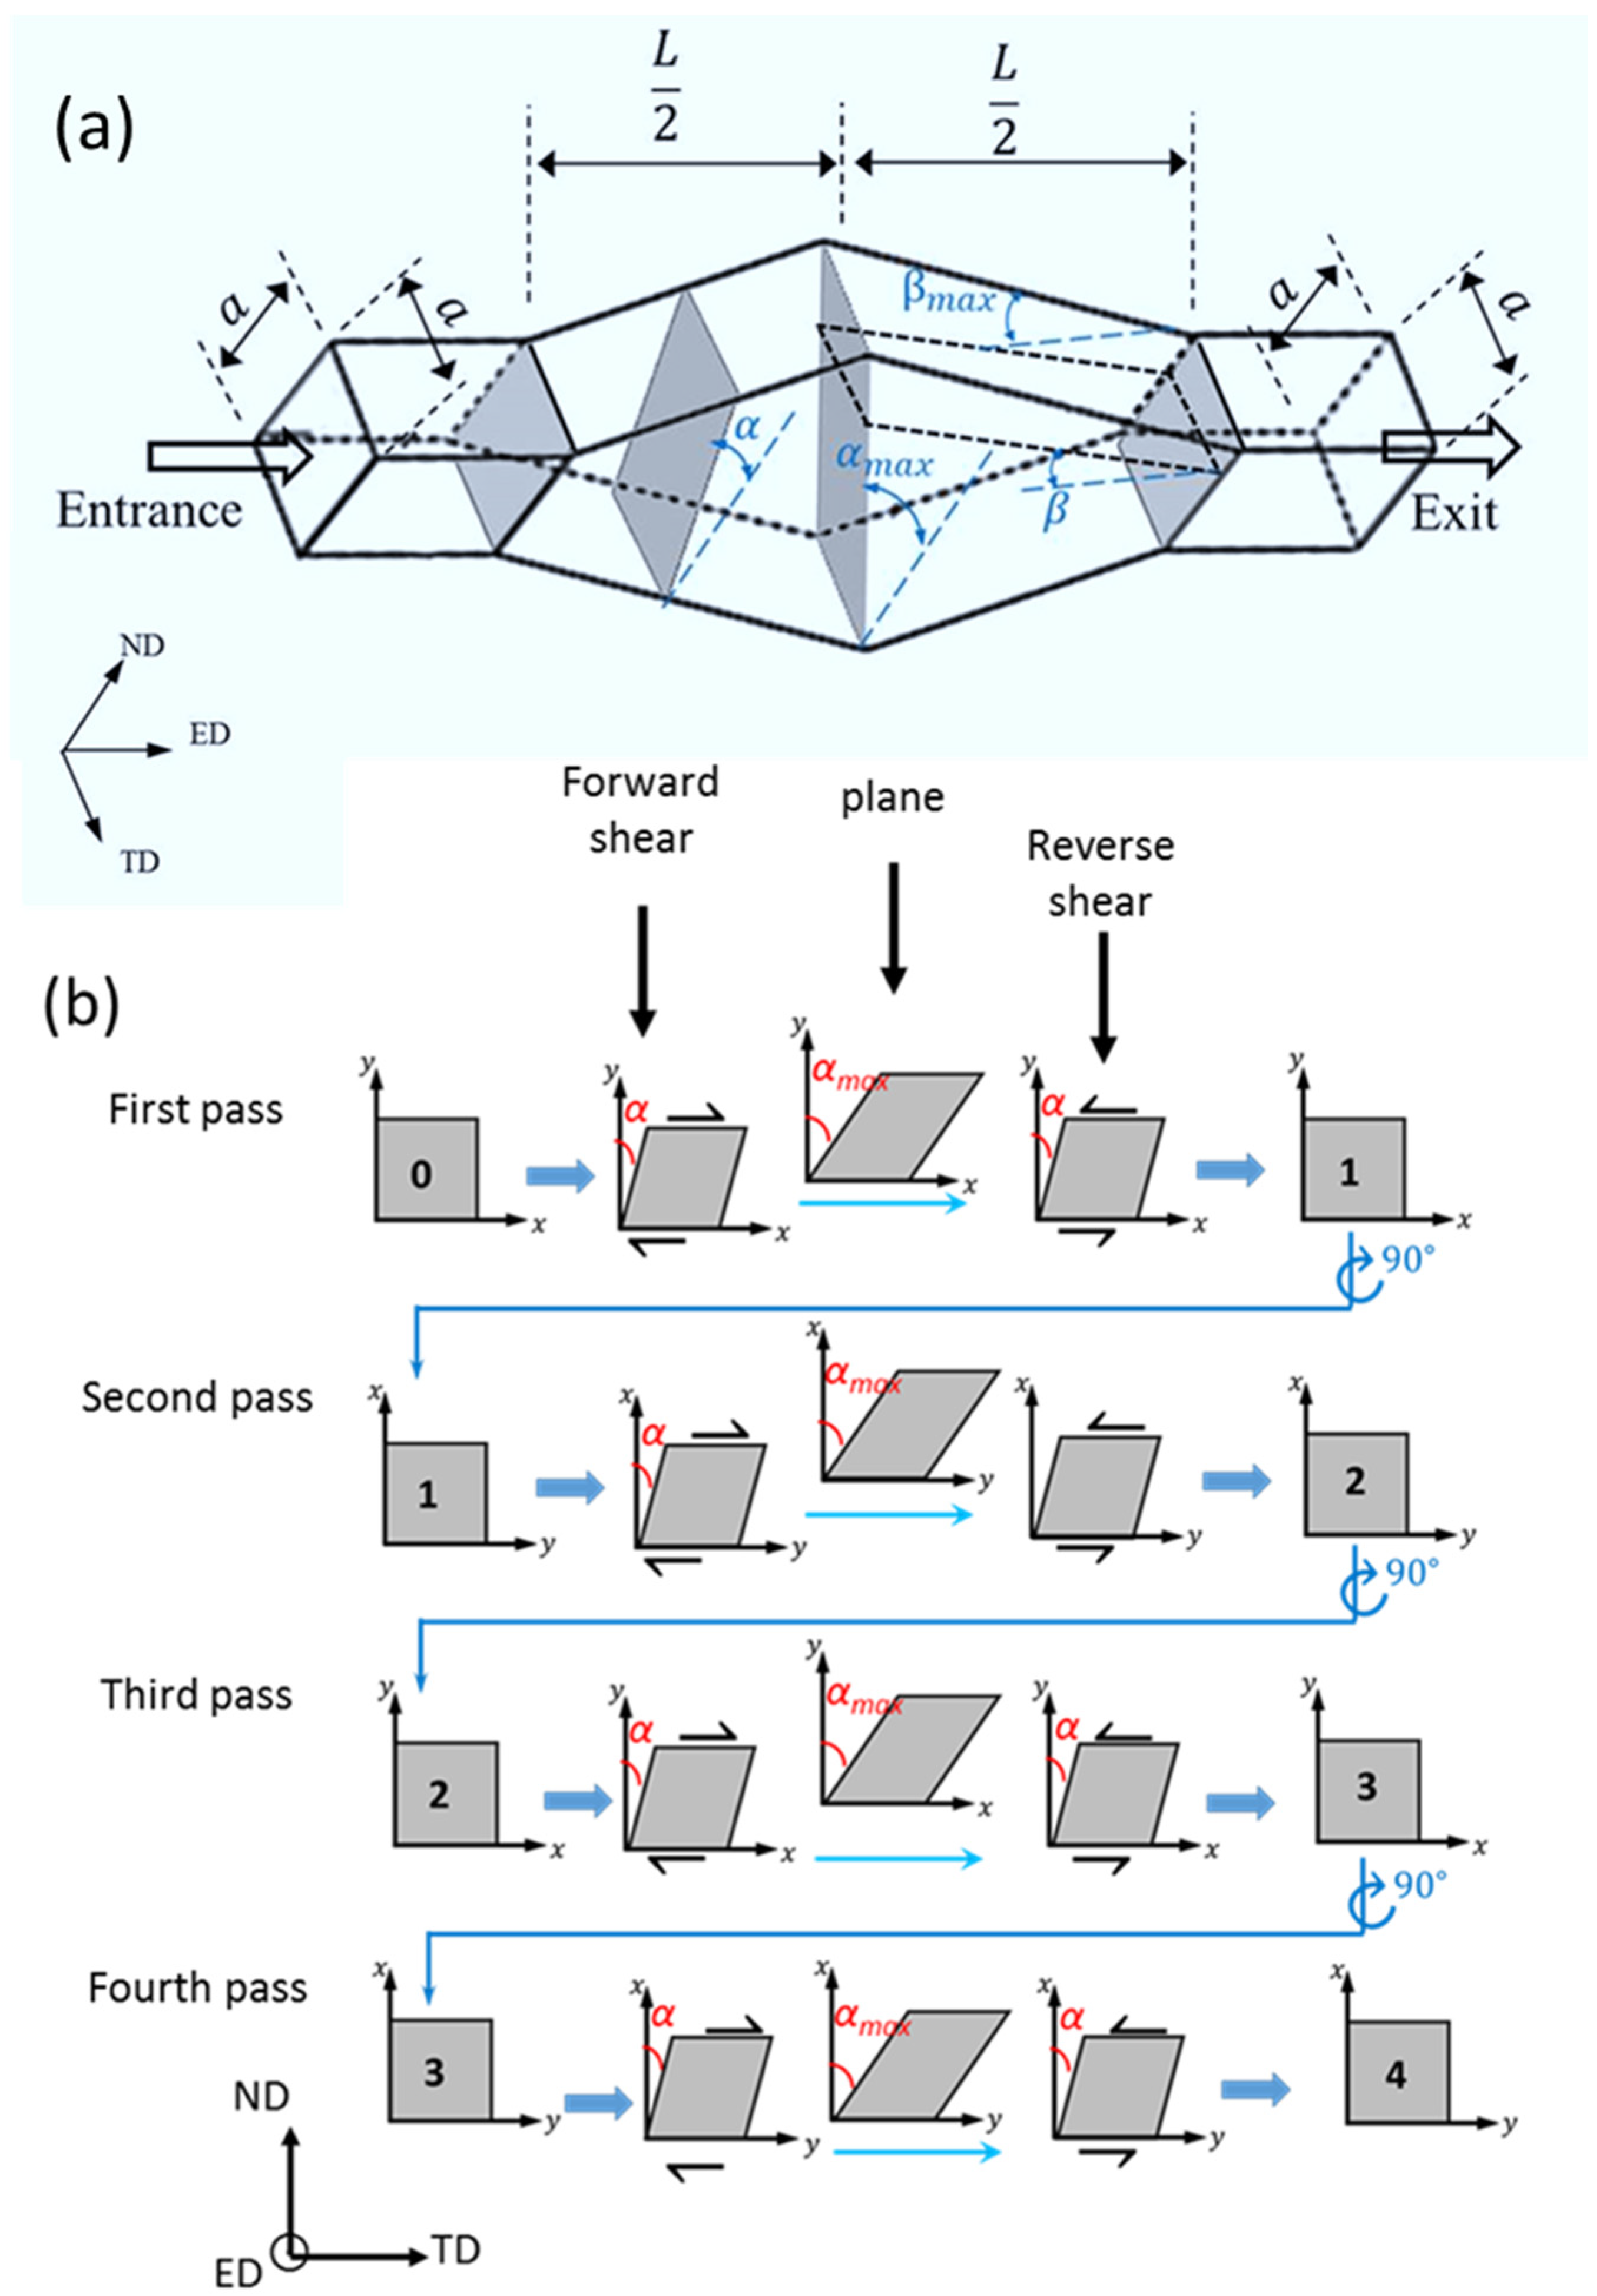
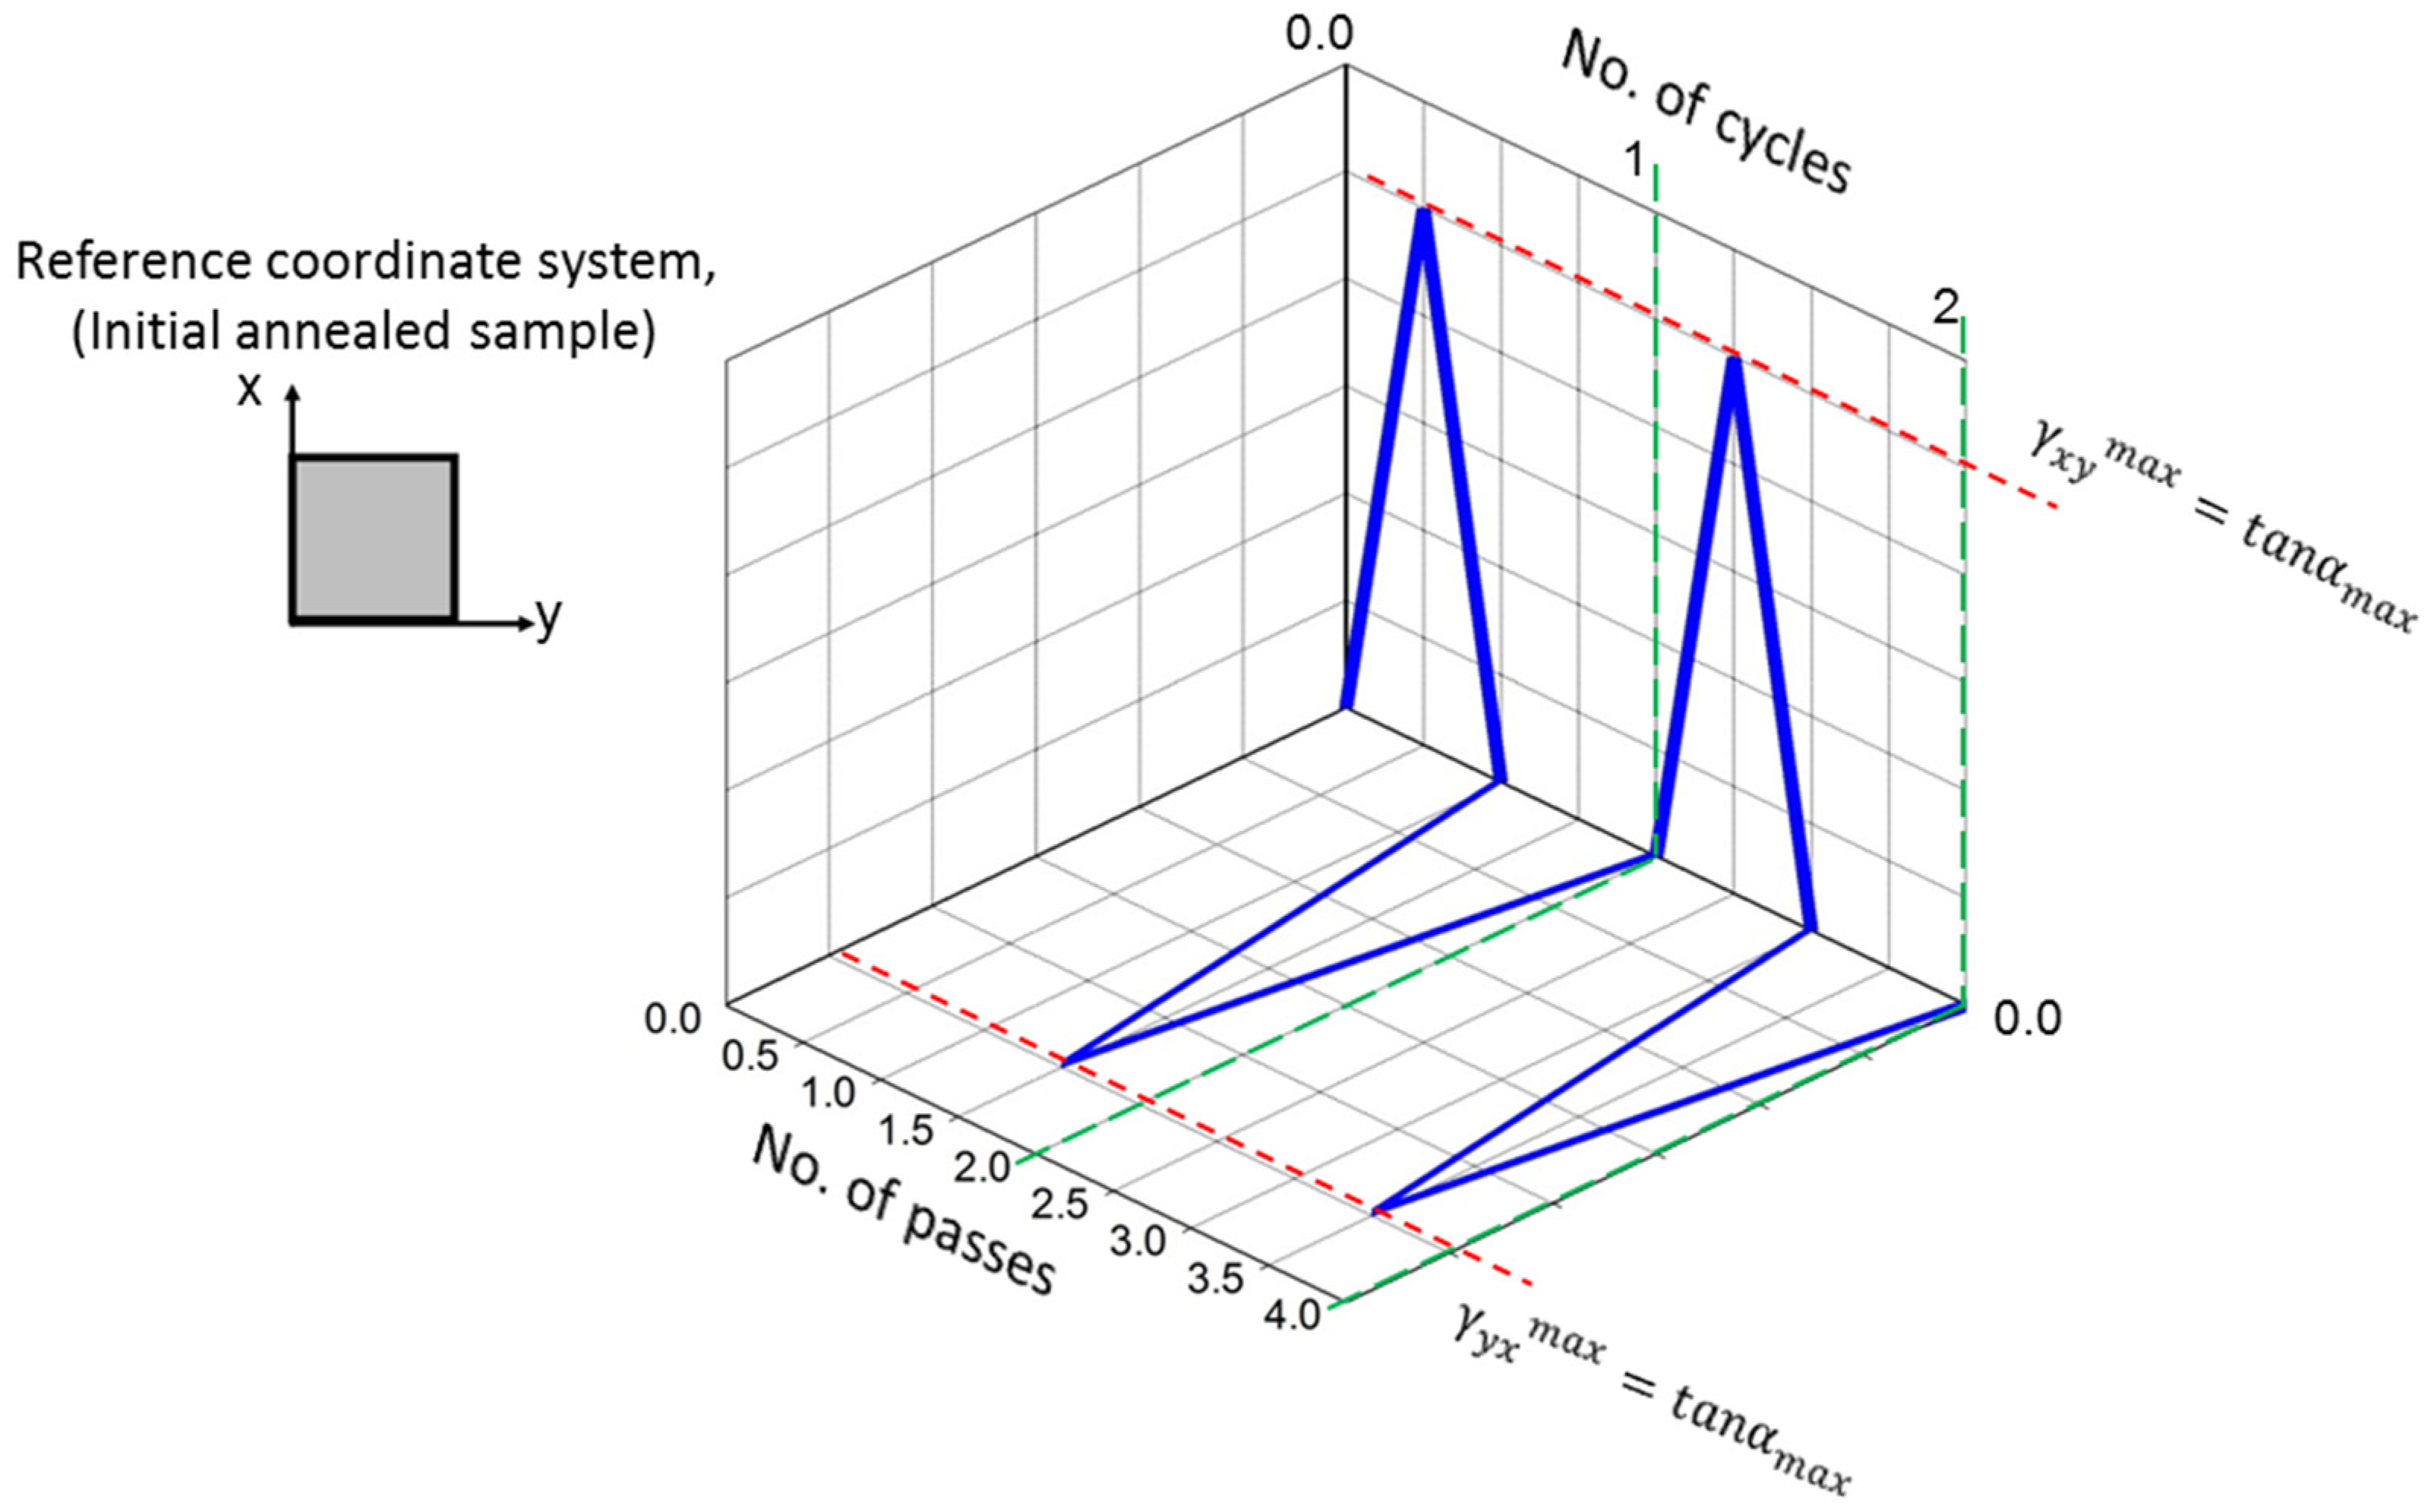
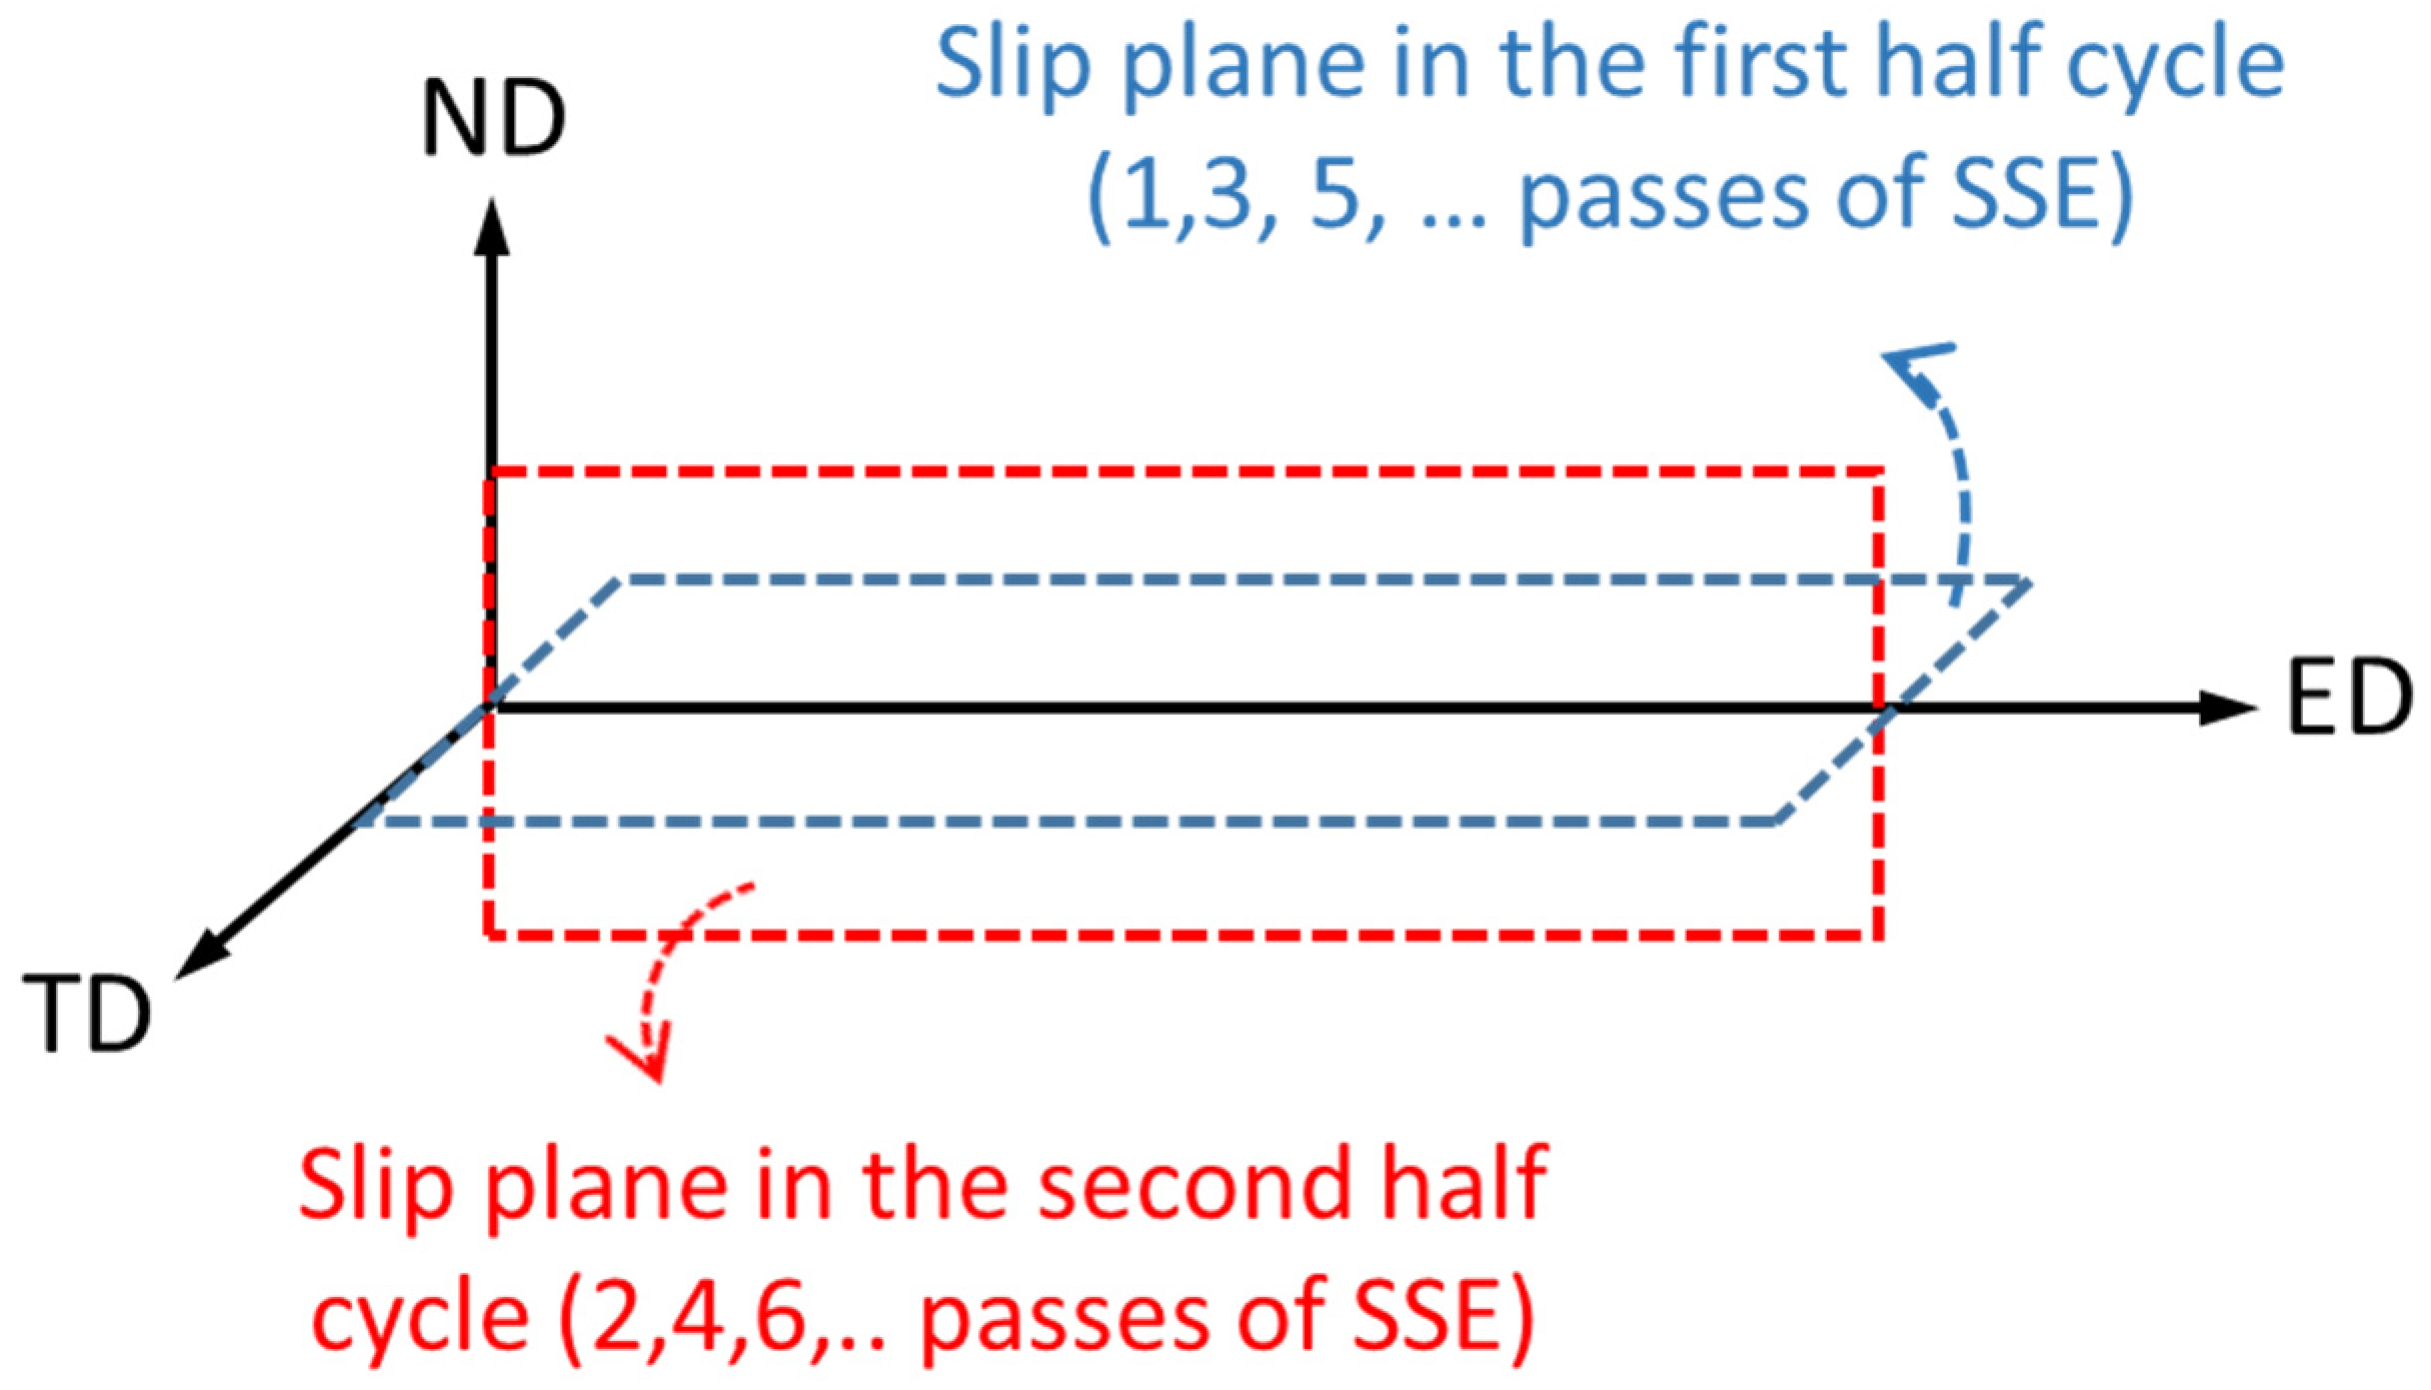
From all of the above discussions, the mechanisms involved in the microstructural and textural evolution and the change in the tensile properties of the Cu samples in particular, and the FCC metals in general, after imposing large non-monotonic simple shear strains is described in the following. In
Figure 1, it is obvious that a cycle of the present non-monotonic shear process has two perpendicular shear planes, and each of them are active in one half of a cycle (a pass of SSE). As presented in
Figure 12, in one half of a cycle, the shear plane is parallel to the
ND plane, which is in the other half. The slip plane is parallel to the
TD plane. On the other hand, in every quarter of a cycle (half of a pass), the direction of the shear is reversed. Therefore, in a cycle, there are two different slip planes, and two pairs of shear directions on two different axes. This complicated straining path results in a unique microstructural and texture evolution. However, the mechanism of grain refinement still is in situ or continuous dynamic recrystallization.
In the first quarter of a cycle where the slip happens on an
ND plane in the positive direction of
TD, a random dislocation distribution rearranges itself into elongated dislocation cells. By increasing the amount of shear in this stage, the boundary misorientation increases, and the aforementioned cells become elongated sub-grains. In the case that the shear amount in this stage is equal to one, the grains are elongated ideally in an inclined direction, in a clockwise rotation, through an angle of ~45° to TD. By increasing the shear, this angle becomes lower. In the second quarter of a cycle where shear happens on the
ND plane but in the negative direction of
TD, the shear direction is reversed, and the dislocation fluxes are reversed as well, which leads to the decrease of the stored excessive dislocations introduced in the boundaries and disintegration of misfit dislocations. Therefore, reversing the shear direction might lead to diminishing the misorientation angle and/or the elimination of the dislocation boundaries results in postponing the grain refinement [
8]. Also, the mean angle between the elongated cell boundaries and
TD increases. Furthermore, the boundaries become thicker.
In the second half of a cycle, shear happens on a TD plane in the positive direction of ND. Assuming the imposing shear strain of one in the third quarter of a cycle, elongated sub-grains were formed through the same mechanisms as in the first quarter but this time, the sub-grains are inclined to the ND through an angle of ~45°. Finally, by reversing the direction of shear in the same slip plane, the fraction of high angle grain boundaries decreases, and the mean angle between the elongated cell boundaries and ND increases.
The same mechanism happens in the other cycles. Nevertheless, each cycle changes some of the microstructural features of the previous one, due to the back and forth straining between the cycles. More importantly, since the direction of the shear and/or the shear plane change frequently in every quarter cycle, the texture of a sample after multi-cycles of the process resembles more the random orientation, and the simple textures are not expected.
The mechanism of grain refinement, texture formation, and strengthening in the center and the periphery is the same. However, since the imposed strain in the periphery in each quarter of the process is lower than that in the center, the shear reversal has more effect on the periphery. Therefore, grain refinement postpones in the periphery, and the strength of the periphery is lower than the center.
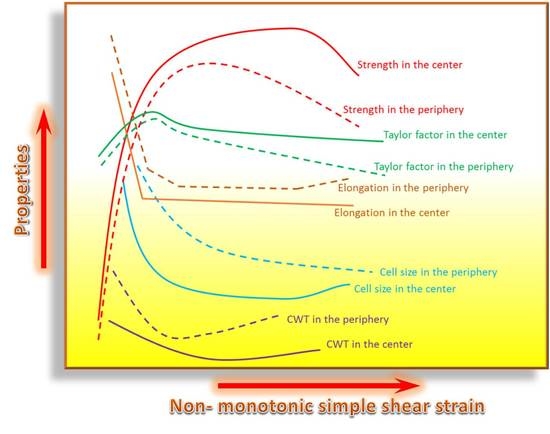
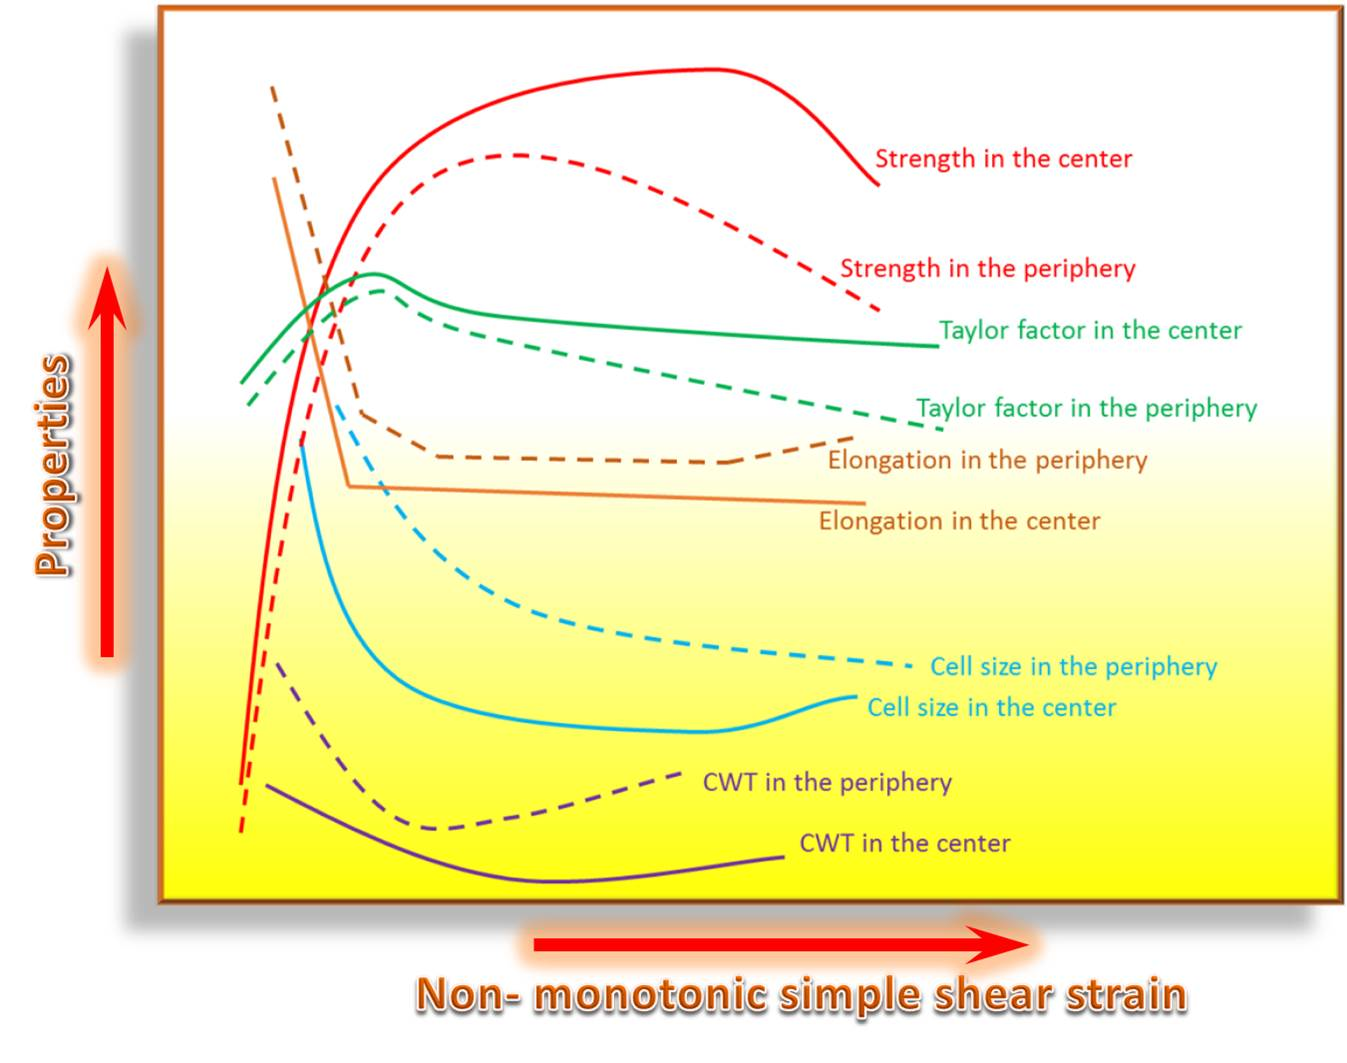
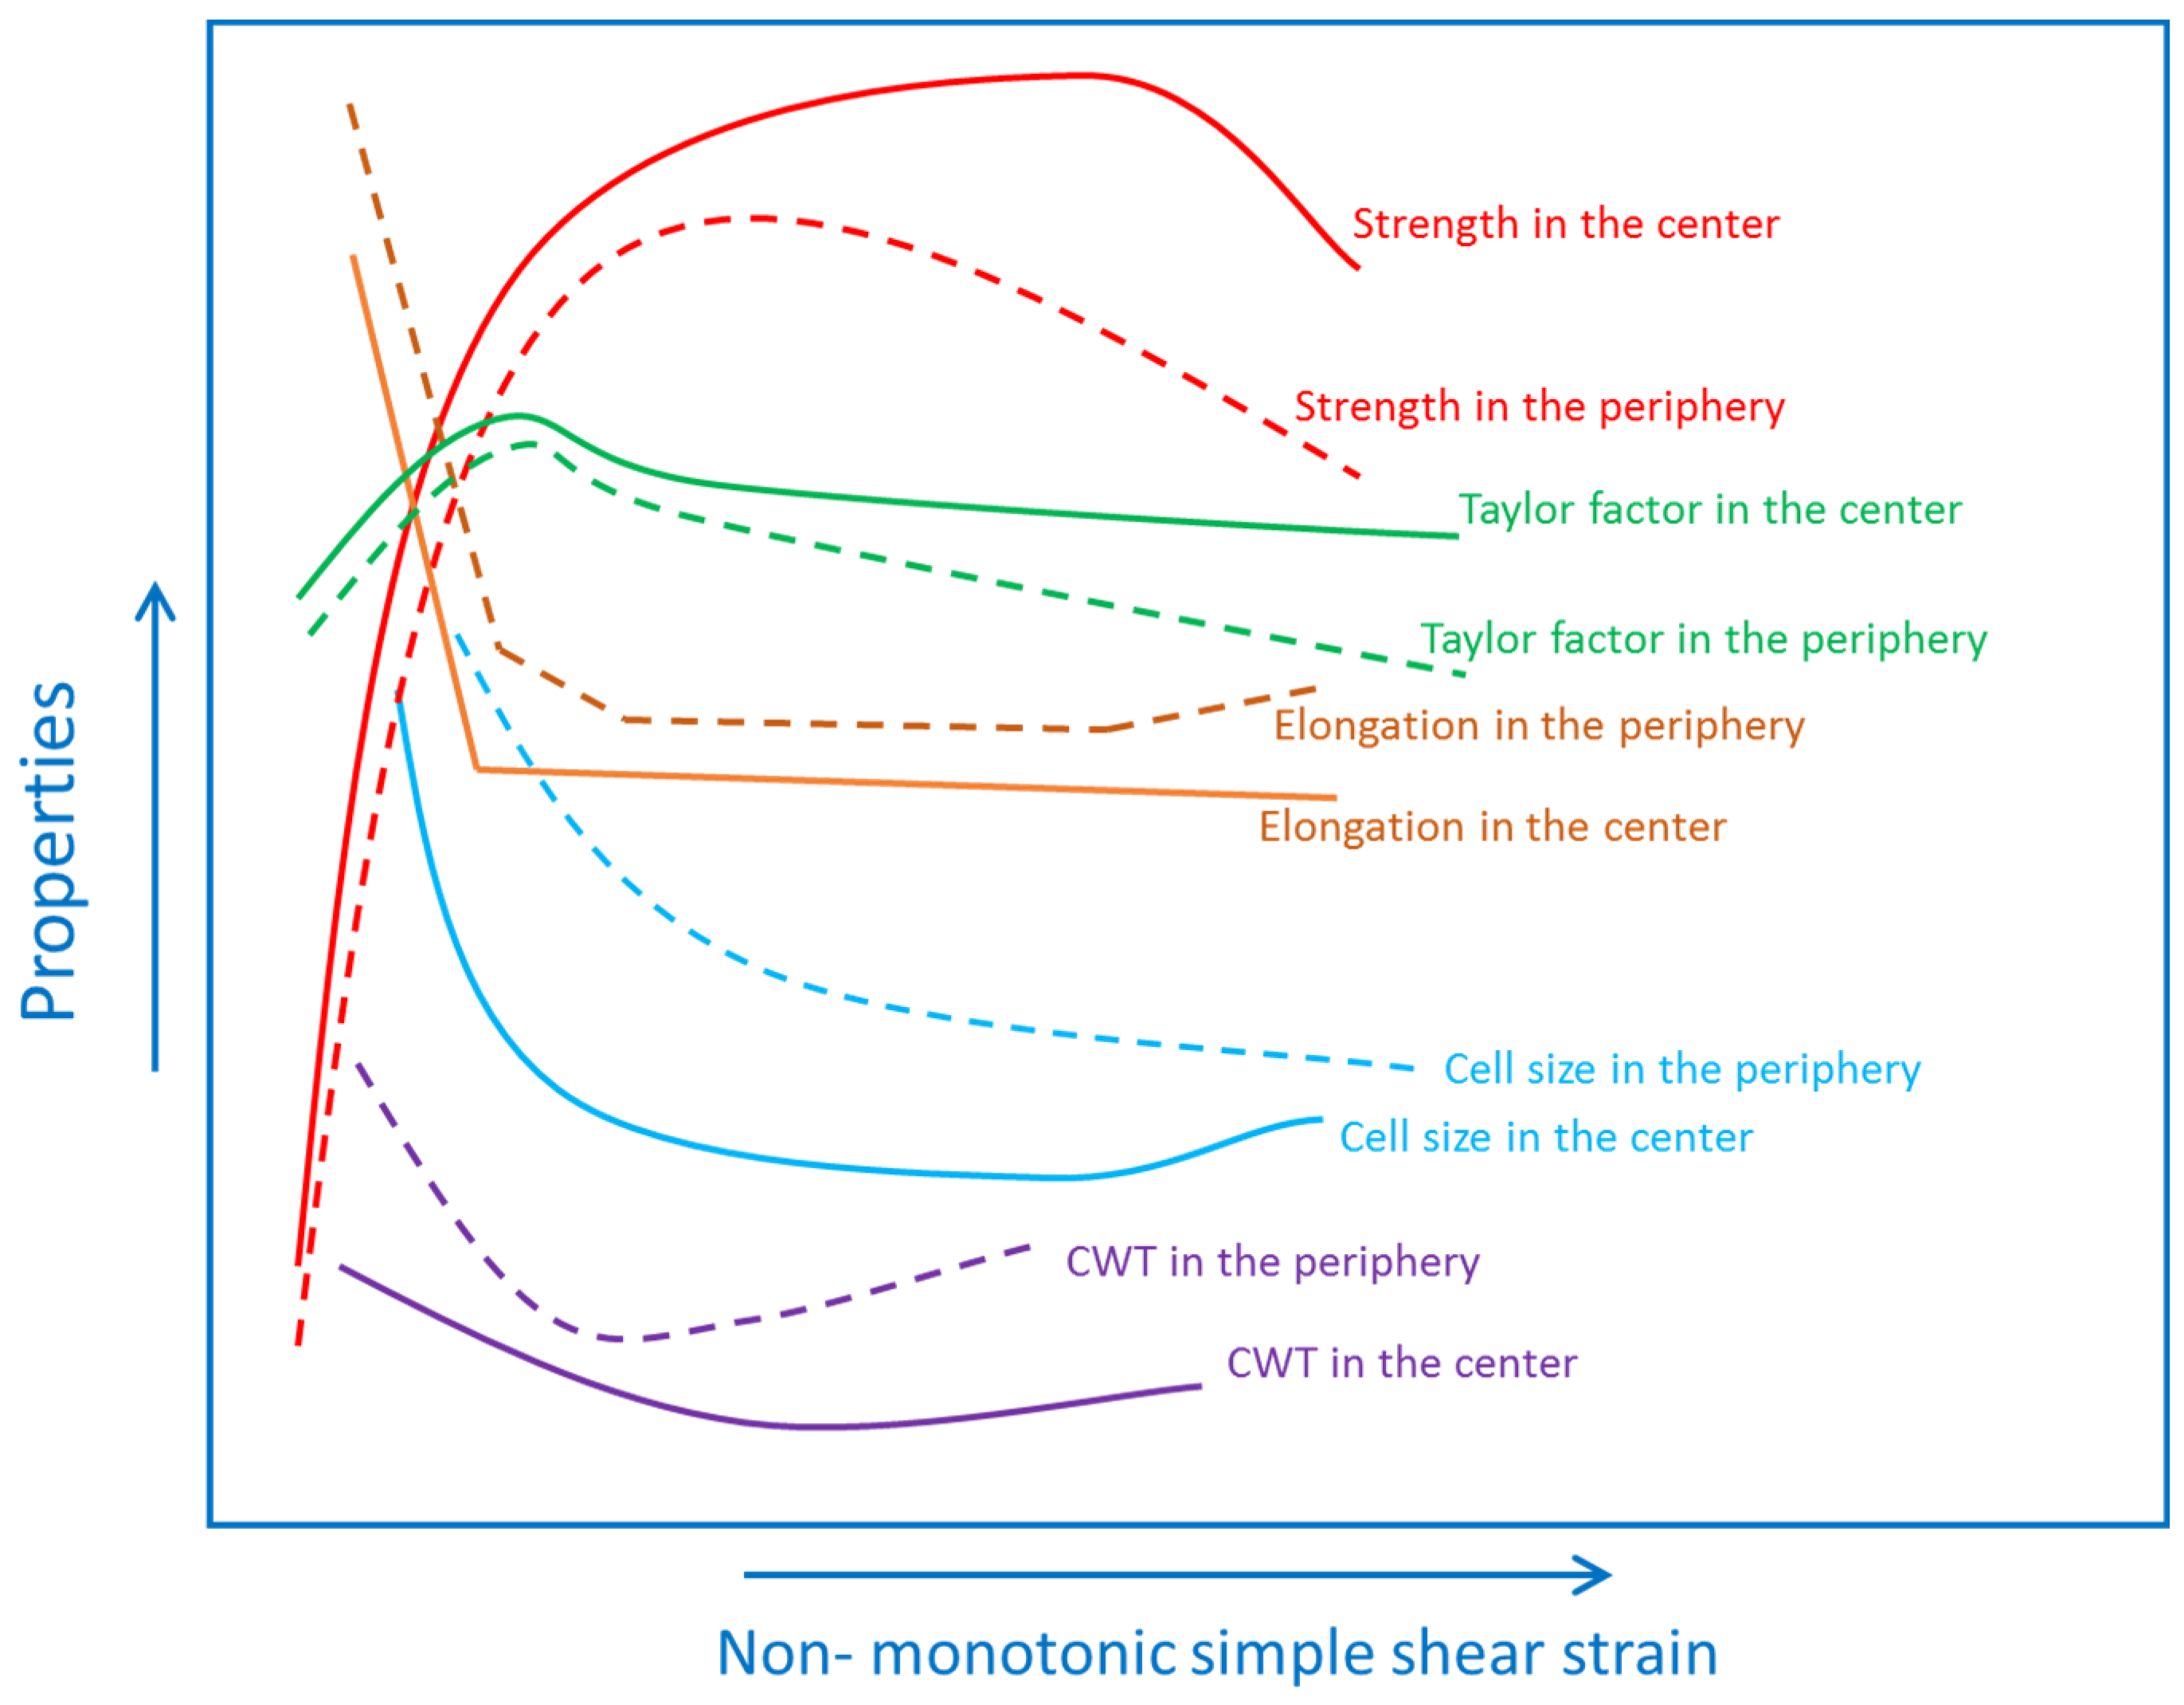
Finally, to summarize the microstructure evolution, texture changes, and variation in the tensile properties of the FCC metals in large non-monotonic simple shear strains, all of the mentioned properties and parameters are presented schematically in a single diagram in
Figure 13. The uniformity in the properties and parameters is predictable by the concurrent and mutual effects of cell size, cell wall thickness, and Taylor factor. Furthermore, the trend of change in the texture, Taylor factor, cell size, cell wall thickness, strength, and ductility of the FCC materials is predictable with the aforesaid mechanism.


