Article

A Study of the Optimum Quenching Temperature of Steels with Various Hot Rolling Microstructures after Cold Rolling, Quenching and Partitioning Treatment

1
Institute of Engineering Technology, University of Science and Technology Beijing, Beijing 100083, China
2
Collaborative Innovation Center of steel Technology, University of Science and Technology Beijing, Beijing 100083, China
3
Beijing Laboratory for Modern Transportation Advanced Metal Materials and Processing Technology, University of Science and Technology Beijing, Beijing 100083, China
*
Author to whom correspondence should be addressed.
Metals 2018, 8(8), 579; https://doi.org/10.3390/met8080579
Submission received: 4 June 2018 / Revised: 9 July 2018 / Accepted: 24 July 2018 / Published: 26 July 2018
(This article belongs to the Special Issue Advanced High Strength Steels by Quenching and Partitioning)

Abstract

:
Quenching and partitioning (Q&P) processes were applied to a cold-rolled high strength steel (0.19C-1.26Si-2.82Mn-0.92Ni, wt %). The effects of the prior hot-rolled microstructure on the optimum quenching temperature of the studied steels were systematically investigated. The microstructure was analyzed by means of transmission electron microscope (TEM), electron backscatter diffraction (EBSD) and X-ray diffraction (XRD). Compared with the ferrite pearlite mixture matrix, the lower martensite start (Ms) temperature and smaller prior austenite grain size in the cold-rolled martensite matrix are the main reasons for the optimum quenching temperature shifting to a lower temperature in the Q&P steels. We found that an empirical formula that only considers the influence of the alloy composition in the calculation of the Ms temperature will cause a certain interference to the pre-determined optimum quenching temperature of the Q&P steel.

1. Introduction

Advanced high-strength steels (AHSS) are widely used in automobiles to ensure good fuel economy and safety. Quenching and partitioning steel (Q&P steel), one of the representative steels of the third generation of AHSS, promises a further improvement of the mechanical properties via moderate microstructural design [1,2,3,4]. The Q&P process includes two steps, the quenching and partitioning processes. The mixed microstructure of martensite and untransformed retained austenite is first obtained in the quenching stage by adjusting the quenching temperature between the martensite strat (Ms) temperature and martensite finish (Mf) temperature. The subsequent partitioning is commonly carried out at a temperature slightly higher than the quenching temperature in order to stabilize the retained austenite through carbon partitioning from supersaturated martensite. The microstructure of fully austenitized Q&P steel, including stable retained austenite and carbon-depleted martensite ensures the high strength and plasticity of Q&P steel.
A large number of studies of Q&P steels have focused on the effect of the quenching and partitioning parameters on the microstructure and mechanical properties of Q&P steels [5,6,7,8]. The exploration of the composition of Q&P steel alloys is mainly concentrated on low alloy systems. The improvement of austenite-stabilizing elements, especially the increase of the manganese content, has been proved to be beneficial to obtaining a greater proportion of retained austenite [9,10,11,12,13] at room temperature, thereby obtaining good mechanical properties.
Reference [14] describes a quantitative study of the relationship between the multiphase microstructure and mechanical properties. A good correlation between the fraction of initial martensite (or primary martensite or tempered martensite) and the yield strength was obtained. Generally, the proportion of primary martensite is determined by the quenching temperature. The constrained carbon equilibrium (CCE) model [2] can be used to predict the endpoint of the carbon partitioning to austenite. The optimum quenching temperature, which will contribute to a maximum amount of retained austenite, is usually predicted in combination with the Koistinen-Marburger (K-M) relationship [15]. However, the inaccuracy of the K-M relationship for finding the proportion of martensite, the inevitable precipitation of carbides in the complex multicomponent alloy composition system [16,17], austenite/martensite interfacial migration [18,19] and other factors that may affect the Ms temperature prediction, such as austenite grain size [20] and heterogeneous alloying elements, can affect the accuracy of the prediction. The CCE balance equation can be used as a reference for experimental design, while the final retained austenite fraction must be verified by experimental methods such as electron backscatter diffraction (EBSD) and X-ray diffraction (XRD).
In fact, the best mechanical properties depend not only on the respective proportions of each phase but also on the grain size and the grain distribution and morphology. The presence of coarse martensite laths leads to early strain localization, especially when they are in the vicinity of untempered martensite islands [21]. The excessive inhomogeneous microstructure and blocky retained austenite with low stability accelerate the failure of the material with Mn segregation banding. In contrast, fine lath-like ferrites with a greater contact ratio to the surrounding martensites improve the microstructural homogeneity during the pre-quenching process, and results in optimal mechanical properties [22]. Besides, the microstructure prior to Q&P may also the affect the subsequent evolution of the microstructure, and a fine prior austenite grain at a low austenitizing temperature contributes to a large volume fraction of retained austenite, especially the blocky retained austenite along the prior grain boundaries, and effectively improves the uniformity of the microstructure [23]. In the present work, the influence of three different types of hot-rolled microstructure on the final cold-rolled quenching and partitioning steel were systematic studied, especially the rational design of the optimum quenching temperature, and its relationship to the prior austenite grain size inherited from the three different matrixes.

2. Experiment

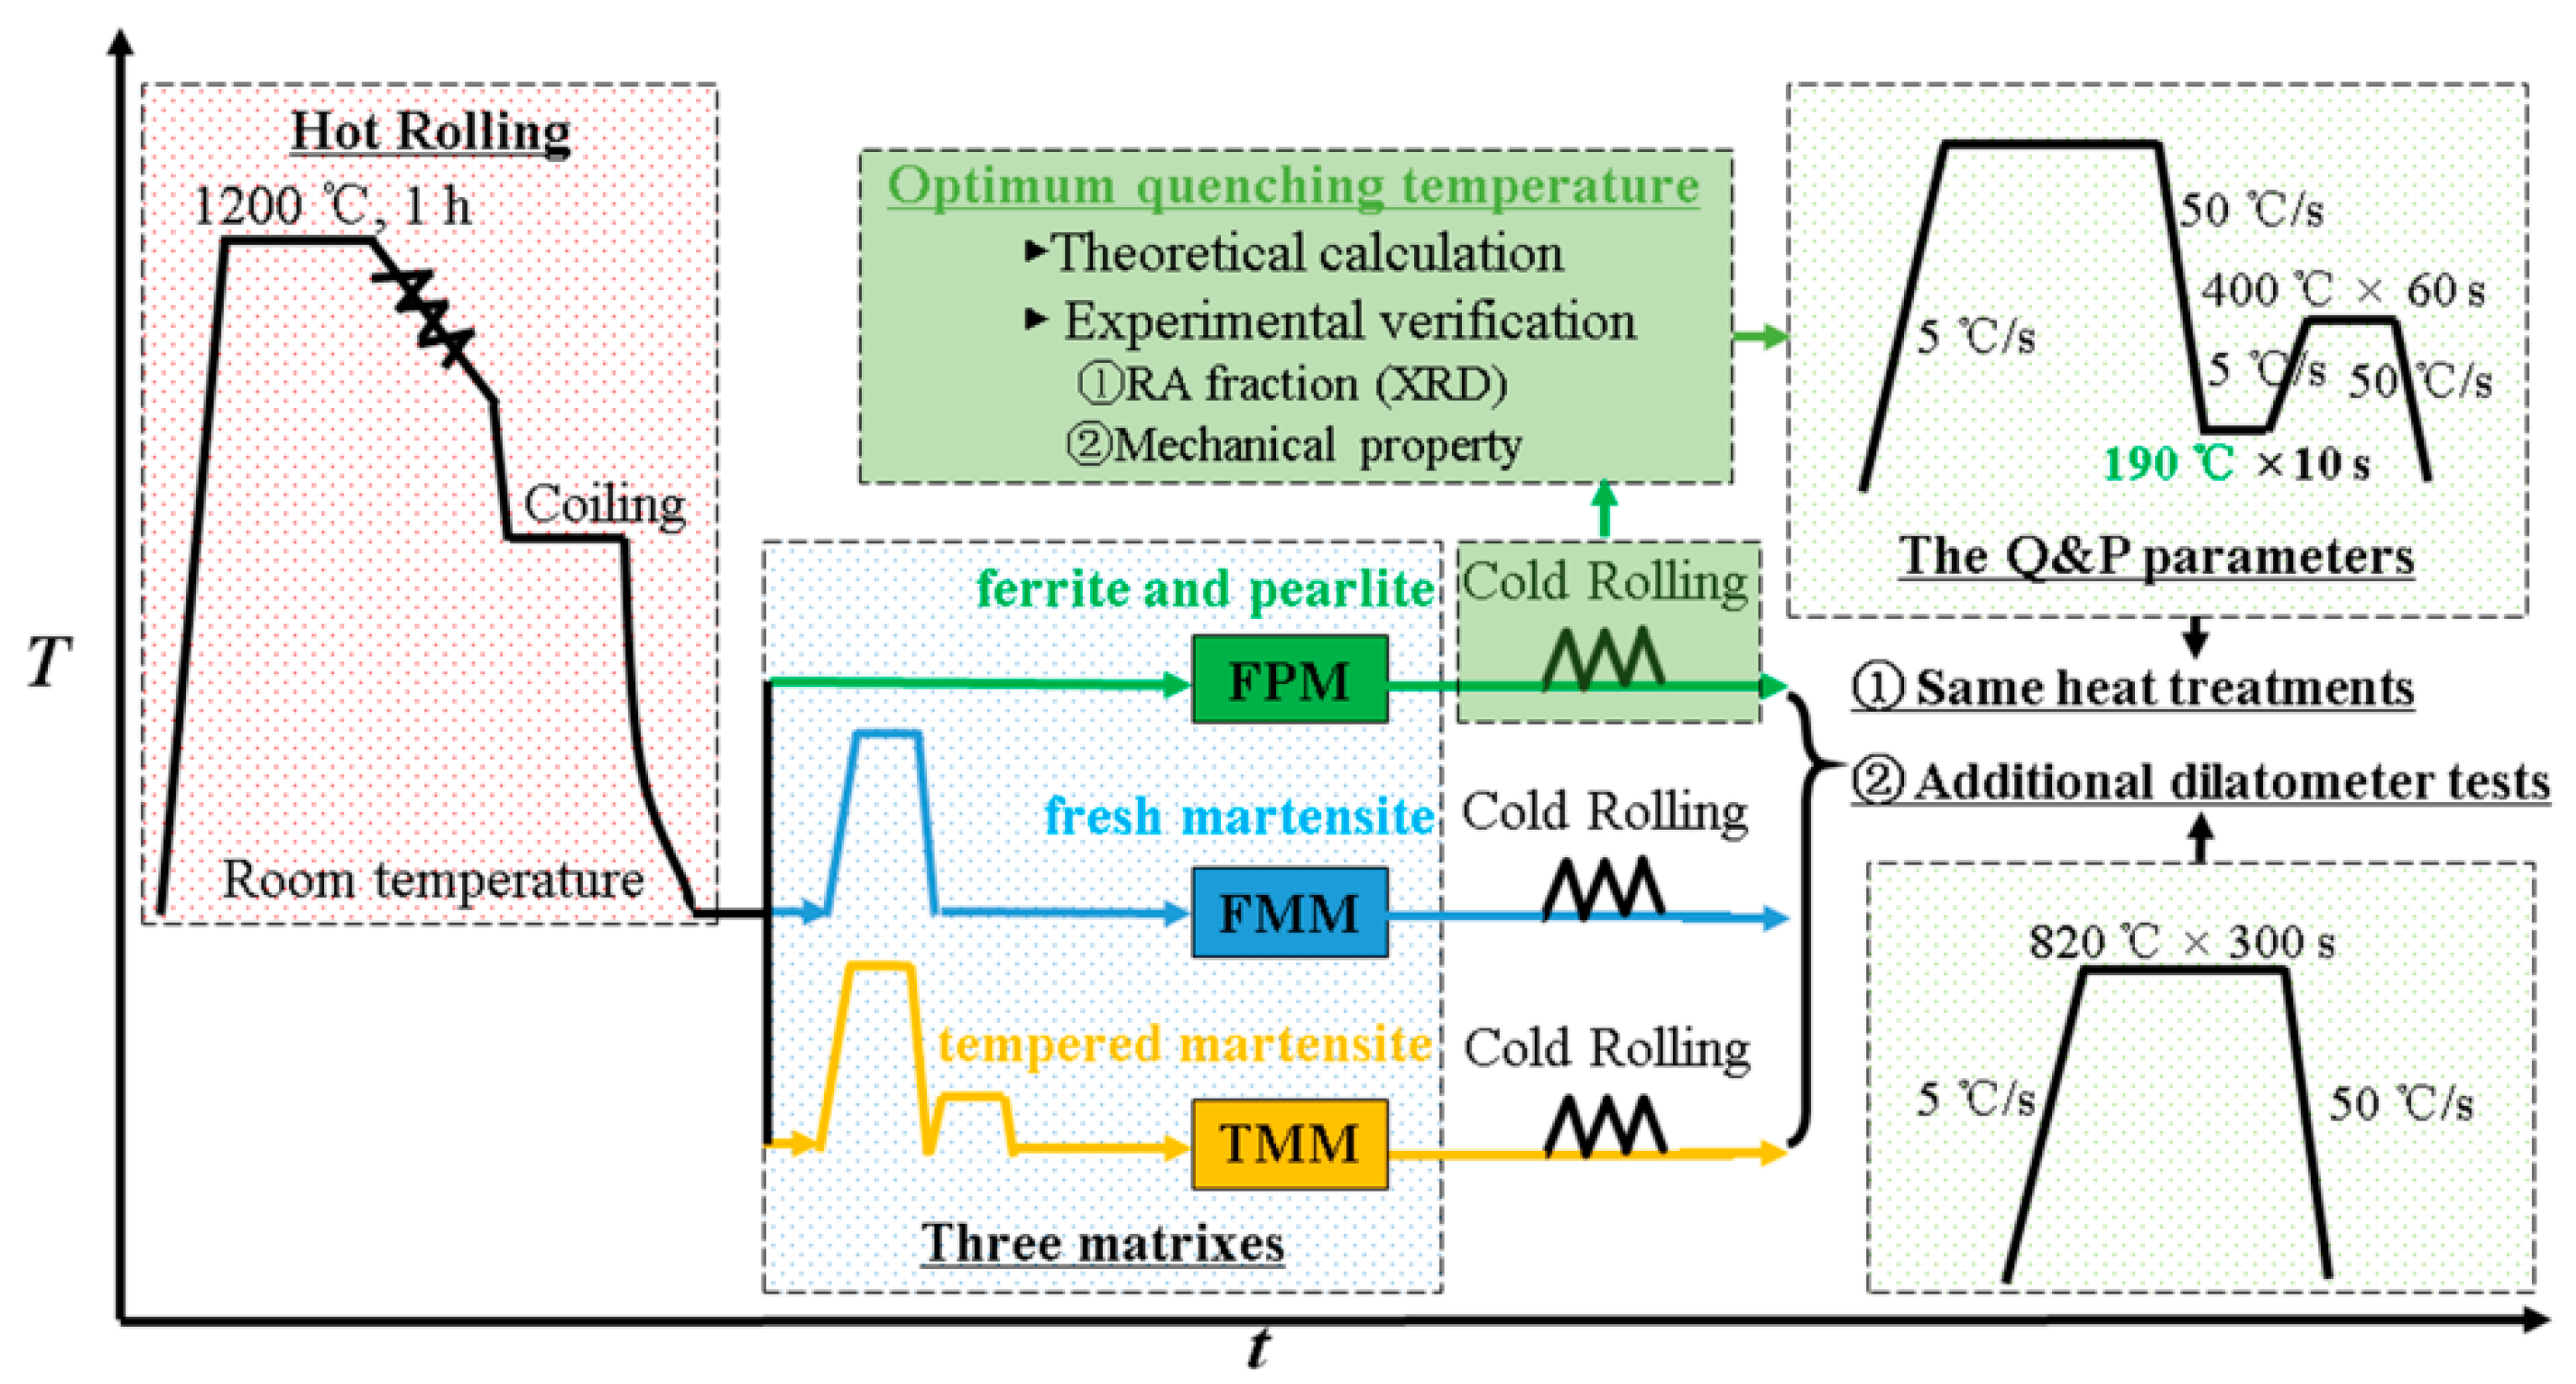
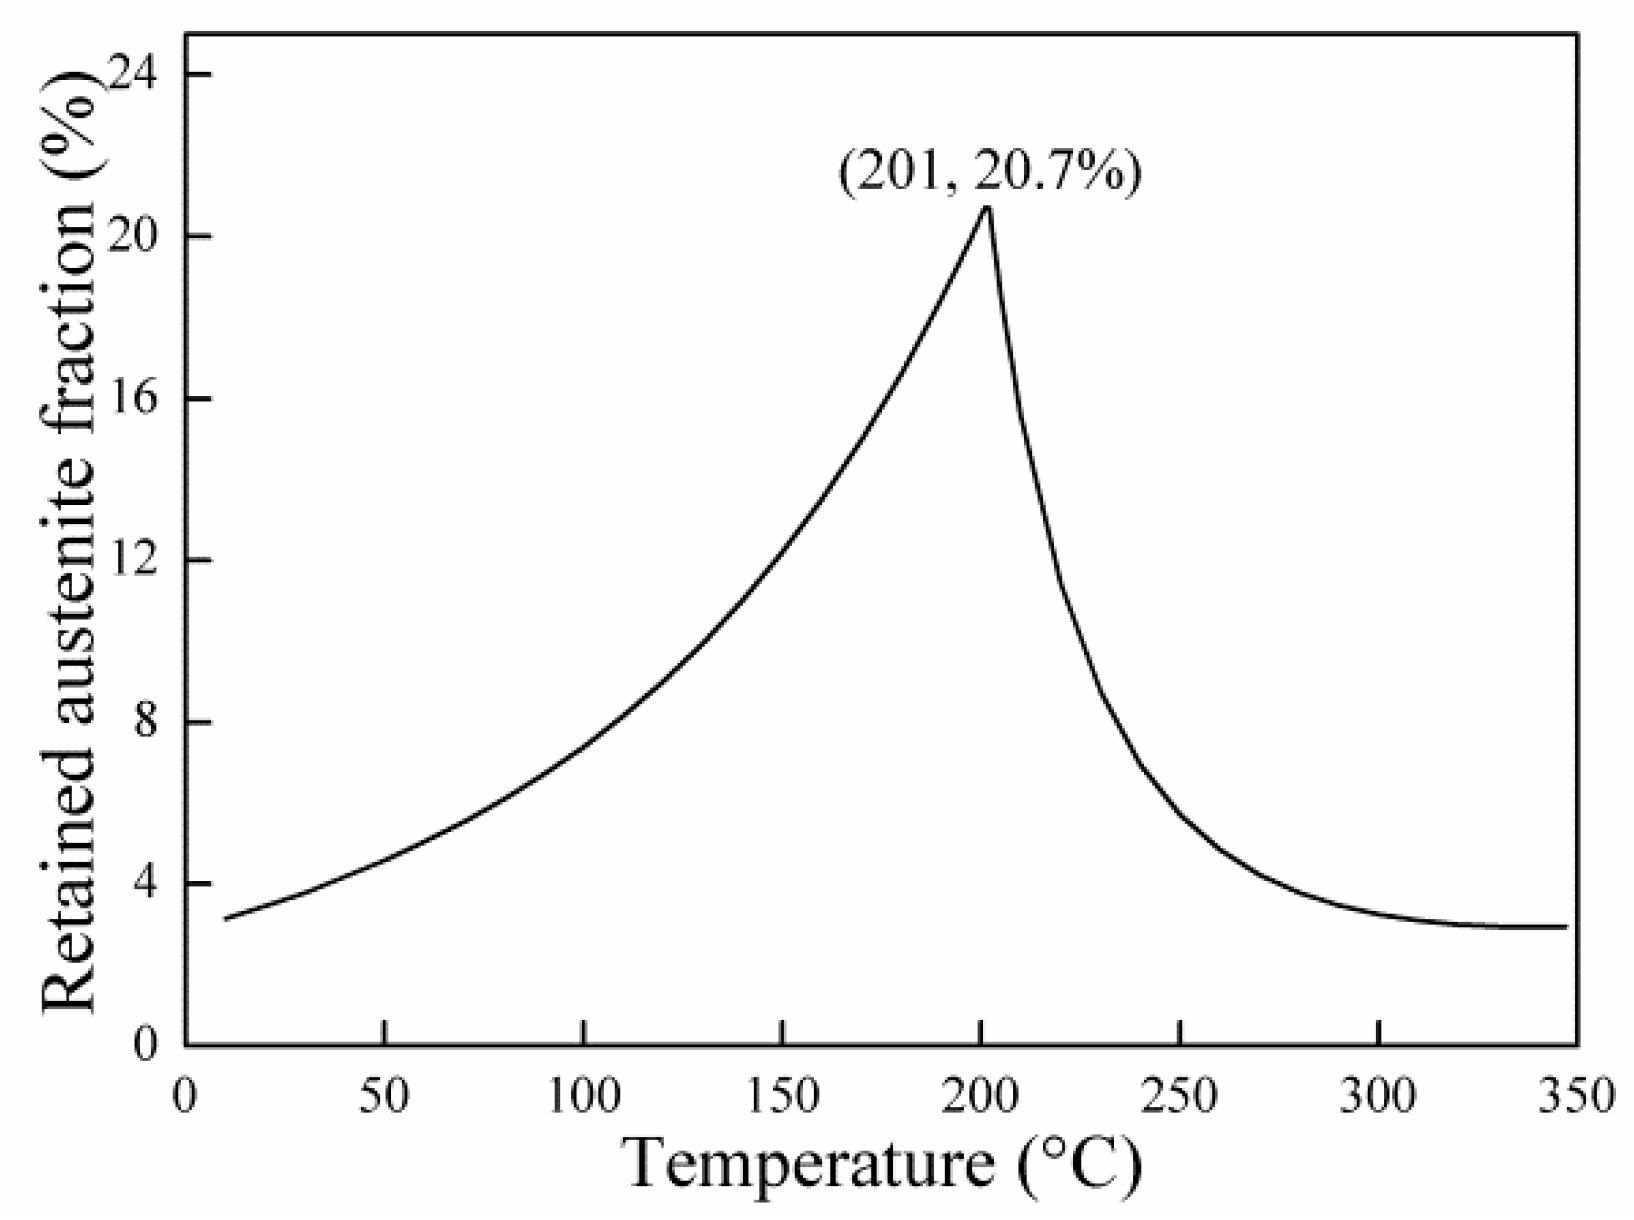
2.1. Optimum Quenching Temperature Selection

The composition of the investigated steel studied in this work was 0.19C-1.26Si-2.82Mn-0.92Ni (wt %). The material was smelted in a vacuum induction furnace and cast into a bullet-shaped cast iron mold. The 25 kg bullet-shaped ingot was heated above 1000 °C and hot-forged into several rectangular ingots (30 mm × 75 mm × 100 mm) for convenient rolling. The ingots were homogenized at 1200 °C for 1 h, then were hot rolled to a final thickness of 2.8 mm with an open rolling temperature of 1150 °C and a finishing temperature of 900 °C, acceleration cooled by water jets to 660 °C and transferred to a furnace for coiling simulations. The microstructure after hot-rolling consisted of ferrite and pearlite (FPM). A 2 × 20 × 400 mm3 rectangular specimen (with the oxide layer removed by machining both surfaces) was cut from the hot-rolled plate mentioned above, then cold-rolled to 1.2 mm.
Before the quenching and partitioning process, the austenite formation temperatures (Ac1 and Ac3)and Ms temperature were measured using the dilatometric method, as shown in Table 1. A φ4 × 10 mm2 specimen machined from the ingot was heated at 0.05 °C/s to 1000 °C for 10 min followed by cooling at 50 °C/s to room temperature on a dilatometer machine (DIL805A, BAHR-Thermoanalyse GmbH, Hullhorst, Germany). According to previous studies [23,24], treatment at a temperature close to Ac3 can refine the austenite grain size. Thus, the austenitizing parameter of the investigated steel was selected as 820 °C for 5 min. All the samples were partitioned at 400 °C for 5 min. The optimum quenching temperature was selected by both theoretical calculations and experimental simulations.
The optimum quenching temperature (201 °C) was first calculated using the CCE model combined with the empirical relation (Equation (1)) [25,26,27] and K-M relationship (Equation (2)), as shown in Figure 1.
  M s = 539 42300 C 3040 Mn 750 Si 1770 Ni  
  f M T q = 1 e 1.1 × 10 2 ( M s T q )  
Five different temperatures were designed to obtain different primary martensite fractions based on the K-M relationship, as shown in Figure 2. The corresponding quenching temperature and the primary martensite fraction were 125 °C (90%), 190 °C (80%), 250 °C (60%), 290 °C (40%) and 315 °C (20%). In subsequent X-ray diffraction tests, the three temperature (190 °C, 250 °C and 290 °C) specimens with the highest retained austenite fraction were subjected to tensile tests. Therefore, the optimum quenching temperature was finally confirmed as 190 °C, contributing to the best mechanical properties.

2.2. Preparation and Heat Treatment Parameters of the Three Matrixes

The above microstructure after hot-rolling consisted of ferrite and pearlite (FPM). In this article, we designed another two different microstructures, fresh martensite matrix (FMM) and tempered martensite matrix (TMM). A 2 × 20 × 400 mm3 rectangular specimen was cut from a hot-rolled plate, as mentioned above, then heated at 5 °C/s to 850 °C and held for 5 min, before finally being cooled at 50 °C/s to room temperature using a continuous annealing simulator (CCT-AY-II, Ulvac-Riko INC., Tokyo, Japan) to obtain the fresh martensite matrix. The other specimen was subjected to the same quenching process, and then tempered at 400 °C for 5 min to obtain the tempered martensite matrix. These specimens were also cold-rolled to 1.2 mm. Since the cold rolling reduction rate did not exceed 50%, cracking did not occur at the edge of the cold-rolled sheet. The tensile strength of each sample was measured and recorded using a tensile test before cold rolling. Correspondingly, the tensile strength of the FPM sample was 1094 MPa, that of the FMM sample was 1884 MPa, and that of the TMM sample was 1554 MPa.
The quenching and partitioning processes (which was the same for the FPM sample with a quenching temperature of 190 °C) were applied to the FMM and TMM cold-rolled plates. Additional dilatometer tests were performed to better analyze the differences in the mechanical properties. The corresponding martensite start (Ms) temperatures were measured under the same austenitizing parameters. Specifically, the 4 × 10 mm2 rectangular specimens of three matrix cold-rolled plates were heated at 5 °C/s to 820 °C and held for 5 min, and finally cooled at 50 °C/s to room temperature. The entire experimental design roadmap and specific heat treatment parameters are shown in Figure 3. In addition, the heat treatment and tensile tests at lower quenching temperatures, such as 160 °C, were also added to the FMM and TMM samples to support our conclusions.

2.3. Testing Parameters

The tensile properties were obtained using the uniaxial tensile test, which was performed at a crosshead speed of 1.0 mm/min with a gauge length of 25 mm. The twin-jet polishing technique (5% perchlorate alcohol at −30 °C, applied potential of 50 V) was implemented to prepare thin foil samples for the TEM observation (JEM 2100, Japan Electronics Co., Ltd., Tokyo, Japan)). Electron backscatter diffraction (EBSD) was performed on the samples with a step size of 0.05 μm using a Zeiss ULREA 55-type field emission electron scanning electron microscopy (Zeiss ULREA 55-type, Oberkochen, Germany) equipped with an HKL Nirdlys F+ probe (OXFORD Instruments, Oxford, UK). X-ray diffraction (XRD) was performed on the D/MAX-RB (Rigaku Corporation, Tokyo, Japan) operating at 45 kV and 150 mA, and the 2θ containing the three austenite peaks ({200}, {220} and {311}) and two martensite peaks ({200}, {211}) were scanned in order to estimate the fraction of retained austenite with a step size of 0.02° using Cu-Kα radiation. The austenite lattice parameter a γ (10−1 nm) of the samples was determined by the position of the maximum of each austenite reflection, and the manganese content x Mn (wt %) was considered to be homogeneous and constant in the steel. Thus, the average carbon concentration x c (wt %) of the austenite was approximately obtained by using the equations provided in [28,29], while the influence of Si and Ni on the lattice parameters of austenite was assumed to negligible. The surface of the samples for the EBSD and XRD tests were electrolytically polished in a mixture reagent of 20% perchloric acid and 80% ethanol with a voltage of 15 V for 20–30 s.
  a γ = 3.556 + 0.0453 x c + 0.00095 x Mn  

3. Results and Discussion

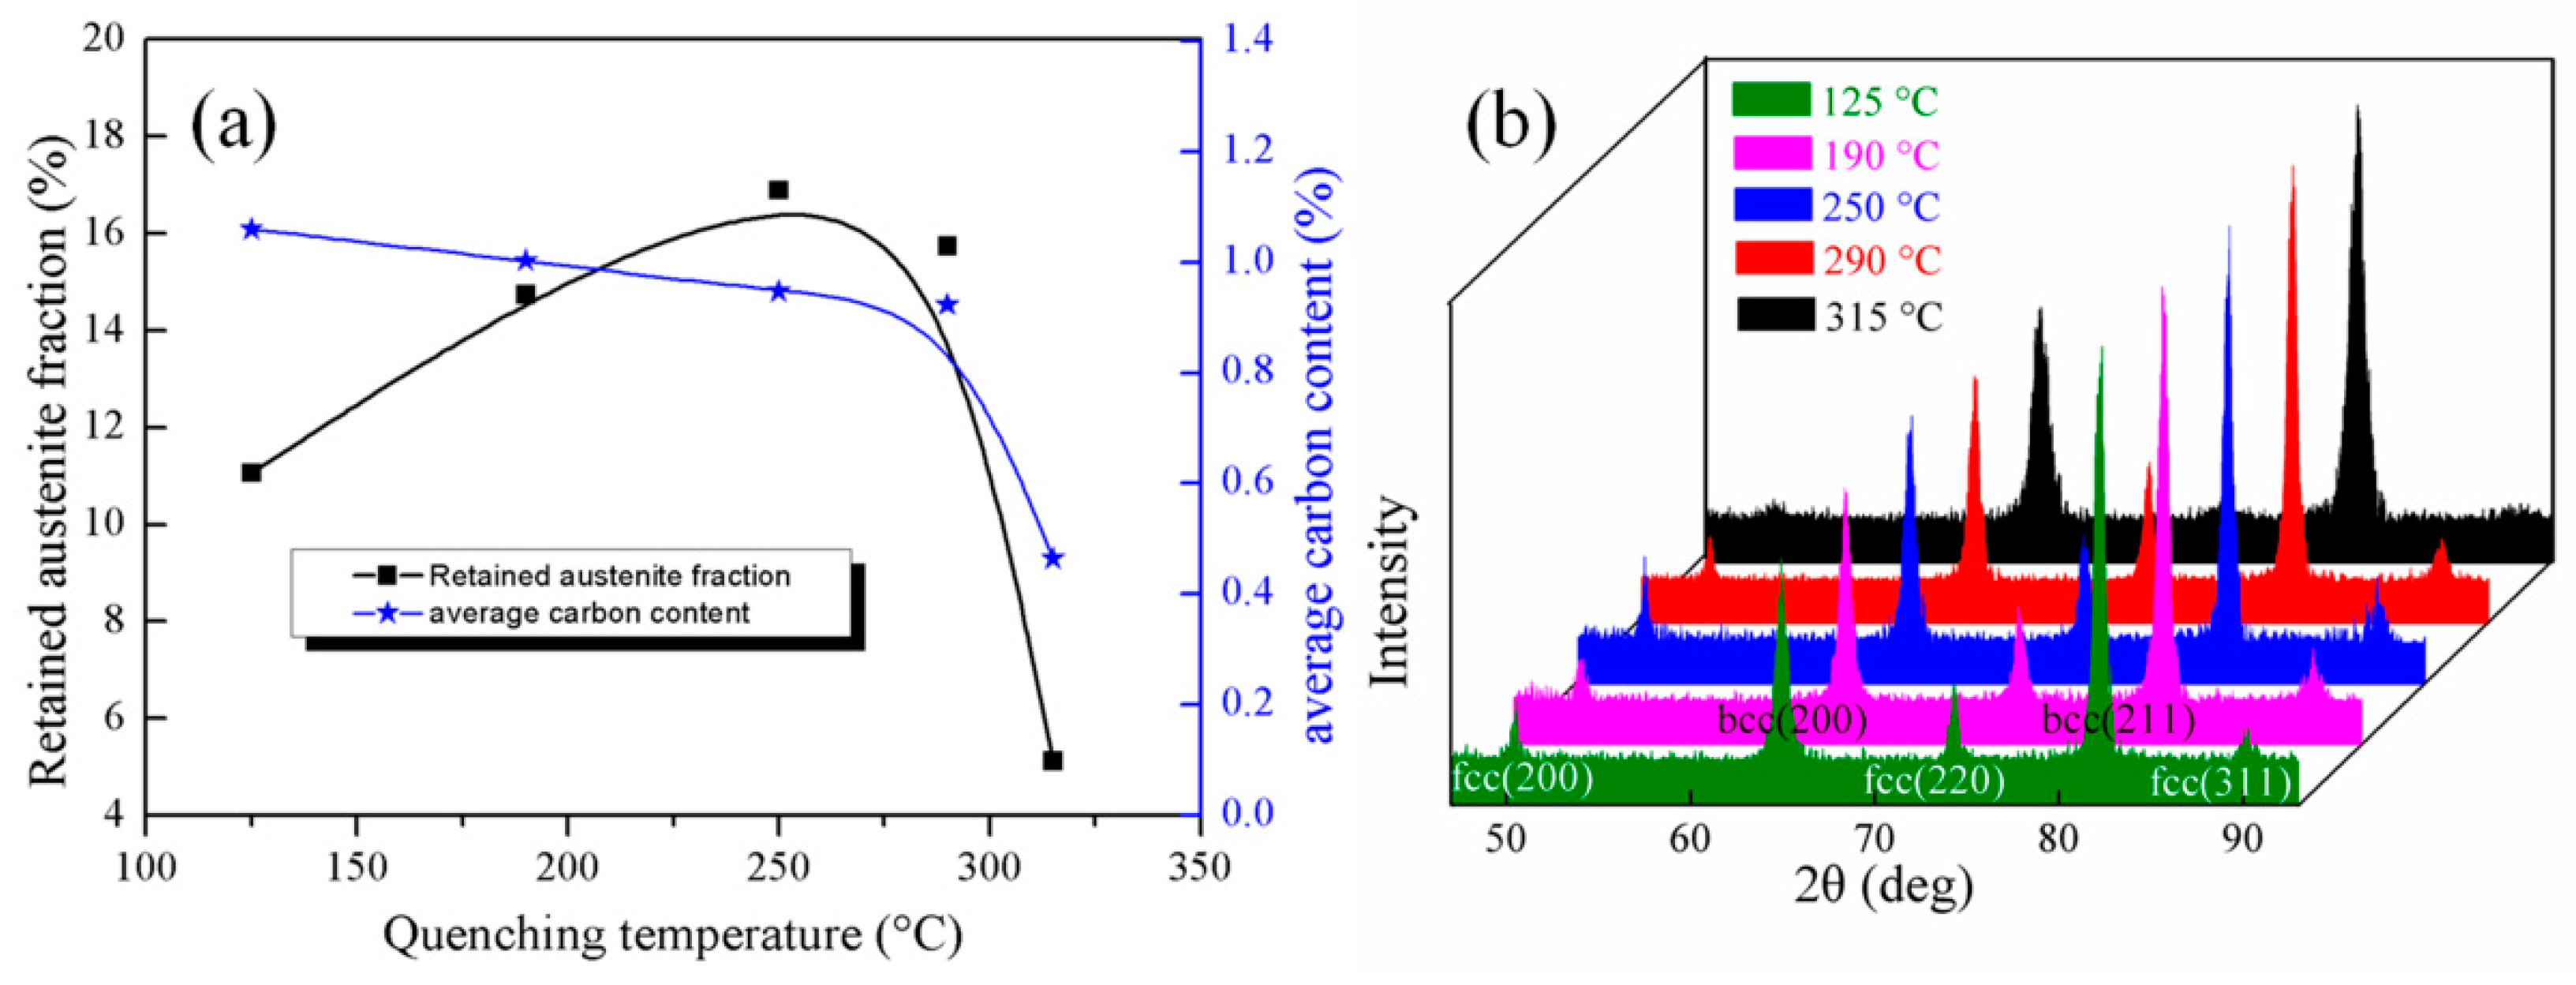
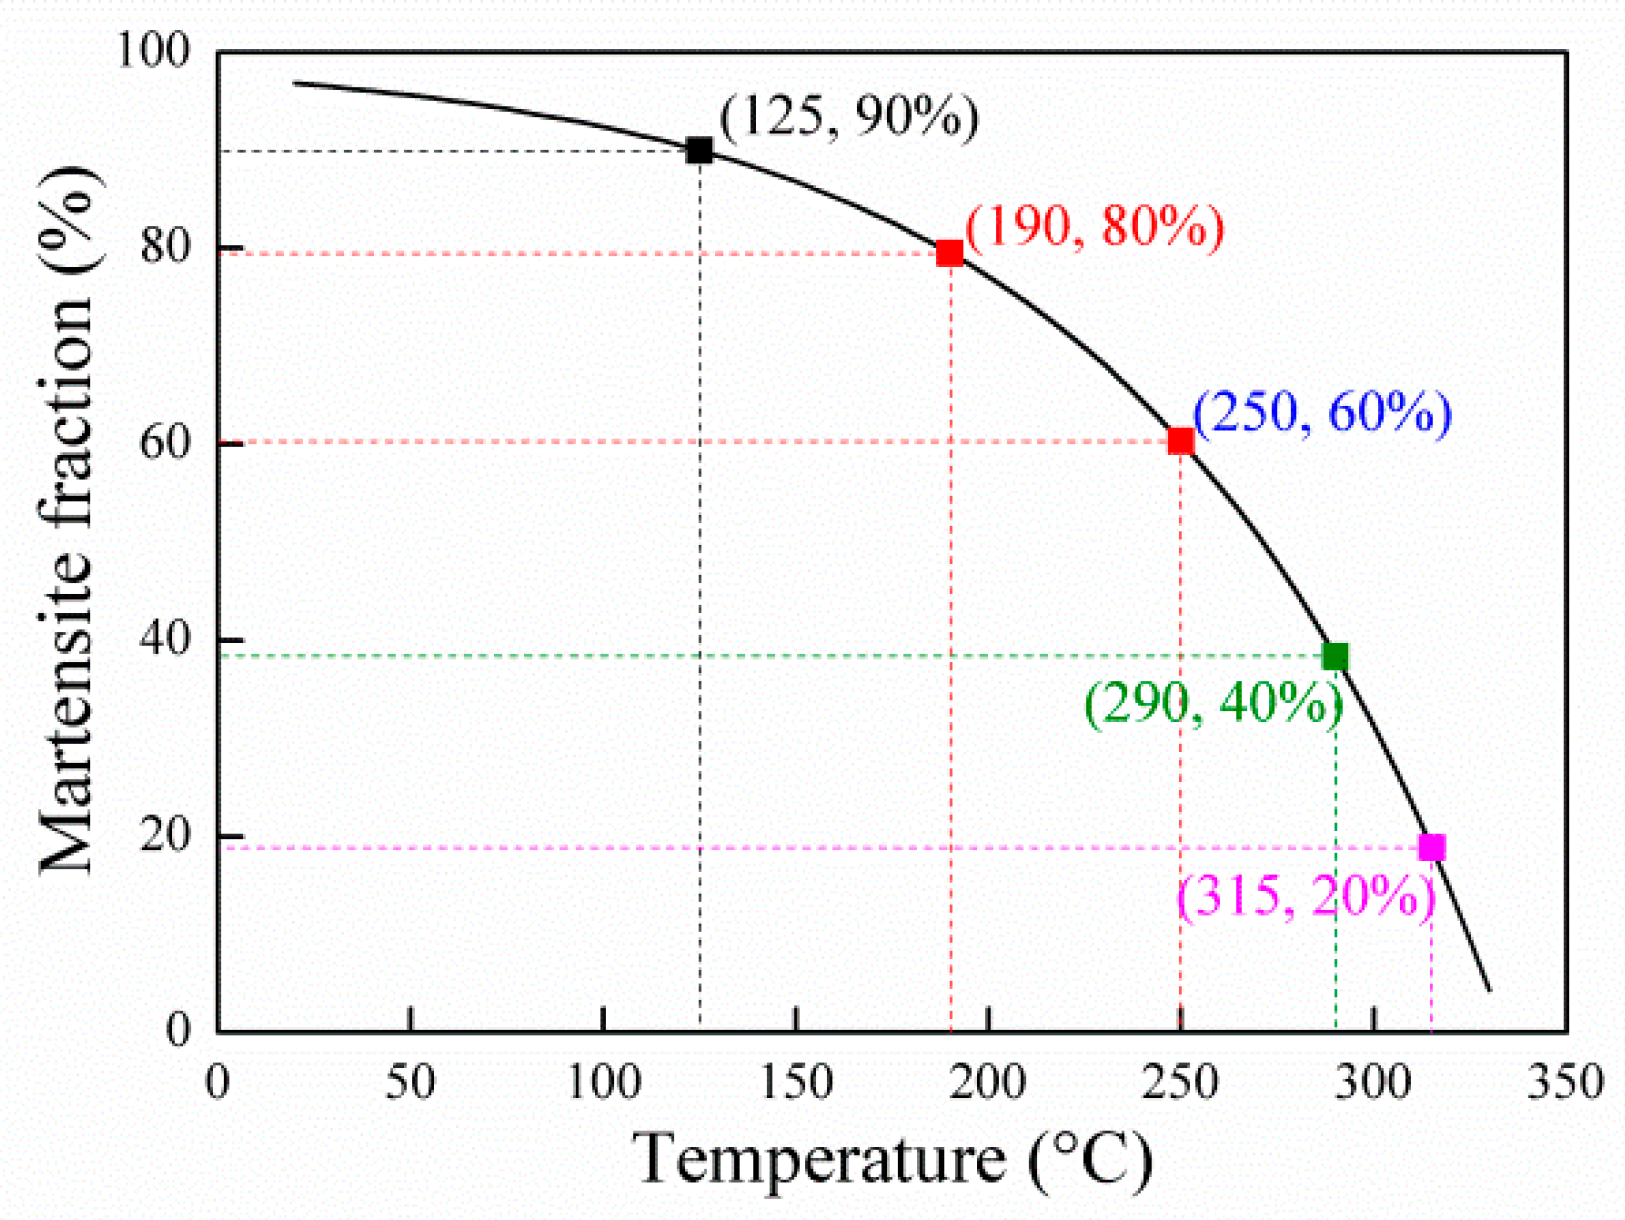
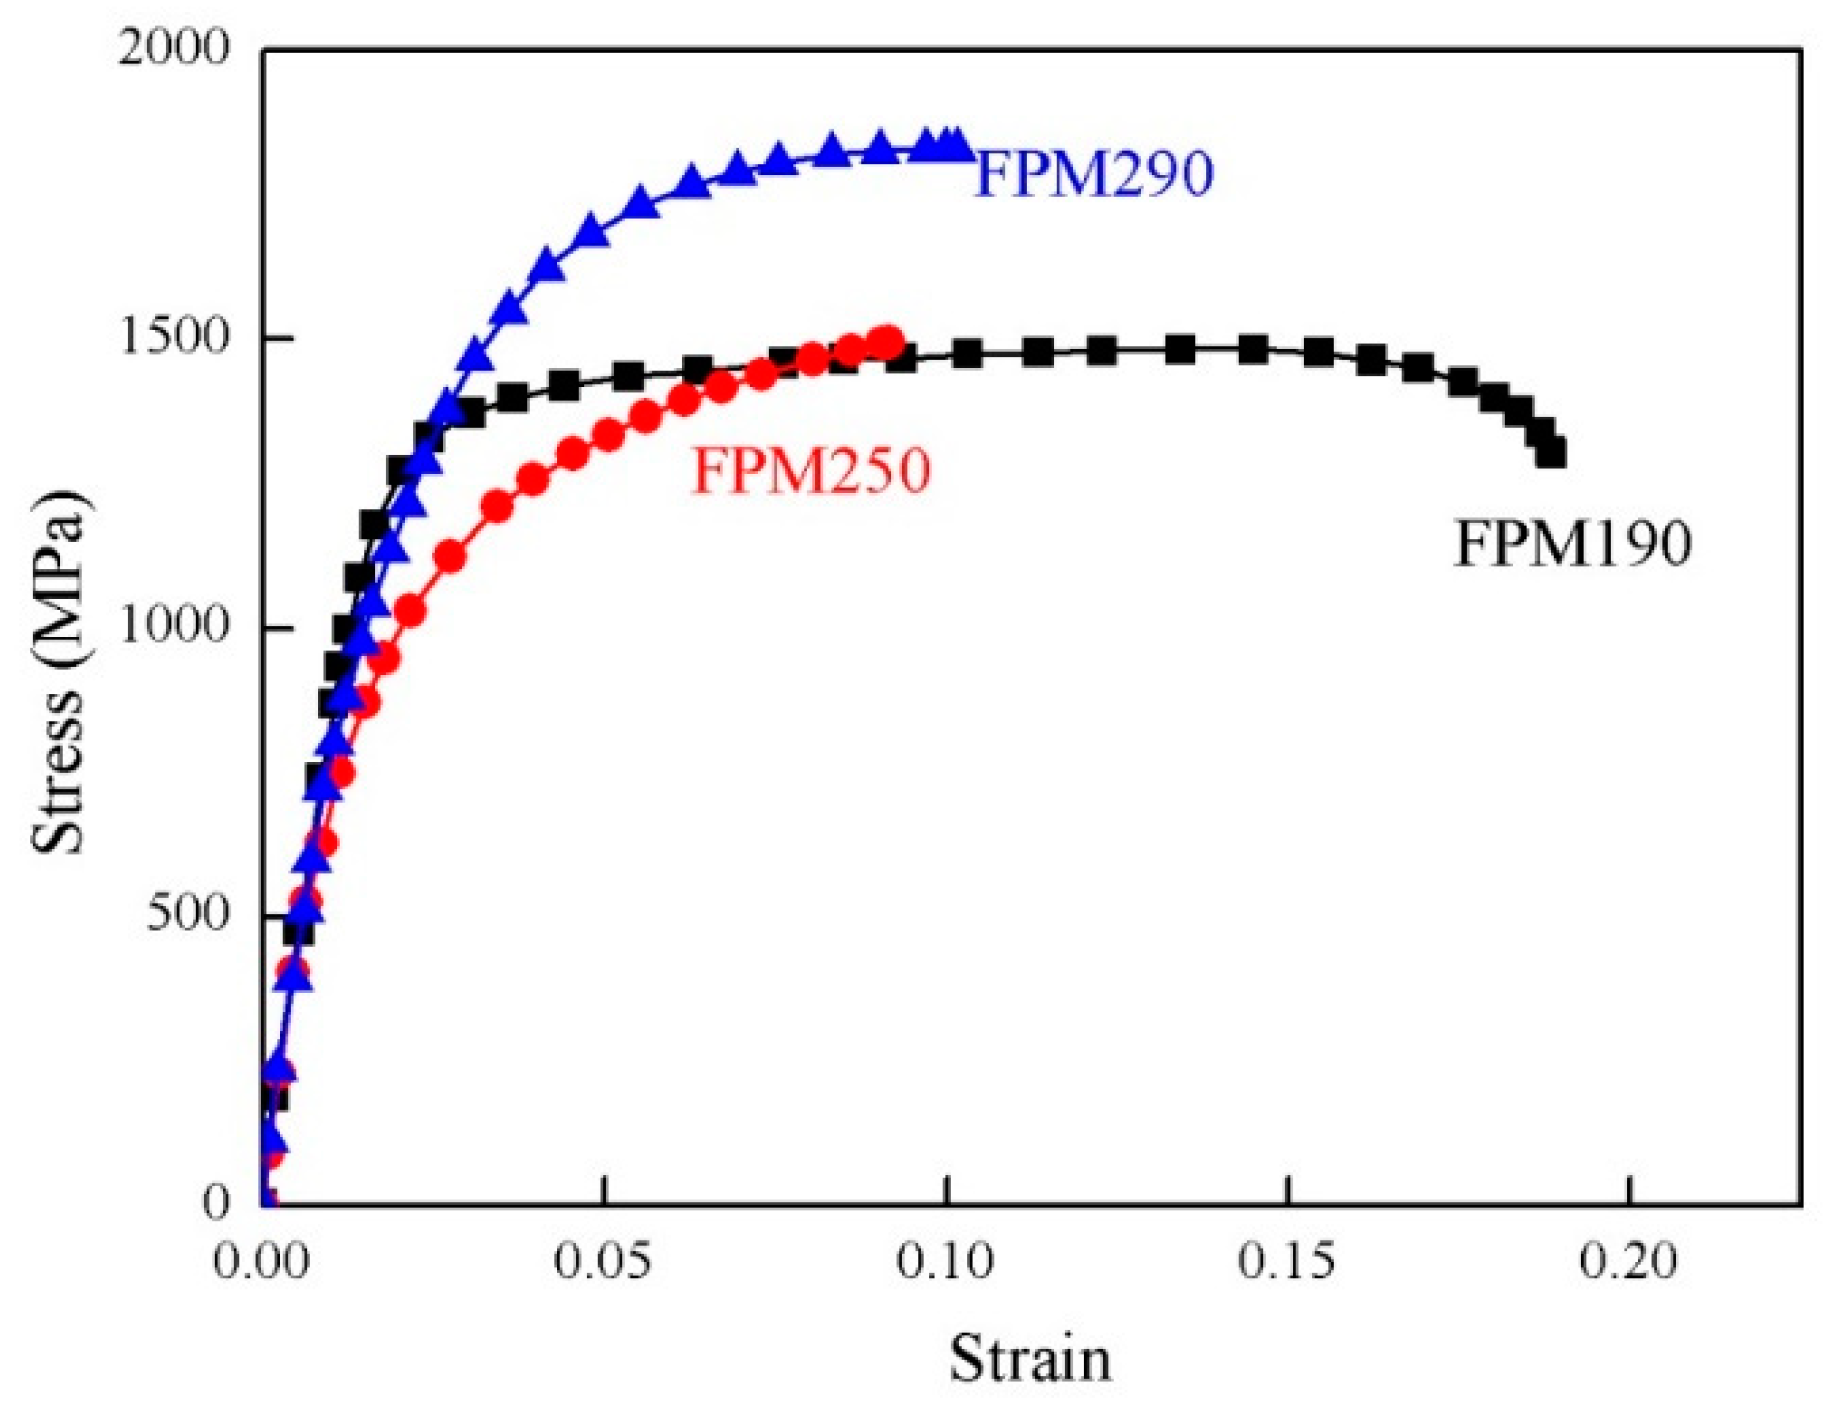
3.1. Optimum Quenching Temperature

The average carbon content and fraction of retained austenite under different quenching temperatures was detected by XRD, as shown in Figure 4. The average carbon content of the retained austenite increased with the decrease of the quenching temperature. The different primary martensite fractions influenced by the various quenching temperatures account for the phenomenon. With the decreasing quenching temperature, more primary martensite formed in the first quenching process. The carbon enrichment of the retained austenite occurred more easily during the partitioning process, since the higher primary martensite fraction at the lower quenching temperature ensures sufficient carbon diffusion into the retained austenite. In terms of the sample quenched at 315 °C, the lowest primary martensite fraction of 20%, estimated by the K-M relationship during the first quenching process, can hardly provide sufficient carbon to stabilize the retained austenite with a fraction of 80% during the partitioning process. Therefore, it has the lowest average carbon content.
The difference in results between the retained austenite fraction obtained through theoretical calculation (Figure 1) and practical (XRD) measurement (Figure 4) is expected. As mentioned earlier, both the inevitable precipitation of carbides and austenite/martensite interfacial migration are neglected in the CCE model, and the deviation of the K-M equation itself in the prediction of the martensite fraction as well as the computing error of the Ms temperature by the empirical relation (Equation (1)) will all affect the accuracy of the theoretical calculation shown in Figure 1. In addition, as shown in the TEM photographs (Figure 5), the presence of floc-like carbides inside the tempered martensite laths in the FPM190 sample also demonstrates the inevitability of carbide formation during the partitioning process. Although the quenching temperature varied from 190 °C to 290 °C, the retained austenite fraction of all three samples remained at a similar level (above 14%). The corresponding mechanical properties after the tensile tests are shown in Figure 6. Although there is no highest retained austenite content in FPM190, it exhibits good overall mechanical properties with both a tensile strength exceeding 1400 MPa and a total elongation exceeding 15%. The lower quenching temperature of 190 °C resulted in the higher primary martensite fraction after the quenching process. Accordingly, the prior austenite grains were divided into the smaller retained austenite grains. Similar conclusions were reported in a previous paper [30]. In other words, the more primary martensite, the smaller the retained austenite grain size. Therefore, the stability of the retained austenite can be enhanced. The microstructure under the EBSD experiment, as shown in Figure 7, fits well with this explanation. Compared with the microstructure of FPM190, there is significantly more large-sized blocky fresh martensite in FPM250 and FPM290. The higher quenching temperatures of 250 °C and 290 °C result in a lower primary martensite fraction after the quenching process. Thus, unlike the small austenite grains divided by the primary martensite in FPM190, the large-sized blocky austenite will be retained in both FPM250 and FPM290. During the subsequent partitioning process, these large-sized blocky austenite grains, if not fully carbon-enriched and stabilized, will become fresh martensite in the second quenching process. The presence of such blocky fresh martensite is the main reason for the premature failure of materials [31,32], and should be avoided in Q&P steels in order to obtain better mechanical properties.

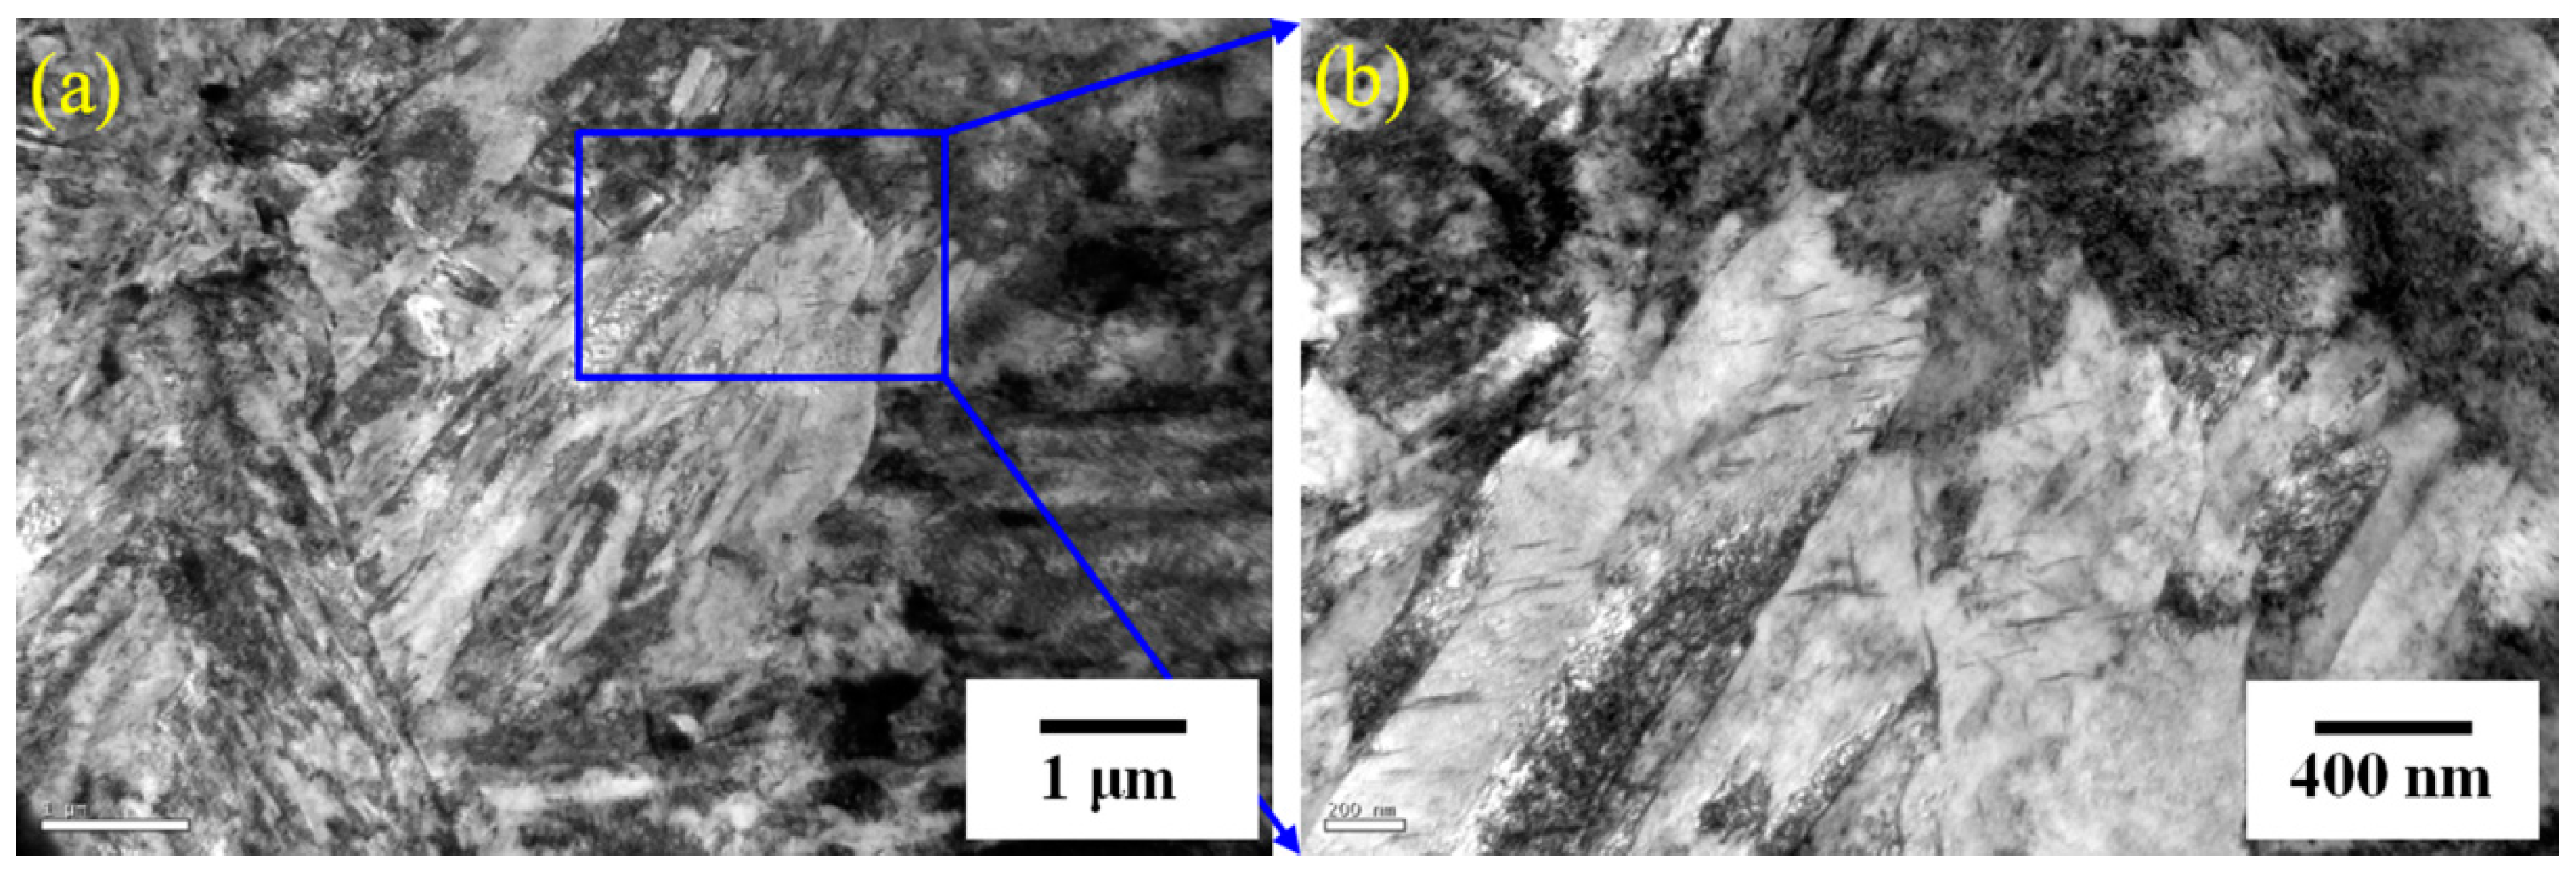
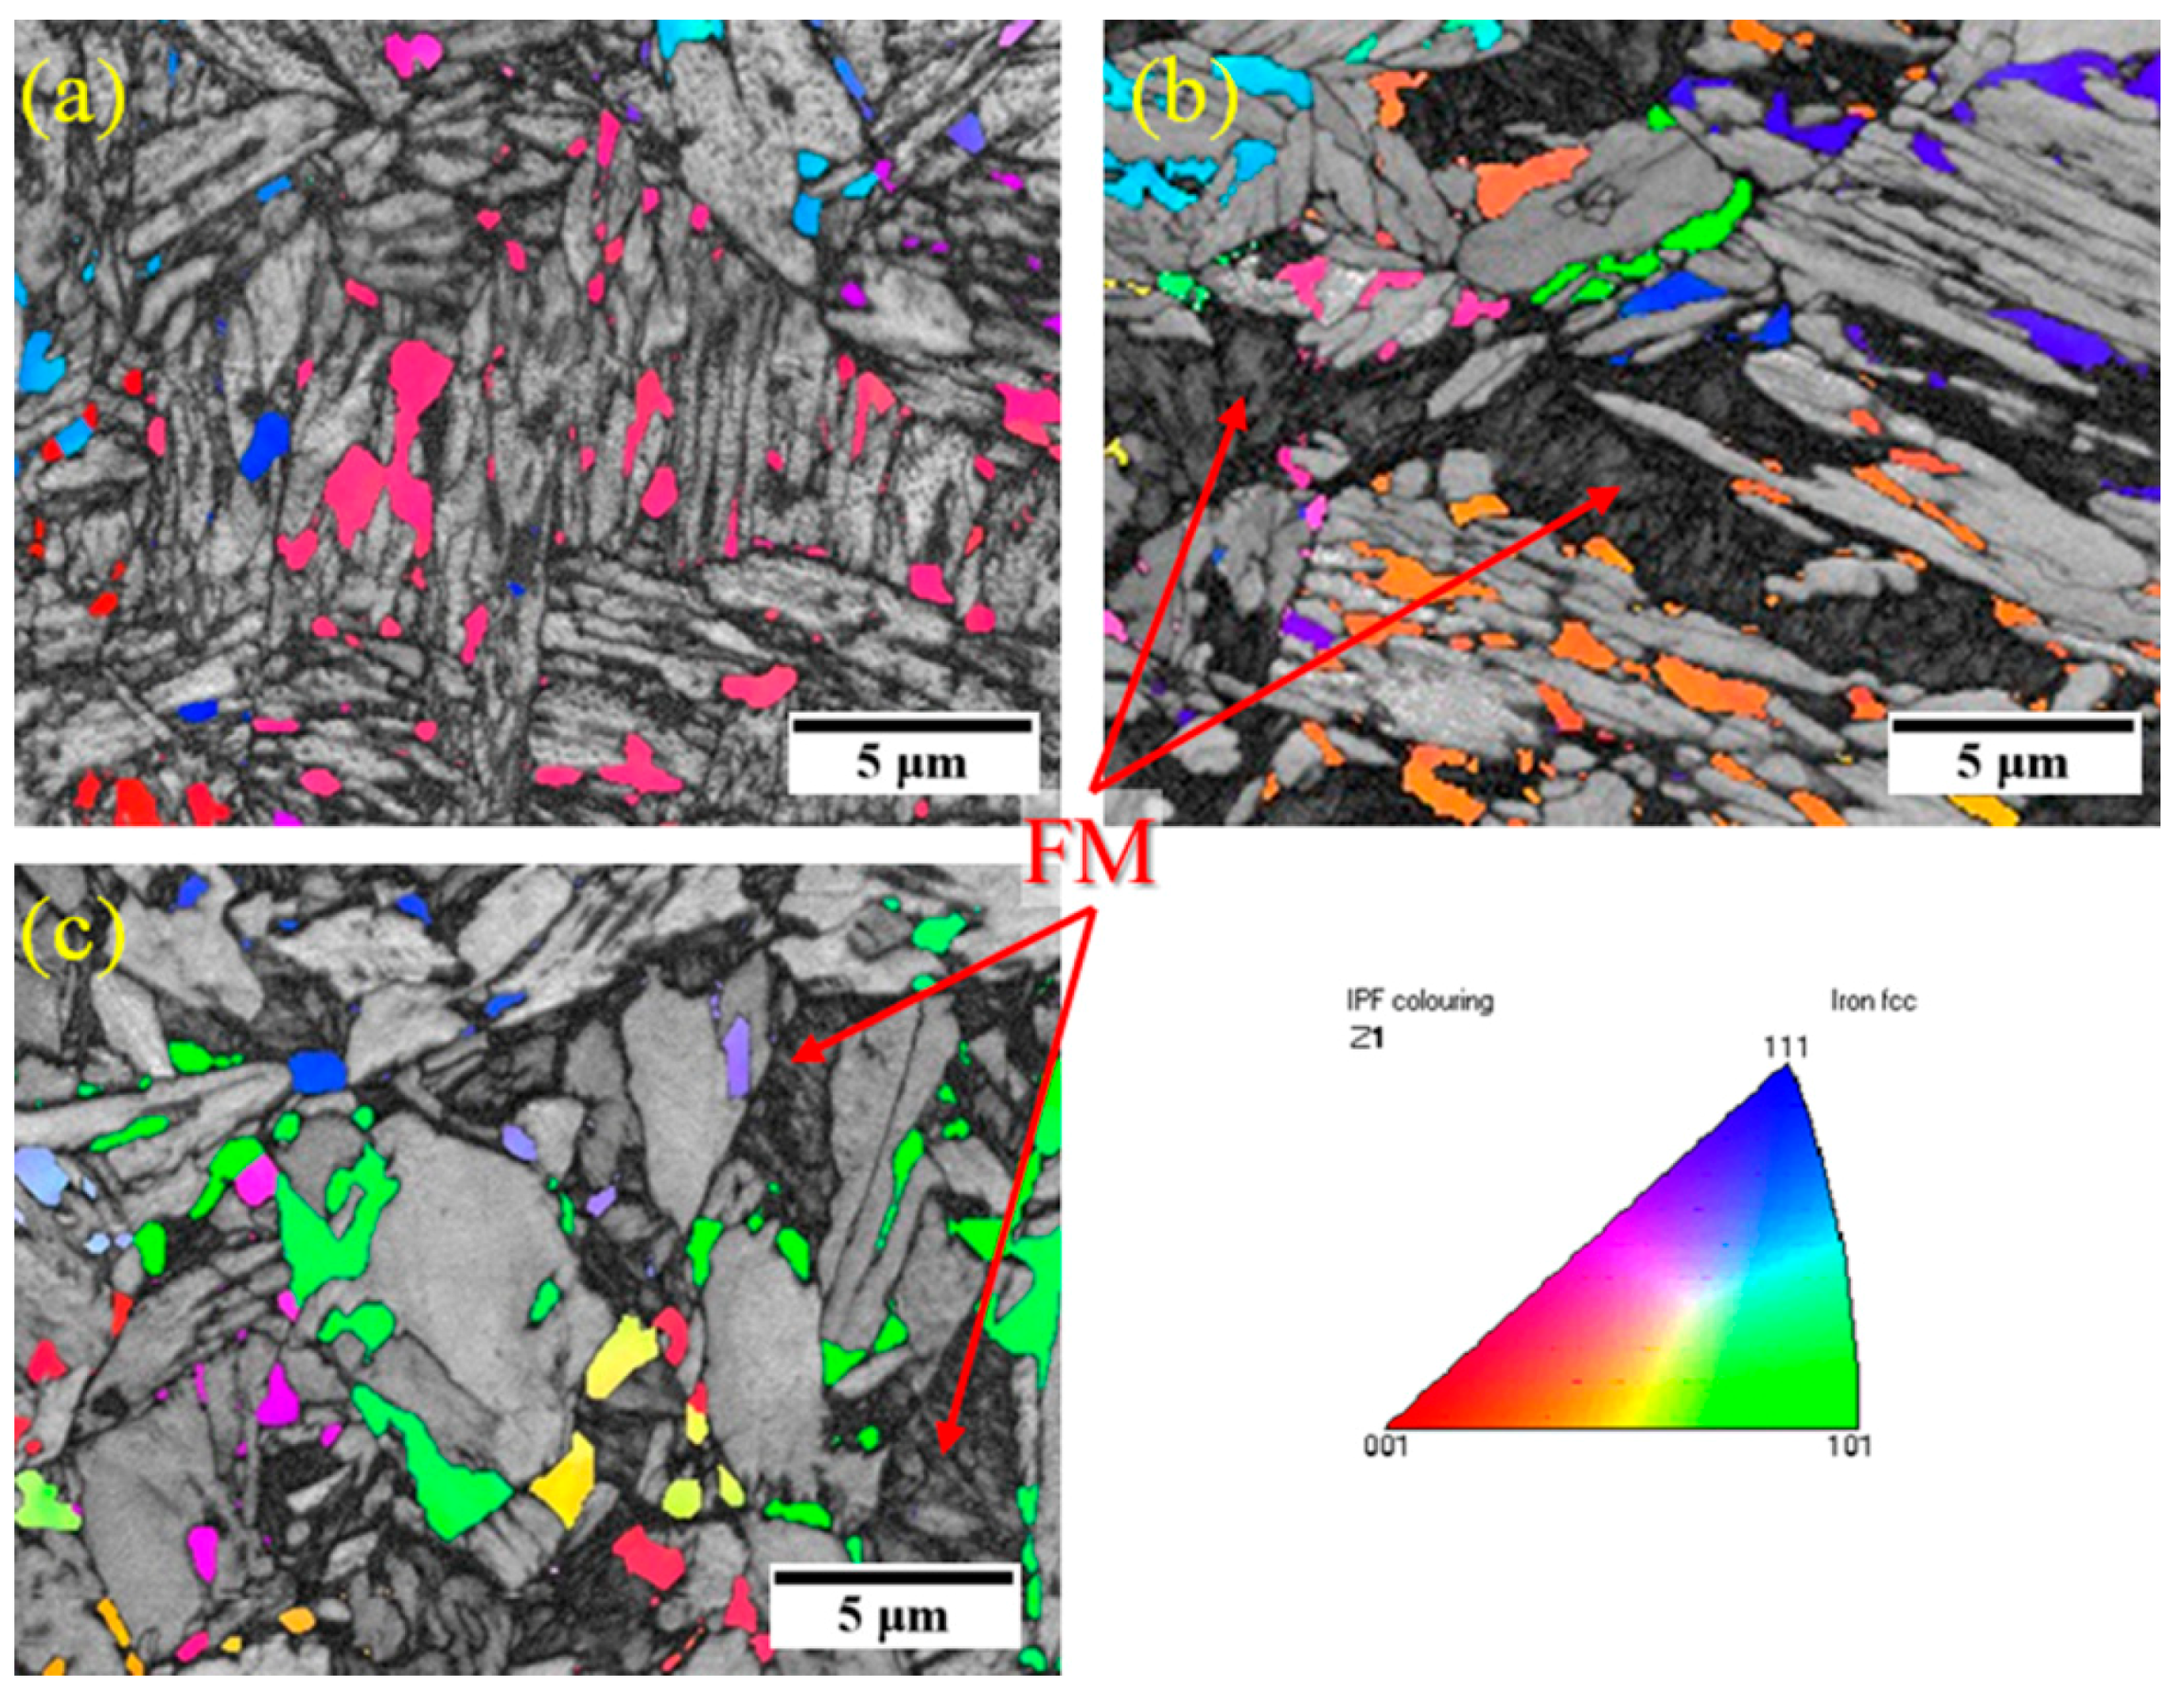
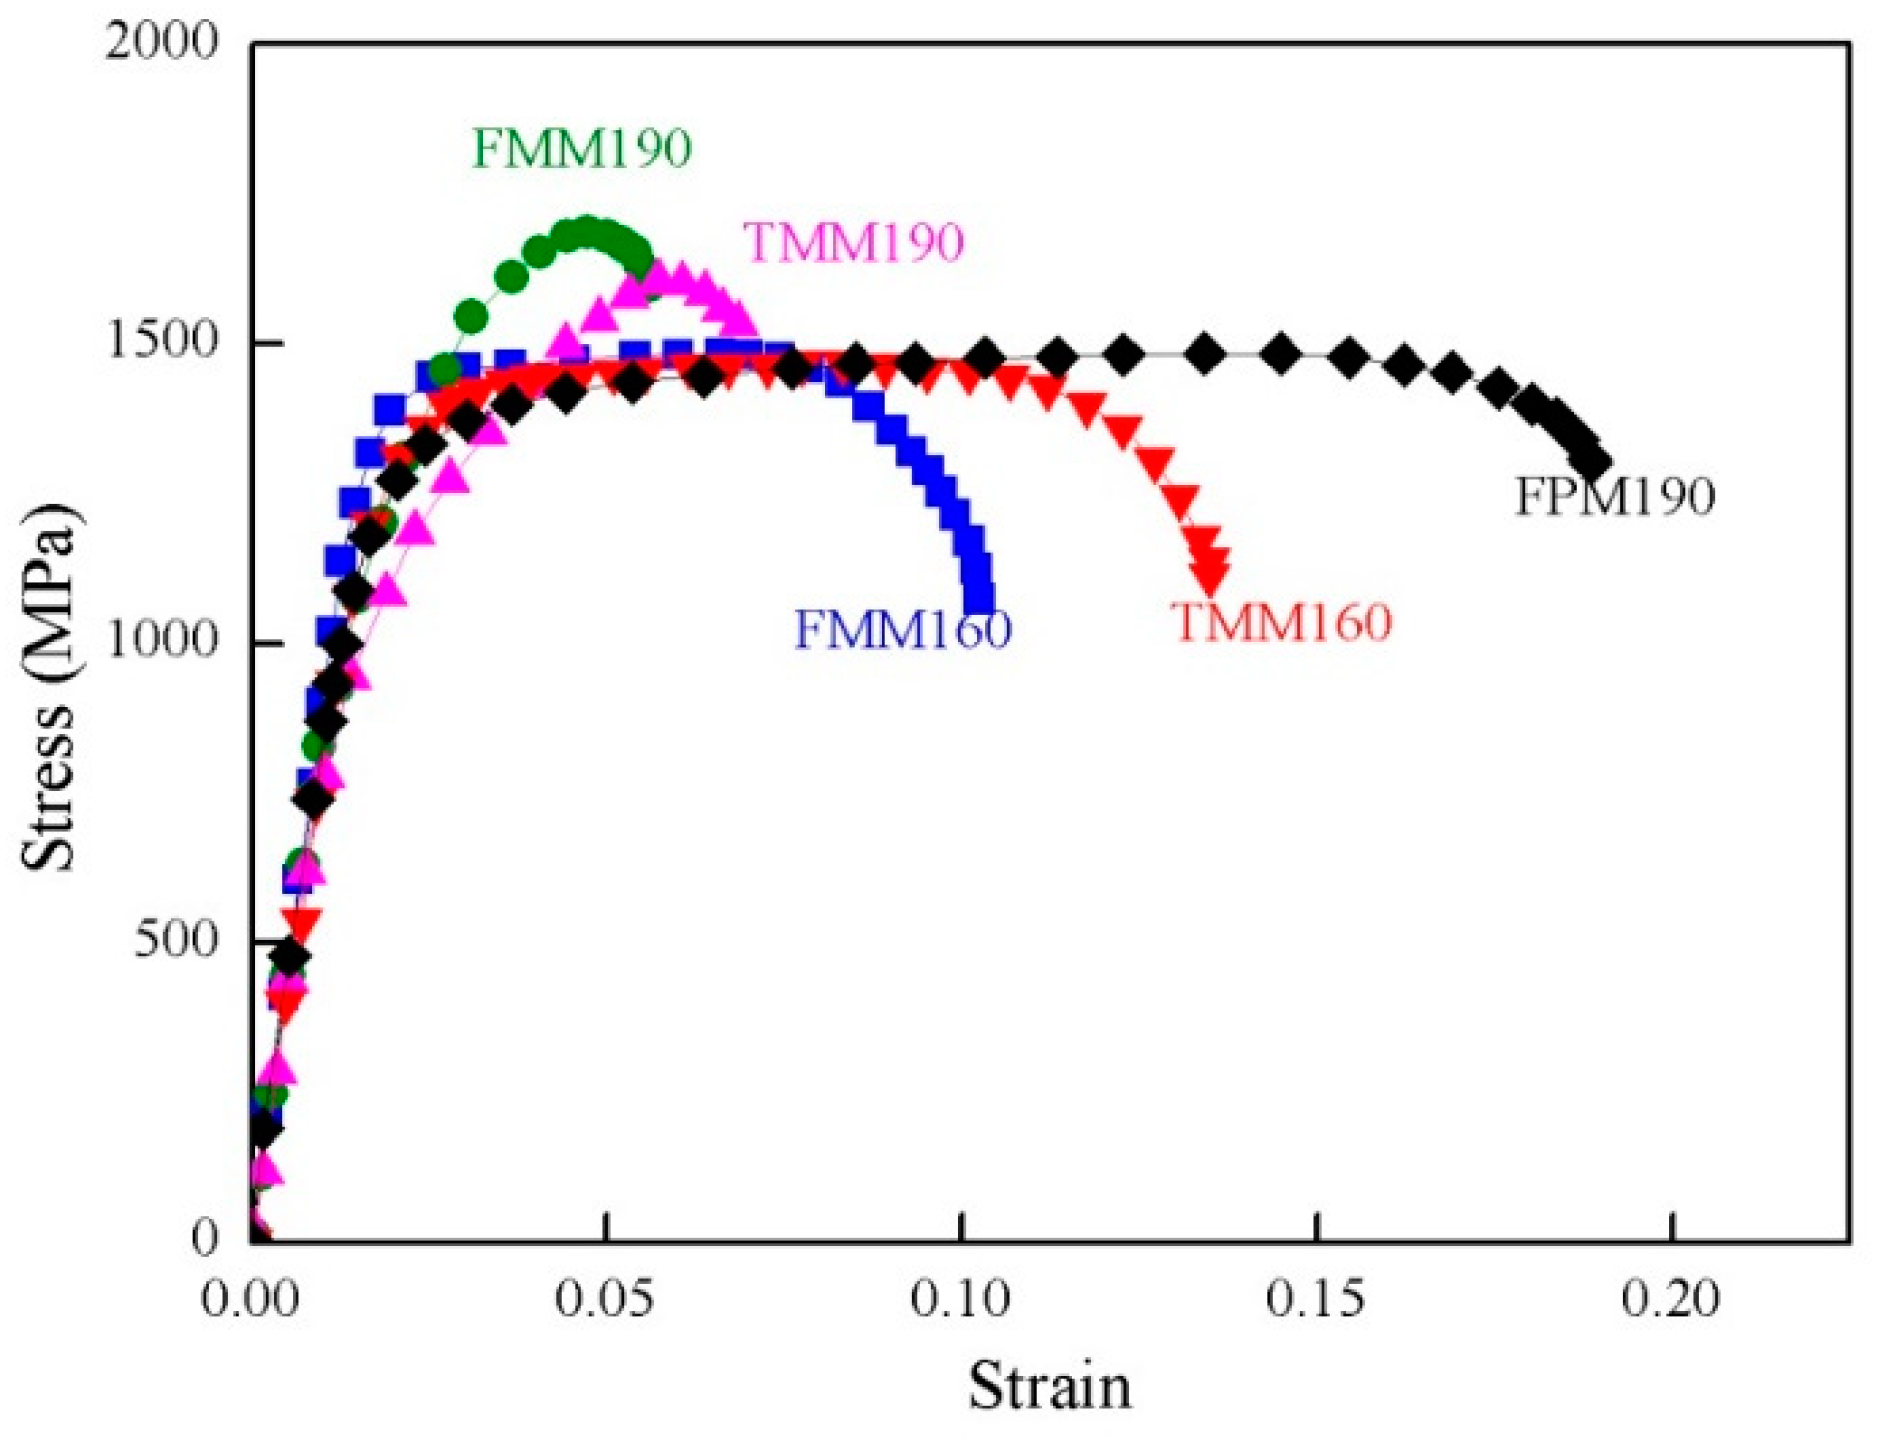
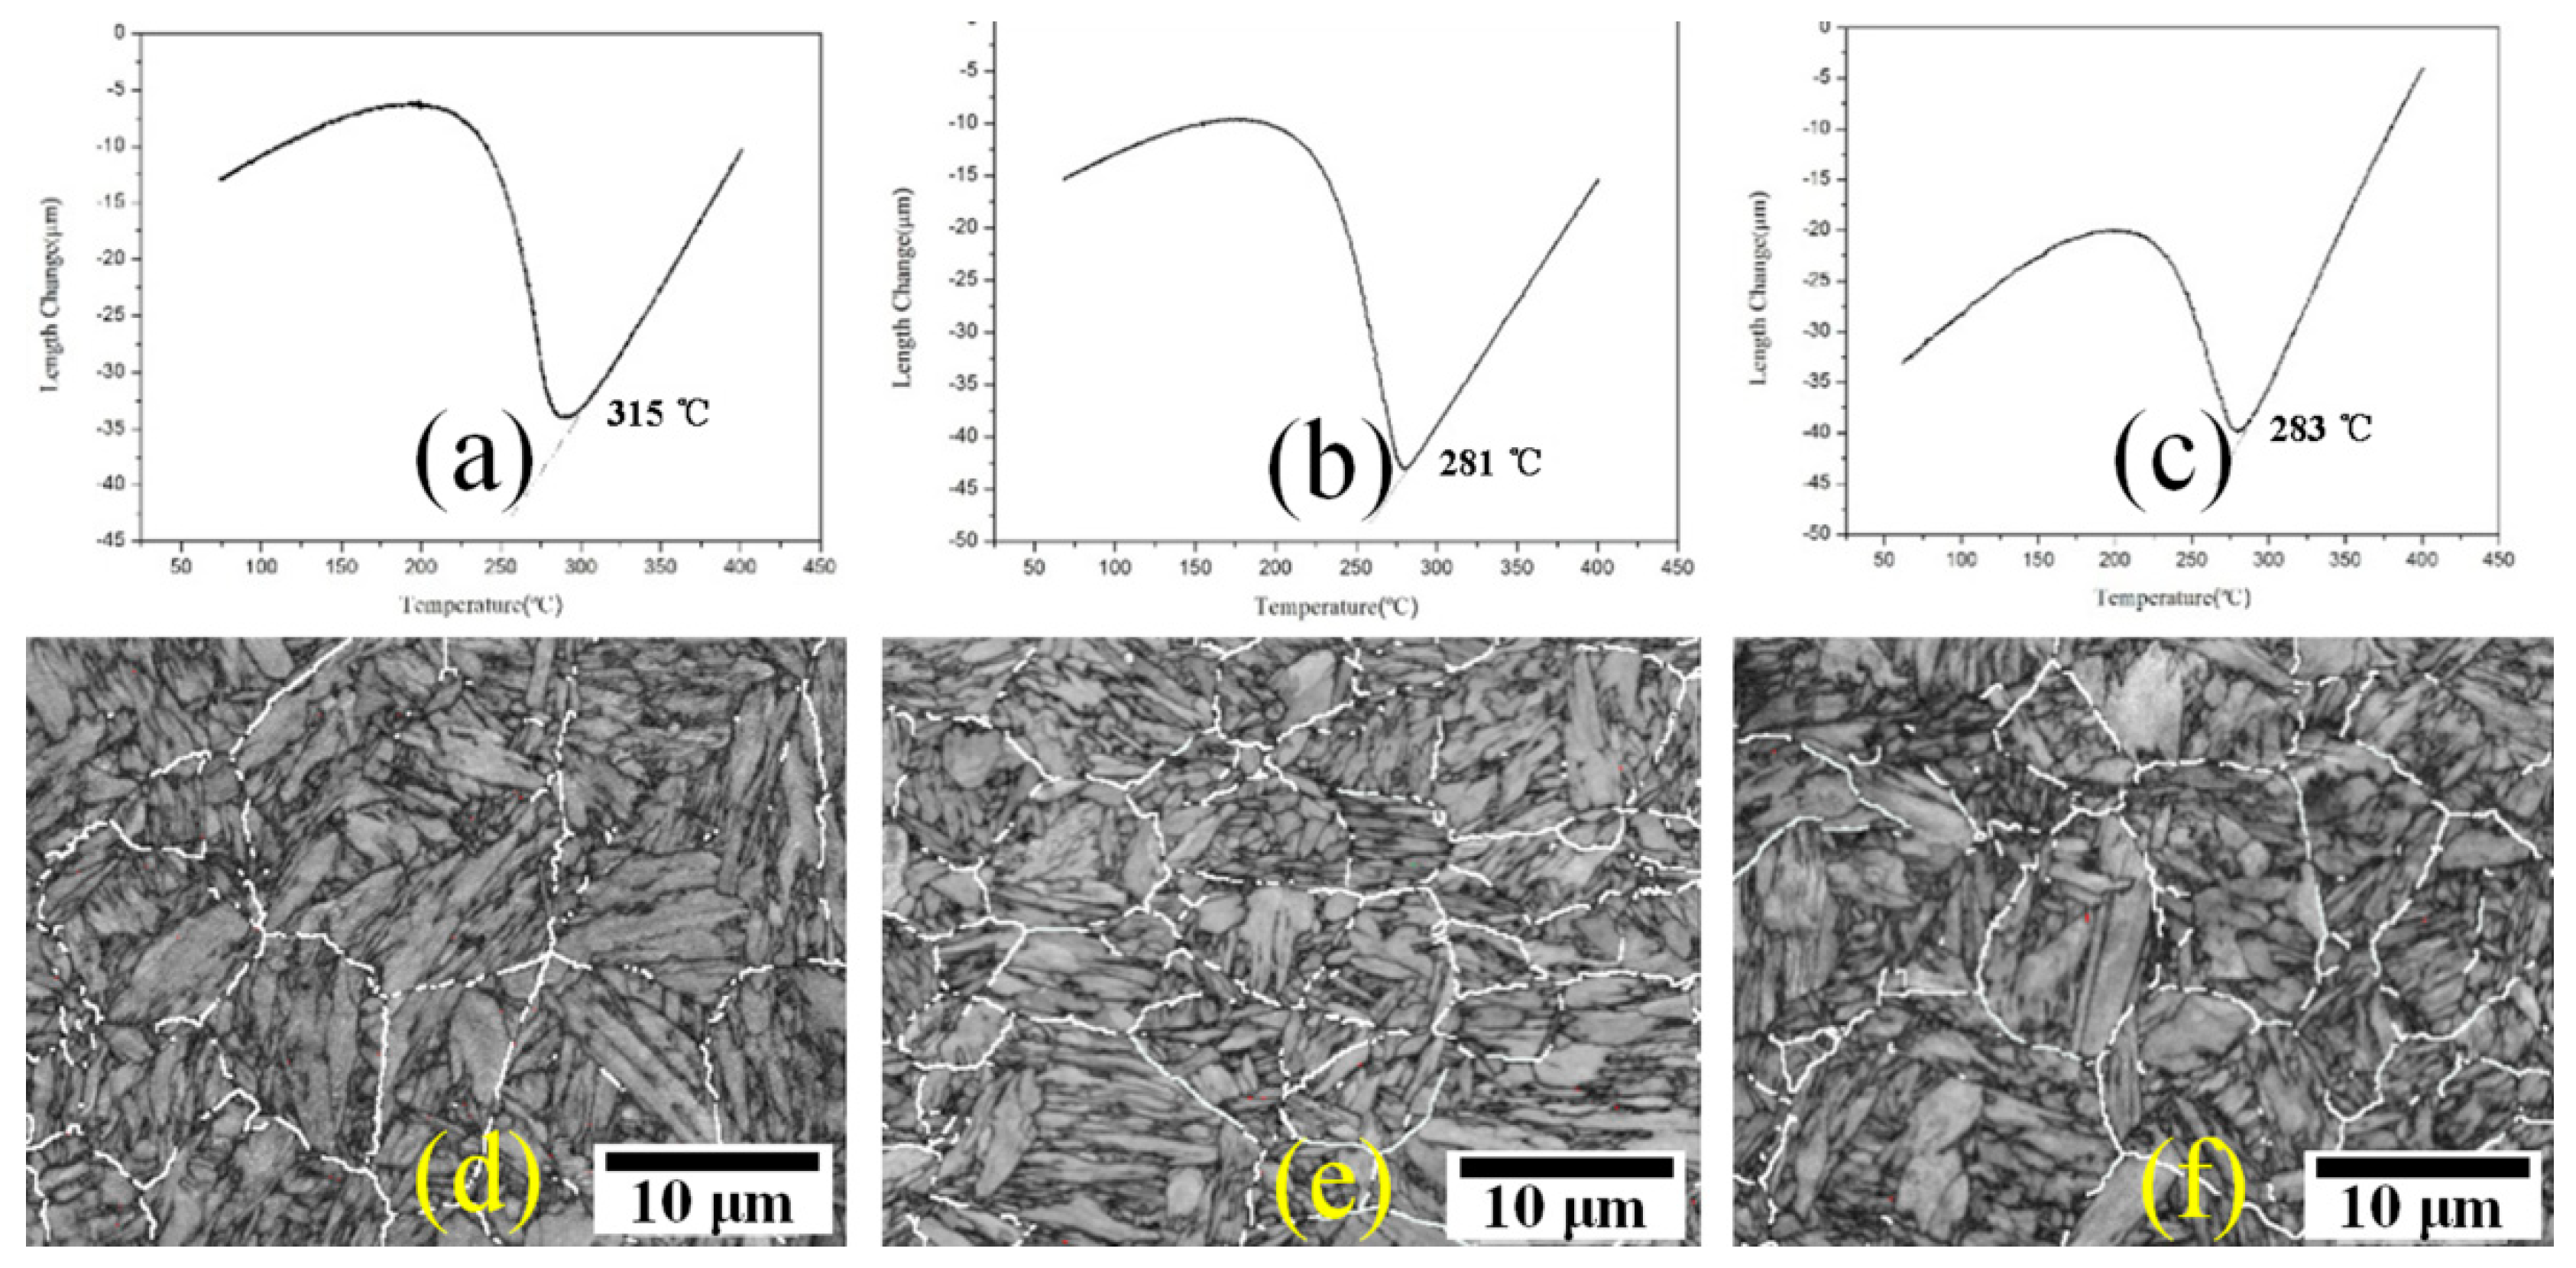
3.2. Ms Temperature and Microstructure Characterization under Different Matrixes

The same heat treatment process with an optimum quenching temperature of 190 °C was applied to the respective cold-rolled plates of three different hot-rolled microstructures. It is worth noting that the mechanical properties of both the fresh martensite and tempered martensite matrix samples were totally different from the ferrite and pearlite matrix sample, as shown in Figure 8. Another lower quenching temperature of 160 °C was added for further investigation, the tensile properties of which are also shown in Figure 8. It is evident that the overall mechanical properties of the FMM and TMM samples significantly improved as the quenching temperature was reduced to 160 °C. This means that the optimum quenching temperature was likely to have shifted to lower temperatures in both the fresh martensite and tempered martensite matrix samples.
The dilatometer results of the three matrix cold-rolled microstructures also accounts for the abovementioned tensile properties and the fact that the optimum quenching temperature shifted to a lower temperature. After the same austenitizing treatment and subsequent rapid cooling to room temperature, the corresponding Ms temperatures of the three samples exhibited different values, as shown in Figure 9. The Ms temperatures of both the FMM and TMM samples had a similar value of about 281 °C, while the Ms temperature of the FPM sample had the higher value of 315 °C. These values are different from the Ms temperature of 334 °C of the sample previously machined from the ingot, that is, both the rolling process and the subsequent heat treatment process had a non-negligible effect on the Ms temperature. This change of Ms temperature directly lead to the difference in the optimum quenching temperature of these three different matrix samples.
As the research indicates [33,34,35], the Ms temperature decreases with the reduction of the prior austenite size. In order to show the differences in microstructure, we depicted the prior austenite grain with the help of EBSD, as shown in Figure 9. Most of the boundaries created during the martensite transformation were either low angle boundaries (<15 °) or high angle boundaries in the range from 50° to 63° [36]. Consequently, the possible prior austenite grain boundaries are characterized, with a misorientation between 18° and 47°, by solid white lines in Figure 9. The prior austenite grain size of the FPM sample was significantly higher than that of the other two samples, which was consistent with the difference in the Ms temperatures. Therefore, the fine prior austenite grain size resulting from the cold rolling of the martensitic matrix was the main reason for the optimum quenching temperature shifting to a low temperature in the Q&P steels.

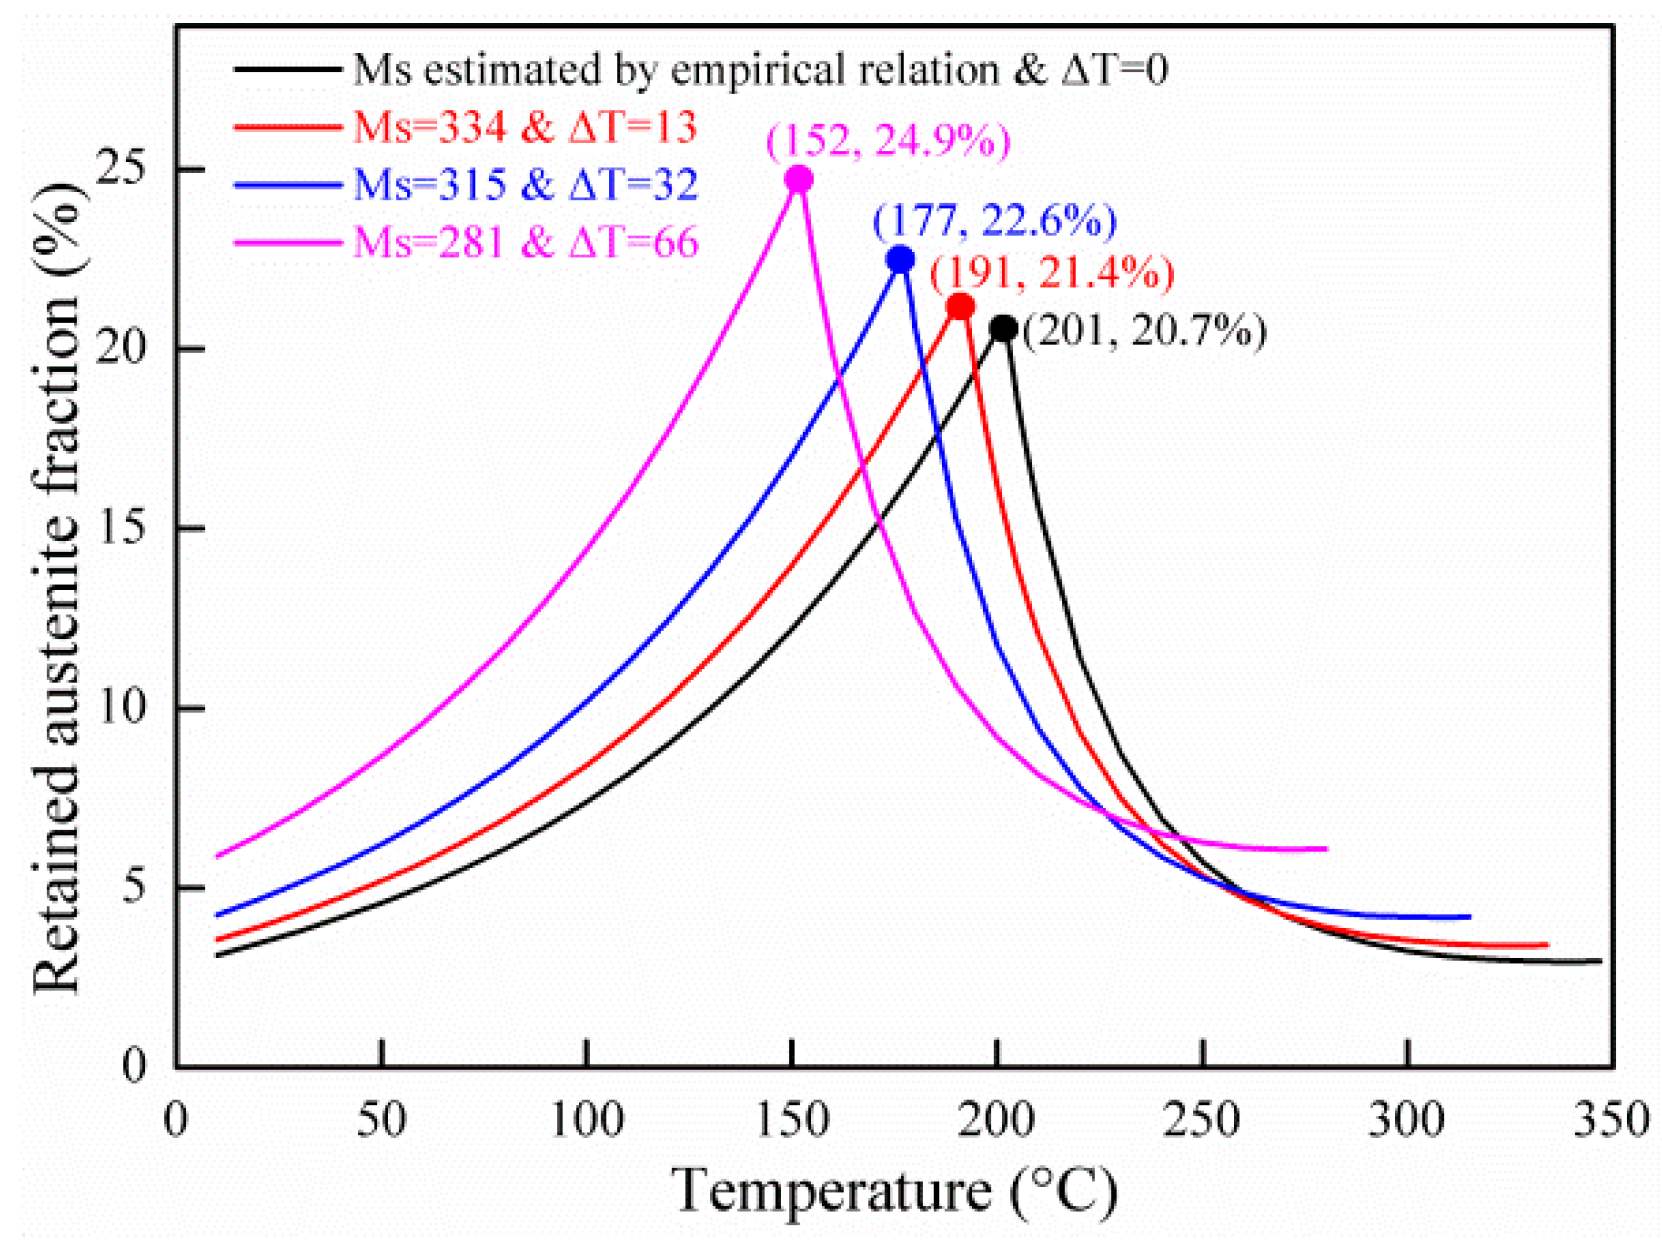
3.3. Modified Empirical Formula

We re-examined the accuracy of the method in calculating the optimum quenching temperature using the CCE balance equation and empirical formula. Table 2 shows the Ms temperature measured by the dilatometric method and the Ms temperature provided by the empirical formula; ΔT indicates the difference the between the measured value and the calculation results. Subsequently, this difference was introduced into the empirical formula in Equation (1), as shown in Equation (4). The modified empirical formula was combined with the CCE balance equation to re-estimate the optimum quenching temperature. The corresponding results are shown in Figure 10.
  M s = 539 42300 C 3040 Mn 750 Si 1770 Ni Δ T  
Obviously, for the empirical formula as in Equation (1), simply considering the alloy composition to estimate the Ms temperature is not completely accurate. This difference is also one of the reasons for the difference between the theoretical calculation and the actual optimum quenching temperature. The theoretically calculated optimum quenching temperature varies significantly with the Ms temperature. The optimum quenching temperature is transferred from the highest value of 201 °C to the lowest temperature of 152 °C, corresponding to the steel ingot sample with a Ms temperature of 334 °C and the cold-rolled martensite matrix sample with a Ms temperature of 281 °C, respectively. Ignoring the deviation between the theoretical calculation and the actual optimum quenching temperature, we found that there is a certain relationship between the difference in Ms temperature in the three matrix samples and the optimum quenching temperature. Specifically, the actual optimum quenching temperature of 160 °C for the martensitic matrix sample is about 30 °C lower than that of 190 °C for the cold-rolled ferrite pearlite mixture matrix sample. Similarly, the theoretically calculated optimum quenching temperature also had a difference of 25 °C (177 °C–152 °C). Correspondingly, the Ms temperature difference was about 34 °C (315 °C–281 °C). In general, even with the same heat treatment, the three different cold-rolled matrixes of the same alloy composition exhibited different mechanical properties and microstructures, mainly due to differences in the actual optimum quenching temperature and the Ms temperature influenced by the prior austenite grain size.

4. Conclusions

In this paper, the effect of different matrixes after cold rolling on subsequent Q&P parameters was systematically studied. For Q&P-treated ferrite and pearlite matrix samples, despite having a high retained austenite fraction at both the quenching temperatures of 250 °C and 290 °C, a large amount of massive blocky fresh martensite is present, leading to premature fracturing during stretching, while at the optimum quenching temperature of 190 °C, the fine uniform microstructure without the fresh martensite contributes to good overall mechanical properties.
The same Q&P process was applied to the cold-rolled sheet of both fresh martensitic matrix and tempered martensite samples, and the mechanical properties of the three samples exhibited significant differences. Various prior austenite grain sizes and Ms temperatures, which were verified by dilatometric curve analysis and EBSD map observation, account for the differences existing in the optimum quenching temperature and the resultant mechanical properties. Compared with the higher Ms temperature of 315 °C in the cold-rolled ferrite and pearlite matrix sample, the reduction of the Ms temperature in the cold-rolled martensitic matrix samples (281 °C in FMM and 283 °C TMM) is the primary reason for the transfer of the optimum quenching temperature from 190 °C to 160 °C. Besides, the empirical formula simply considering the alloy composition when estimating the Ms temperature will cause a certain interference to the prediction of actual optimum quenching temperature in the Q&P steels.

Author Contributions

B.C., J.L., Z.Z., and D.T. conceived and designed the experiments; B.C., T.K., R.C., C.L., J.L. and F.L. performed the experiments; B.C., Z.Z. and J.L. analyzed the data; B.C. and J.L. wrote the paper; Z.Z., F.L. and D.T. improved the language in this paper.

Funding

This research was funded by National Natural Science Foundation of china grant number (51574028) and National Key R&D Program of China grant number (2017YFB0304401).

Acknowledgments

This research was supported by the National Natural Science Foundation of China (Grant no. 51574028) and National Key R&D Program of China (2017YFB0304401).

Conflicts of Interest

The authors declare no conflict of interest.

References

  1. Speer, J.; Matlock, D.K.; De Cooman, B.C.; Schroth, J.G. Carbon partitioning into austenite after martensite transformation. Acta Mater. 2003, 51, 2611–2622. [Google Scholar] [CrossRef]
  2. Speer, J.G.; Edmonds, D.V.; Rizzo, F.C.; Matlock, D.K. Partitioning of carbon from supersaturated plates of ferrite, with application to steel processing and fundamentals of the bainite transformation. Curr. Opin. Solid State Mater. Sci. 2004, 8, 219–237. [Google Scholar] [CrossRef]
  3. Speer, J.; Hackenberg, R.; Decooman, B.; Matlock, D. Influence of interface migration during annealing of martensite/austenite mixtures. Philos. Mag. Lett. 2007, 87, 379–382. [Google Scholar] [CrossRef]
  4. Speer, J.; De Moor, E.; Clarke, A. Critical assessment 7: Quenching and partitioning. Mater. Sci. Technol. 2015, 31, 3–9. [Google Scholar] [CrossRef]
  5. Hsu, T.Y.; Jin, X.J.; Rong, Y.H. Strengthening and toughening mechanisms of quenching-partitioning-tempering (Q-P-T) steels. J. Alloys Compd. 2013, 577, 568–571. [Google Scholar]
  6. Santofimia, M.J.; Zhao, L.; Sietsma, J. Overview of mechanisms involved during the quenching and partitioning process in steels. Metall. Mater. Trans. A 2011, 42, 3620–3626. [Google Scholar] [CrossRef]
  7. Santofimia, M.J.; Zhao, L.; Petrov, R.; Kwakernaak, C.; Sloof, W.G.; Sietsma, J. Microstructural development during the quenching and partitioning process in a newly designed low-carbon steel. Acta Mater. 2011, 59, 6059–6068. [Google Scholar] [CrossRef]
  8. Sun, J.; Yu, H.; Wang, S.Y.; Fan, Y.F. Study of microstructural evolution, microstructure-mechanical properties correlation and collaborative deformation-transformation behavior of quenching and partitioning (Q&P) steel. Mater. Sci. Eng. A 2014, 596, 89–97. [Google Scholar]
  9. De Moor, E.; Speer, J.G.; Matlock, D.K.; Kwak, J.H.; Lee, S.B. Effect of carbon and manganese on the quenching and partitioning response of CMnSi steels. ISIJ Int. 2011, 51, 137–144. [Google Scholar] [CrossRef]
  10. Seo, E.J.; Cho, L.; De Cooman, B.C. Application of quenching and partitioning processing to medium Mn steel. Metall. Mater. Trans. A 2015, 46, 27–31. [Google Scholar] [CrossRef]
  11. Kim, J.H.; Seo, E.J.; Kwon, M.H.; Kang, S.; De Cooman, B.C. Effect of quenching temperature on stretch flangeability of a medium Mn steel processed by quenching and partitioning. Mater. Sci. Eng. A 2018, 729, 276–284. [Google Scholar] [CrossRef]
  12. Hou, Z.; Zhao, X.; Zhang, W.; Liu, H.; Yi, H. A medium manganese steel designed for water quenching and partitioning. Mater. Sci. Technol. 2018, 1–8. [Google Scholar] [CrossRef]
  13. De Moor, E.; Speer, J.G.; Matlock, D.K.; Kwak, J.H.; Lee, S.B. Quenching and partitioning of CMnSi steels containing elevated manganese levels. Steel Res. Int. 2012, 83, 322–327. [Google Scholar] [CrossRef]
  14. Huyghe, P.; Malet, L.; Caruso, M.; Georges, C.; Godet, S. On the relationship between the multiphase microstructure and the mechanical properties of a 0.2C quenched and partitioned steel. Mater. Sci. Eng. A 2017, 701, 254–263. [Google Scholar] [CrossRef]
  15. Clarke, A.J.; Speer, J.G.; Miller, M.K.; Hackenberg, R.E.; Edmonds, D.V.; Matlock, D.K.; Rizzo, F.C.; Clarke, K.D.; De Moor, E. Carbon partitioning to austenite from martensite or bainite during the quench and partition (Q&P) process: A critical assessment. Acta Mater. 2008, 56, 6–22. [Google Scholar]
  16. Pierce, D.T.; Coughlin, D.R.; Williamson, D.L.; Clarke, K.D.; Clarke, A.J.; Speer, J.G.; De Moor, E. Characterization of transition carbides in quench and partitioned steel microstructures by Mossbauer spectroscopy and complementary techniques. Acta Mater. 2015, 90, 417–430. [Google Scholar] [CrossRef]
  17. Pierce, D.T.; Coughlin, D.R.; Clarke, K.D.; De Moor, E.; Poplawsky, J.; Williamson, D.L.; Mazumder, B.; Speer, J.G.; Hood, A.; Clarke, A.J. Microstructural evolution during quenching and partitioning of 0.2C-1.5Mn-1.3Si steels with Cr or Ni additions. Acta Mater. 2018, 151, 454–469. [Google Scholar] [CrossRef]
  18. Thomas, G.A.; Speer, J.G. Interface migration during partitioning of Q&P steel. Mater. Sci. Technol. 2014, 30, 998–1007. [Google Scholar]
  19. De Knijf, D.; Santofimia, M.J.; Shi, H.; Bliznuk, V.; Fojer, C.; Petrov, R.; Xu, W. In situ austenite-martensite interface mobility study during annealing. Acta Mater. 2015, 90, 161–168. [Google Scholar] [CrossRef]
  20. Yang, H.S.; Suh, D.W.; Bhadeshia, H.K.D.H. More Complete Theory for the Calculation of the Martensite-Start Temperature in Steels. ISIJ Int. 2012, 52, 164–166. [Google Scholar] [CrossRef]
  21. Wang, M.M.; Hell, J.C.; Tasan, C.C. Martensite size effects on damage in quenching and partitioning steels. Scr. Mater. 2017, 138, 1–5. [Google Scholar] [CrossRef]
  22. Liang, J.; Zhao, Z.; Tang, D.; Ye, N.; Yang, S.; Liu, W. Improved microstructural homogeneity and mechanical property of medium manganese steel with Mn segregation banding by alternating lath matrix. Mater. Sci. Eng. A 2018, 711, 175–181. [Google Scholar] [CrossRef]
  23. Zhao, Z.; Liang, J.; Zhao, A.; Liang, J.; Tang, D.; Gao, Y. Effects of the austenitizing temperature on the mechanical properties of cold-rolled medium-Mn steel system. J. Alloys Compd. 2017, 691, 51–59. [Google Scholar] [CrossRef] [Green Version]
  24. Cho, L.; Seo, E.J.; De Cooman, B.C. Near-Ac3 austenitized ultra-fine-grained quenching and partitioning (Q&P) steel. Scr. Mater. 2016, 123, 69–72. [Google Scholar]
  25. Andrews, K.W. Empirical formulae for the calculation of some transformation temperatures. J. Iron Steel Inst. 1965, 721–727. [Google Scholar]
  26. Ishida, K. Calculation of the effect of alloying elements on the Ms temperature in steels. J. Alloys Compd. 1995, 220, 126–131. [Google Scholar] [CrossRef]
  27. Mahieu, J.; De Cooman, B.C.; Maki, J. Phase transformation and mechanical properties of Si-free CMnAl transformation-induced plasticity-aided steel. Metall. Mater. Trans. A 2002, 33, 2573–2580. [Google Scholar] [CrossRef]
  28. Dyson, D.J. Effect of alloying additions on the lattice parameter of austenite. J. Iron. Steel. Inst. 1970, 208, 469–474. [Google Scholar]
  29. Van Dijk, N.H.; Butt, A.M.; Zhao, L.; Sietsma, J.; Offerman, S.E.; Wright, J.P.; van der Zwaag, S. Thermal stability of retained austenite in TRIP steels studied by synchrotron X-ray diffraction during cooling. Acta Mater. 2005, 53, 5439–5447. [Google Scholar] [CrossRef]
  30. Liu, L.; He, B.B.; Cheng, G.J.; Yen, H.W.; Huang, M.X. Optimum properties of quenching and partitioning steels achieved by balancing fraction and stability of retained austenite. Scr. Mater. 2018, 150, 1–6. [Google Scholar] [CrossRef]
  31. Xiong, X.C.; Chen, B.; Huang, M.X.; Wang, J.F.; Wang, L. The effect of morphology on the stability of retained austenite in a quenched and partitioned steel. Scr. Mater. 2013, 68, 321–324. [Google Scholar] [CrossRef]
  32. Wang, C.Y.; Zhang, Y.J.; Cao, W.Q.; Shi, J.; Wang, M.Q.; Dong, H. Austenite/martensite structure and corresponding ultrahigh strength and high ductility of steels processed by Q&P techniques. Sci. Chin. Technol. Sci. 2012, 55, 1844–1851. [Google Scholar]
  33. Heinze, C.; Pittner, A.; Rethmeier, M.; Babu, S.S. Dependency of martensite start temperature on prior austenite grain size and its influence on welding-induced residual stresses. Comput. Mater. Sci. 2013, 69, 251–260. [Google Scholar] [CrossRef]
  34. Van Bohemen, S.M.C.; Morsdorf, L. Predicting the Ms temperature of steels with a thermodynamic based model including the effect of the prior austenite grain size. Acta Mater. 2017, 125, 401–415. [Google Scholar] [CrossRef]
  35. Zhu, K.; Magar, C.; Huang, M.X. Abnormal relationship between Ms temperature and prior austenite grain size in Al-alloyed steels. Scr. Mater. 2017, 134, 11–14. [Google Scholar] [CrossRef]
  36. Ryde, L. Application of EBSD to analysis of microstructures in commercial steels. Mater. Sci. Technol. 2006, 22, 1297–1306. [Google Scholar] [CrossRef]
Figure 1. Theoretical calculation of the optimum quenching temperature.
Metals 08 00579 g001
Figure 2. Different primary martensite fractions based on the K-M relationship.
Metals 08 00579 g002
Figure 3. Entire experimental design roadmap and specific heat treatment parameters.
Metals 08 00579 g003
Figure 4. Retained austenite fractions and average carbon content under different quenching temperatures (a) and the corresponding X-ray diffraction patterns (b).
Metals 08 00579 g004
Figure 5. Transmission electron micrographs of the FPM190 sample. The blue area in (a) is partially enlarged in (b), showing the floc-like carbides existing in the martensite lath.
Metals 08 00579 g005
Figure 6. Engineering stress-strain curves of the ferrite and pearlite matrix after the Q&P process under different quenching temperatures.
Metals 08 00579 g006
Figure 7. Electron backscatter diffraction analysis results of the samples (a) FPM190, (b) FPM250, (c) FPM290, combined band-contrast map of martensite and an orientation map of retained austenite; The inset shows the inverse pole-figure map for the austenite phase in (ac). The “FM” denotes the fresh martensite.
Metals 08 00579 g007
Figure 8. Engineering stress–strain curves of three different matrixes after the Q&P process.
Metals 08 00579 g008
Figure 9. Dilatometric curves and EBSD band–contrast maps of different microstructures after cold rolling (a,d) FPM, (b,e) FMM and (c,f) TMM samples.
Metals 08 00579 g009
Figure 10. Theoretical calculation of the optimum quenching temperature influenced by different Ms temperatures.
Metals 08 00579 g010
Table 1. Phase transformation parameters.
Phase Transformation ParametersAc1/°CAc3/°CMs/°C
value723803334
Table 2. The measured and calculated Ms temperature.
Dilatometric MethodEmpirical Formula
Sampling SourceSteel Ingots FPM
Cold-Rolled
FMM
Cold-Rolled
TMM
Cold-Rolled
Ms/°C334315281283347
ΔT/°C133266640

