Article

Degradation Mechanism of Nickel-Cobalt-Aluminum (NCA) Cathode Material from Spent Lithium-Ion Batteries in Microwave-Assisted Pyrolysis

Institute of Process Metallurgy and Metal Recycling IME, RWTH Aachen University, Intzestraße 3, 52056 Aachen, Germany
*
Authors to whom correspondence should be addressed.
Metals 2018, 8(8), 565; https://doi.org/10.3390/met8080565
Submission received: 19 June 2018 / Revised: 12 July 2018 / Accepted: 19 July 2018 / Published: 24 July 2018

Abstract

:
Recycling of Li-Ion Batteries (LIBs) is still a topic of scientific interest. Commonly, spent LIBs are pretreated by mechanical and/or thermal processing. Valuable elements are then recycled via pyrometallurgy and/or hydrometallurgy. Among the thermal treatments, pyrolysis is the most commonly used pre-treatment process. This work compares the treatment of typical cathode nickel-cobalt-aluminum (NCA) material by conventional pyrolysis, and by a microwave assisted pyrolysis. In the conventional route, the heating is provided indirectly, while via microwave the heating is absorbed by the microwaves, according to the materials properties. The comparison is done with help of a detailed characterization of solid as well as the gaseous products during and after the thermal treatment. The results indicated at least three common stages in the degradation: Dehydration and evaporation of electrolyte solvents (EC) and two degradation periods of EC driven by combustion and reforming reactions. In addition, microwave assisted pyrolysis promotes catalytic steam and dry reforming reactions, leading to the strong formation of H2 and CO.

1. Introduction

The depletion of non-renewable energy source with the growing environmental concern leads to a necessity of using clean energy resources. In addition, the increasing demand of mobile energy resource paved the way for the large requirement of batteries. Li-ion batteries (LIBs) play the most important role in a broad applications, such as portable devices, power tools, hybrid electric vehicles (HEV), plug-in (PHEV), and electric vehicle (EV) market [1], due to their high energy density, better cycle life, lower rate of self-discharge, high average output voltage, reliability, and wide operating temperature range [2]. With the increasing demands of LIBs, not only there will be a shortage of raw material [3,4,5], but also, growing numbers of LIBs are approaching their end-of-life (EOL). The spent LIBs are harmful to the environment and their disposal or incineration is not allowed by the legislation [4,6] (Directive 2012/19/EU and Restriction of Hazardous Substances (RoHs)). Therefore, recycling is of paramount importance.
LIB consists of cathode (e.g., nickel cobalt aluminum (NCA), lithium iron phosphate (LFP), nickel manganese cobalt (NMC), lithium manganese oxide (LMO), and lithium cobalt oxide (LCO)) and anode (e.g., graphite and carbons) separated by an isolator. Cathode and anode are connected by an organic electrolyte made out of Li-containing salts. Among them, the valuable cathode material account for 42% the cost of Li-ion battery and are the main purpose for recycling [4].
In the recycling process, various methods have been developed for recycling lithium-ion batteries [7,8]. Commonly, spent LIBs are pretreated by mechanical or thermal processing, or are processed with a combined configuration. Valuable elements are then recycled via pyrometallurgical or/and hydrometallurgical treatment. Among all of the pretreatment methods, pyrolysis is the most commonly studied process for LIBs [8,9].
As a new developed pyrolysis method, microwave assisted pyrolysis offer several advantages that are based on its heating phenomena as compared to conventional pyrolysis, such as non-contact heating, energy transfer over heat transfer, high heating rates, easy power control, high selectivity of materials, uniform heating effect, and increased kinetics for the degradations process [10,11,12,13]. However, few of them have been applied for recycling of cathode material.
In this work, the degradation mechanism of a selected cathode material (NCA) from commercially used lithium-ion batteries via pyrolysis process is studied. The comparison is drawn between conventional pyrolysis and microwave (MW) assisted pyrolysis. In the microwave pyrolysis, the sample is subjected to different temperatures to understand the characteristics of the material at those temperatures and heating rates. The comparison is done with help of a detailed characterization of solid as well as gaseous products during and after the thermal treatment.

1.1. Theory of Pyrolysis

Pyrolysis is defined as the chemical decomposition of organic materials through the application of heat in the absence of oxygen [14]. Pyrolysis could be represented by the general equation (Equation (1)). In general, it transforms organic materials into three main products: a solid carbonaceous residue, non-condensable gas, and condensable gas called pyrolytic oil [15,16]. There are different parameters that influence the pyrolysis process: temperature of the reaction, residence time, presence of catalysts, gas velocity, particle size, reactor geometry, heating rate, and atmosphere [17].
C n H m O p + Heat solid C + gas C x H y O z + liquid C a H b O c .
Generally, pyrolysis undergoes several stages as temperature increases: dehydration (100–200 °C), deoxidation and depolymerisation (~250 °C), cracking of aliphatic boundings (~340 °C), carburation (380 °C), cracking of C-O and C-N boundings (400 °C), generation of bitumen and heavy fuel oils (400–600 °C), cracking of bitumen (600 °C), and generation of aromatic compounds (>600 °C) [18]. Multiple reactions take place once the system enters into a semi-gasification stage during the cracking periods, where carbon dioxide, oxygen, or steam react with each other and produce a combustible gas mixture called syngas. The main reactions involved in this process are indicated in Table 1 [16].
The basic heating principle of the traditional pyrolysis is based upon conduction, convection, and radiation, where material is heated completely. The principal features of the conventional pyrolysis are moderate heating rate (~0.17 °C/s), reaction temperature below 600 °C, and residence time between 10 s and 10 min [19,20]. In the traditional pyrolysis, the material is heated from outside to inside and the produced syngas has a relatively high retention time, which permits secondary reactions in the gas phase, which ultimately produces increased amount of condensates [10].

1.2. Thermal Degradation of Organic Materials in Cathode of LIBs

Investigation on thermal degradation of organics via conventional pyrolysis in materials used in LIBs has been studied in the past (see [21,22,23]). Based on the material composition of a conventional LIB, some of the investigated materials are: Solid-Electrolyte Interphase (SEI) layer, which consists of LiF, Li2CO3, ROCO2Li, (CH2OCO2Li)2, and/or ROLi; Electrolyte; graphite anode; cathode. The main thermal degradation reactions that are happening in these materials are listed, as indicated in Table 2. The electrolyte degrades with the increasing of temperature, while the SEI starts it degradation at temperatures from 120 °C to 250 °C (see Equations (9) and (10)). After that, graphite anode decomposes with electrolyte following the reactions that are shown in Equations (11)–(18) [24]. In addition, the cathode decomposes when the temperature reaches the onset temperature of their decomposition points (See Equations (19)–(22)). The polyethylene or polypropylene (PE/PP) based separator also undergoes a shrinking and melting step at temperatures above 135–165 °C. In addition, the PVDF binder also decompose itself by lithium reaction with fluorinated binder, as indicated in Equation (23). Apart from these mechanisms, limited information can be found regarding degradation of organics presented in LIBs via microwave pyrolysis [24,25,26,27,28,29].

1.3. Theory of Microwave Assisted-Pyrolysis

In comparison to conventional pyrolysis, microwave pyrolysis involves the transfer of energy to the material through the interaction of the molecules inside the material [10]. Microwave behaves in three different levels to materials, according to their dielectric properties, which can be determined by the ratio between the dielectric loss and the dielectric constant of the material. This ratio is also called loss tangent, being high (>0.5), medium (0.1–0.5), and low (<0.1). As an instance, the loss tangent of carbonaceous materials oscillates between 0.1 and 0.8, so carbonaceous materials can be considered as good microwave absorbers. Accordingly, materials could be classified into three categories according to their interactions with microwaves: conductors, insulators, and absorbers [10,30]. Metals are normally considered conductors as they reflect microwaves. Glass/ceramics are classified as insulators since they behave transparent to microwaves [10]. It is understood that metals, being conductors, cannot be heated significantly by microwaves that have penetration depths of few microns, thus they reflect most of the microwaves. However, it is worth noting that there is strong implicit temperature dependency on relative permeability and electrical conductivity. This means that materials can change their dielectric loss factor while heating and become microwaves absorber, which might occur at some specific temperatures. This effect has been seen more in metallic powders and thin metal foils. When metal foils with sharp edges or irregularities are exposed to microwaves, they can also cause electric arcs. These phenomena can be explained due to the fact that electric fields at the sharp edges will become large and the charges on the metal conductor move entirely towards the edges, behaving like an antenna with very high voltages. These electric arcs are called electric discharges [13,31].
Microwave pyrolysis has been used for several organic containing materials like engine oil and various biomasses, printed circuit boards, etc. [10,13,32]. However, the use of microwave pyrolysis in recycling of spent LIBs has rarely been reported. In this work, the degradation of the NCA cathode material through conventional as well as microwave assisted pyrolysis has been investigated. The influence of heating rate, microwave exposure time, and temperature are considered in this study. For both heating methods a detailed characterization of the solid and gas products is performed to understand the fundamental reactions happening during the process.

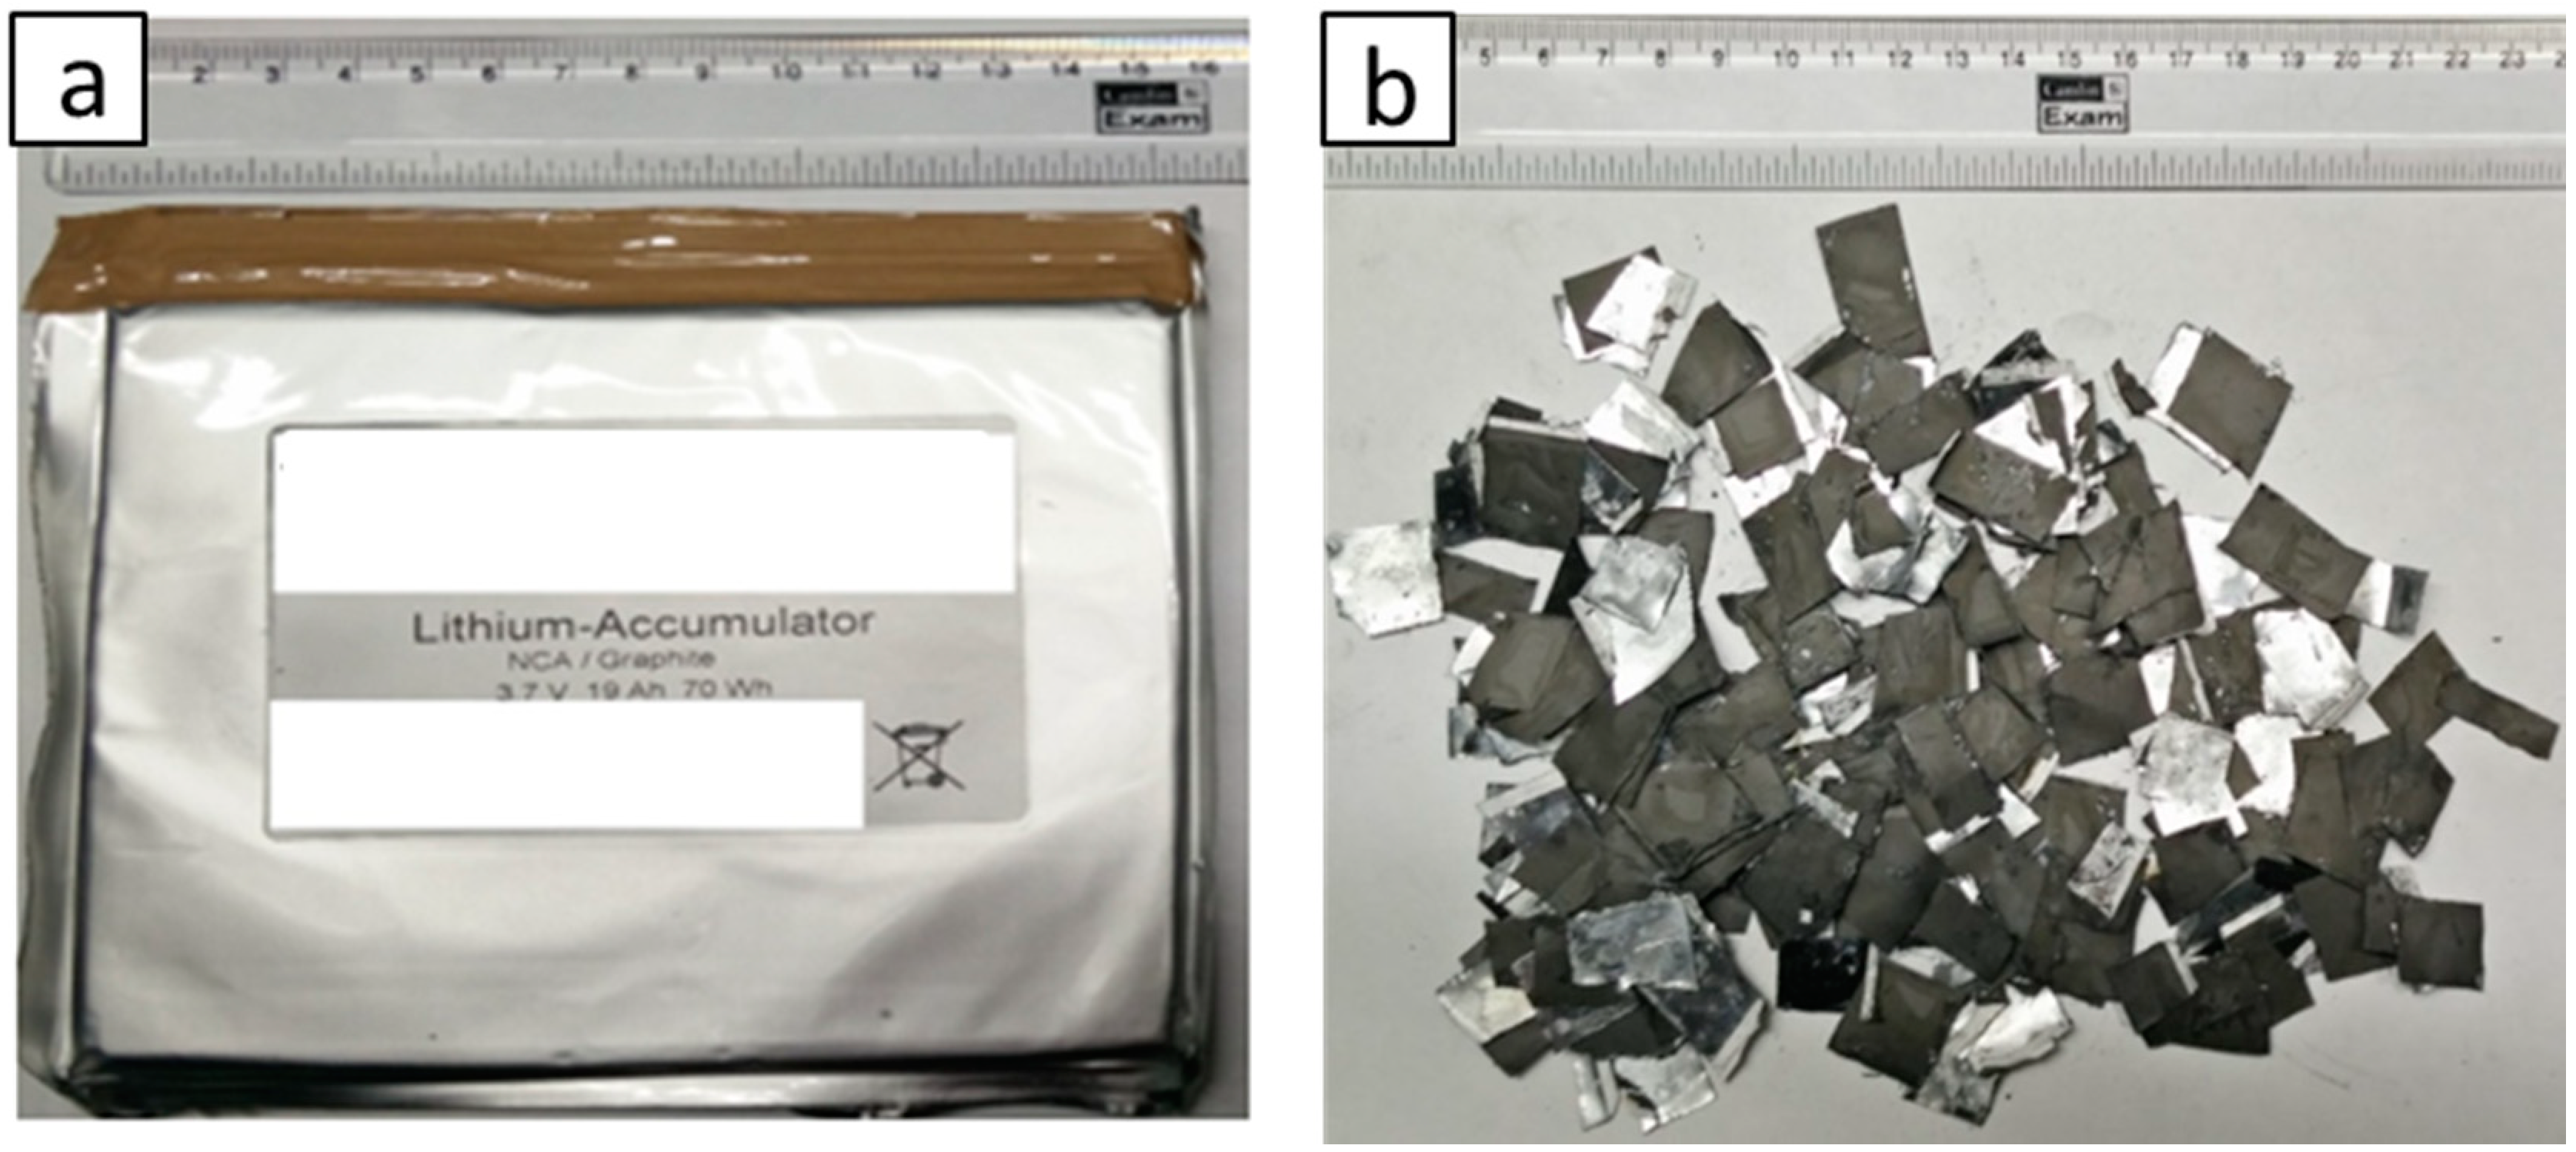
2. Materials and Methods

Batteries with a cathode material of NCA show a high power reputation and improved performance in terms of safety, having a relevant low market share today, but potential perspective in the future [33,34]. The battery that was used in the experiments is shown in Figure 1a. The material for the experiments is prepared manually by carefully separating the cathode from the anode. The cathode which is comprised of NCA active material bound with binder onto both sides of an aluminum current collector. After dismantle, there is still some portion of the electrolyte solvents (Detected: Propylene carbonate (PC), Diethylcarbonate (DEC)) being distributed in the cathode foil. The cathode foils are softly separated and cut into several pieces, as shown in Figure 1b.
After both the conventional and microwave pyrolysis tests, the output material is sieved (250 µm) to identify the separation’s degree of aluminum and active mass. Most of the aluminum is present in the unit with the particle size x > 250 µm and the active masses are present in the unit with the particle size x < 250 µm after sieving. This gives the idea of the feasibility of active mass (also called black mass after pyrolysis) separation after thermal treatment.
The chemical composition of active mass was also detected by X-ray fluorescence and a further surface observation of Al foil was conducted by an electron probe micro-analyzer (EPMA) integrated in a scanning electron microscope (SEM) (JEOL JXA-8530F, Peabody, MA, USA). The gaseous product is analyzed by an integrated Fourier-transform infrared spectroscopy (FTIR) (Gasmet DX4000, Gasmet Technologies Oy, Helsinki, Finland) during the tests.

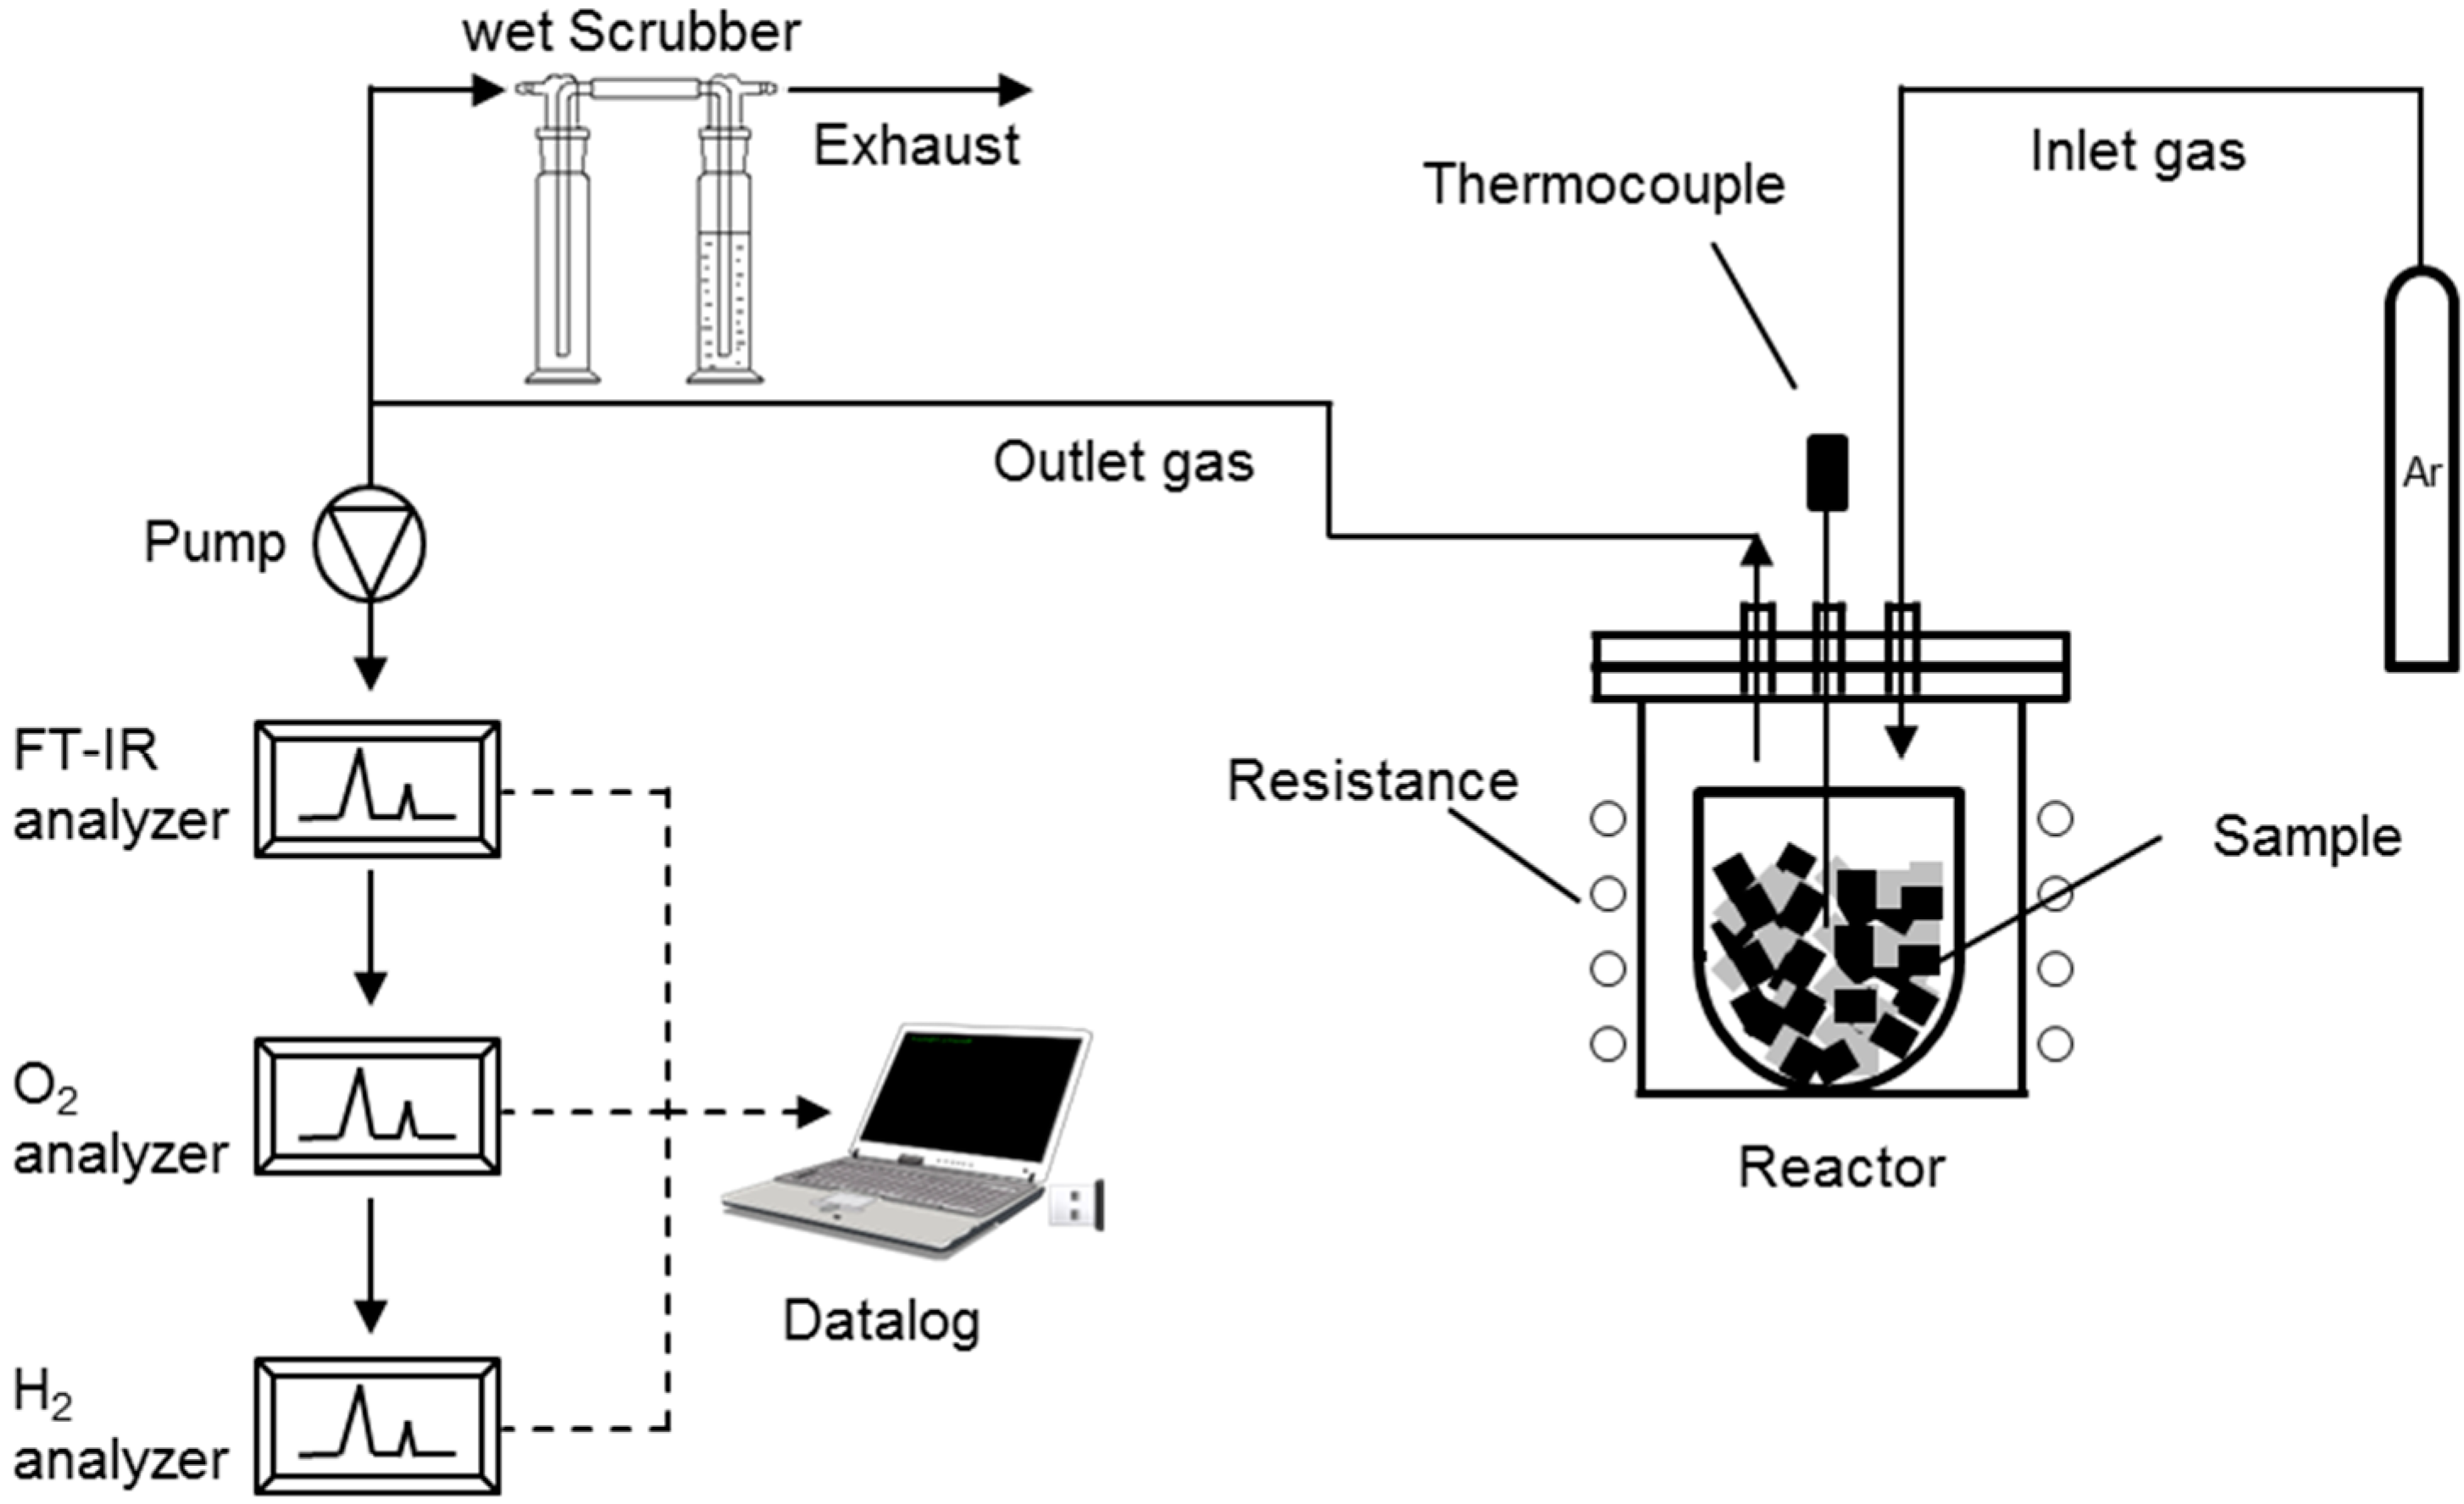
2.1. Experimental Setup for Conventional Pyrolysis

For conventional pyrolysis, the test was conducted in a programmable resistance furnace (Thermo-Star, Aachen, Germany). It can reach up to 1600 °C with a maximum heating rate of 600 °C/h. For this particular work, a set temperature of 600 °C is selected with a heating ramp of 600 °C/h. The reactor has a volume of 1 L and it is sealed with a water cooling lid to create a fully closed environment. It contained a pressure gauge, a gas sampling vent, a thermocouple, a carrier gas inlet (Ar), and an exhaust. The reactor was hold at this temperature during two hours and then the furnace was stopped and cooled down naturally. The experimental setup for conventional pyrolysis is shown in Figure 2.
Before starting the experiment, a crucible was charged with 30 g of starting material and placed inside the reactor. The thermocouple (type K NiCr-Ni) was adjusted to the center of the reactor to detect the furnace temperature above the crucible during the process. The thermocouple was connected to a thermo-logger to record the temperature every 20 s. The reactor was sealed and placed inside the furnace and the gaps between the reactor and furnace was covered with glass wool. The exhaust was connected to two sequentially connected bottles (As scrubbers), the first bottle was empty and it acted as a safety so that to prevent the liquid in the second bottle entering into the reactor in case of pressure loss in the FTIR pump. The second bottle contained distilled water to clean the produced gas and prevent any oxygen going inside the reactor. The gas sampling vent was connected to the sampling probe to collect samples of gas every 20 s during the process. FTIR analyzer and O2 analyzer were turned on and left until their measuring cells reached 180 °C and 5 °C, respectively. FTIR analyzer was calibrated manually using Calcmet software (Version 12.16, Gasmet Technologies Oy, Helsinki, Finland). The main pump was adjusted to 3 L/min, whereas, the O2 analyzer pump was adjusted to 0.5 L/min. The furnace was programmed according to the experiment and turned on while all of the analyzers and thermos-logger were recording.

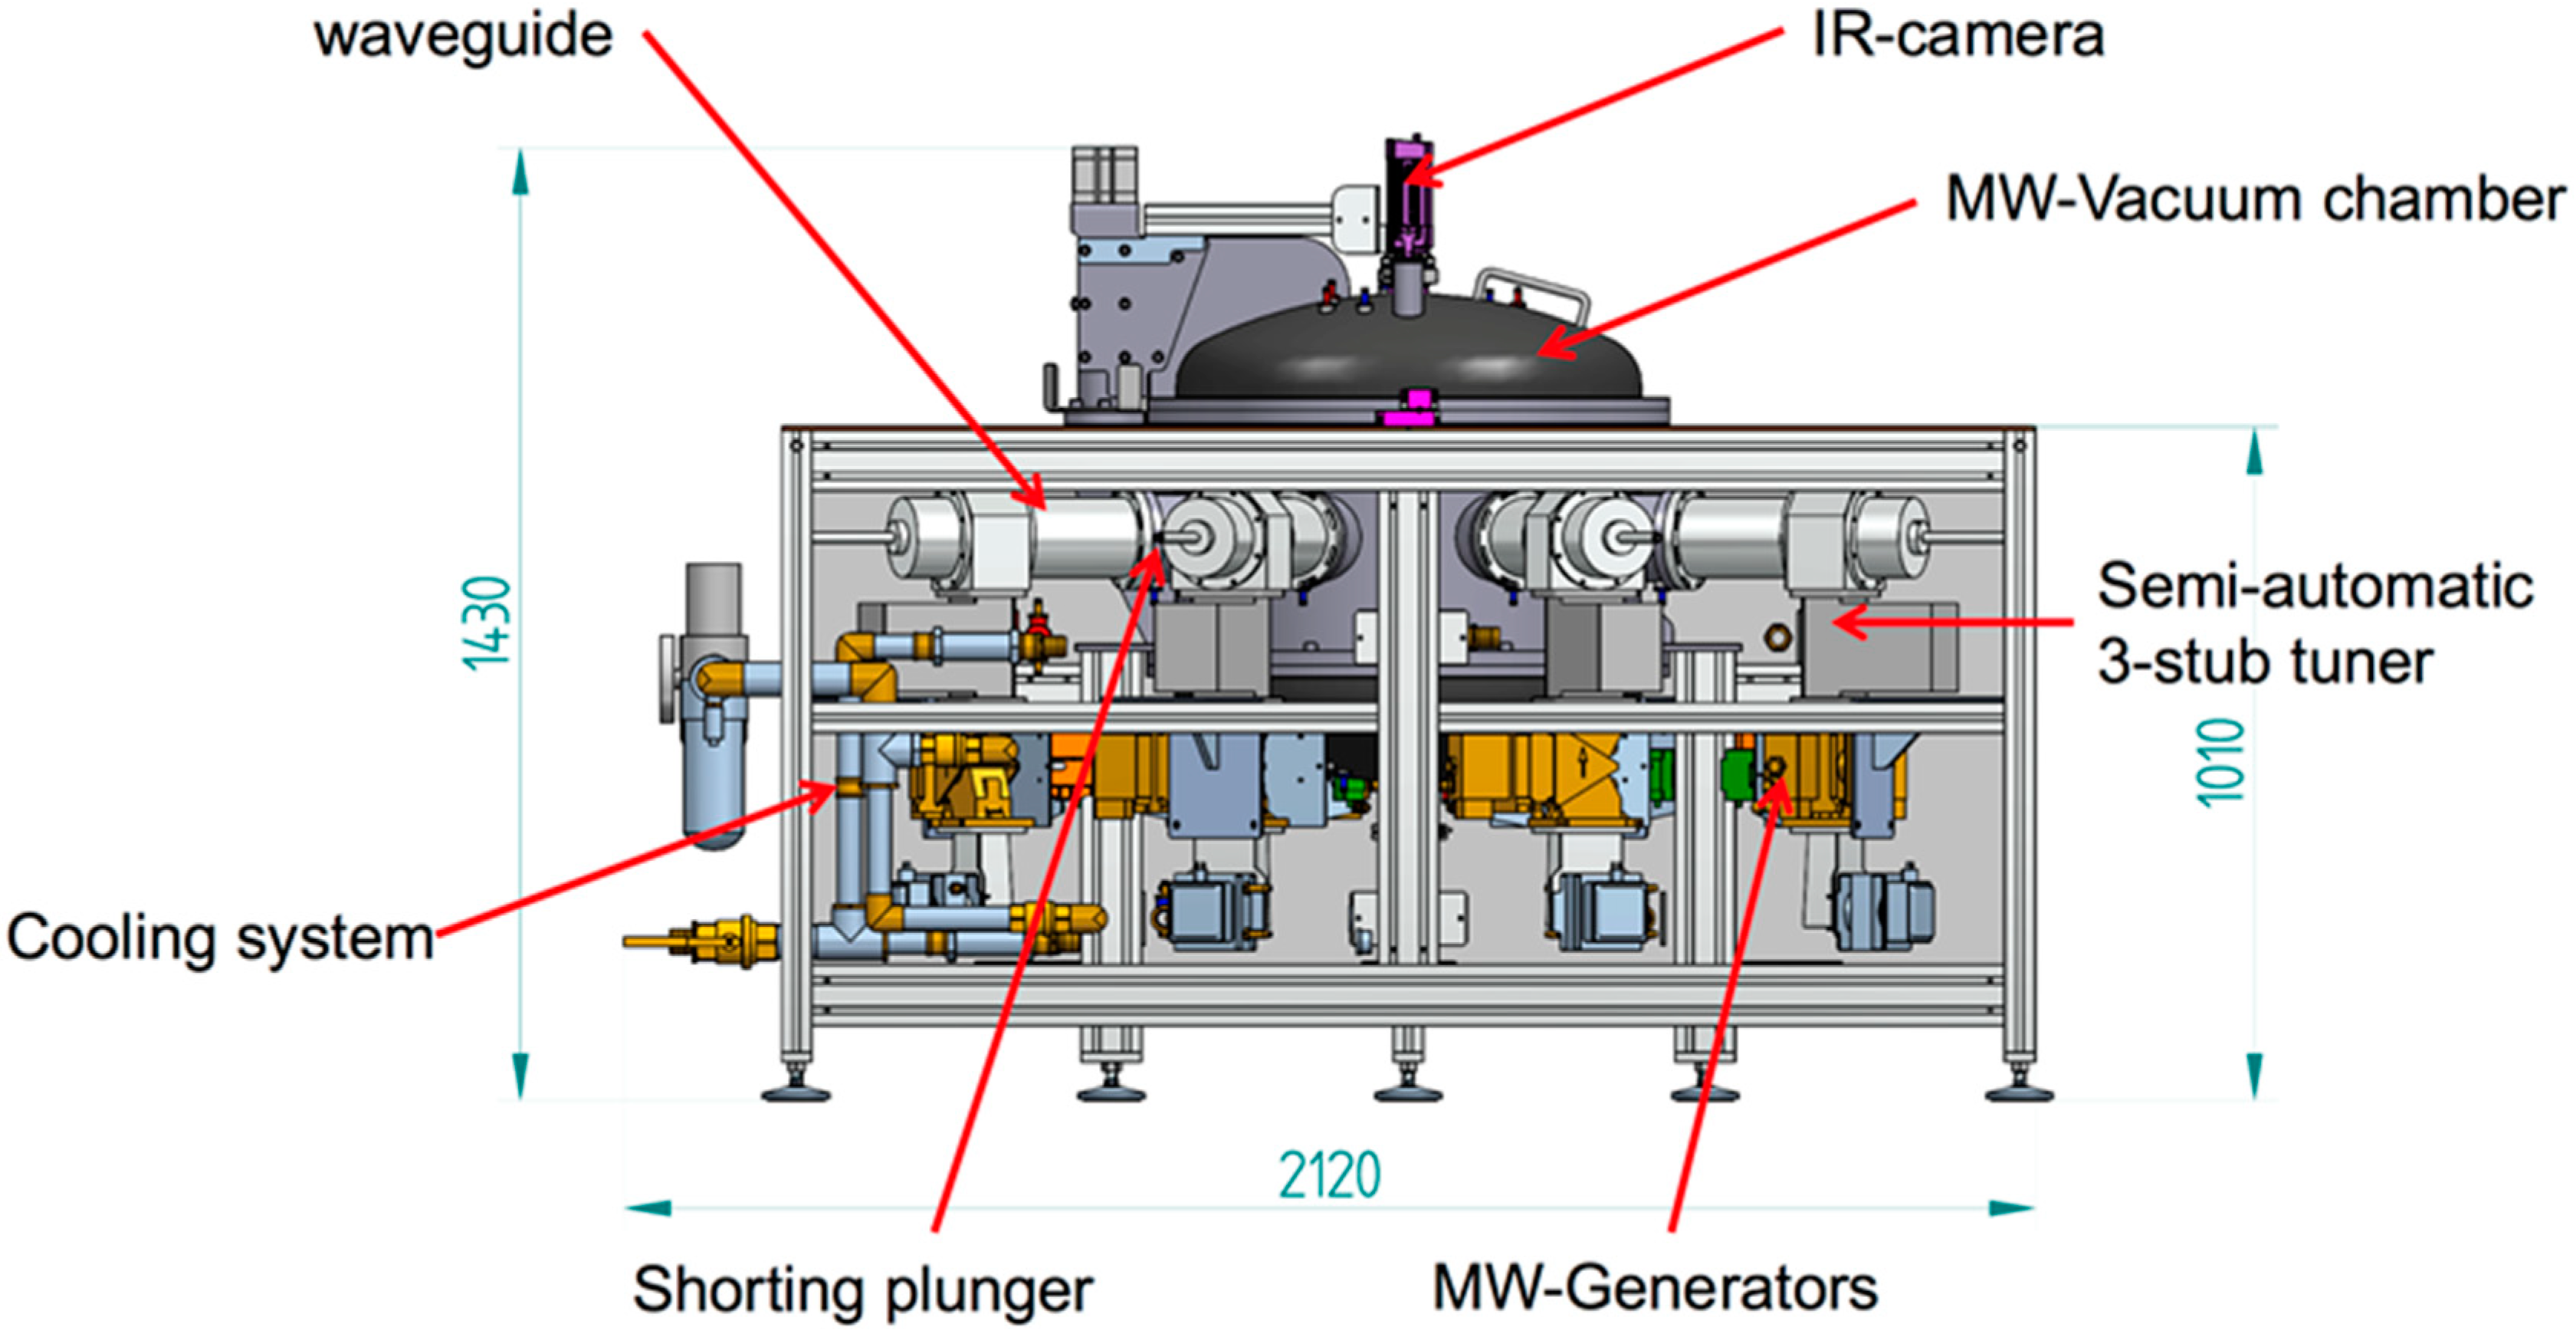
2.2. Experimental Setup for Microwave Pyrolysis

The microwave reactor that was utilized for this work corresponds to a highly controlled atmosphere microwave with eight microwave (MW) generators of 6 KW each, continuous controlled power, and maximal capacity of 0.033 m3. For this experimental work only six out of eight generators were used with half of its power (3 kW). Each generator was sequentially activated for 30 s to have a homogeneous radiation in the sample. The power supply was stopped after reaching the target temperature of 180, 350, 400 and 450 °C. The higher target temperatures were achieved by prolonging the exposure time of microwaves to the material.
A crucible filled with 30 g of material was placed inside the reactor. The reactor was closed and sealed with resistant screws. In general, the analyzing system that was used in conventional pyrolysis had also been used in the microwave assisted pyrolysis. The true temperature inside the crucible was monitored and recorded with a thermocouple. The setup of the scrubber and the off gas analysis method remained the same. The microwave system includes an infrared camera, which monitors and records the temperature in the surface of the crucible. Before starting the microwave irradiation, argon (6 L/min) was supplied to create the inert atmosphere reducing the amount of oxygen inside the reactor. The microwave assisted pyrolysis plant is shown in Figure 3.

3. Results and Discussion

Because of the electric arcs that are formed in microwave, the true temperature of microwaves-assisted pyrolysis is higher than the target temperature. The true temperature of microwaves-assisted pyrolysis were 220, 360, 418, and 501 °C, respectively. The conventional pyrolysis is taken in this discussion as a reference experiment. As it is known, a conventional heating assures the complete removal of the electrolyte and induces the less impact in the metal foils in the absence of oxygen.

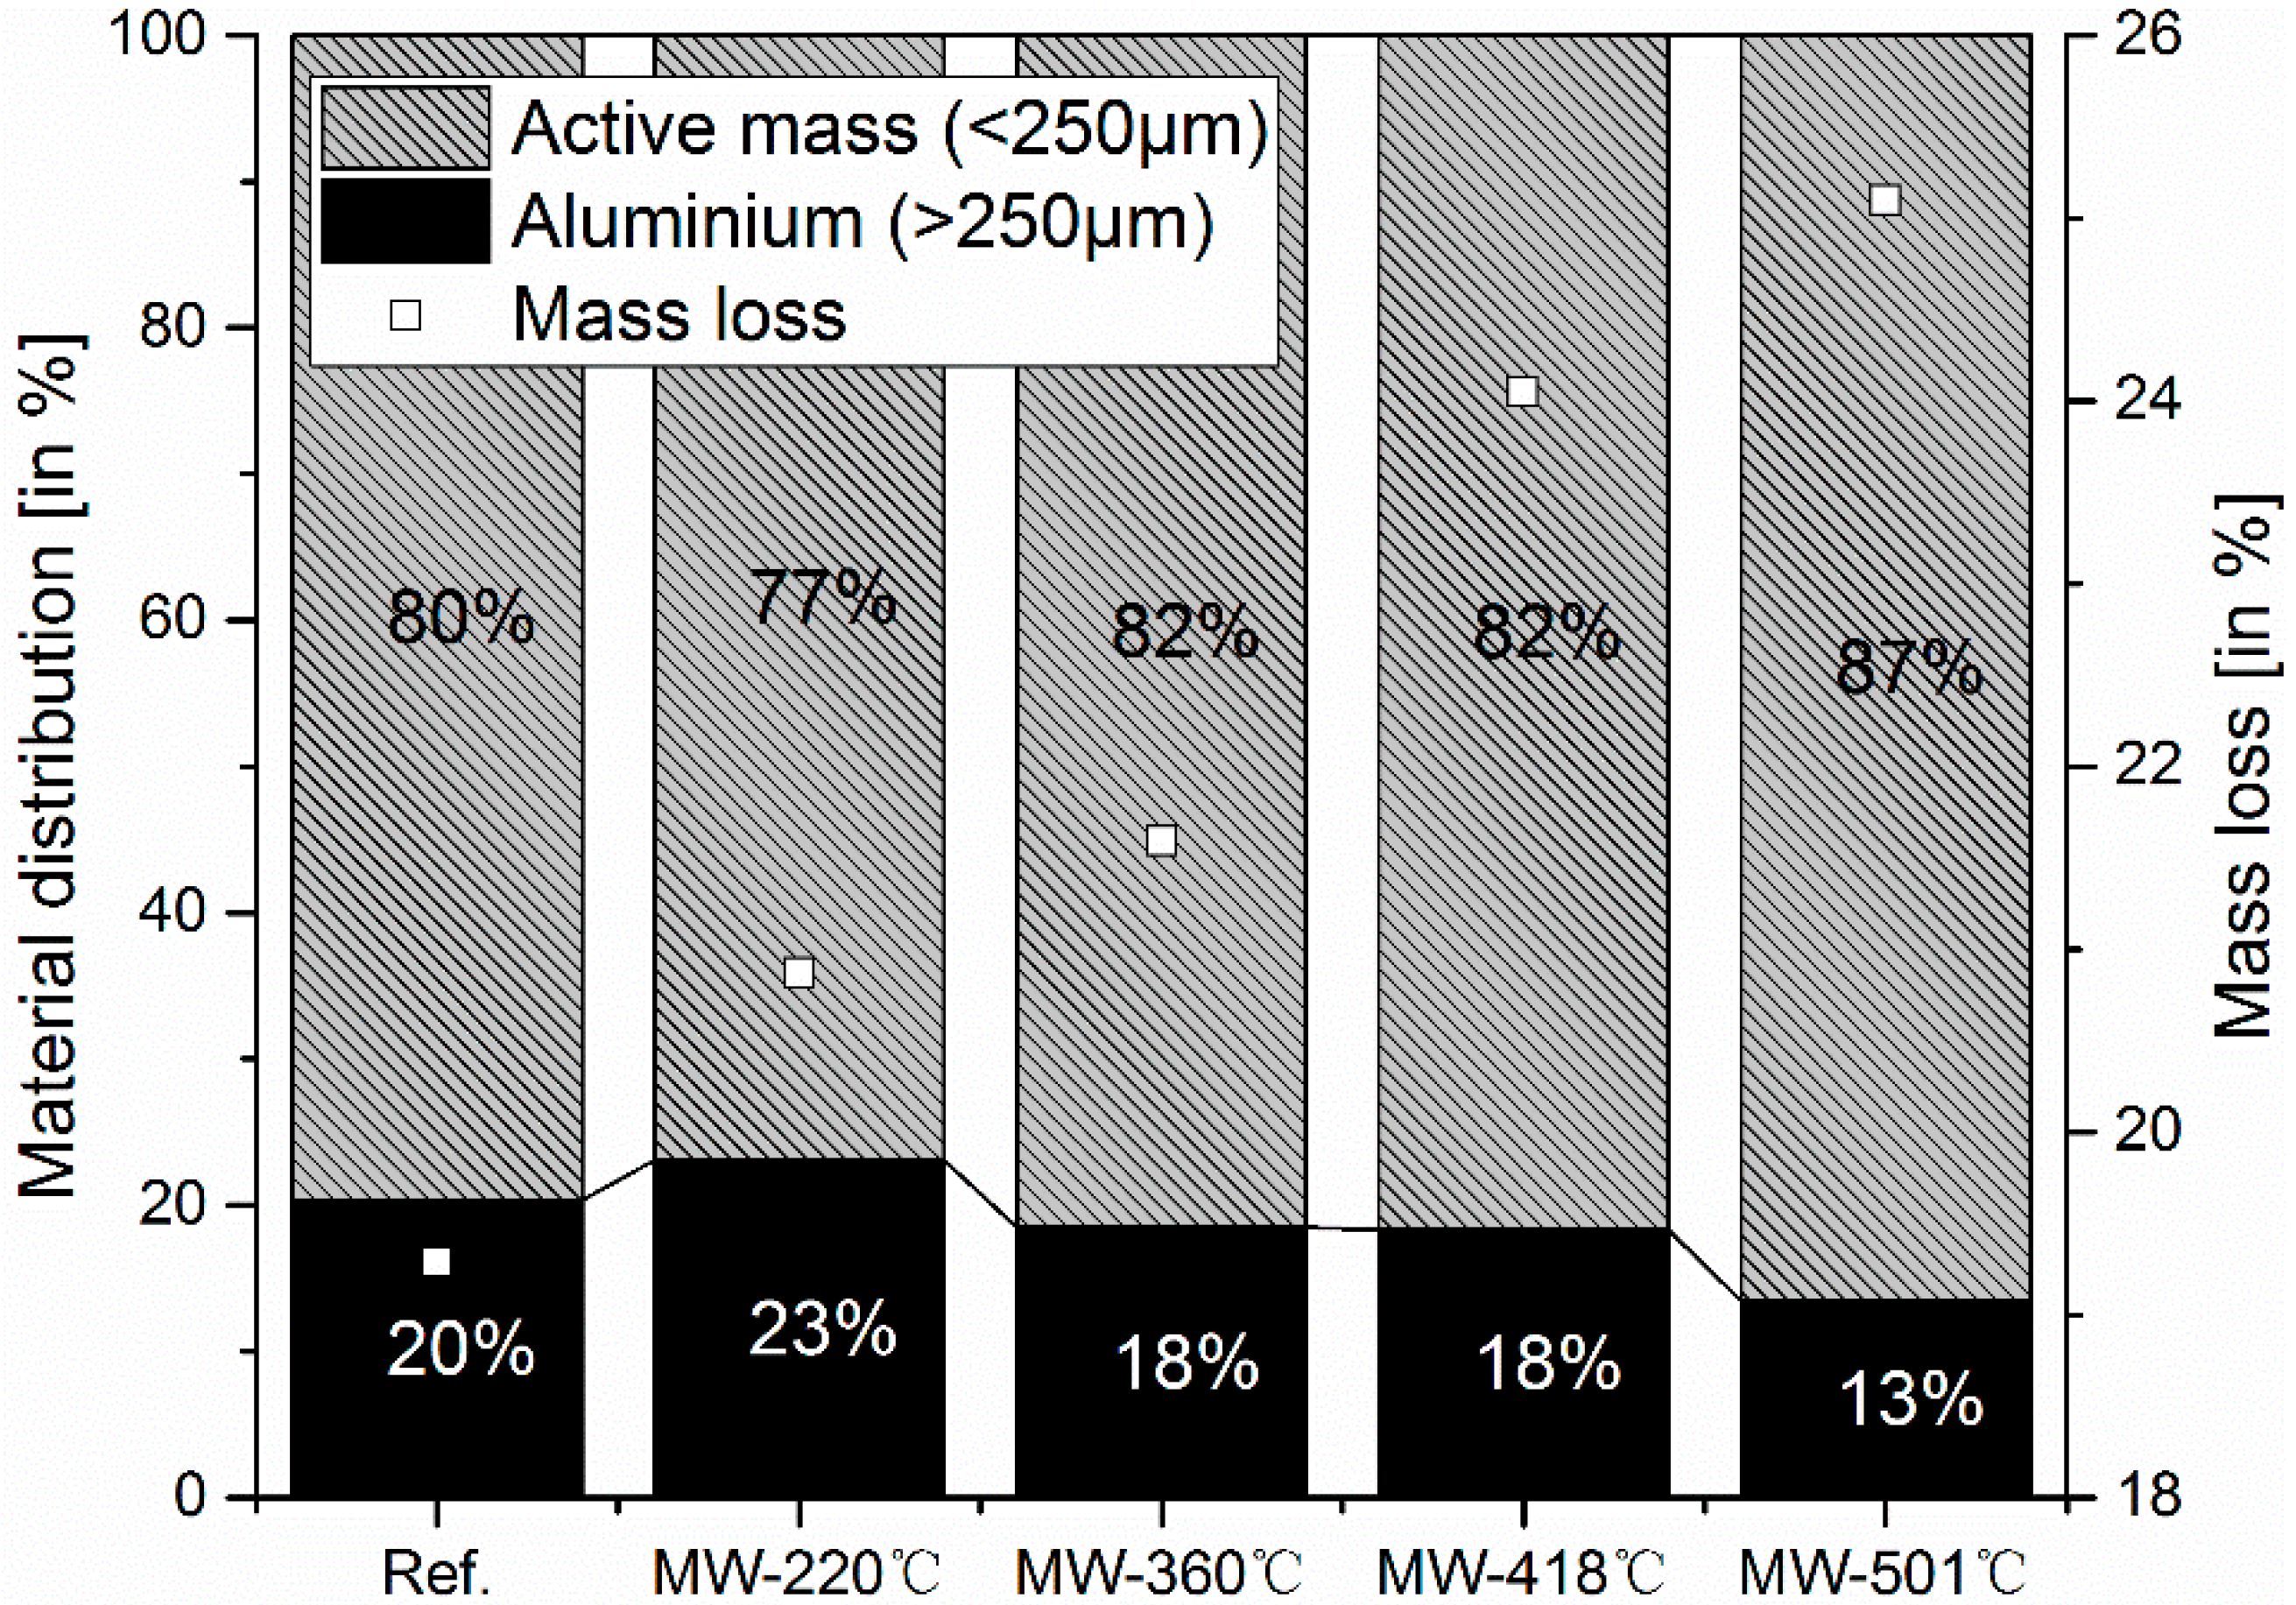
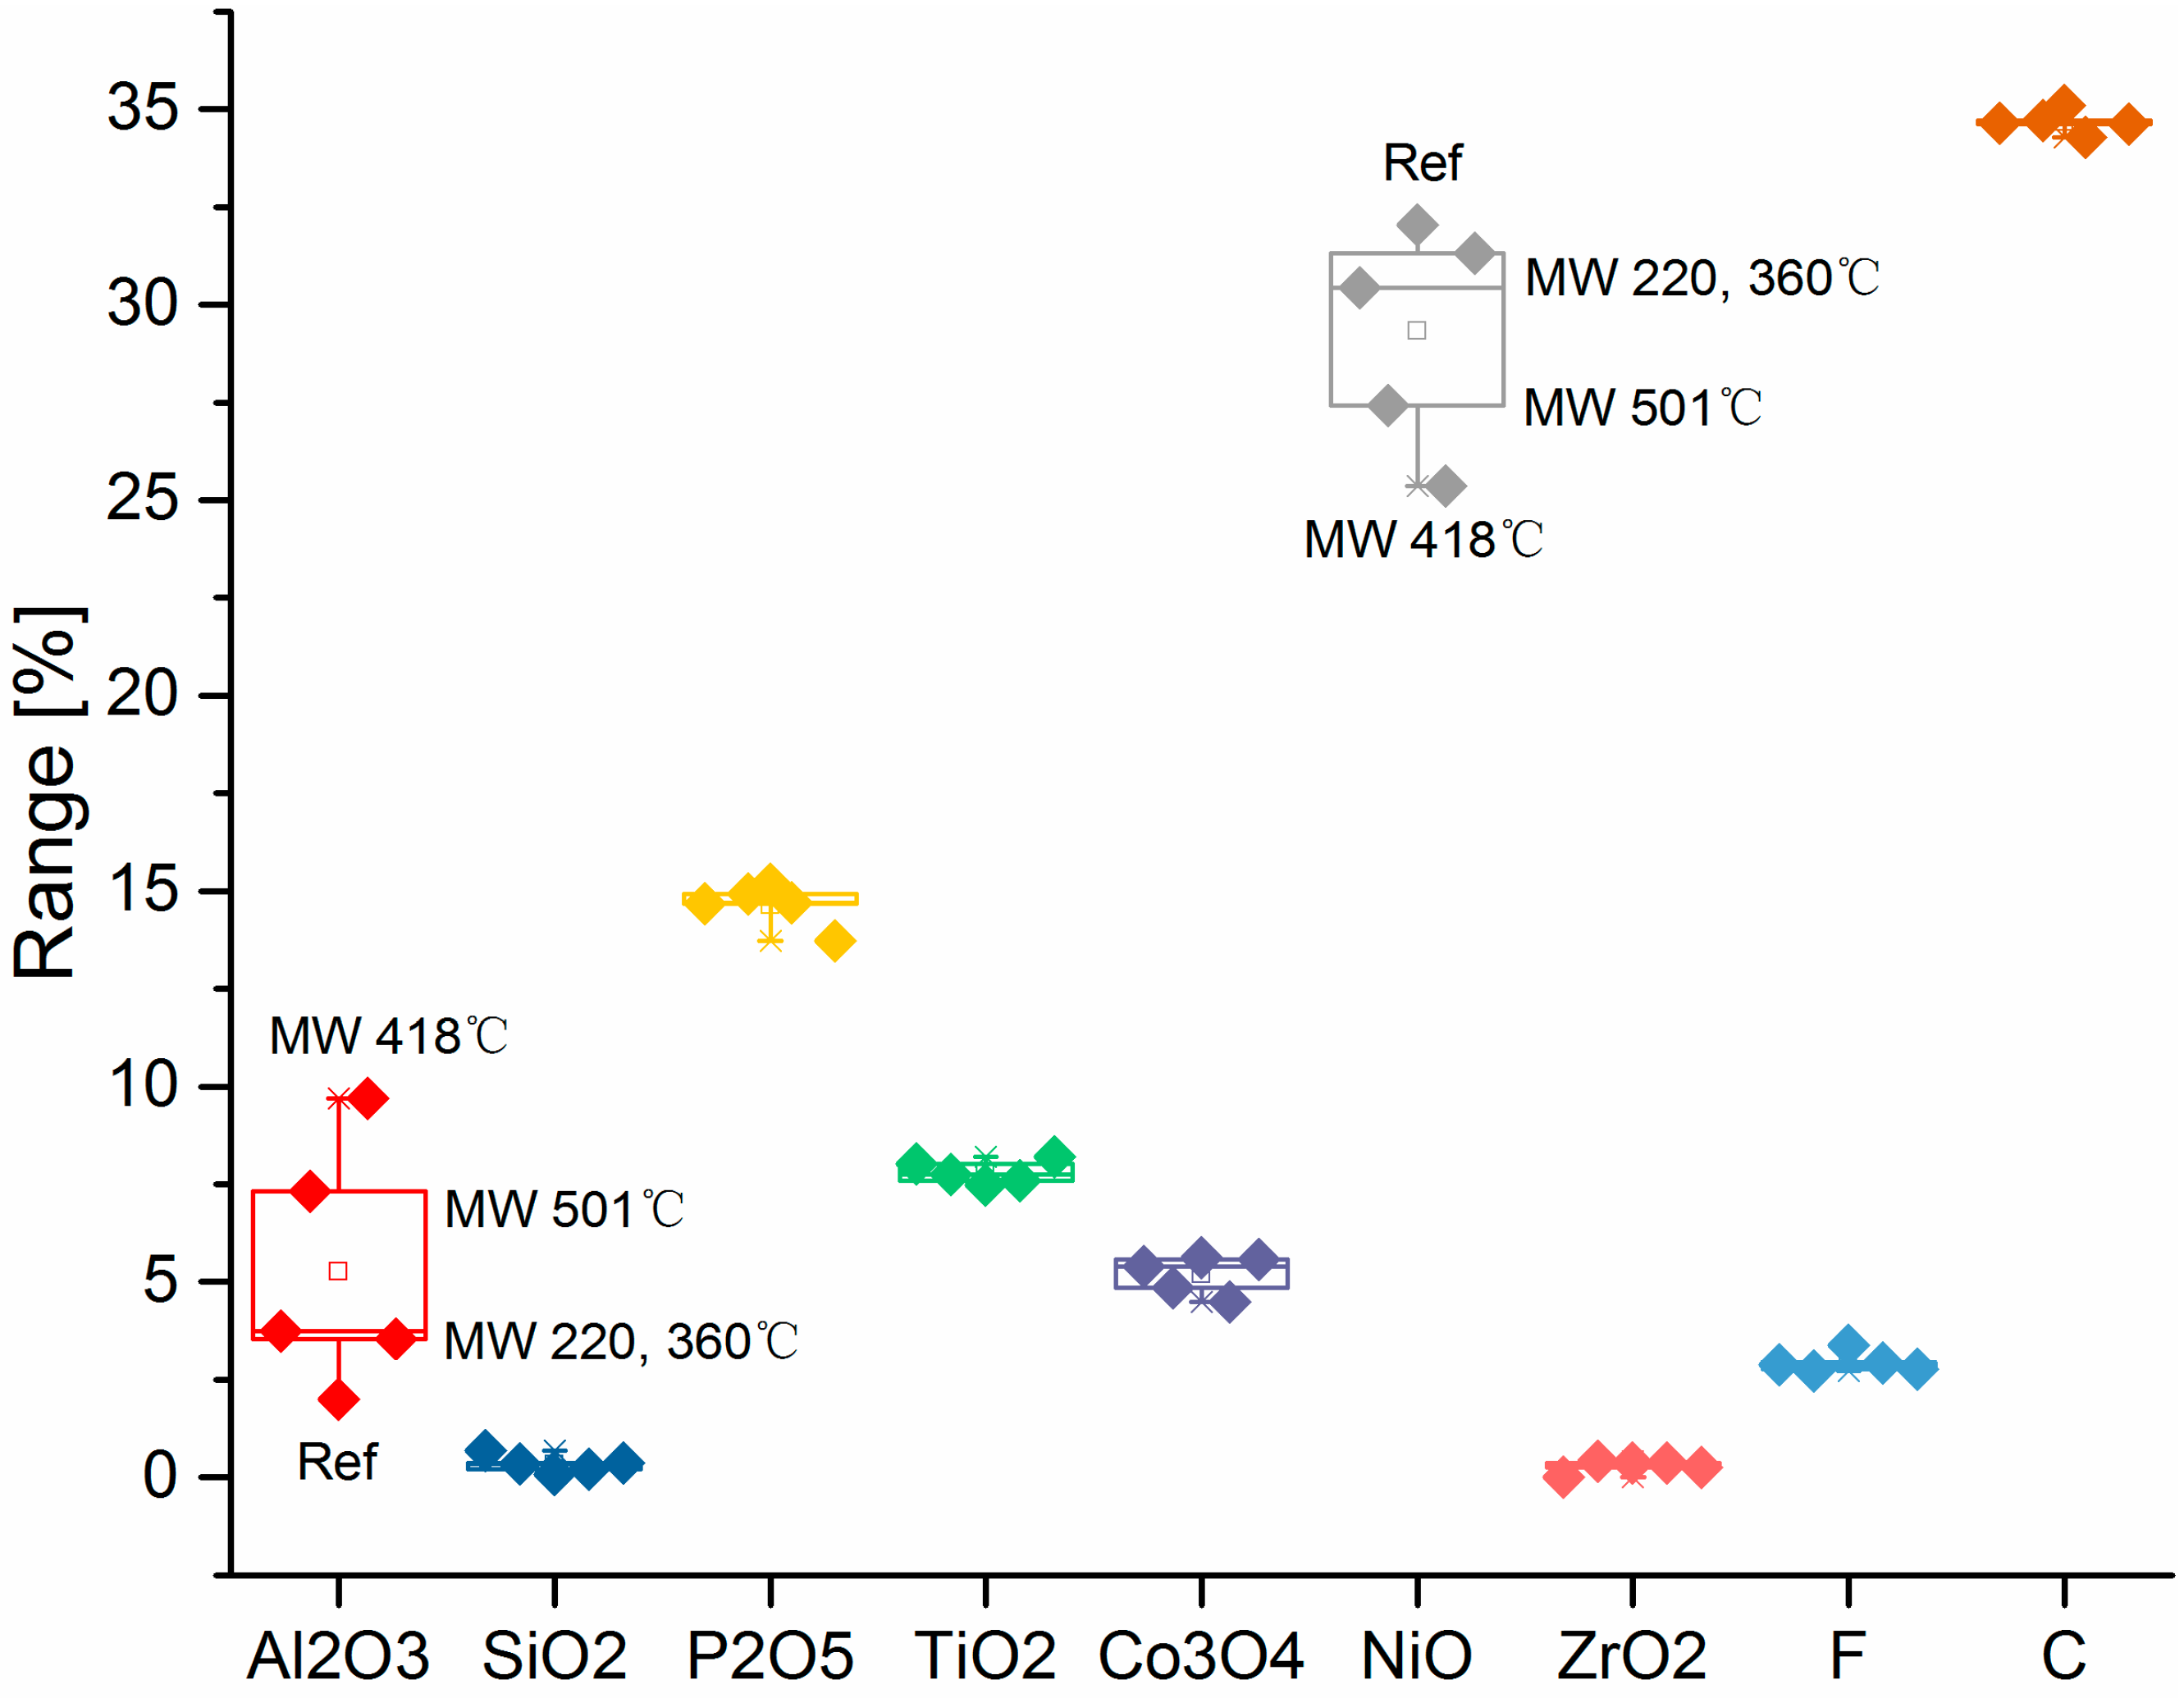
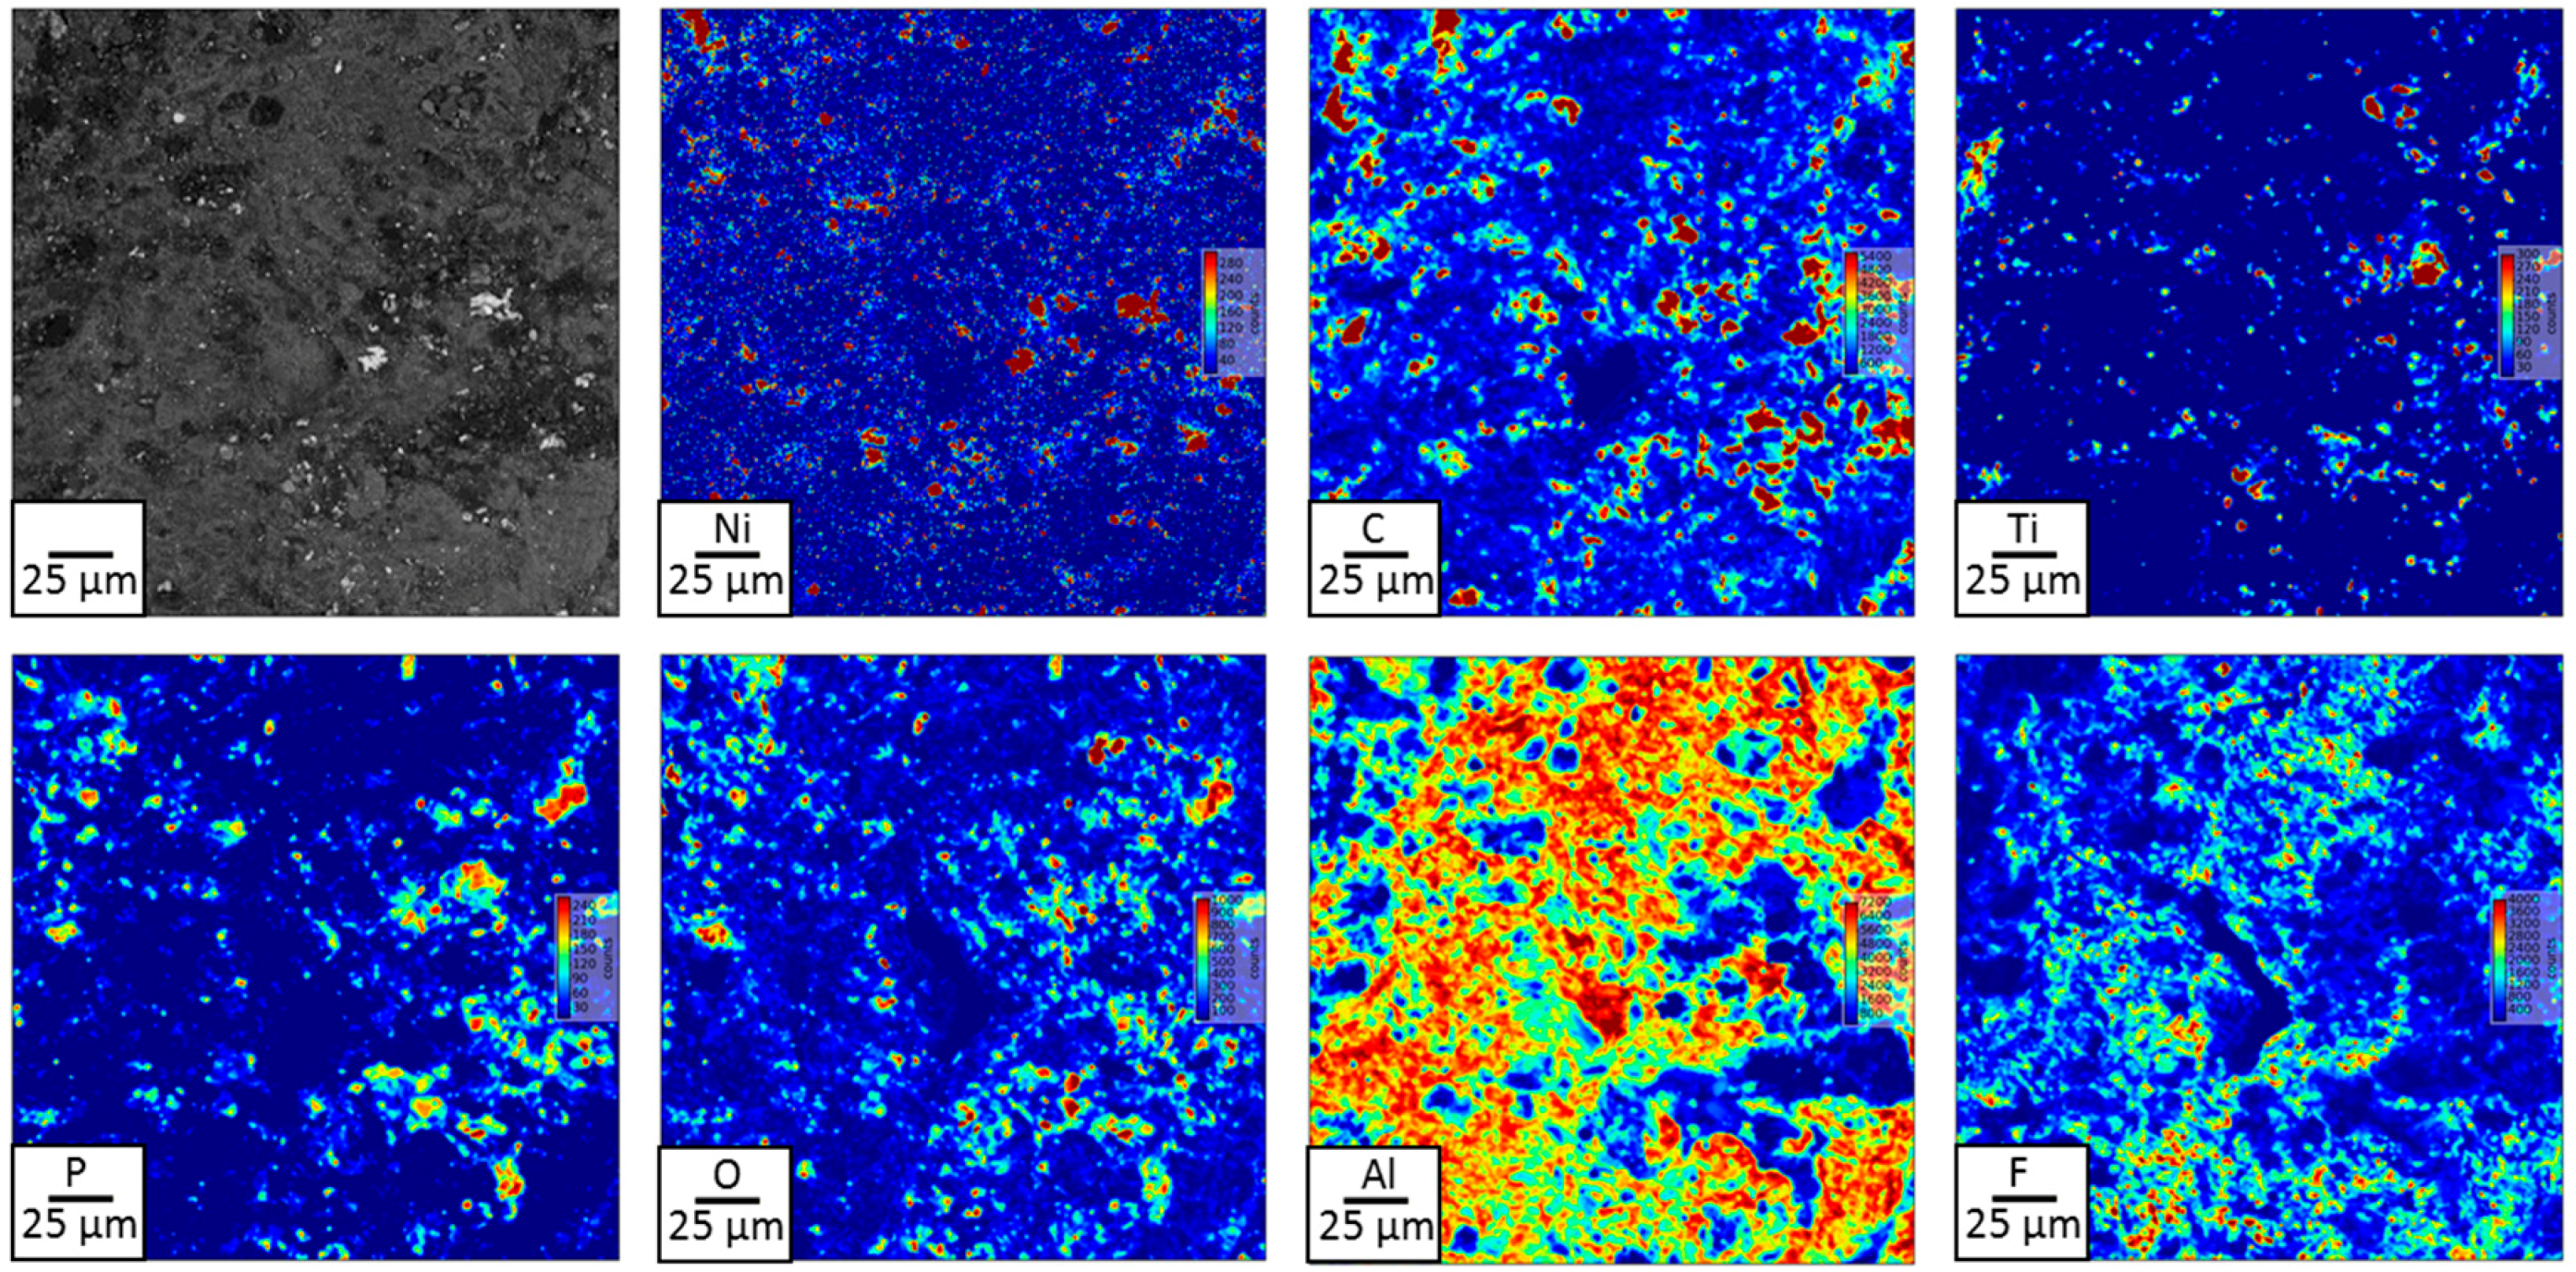
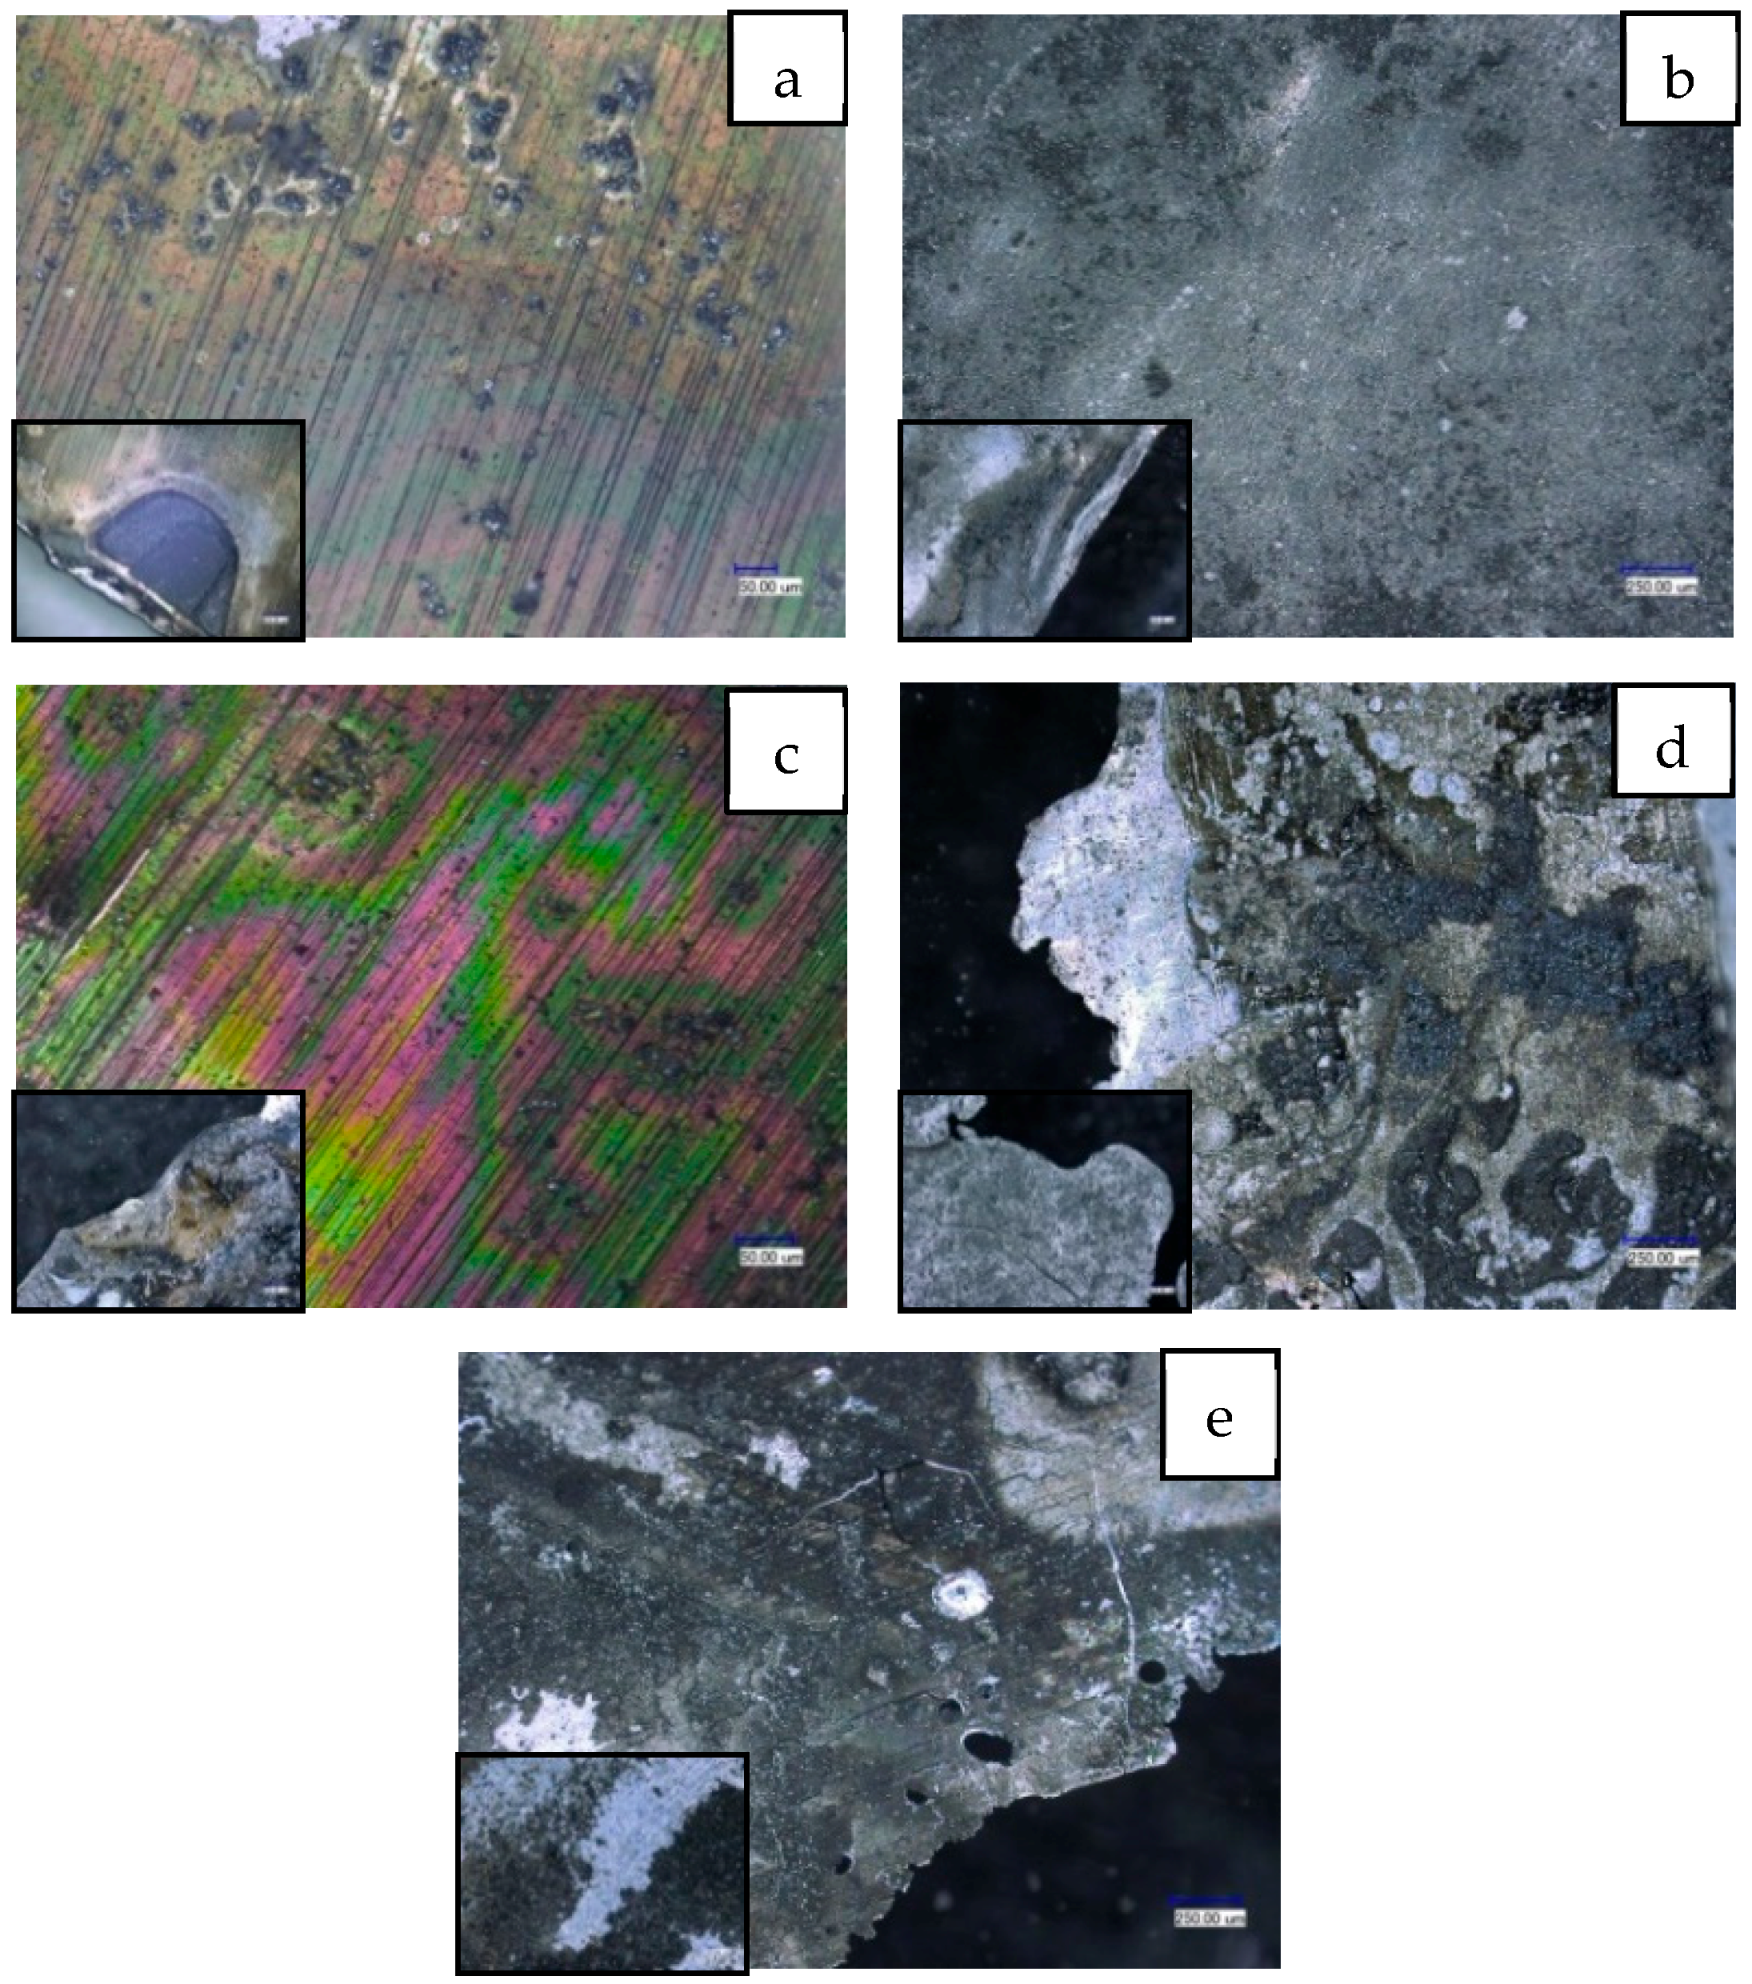
3.1. Solid Products Characterizations

The amount of mass loss after conventional as well as microwave pyrolysis, which indicates the content of volatile in starting material, is shown as Figure 4. The amount of mass loss after the pyrolysis in each experiment slightly increases from conventional to the microwave pyrolysis at temperatures lower than 360 °C. For microwave pyrolysis the amount of mass loss increases with the temperature increasing. As well, in Figure 4 it is seen that the amount of aluminum share (particle size x > 250 µm) in the output material drastically decreases in the microwave treatment at temperatures higher than 360 °C, whereas the amount of active mass (particle size x < 250 µm) increases. These observations can be explained to the following driven phenomena: the microwaves are normally reflected in thick metals. For thin pieces of metal, like aluminum foils, prolonged microwave exposure would lead to rapid heating and generation of electric discharges with very high voltages at the edges, which can easily cause strong metal fragmentation of metal foils. Therefore, after 360 °C by microwave treatment the active mass increases its share in the solid product.
In addition to the active mass yield ratio, the chemical composition of sieved active mass is also detected, as shown in Figure 5. It could be seen that except for Ni and Al, there is no different for the distribution of elements in the active mass after both conventional and microwave pyrolysis. The distribution of Al and Ni show an exactly opposite relation. The purity of active mass decreases after microwave pyrolysis at temperatures above the 360 °C with increasing content of Al2O3 and deceasing content of NiO. To explain nickel mobilization, an electron probe micro-analyzer (EPMA) is conducted for aluminum foil after microwave pyrolysis at 501 °C. It can be seen from Figure 6 that most of elements like P, O, C, and Ti have similar distribution in the sample in the form of highly concentrated spots following the remaining traces of the black mass. On the contrary, Ni element has quite even and fine distribution in the sample in the whole surface, except for the typical concentrated spots, as indicated for other elements. This can suggest some interaction between nickel and the aluminum foils during the microwave treatment.
In addition to elements analysis, surface observation is also carried out, as demonstrated in Figure 7. When compared with the reference, there is still a lot of active mass attached on the Al foil after microwave-assisted pyrolysis at 220 °C, which accounts for the low active mass yield ratio. When the temperature is increased to 360 °C, the surface characteristic is similar with the reference. Nevertheless, if the material is exposed to longer time to microwaves, some sparks with increased temperature are expected. Therefore, Al foil melts at the edges at measured temperature of 418 °C. This might lead to the increased of alumina content in active mass. When the temperature is increased to 501 °C, it can be observed strong metal fragmentations of the Al foils, which can explain the high mass loss for this trial (see Figure 4).

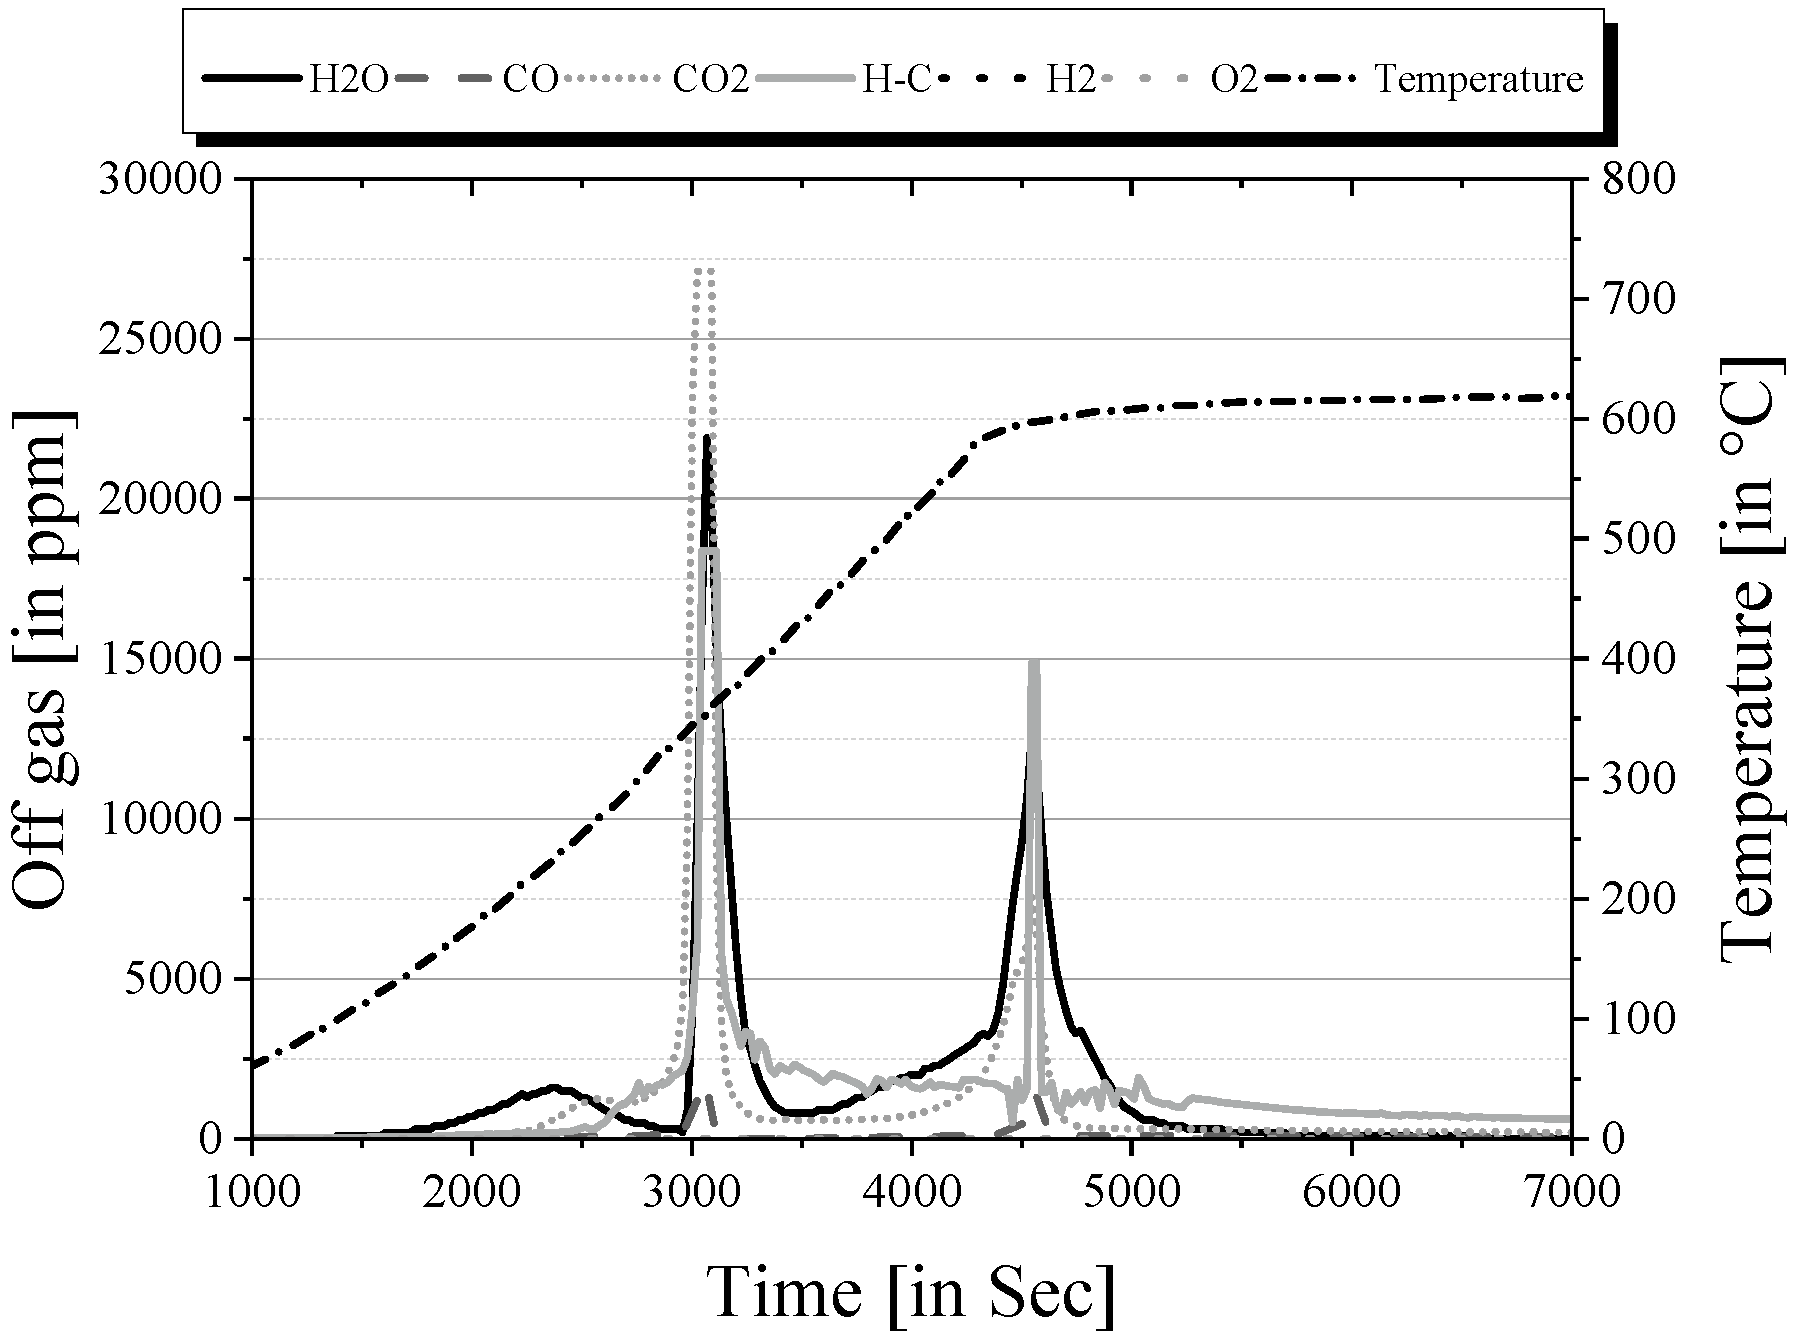
3.2. Gas products Characterization

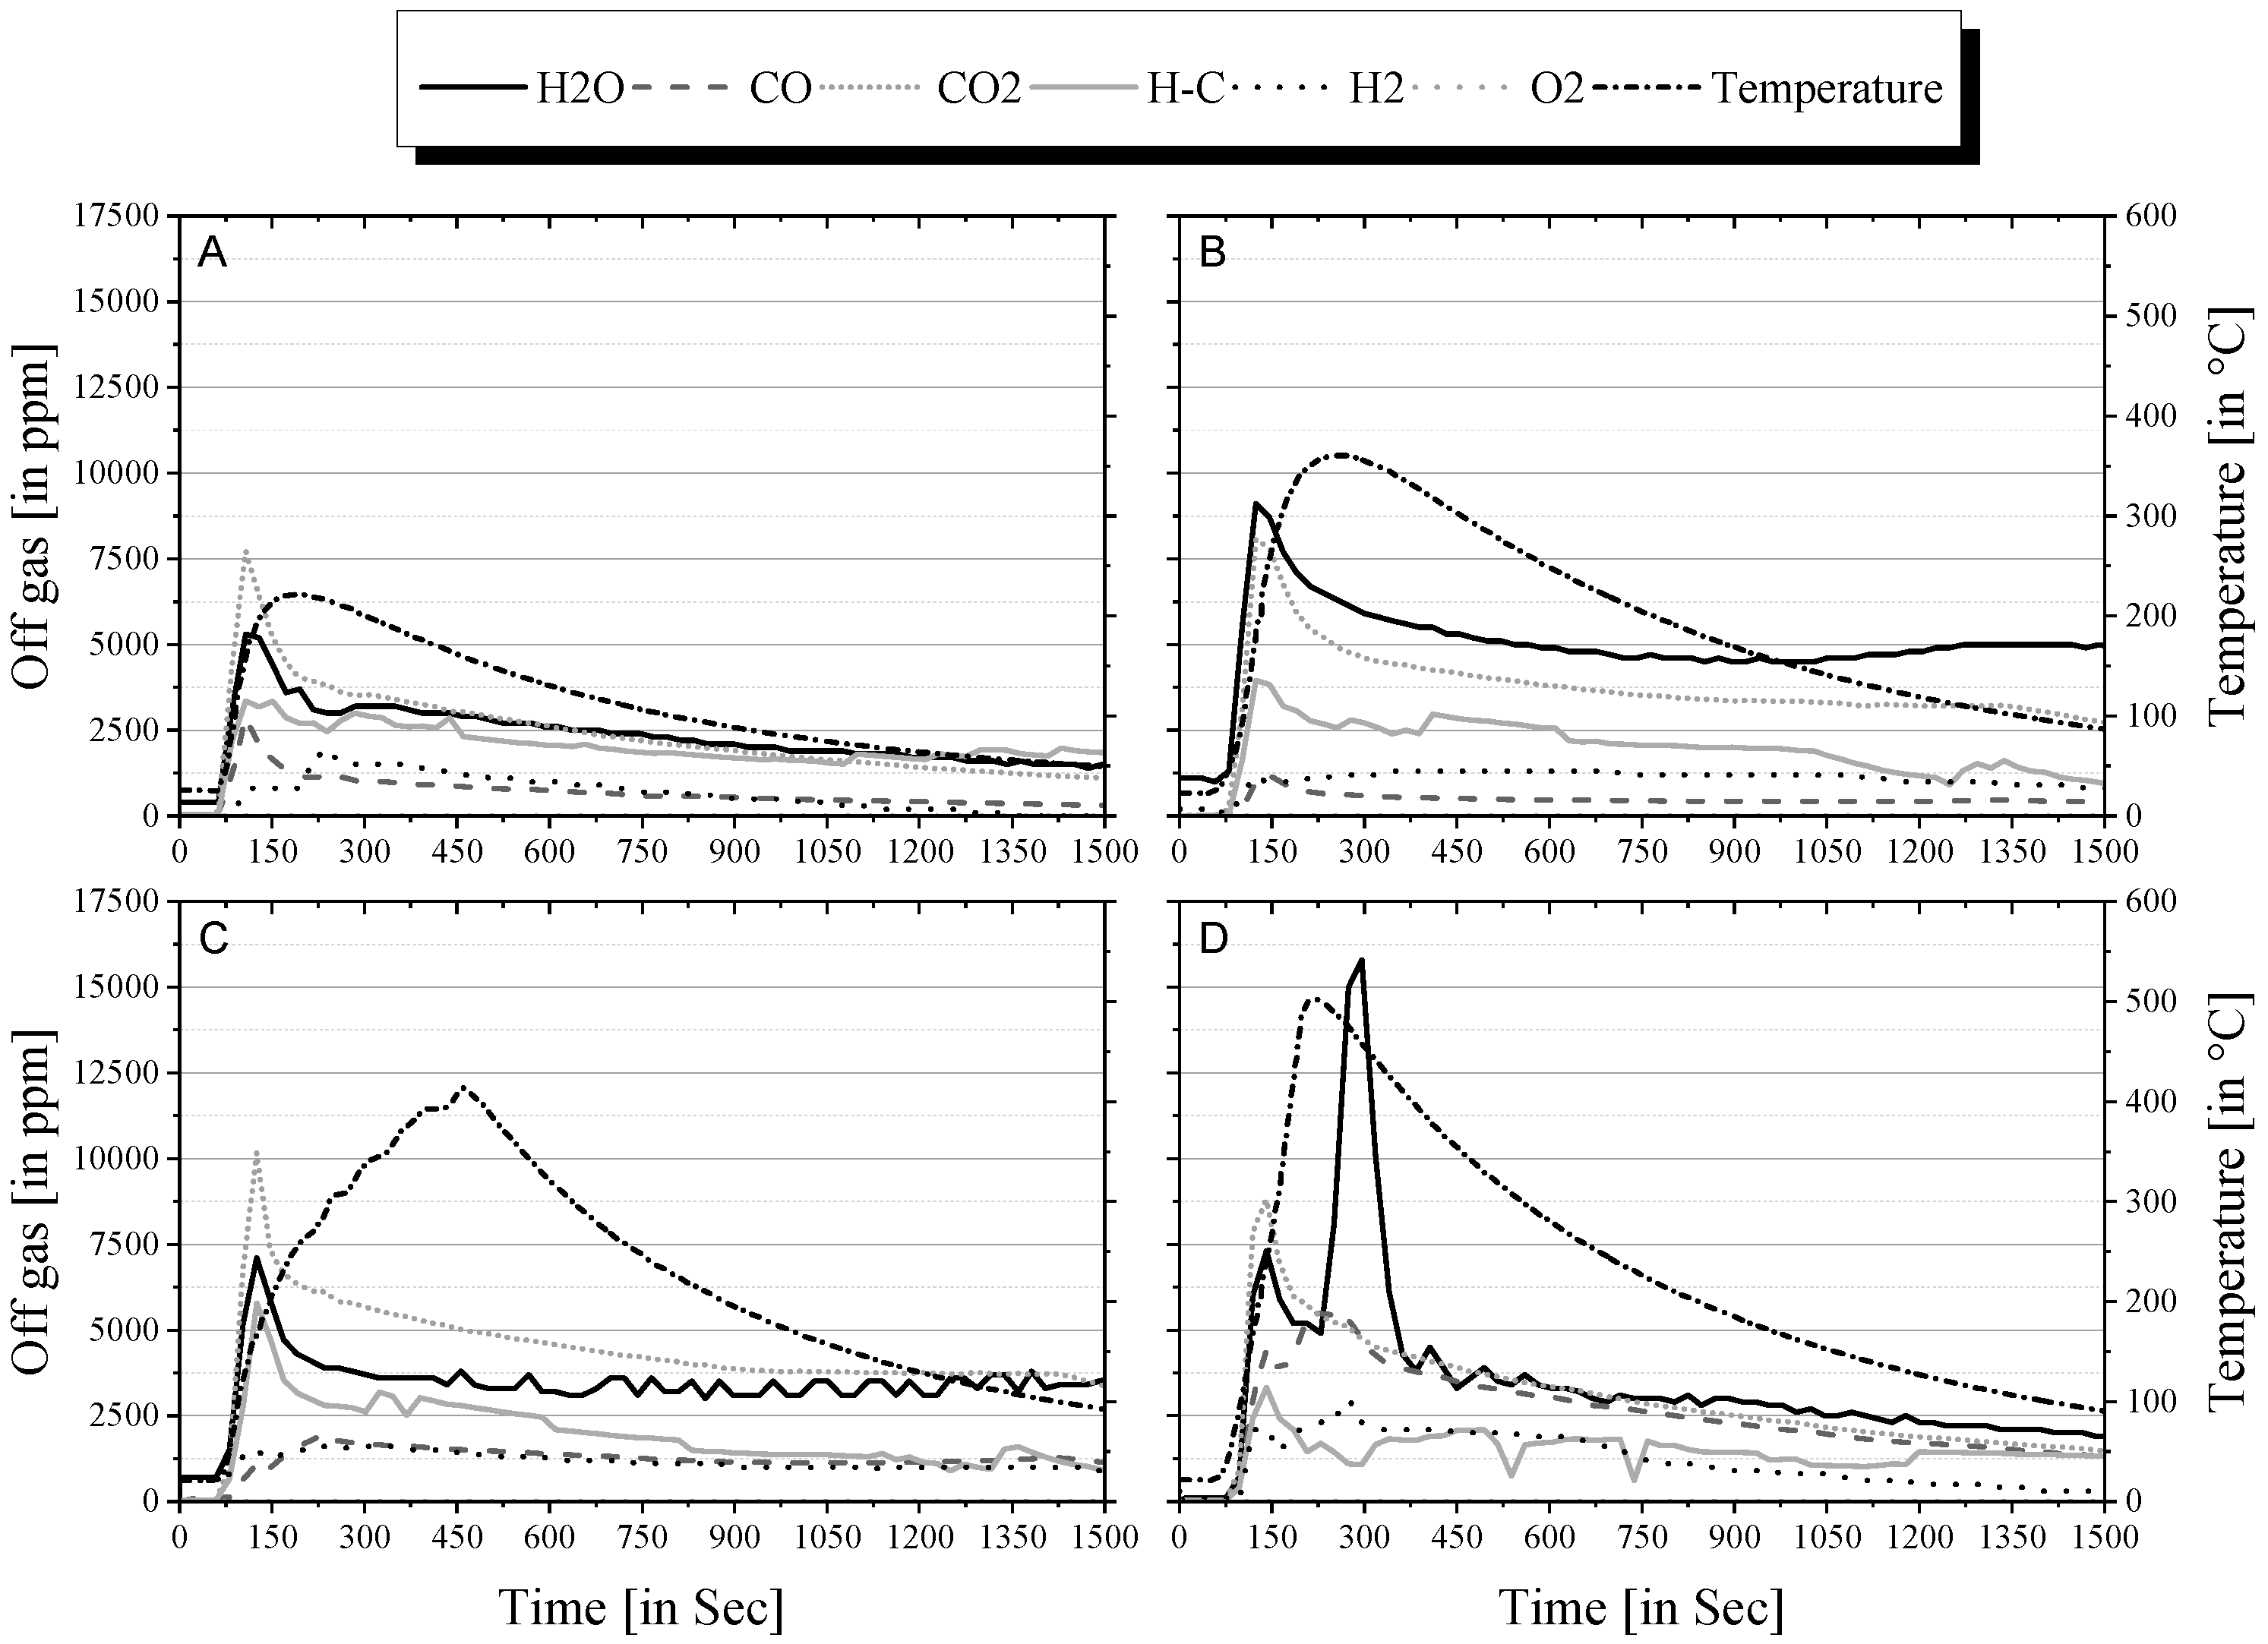
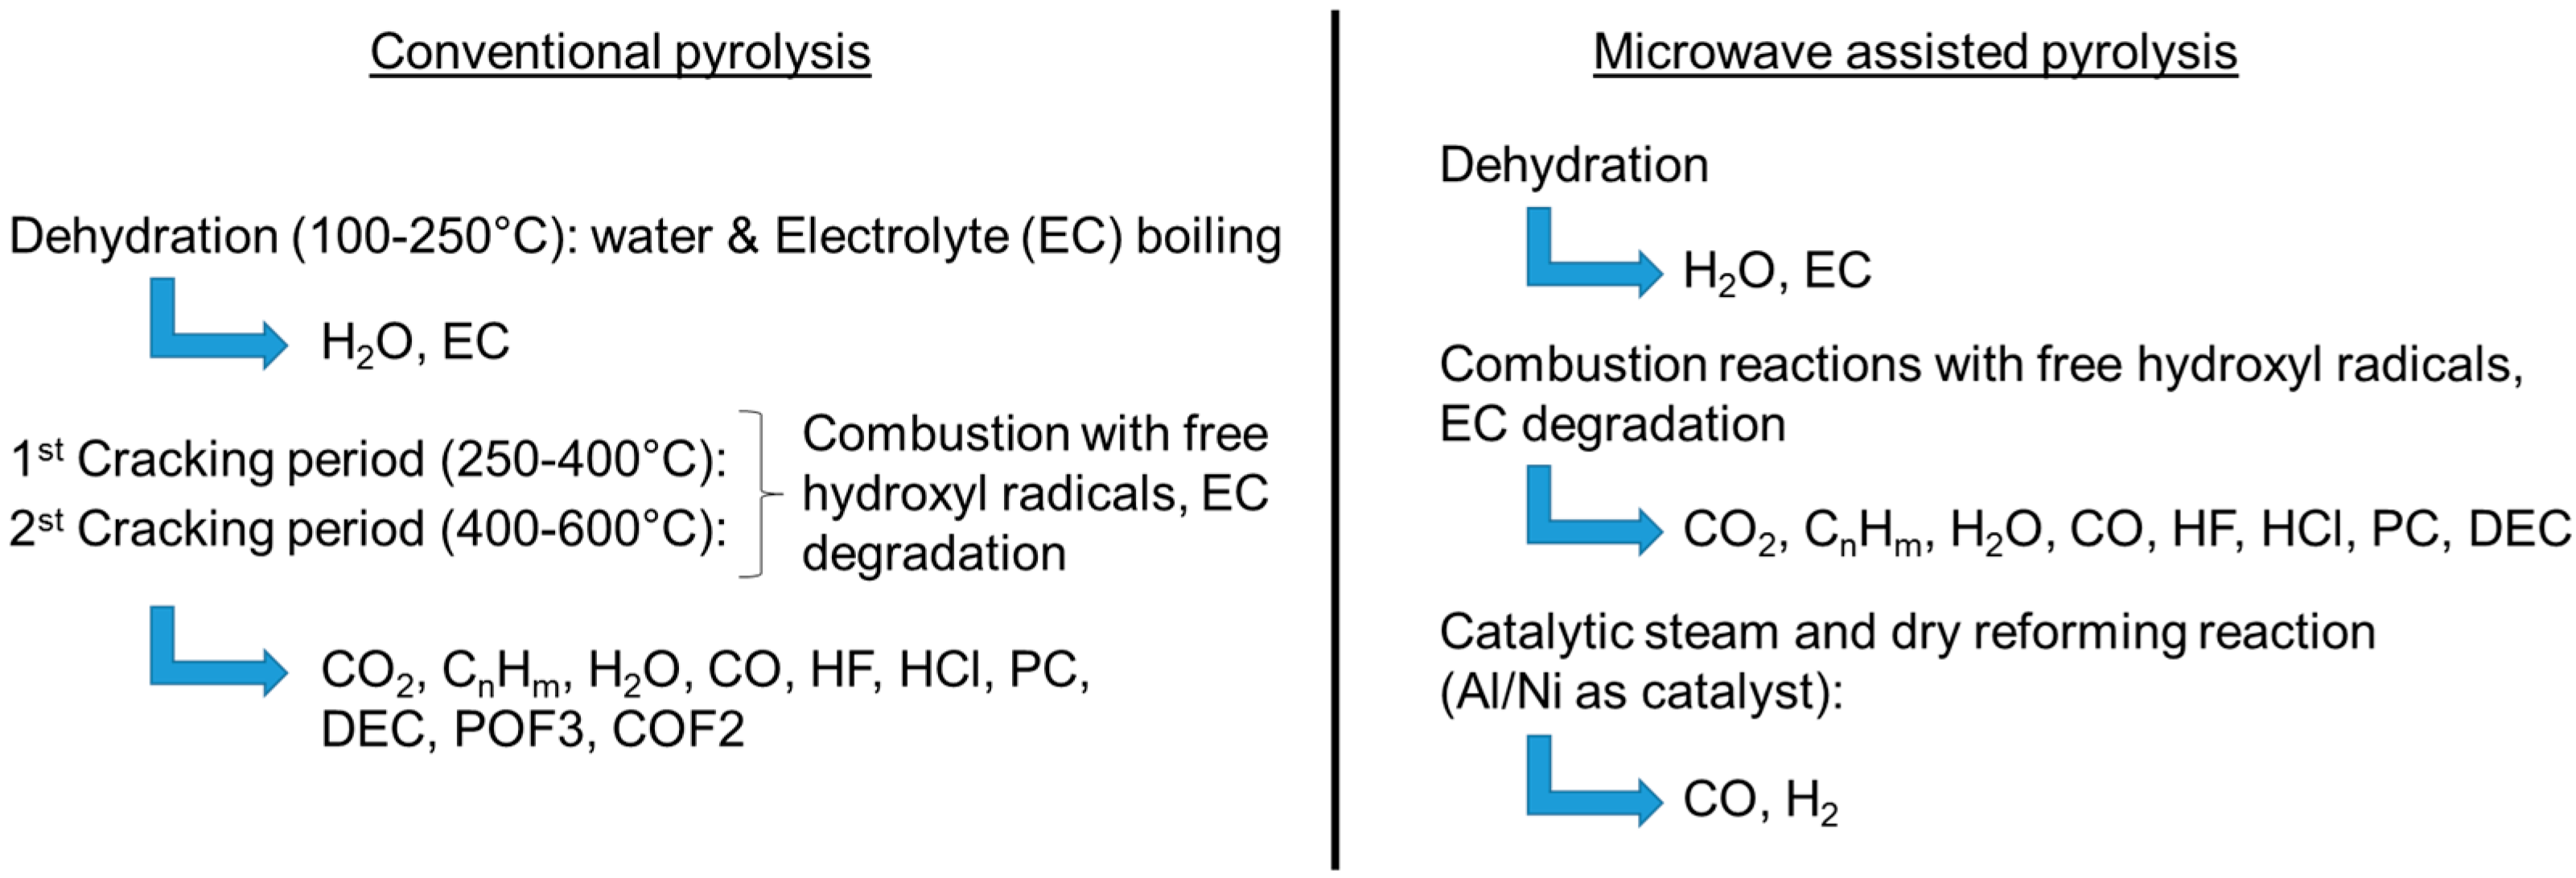
3.2.1. Degradation during Conventional Pyrolysis of a NCA Cathode Material

Cracking of organics during pyrolysis can be described as a very complex process and exact formation of component are difficult to define due to the multiple reactions that happen simultaneously. However, the determination of the gas formation gives some hints about the reactions that occurred during the process. The cracking periods that happened during the conventional pyrolysis is identified in Figure 8. During the whole process, at least three periods can be identified, where the organic material degrades into volatile components and char by, dehydration, cracking, partial oxidation, or reforming reactions.
The first period correspond to a dehydration process, which can be evidenced with the presence of H2O in the produced gas at temperatures between 100–250 °C. After this, the second period begins with formation of CO2, hydrocarbons, H2O, and CO. They are most probably being produced due to combustion of hydrocarbons as indicated in reaction Equation (4). At 320 °C a white smoke appeared in the scrubber, which continued until the temperature reached 360 °C. During this cracking period, there are breakdowns of long chain into short chain molecules, which produces various gaseous compounds, namely CO2, CO, H2O, CH4, phenols, and free carbon. The third cracking period is registered between 400 °C and 600 °C, with the appearance of smoke again and generation of more volatile gases with similar chemical constituents as the second cracking period but in less quantity. In general, it can be observed that combustion of long chain hydrocarbons are probably the main reactions taking place during the second and third cracking period, as is evidenced with the correlation between H2O, CO2, and CO formations. However, free hydrogen was not detected during the whole test. This could be explained due to the presence of free hydroxyl radicals that oxidized the hydrogen atoms as concentration of them is not sufficient to form molecules. In addition, secondary reactions in the gas phase can also explain the lack of hydrogen molecules in the pyrolysis gases. For this particular case, free hydrogen could react in the gas phase with other components, like CO, C, and free oxygen radicals before being measured, as indicated in Equation (8).

3.2.2. Degradation during Microwave Pyrolysis of a NCA Cathode Material

The microwave pyrolysis offers a heating rate of around 3.5 °C/s depending on the material and quality of heat transfer to the material, which in contrast to conventional pyrolysis would be about 20 times faster. Due to the high speed pyrolysis, some strong variations are noticed in the generated gas, as indicated in Figure 9. The main gases registered correspond to H2O, CO, CO2, CxHy, and H2. Individually, for each test, it can be observed that as long as the material prolong the time that is exposed to microwaves to reach higher temperatures, the concentration of the already defined gases are also increased. In general, the concentration of these gases reaches its maximum and then decreases drastically. It can be observed in Figure 9 that after certain point, as long as the target temperature is increased, some gases, like CO2 and H–C, decreases. This might be due to the formation of higher concentration of other gases, like CO and H2. The microwave pyrolysis produced 49–94% of the H–C produced in the conventional pyrolysis (5.71 mL/g of material). The main difference of microwave when compared with conventional pyrolysis is the strong presence of free hydrogen in the produced gas as well as increased presence of short chain molecules.
Formation of hydrogen during microwave pyrolysis can be explained due to two mechanisms that might occur separately or together: (I) Equations (5) and (7) take place due to the high energy coupled with the material that can reach higher temperatures than the temperature that is registered by the thermocouple; (II) Hydrogen is formed due to the strong degradation of long chain hydrocarbons, which due to very high cooling rate of the produced gas when leaving the sample hinders major secondary reactions involving hydrogen in the gas phase. Similar to conventional pyrolysis, the presence of H2O, CO2, and CO strongly indicated that the combustion/partial oxidation of long hydrocarbons are also playing an important role in the degradation of LIB cathode material by microwave heating.
From Figure 9, it is also possible to notice that all experiments under 360 °C showed similar degradation mechanisms. However, when prolonged exposure to microwave to reach higher temperatures than that, aluminum experience a self-heating effect with the microwaves, reaching very high temperatures in very short period of time, thus leading to partial melting and eventually the formation of sparks (see Figure 7). This can be evidenced by the increased amount of hydrogen at higher temperatures in the form of peaks (Figure 9D). However, it is also noticed that, at the same time, formation of water in the gas phase is taking place while the presence of hydrocarbons is decreased. This can be explained by strong formation of hydroxyl radicals at a short period of time, which represent an important source of oxygen [35], leading to strong oxidation reactions with hydrocarbons.

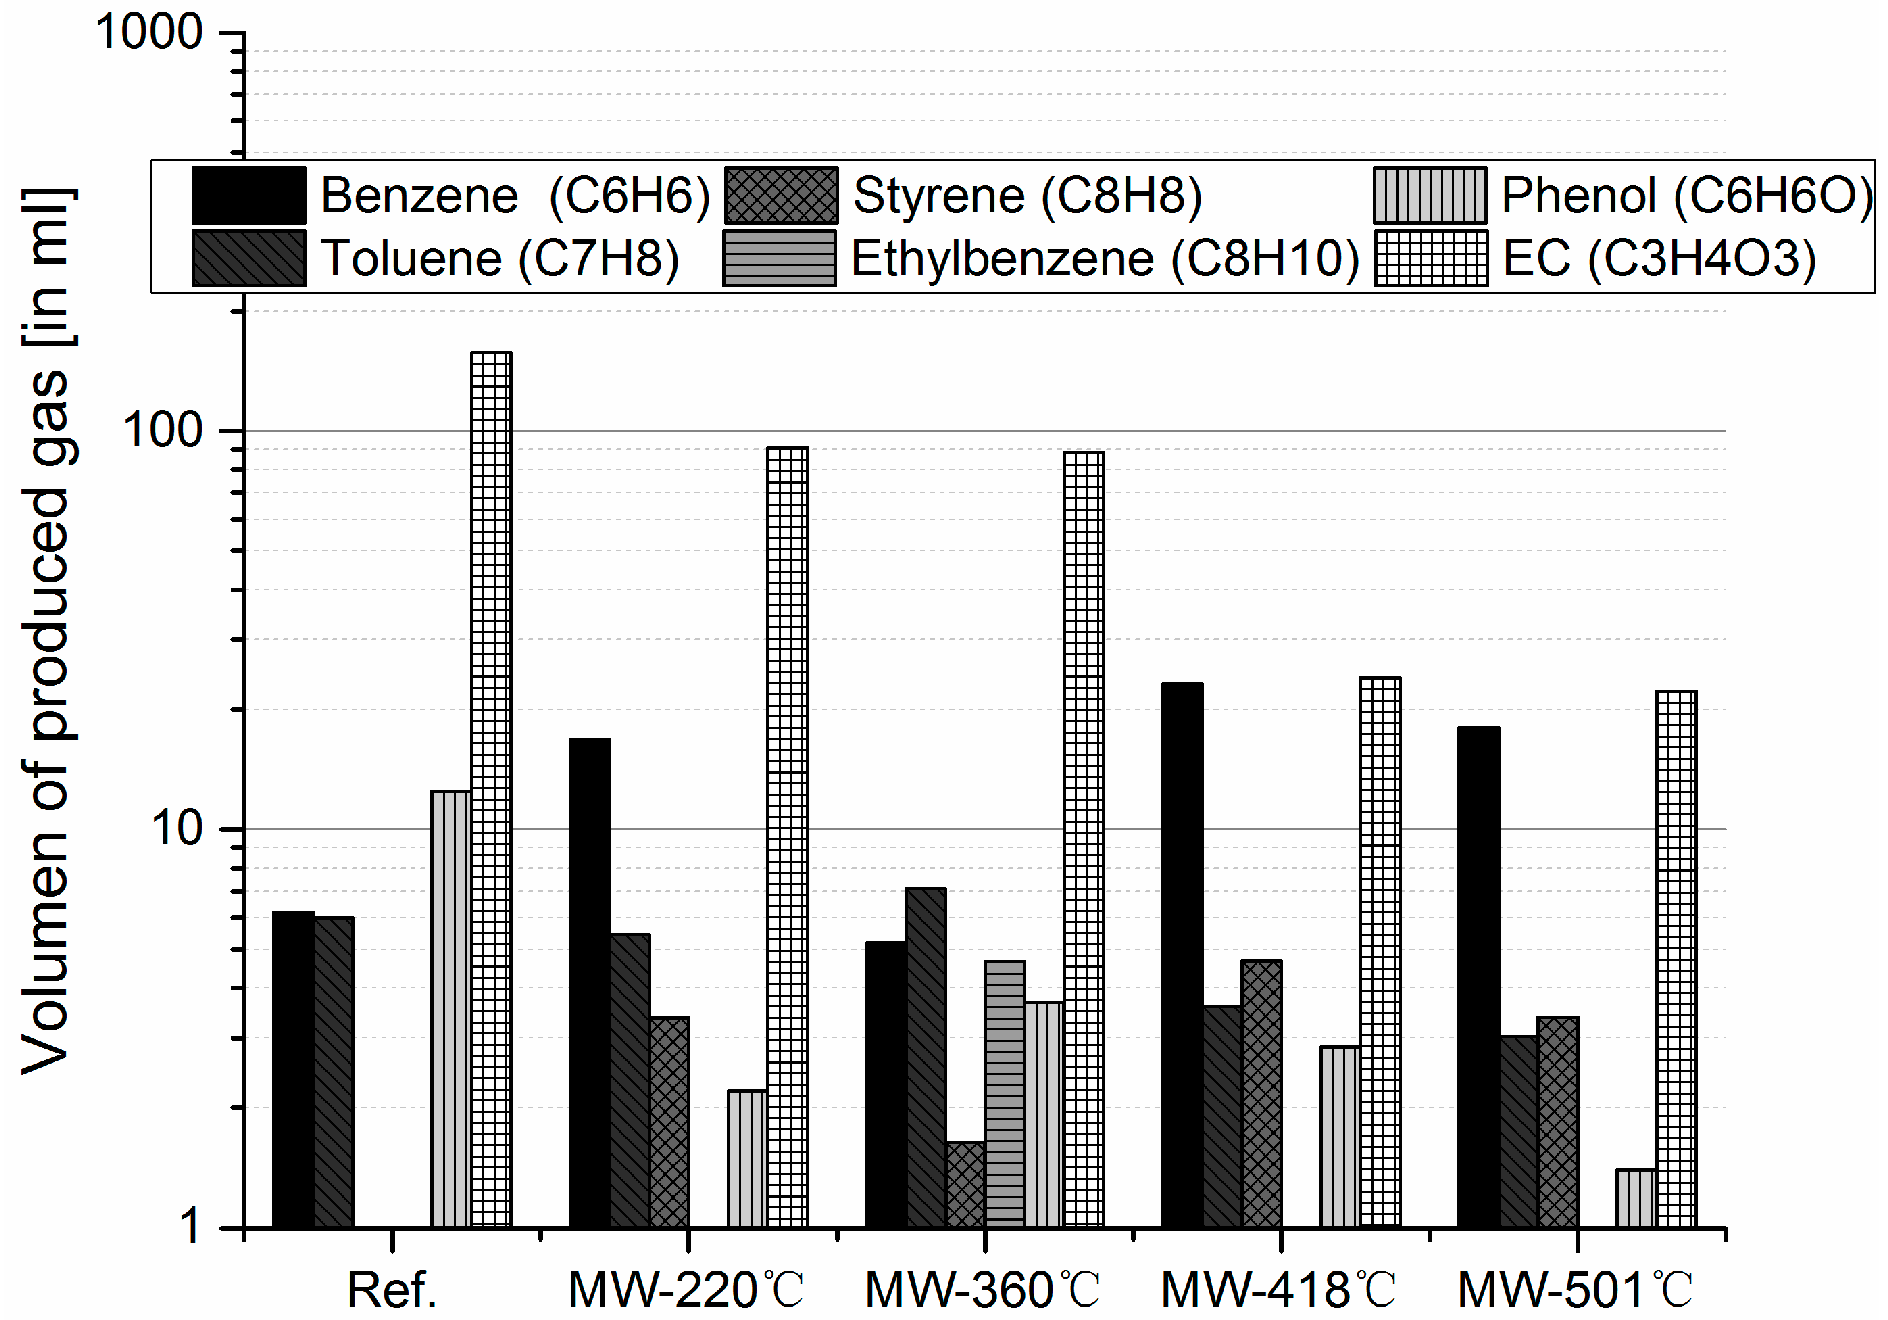
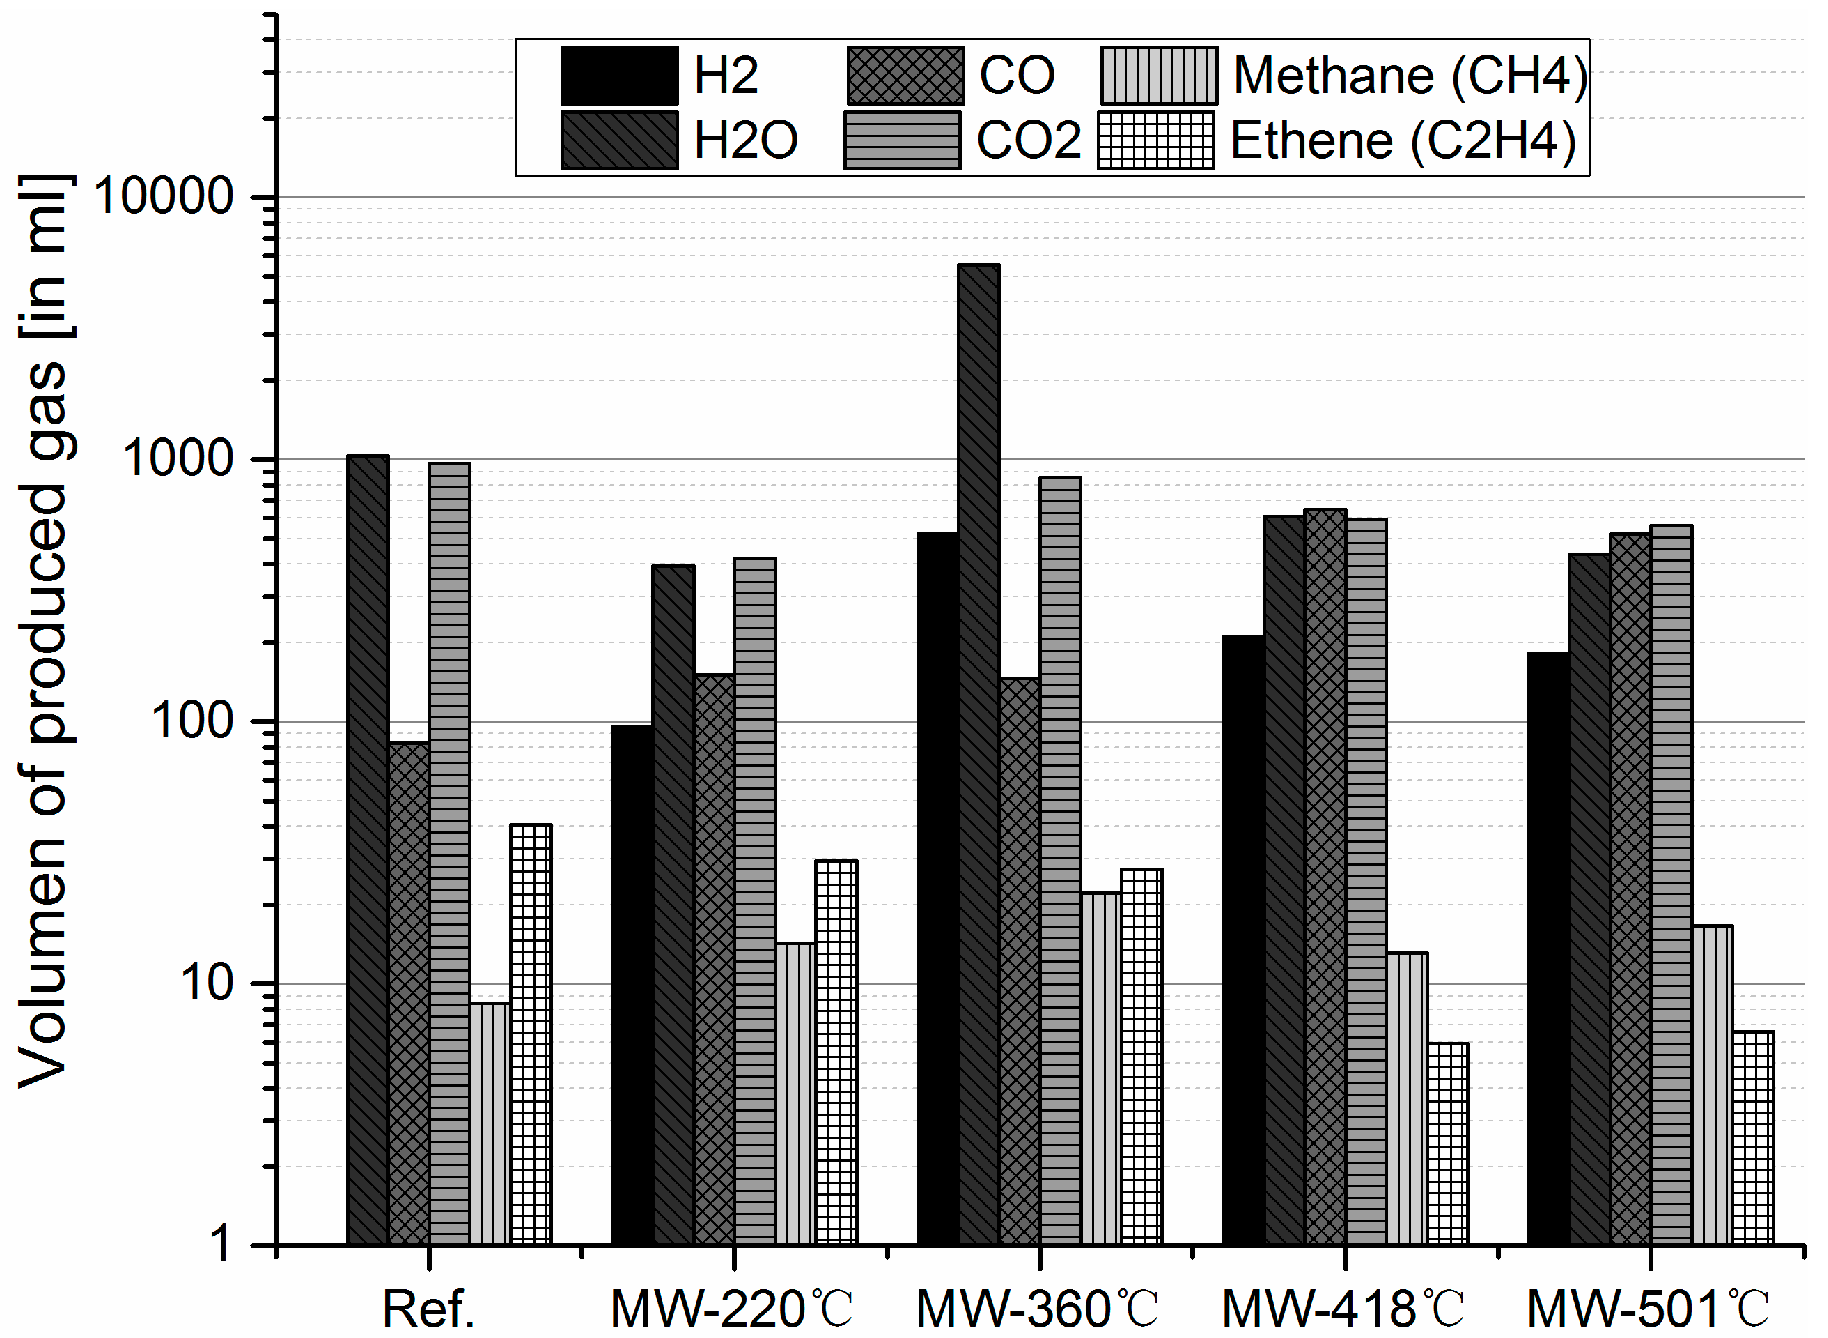
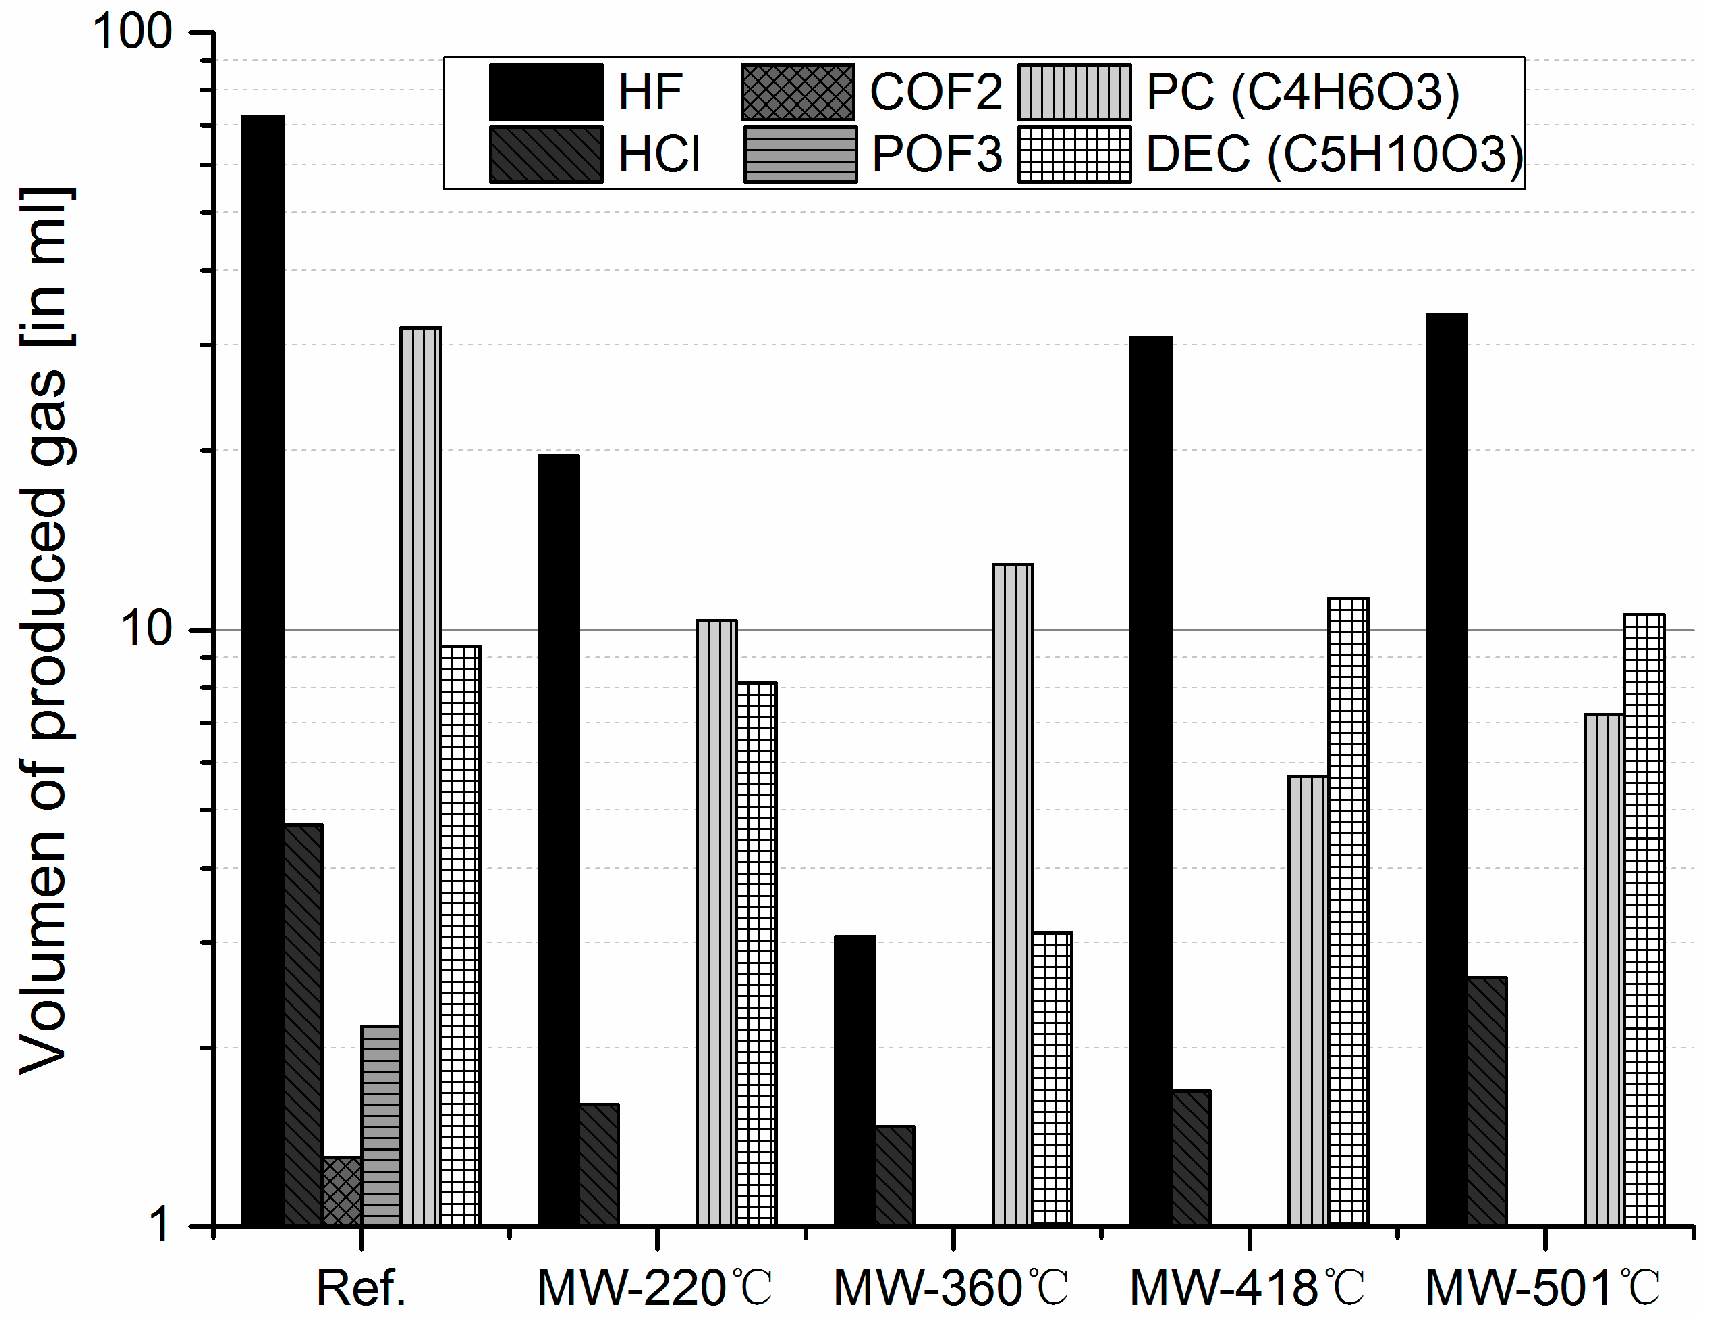
3.2.3. Comparative Study between Conventional and Microwave Pyrolysis on the Formation of Heavy and Light Molecules, and Toxic Compounds

Formation of aromatic-rich mixtures of heavy hydrocarbons with molecular weight greater than benzene might lead to the formation of tars [36]. These tars condense at relative low temperatures leading to possible clogging in the off-gas system, which bring challenges to the commercialization of pyrolysis. Therefore, the formation of lighter hydrocarbons is considered to be beneficial for the robustness of the process.
In order to perform a fair comparison, the total amount of relevant species is calculated based on the measured results. The amount of off-gas is calculated by integrating the time-concentration records from the FTIR, obtaining total volumes in NL, as shown in Equation (24).
V = 1 d   i = 0 n V ˙ ( t i + 1 t i )   ( c i + 1 c i ) / 2 ,
where V is the volume of compound (NL), d is the diluted ratio, V ˙ is flow rate of carried gas (NL/min), ci is concentration of compound at time ti (ppm), and ci+1 is concentration of compound at time ti+1 (ppm).
The cracking of long chain polymers leads to production of linear hydrocarbons. These large hydrocarbons will break when they are exposed for a longer time and at a higher temperature. This cracking is a function of microwave power and working temperature. It is understood that too high temperature, long residence time, and secondary cracking mechanisms will lead to the formation of aromatic compounds [37], which account for the generation of aromatic hydrocarbons, like toluene, ethylbenzene, and styrene. The aromatic hydrocarbons contain sigma bonds, which are difficult to break at lower temperatures. The amount of generated heavy hydrocarbons with molecular weight greater than benzene is shown in Figure 10. It can be seen that in conventional pyrolysis (as referenced in this article) where the rate of breaking bonds is slow when compared with the microwave heating, large amounts of toluene and phenol are expected. In addition, a large amount of electrolyte (EC) is detected in the conventional pyrolysis. This concentration can be explained as a simple volatilization of the electrolyte at lower temperatures that limits the bond breaking in the process. In addition, phenol formation can be explained by the oxidation reactions of hydrocarbons with some free hydroxyl radicals. These secondary reactions can take place due to a prolonged retention time in the reactor when compared to the microwave test.
As indicated in Figure 10, the total amount of heavy molecules is calculated by summering the volume of benzene, toluene, styrene, ethylbenzene, phenol, and EC. The results for conventional and microwave pyrolysis are 183 mL, 120 mL, 110 mL, 59 mL, and 49 mL, respectively. In addition to heavy molecules, light molecules are also investigated to study the influence of heating rate. As shown in Figure 11, the volume of light molecules gases, such as CO2, CO, H2, H2O, CH4, and C2H4 produced in conventional method are about 2.14 L in total. It is also observed in Figure 11 that methane and ethene formation remains relatively constant in all of the trials. Generally, in microwave experiment, the volumes of light molecules gases range from 1.11 to 7.11 L. The minimum registered volume is achieved at 221 °C and the maximum at 360 °C. With this evidence, it can be concluded that, when compared with conventional pyrolysis, microwave-assisted pyrolysis decreases the amount of heavy molecules produced. In addition, prolonged exposure to microwave leads to higher temperatures and heating rates, which promotes the strong formation of shorter molecules by degradation of the electrolyte and consequently, leading to lower production of heavy molecules.
In general, lots of hydrocarbons are produced, which bring some risk of explosion and promotes the formation of highly toxic fluorides, such as HF and POF3. Therefore, additional attention should be paid to toxic compounds. The amount of some relevant toxic species (e.g., fluorides and dangerous electrolyte solvents) are indicted in Figure 12. From this figure, it can be concluded that the toxic compounds achieved their minimum volume at 360 °C. Moreover, COF2 and POF3 are only detected in the conventional pyrolysis. For this particular group of gases, they are supposed to be produced following the degradation reactions of the electrolyte (Equations (11)–(18)).
Microwave assisted pyrolysis might follow a different degradation mechanism as formation of H2 and CO was clearly registered in Figure 12. From this, some observations might bring some hints about some possible mechanism, like the water-aluminum reaction (see Equations (25)–(27)) [38]. This based on the smaller amount of H2O and strong aluminum corrosion in the surface compared with conventional pyrolysis (See Figure 5 and Figure 7). In addition, high content of Nickel (~20%) in the active mass favors the catalytic reactions, which results in increased formation of H2 and CO2 as well. It is worth saying that nickel or nickel-aluminum is a common catalyst used to increase formation of H2 in the pyrolysis process of other organic containing materials and organic gases, like methane [16,39,40,41]. Some of the most typical catalytic reactions are the so-called steam reforming reaction (Equation (28) and the “dry” reforming reaction (Equation (29)). These reactions can take place at low temperature only under catalytic condition, which otherwise would require temperatures above 1100 °C [16]. In particular, methane can be reformed into CO and H2 by means of a catalytic steam reforming, as well as dry reforming reactions, as it is indicated in Equations (30) and (31), respectively. These reactions can take place at temperatures above 700 °C [16]. This catalytic reaction is also plausible as temperature in the material is expected to be much higher than that of the registered temperature with the thermocouple, which could be proved by the melted Al-foil shown in Figure 7. In contrast, the conventional pyrolysis—because of the low heating rate volatilization of organics and water—occurs before any catalytic reaction takes place, which explains the neglectable formation of hydrogen in the produced gas.
2Al + 6H2O → 2Al(OH)3 + 3H2,
2Al + 4H2O → 2Al(OH) + 3H2,
2Al + 3H2O → Al2O3 + 3H2.
Catalytic steam reforming reaction [16]:
CnHm + nH2O → (n + m/2)H2 + nCO.
Catalytic carbon dioxide (or dry) reforming reaction [16]:
CnHm + nCO2 → (m/2)H2 + 2nCO.
Catalytic steam reforming of methane [16]:
CH4 + H2O → 3H2 + CO + 206 kJ/mol.
Catalytic dry reforming of methane [16]:
CH4 + CO2 → 2H2 + 2CO + 247 kJ/mol.

4. Conclusions

The fact that microwave assisted pyrolysis involves the transfer of energy to the material through the interaction of the molecules inside the material offers several advantages when compared to conventional pyrolysis, such as non-contact heating, high heating rates, easy power control, high selectivity of materials, uniform heating effect, and increased kinetics for the degradations process [10,11,12,13]. The microwave pyrolysis offers a heating rate of around 3.5 °C/s depending on the material and quality of heat transfer to the material, which in contrast to conventional pyrolysis, would be about 20 times faster.
In this work, the degradation of organics from a selected cathode material (NCA) by conventional (600 °C) as well as microwave assisted pyrolysis was studied. For the microwave tests, the sample was subjected to different exposure times resulting in different temperatures and heating rates. The comparison was performed with a detailed solid and gas characterization of products.
As indicated in Figure 13, conventional pyrolysis of cathodes from LIBs undergoes three different steps of volatilization: a dehydration & EC boiling step, which is followed by two cracking and reforming periods.
The produced compounds in the gas phase might undergo secondary reactions e.g., combustion of hydrocarbons with free hydroxyl radicals and compounds from the electrolyte solvent degradation.
Microwave assisted pyrolysis introduces an extra degradation mechanism to the conventional pyrolysis. This mechanism is driven by steam and dry reforming reactions, which can take place as a result of catalytic reactions due to the presence of aluminum and nickel in the cathode material. Other factor that benefits this reaction is the high heating rate, which permits reaching high temperatures in the presence of electrolyte and organic gases that can be reformed into CO and H2.
When prolonged exposure to microwave, aluminum experience a self-heating effect with the microwaves, reaching very high temperatures in very short period of time, as evidenced by partial melting of aluminum foils. Nevertheless, over exposure of the material to microwaves (temperature > 360 °C) leads to metal fragmentations thus contamination of the black mass with aluminum.
From the main findings, the following can be highlighted:
  • For microwave assisted pyrolysis, the amount of mass loss increases with the temperature. However, excessive exposure of microwave to the cathode material leads to uncontrollable rapid heating of aluminum, which leads to partial melting and eventually the formation of sparks. Like this, the fragmentation of the metal foil takes place and consequently contamination of the black mass cannot be avoided.
  • When compared with conventional pyrolysis, microwave-assisted decrease the amount of heavy molecules gases produced. In addition, prolonged exposure to microwave leads to higher temperatures thus even lower amount of heavy molecules are registered.
  • Microwave assisted pyrolysis applied to cathodes from LIBs permits catalytic steam and dry reforming reactions, which is evidenced by strong formation of H2 and CO.
  • Short chain molecules are more likely to be formed in microwave assisted pyrolysis when compared to conventional pyrolysis. This, due to the rapid heating and breaking of long chain molecules into short molecules. In addition, the process experienced limited secondary reactions in the gas phase due to fast cooling of the produced gas after leaving the sample.
  • Microwave pyrolysis at 360 °C is suggested in this study after taking mass loss, active mass yield ratio, heavy and light molecules, and toxic compounds into consideration.

Author Contributions

F.D., Y.W., and T.M., Writing-Original Draft Preparation; F.D., Y.W., Formal Analysis, Writing-Review & Editing; F.D., Conceptualization & Methodology; B.F., supervision.

Funding

This research received no external funding.

Conflicts of Interest

The authors declare no conflict of interest.

References

  1. McDowall, J. Understanding lithium-ion technology. In Proceedings of the Battcon, Marco Island, FL, USA, 5–7 May 2008. [Google Scholar]
  2. Wu, Y. Lithium-Ion Batteries: Fundamentals and Applications; CRC Press: Vancouver, BC, Canada, 2015. [Google Scholar]
  3. Pillot, C. Lithium Ion Battery Raw Material Supply & Demand 2016–2025. In Proceedings of the Advanced Automotive Battery Conference, Mainz, Germany, 30 January–2 February 2017. [Google Scholar]
  4. O’Driscoll, M. Industrial mineral recycling in Li-ion batteries: Impact on raw material supply chain? In Proceedings of the Advanced Automotive Battery Conference, Mainz, Germany, 30 January–2 February 2017. [Google Scholar]
  5. Baylis, R. LIB raw material supply chain bottlenecks: Looking beyond supply/demand/price. In Proceedings of the Advanced Automotive Battery Conference, Mainz, Germany, 30 January–2 February 2017. [Google Scholar]
  6. Friedrich, B.; Träger, T.; Peters, L. Lithium Ion Battery Recycling and Recent IME Activities. In Proceedings of the Advanced Automotive Battery Conference, Mainz, Germany, 30 January–2 February 2017. [Google Scholar]
  7. Ordoñez, J.; Gago, E.J.; Girard, A. Processes and technologies for the recycling and recovery of spent lithium-ion batteries. Renew. Sustain. Energy Rev. 2016, 60, 195–205. [Google Scholar] [CrossRef]
  8. European Li-Ion Battery Advanced Manufacturing for Electric Vehicles (ELIBAMA). Li-ion BATTERIES RECYCLING. The batteries end of life…. 2014. Available online: http://www.webcitation.org/717f6wRdJ (accessed on 23 July 2018).
  9. Zeng, X.; Li, J.; Singh, N. Recycling of Spent Lithium-Ion Battery: A Critical Review. Crit. Rev. Environ. Sci. Technol. 2014, 44, 1129–1165. [Google Scholar] [CrossRef]
  10. Huang, Y.-F.; Chiueh, P.-T.; Lo, S.-L. A review on microwave pyrolysis of lignocellulosic biomass. Sustain. Environ. Res. 2016, 26, 103–109. [Google Scholar] [CrossRef]
  11. Sun, J.; Wang, W.; Liu, Z.; Ma, Q.; Zhao, C.; Ma, C. Kinetic Study of the Pyrolysis of Waste Printed Circuit Boards Subject to Conventional and Microwave Heating. Energies 2012, 5, 3295–3306. [Google Scholar] [CrossRef] [Green Version]
  12. Walkiewicz, J.W.; Kazonich, G.; McGill, S.L. Microwave heating characteristics of selected minerals and compounds. Miner. Metall. Process. 1988, 5, 39–42. [Google Scholar]
  13. Gupta, M.; Eugene, W.W.L. Microwaves and Metals; John Wiley & Sons (Asia) Pte Ltd.: Singapore, 2007. [Google Scholar]
  14. Preto, F. Pyrolysis, Char and Energy. Presentation at the Canadian Biochar Initiative, inaugural Meeting, CAnmetEnergy: December 12, 2008, Ste Anne de Bellevue. Available online: http://www.webcitation.org/717hJZ4pw (accessed on 23 July 2018).
  15. Luyima, A. Recycling of Electronic Waste: Pinted Wiring Board. Ph.D. Thesis, Missouri University of Science and Technology, Rolla, MO, USA, 2013. [Google Scholar]
  16. Basu, P. Biomass Gasification and Pyrolysis. Practical Design and Theory; Elsevier/AP: Amsterdam, The Netherlands, 2010. [Google Scholar]
  17. Marto, C. Pyrolysis of Peat: An Experimental Investigation. Master’s Thesis, University of Padua, Padua, Italy, 2014. [Google Scholar]
  18. Epple, B.; Leithner, R.; Linzer, W.; Walter, H. Simulation von Kraftwerken und Wärmetechnischen Anlagen; Springer: Vienna, Austria, 2009. [Google Scholar]
  19. Luda, M.P. Waste Electrical and Electronic Equipment (WEEE) Handbook, Handbook: Pyrolysis of WEEE Plastics; Woodhead Publishing: Cambridge, UK, 2012. [Google Scholar]
  20. Diaz, F.; Flerus, B.; Nagraj, S.; Bokelmann, K.; Stauber, R.; Friedrich, B. Comparative Analysis about Degradation Mechanisms of Printed Circuit Boards (PCBs) in Slow and Fast Pyrolysis: The Influence of Heating Speed. J. Sustain. Metall. 2018, 408, 183. [Google Scholar] [CrossRef]
  21. Sun, L.; Qiu, K. Vacuum pyrolysis and hydrometallurgical process for the recovery of valuable metals from spent lithium-ion batteries. J. Hazard. Mater. 2011, 194, 378–384. [Google Scholar] [CrossRef] [PubMed]
  22. Träger, T.; Friedrich, B.; Weyhe, R. Recovery Concept of Value Metals from Automotive Lithium-Ion Batteries. Chem. Ing. Tech. 2015, 87, 1550–1557. [Google Scholar] [CrossRef]
  23. Guo, H.-J.; Li, X.-H.; Zhang, X.-M.; Wang, Z.-X.; Peng, W.-J.; Zhang, B. Optimizing pyrolysis of resin carbon for anode of lithium ion batteries. J. Cent. South Univ. Technol. 2006, 13, 58–62. [Google Scholar] [CrossRef]
  24. Feng, X.; Ouyang, M.; Liu, X.; Lu, L.; Xia, Y.; He, X. Thermal runaway mechanism of lithium ion battery for electric vehicles: A review. Energy Storage Mater. 2018, 10, 246–267. [Google Scholar] [CrossRef]
  25. Kawamura, T.; Kimura, A.; Egashira, M.; Okada, S.; Yamaki, J.-I. Thermal stability of alkyl carbonate mixed-solvent electrolytes for lithium ion cells. J. Power Sources 2002, 104, 260–264. [Google Scholar] [CrossRef]
  26. Spotnitz, R.; Franklin, J. Abuse behavior of high-power, lithium-ion cells. J. Power Sources 2003, 113, 81–100. [Google Scholar] [CrossRef]
  27. Tobishima, S.-I.; Yamaki, J.-I. A consideration of lithium cell safety. J. Power Sources 1999, 81–82, 882–886. [Google Scholar] [CrossRef]
  28. Wang, Q.; Ping, P.; Zhao, X.; Chu, G.; Sun, J.; Chen, C. Thermal runaway caused fire and explosion of lithium ion battery. J. Power Sources 2012, 208, 210–224. [Google Scholar] [CrossRef]
  29. Chen, Y.; Tang, Z.; Lu, X.; Tan, C. Research of explosion mechanism of lithium-ion battery. Prog. Chem. 2006, 18, 823–831. [Google Scholar]
  30. Sutton, W. Microwave Processing of Ceramic Materials. Am. Ceram. Soc. Bull. 1989, 68, 376–386. [Google Scholar]
  31. Sun, J.; Wang, W.; Yue, Q. Review on Microwave-Matter Interaction Fundamentals and Efficient Microwave-Associated Heating Strategies. Materials 2016, 9, 231. [Google Scholar] [CrossRef] [PubMed]
  32. Sun, J.; Wang, W.; Liu, Z.; Ma, C. Recycling of Waste Printed Circuit Boards by Microwave-Induced Pyrolysis and Featured Mechanical Processing. Ind. Eng. Chem. Res. 2011, 50, 11763–11769. [Google Scholar] [CrossRef]
  33. Blomgren, G.E. The Development and Future of Lithium Ion Batteries. J. Electrochem. Soc. 2016, 164, A5019–A5025. [Google Scholar] [CrossRef] [Green Version]
  34. Ehsan, R.; Kerstin, S.; Moritz, V. Kompendium: Li-Ionen-Batterien. Available online: http://www.webcitation.org/717pBmpxj (accessed on 23 July 2018).
  35. Jackson, W.M.; Conley, R.T. High temperature oxidative degradation of phenol–formaldehyde polycondensates. J. Appl. Polym. Sci. 1964, 8, 2163–2193. [Google Scholar] [CrossRef]
  36. Gasification. Chemistry, Processes, and Applications; Baker, M.D., Ed.; Nova Science Publishers: New York, NY, USA, 2012. [Google Scholar]
  37. Gracida-Alvarez, U.R.; Mitchell, M.K.; Sacramento-Rivero, J.C.; Shonnard, D.R. Effect of Temperature and Vapor Residence Time on the Micropyrolysis Products of Waste High Density Polyethylene. Ind. Eng. Chem. Res. 2018, 57, 1912–1923. [Google Scholar] [CrossRef]
  38. Setiani, P.; Watanabe, N.; Sondari, R.R.; Tsuchiya, N. Mechanisms and kinetic model of hydrogen production in the hydrothermal treatment of waste aluminum. Mater. Renew. Sustain. Energy 2018, 7, 4013. [Google Scholar] [CrossRef]
  39. Galdámez, J.R.; García, L.; Bilbao, R. Hydrogen Production by Steam Reforming of Bio-Oil Using Coprecipitated Ni−Al Catalysts. Acetic Acid as a Model Compound. Energy Fuels 2005, 19, 1133–1142. [Google Scholar] [CrossRef]
  40. Wang, D.; Czernik, S.; Chornet, E. Production of Hydrogen from Biomass by Catalytic Steam Reforming of Fast Pyrolysis Oils. Energy Fuels 1998, 12, 19–24. [Google Scholar] [CrossRef]
  41. Shah, N.; Panjala, D.; Huffman, G.P. Hydrogen Production by Catalytic Decomposition of Methane. Energy Fuels 2001, 15, 1528–1534. [Google Scholar] [CrossRef]
Figure 1. (a) The battery used for the experiment and (b) starting material for the experiment.
Metals 08 00565 g001
Figure 2. Experimental setup for the conventional pyrolysis test.
Metals 08 00565 g002
Figure 3. Microwave pyrolysis plant (unit: mm).
Metals 08 00565 g003
Figure 4. Mass loss and material distribution (active mass vs. aluminum) after pyrolysis.
Metals 08 00565 g004
Figure 5. Variation of elements in the active mass during microwave pyrolysis.
Metals 08 00565 g005
Figure 6. Aluminum foil after microwave (MW) treatment (MW 501 °C): presence of main elements in the surface (electron probe micro-analyzer, EPMA).
Metals 08 00565 g006
Figure 7. Aluminum foil after treatment: (a) Reference; (b) MW 220 °C; (c) MW 360 °C; (d) MW 418 °C; and, (e) MW 501 °C.
Metals 08 00565 g007
Figure 8. Produced gas analysis in conventional pyrolysis (Reference test).
Metals 08 00565 g008
Figure 9. Produced gas analysis in microwave pyrolysis at max. temp.: (A) 220 °C; (B) 360 °C; (C) 418 °C; and, (D) 501 °C.
Metals 08 00565 g009
Figure 10. Volume of heavy molecules generated at different target temperatures with microwave heating.
Metals 08 00565 g010
Figure 11. Volume of light molecules generated at different target temperatures with microwave heating.
Metals 08 00565 g011
Figure 12. Volume of toxic compounds generated at different target temperatures with microwave heating.
Metals 08 00565 g012
Figure 13. Basic degradation of organics present in commercial cathodes from LIBs during conventional and microwave assisted pyrolysis.
Metals 08 00565 g013
Table 1. Typical reactions during pyrolysis [16].
TypeReactions
Combustion of carbonC + O2 ↔ CO2H = −393.5 kJ/mol(2)
C + 1/2O2 ↔ COH = −111.4kJ/mol(3)
Combustion of hydrocarbonsCxHy + (x + y/4)O2xCO2 + (y/2)H2O(4)
CxHy + (x/2)O2xCO + (y/2)H2(5)
Gasification reactionsC + H2O ↔ CO + H2H = 131.3 kJ/mol(6)
CO + H2O ↔ CO2 + H2H = −41 kJ/mol(7)
C + 2H2 ↔ CH4H = −74 kJ/mol(8)
Table 2. Main thermal degradation reactions of Li-ion batteries (LIBs) in cathode (based on [24,25,26,27,28,29]).
TypeReactions
SEI(CH2OCO2Li)2 → Li2CO3 + C2H4 + CO2 + 1/2O2(9)
2Li + (CH2OCO2Li)2 → 2Li2CO3 + C2H4(10)
ElectrolyteLiPF6 ⇌ LiF + PF5(11)
LiPF6 + H2O ⇌ LiF + HF + POF3(12)
C2H5OCOOC2H5 + PF5 → C2H5OCOOPF4HF + C2H4(13)
C2H5OCOOC2H5 + PF5 → C2H5OCOOPF4 + C2H5F(14)
C2H5OCOOPF4 → HF + C2H4 + CO2 + POF3(15)
C2H5OCOOPF4 → C2H5F + CO2 + POF3(16)
C2H5OCOOPF4 + HF → PF4OH + CO2 + C2H5F(17)
C2H5OH + C2H4 → C2H5OC2H5(18)
Decomposition at the cathodeLi0.5CoO2 → 1/2LiCoO2 + 1/6Co3O4 + 1/6O2(19)
Li(1−x)NiO2 → (1 − 2x)LiNiO2 + xLiNi2O4 (x ≤ 0.5)(20)
Li(1–x)NiO2 → [Li(1−x)Ni(2x−1)/3] [Ni(4−2x)/3]O(8−4x)/3 + (2x − 1)/3O2 (x > 0.5)(21)
Li(1−x)NiO2 → (2 − x)Li(1−x)/(2−x)Ni1/(2−x)O + x/2O2(22)
PVDF binder–CH2–CF2– + Li → LiF + –CH=CF– + 0.5H2(23)

