Influence of Stress State on the Mechanical Impact and Deformation Behaviors of Aluminum Alloys


1
Department of Mechanical Engineering, University Carlos III of Madrid, Avda. de la Universidad 30, 28911 Leganés, Madrid, Spain
2
Department of Engineering Science, University of Oxford, Parks Road, Oxford OX1 3PJ, UK
3
Department of Continuum Mechanics and Structural Analysis, University Carlos III of Madrid, Avda. de la Universidad 30, 28911 Leganés, Madrid, Spain
4
Laboratory of Microstructure Studies and Mechanics of Materials (LEM3), Lorraine University, 7 rue Félix Savart, BP 15082, 57073 Metz CEDEX 03, France
*
Authors to whom correspondence should be addressed.
Metals 2018, 8(7), 520; https://doi.org/10.3390/met8070520
Submission received: 31 May 2018
/
Revised: 1 July 2018
/
Accepted: 2 July 2018
/
Published: 5 July 2018
(This article belongs to the Special Issue Deformation Behavior of the Alloys under Simple and Combined Loading Conditions at Various Deformation Rate)
Abstract
:Under impact loading conditions, the stress state derived from the contact between the projectile and the target, as well as from the subsequent mechanical waves, is a variable of great interest. The geometry of the projectile plays a dertermining role in the resulting stress state in the targeted structure. In this regard, different stress states lead to different failure modes. In this work, we analyze the influence of the stress state on the deformation and failure behaviors of three aluminum alloys that are commonly used in the aeronautical, naval, and automotive industries. To this purpose, tension-torsion tests are performed covering a wide range of stress triaxialities and Lode parameters. Secondly, the observations from these static tests are compared to failure mode of the same materials at high impact velocities tests with the aim of analysing the role of stress state and strain rate in the mechanical response of the aluminum plates. Experimental impacts are conducted with different projectile geometries to allow for the analysis of stress states influence. In addition, these experiments are simulated by using finite element models to evaluate the predictive capability of three failure criteria: critical plastic deformation, Johnson-Cook, and Bai-Wierzbicki.
1. Introduction
In recent years, an exhaustive effort has been made to improve the knowledge about energy absorption and crashworthiness of protective structures. In this regard, many engineering fields require a comprehensive study of the mechanical behavior of metallic structures with the fundamental requirement of lightweight and safety. Therefore, the deformation and the damage initiation/development in such structures are relevant phenomena which should be considered when assessing the ballistic performance of ductile structures. The deformation of a ductile material involves an increase of the dislocation density, arrangement in pile-ups and then, the nucleation and growth of internal voids until the final failure [1]. Moreover, the failure of ductile materials under impact loadings involves high deformation rates and temperatures. In addition, the failure process is driven by metallurgical events such as nucleation, growth, and coalescence of holes. Numerous phenomenological models have been developed to predict ductile failure. Pioneer works of McClintock [2,3] and Rice and Tracey [4] firstly introduced the consideration of the stress triaxiality, which is defined as the ratio of hydrostatic pressure to von Mises equivalent stress, as a relevant variable in the ductile failure event. Numerous experimental studies [5,6,7,8,9] have shown that failure decreases for higher stress triaxialities. Johnson and Cook [7] proposed in phenomenological terms that the equivalent plastic failure strain can be related to the stress triaxiality by an exponential function. However, Barsoum and Faleskog [10,11] have shown that the stress triaxiality is not sufficient to properly describe the behavior of the material at failure by its own. Consequently, they introduced the so-called Lode parameter to describe correctly the stress state; which is based on the third invariant of the stress tensor.
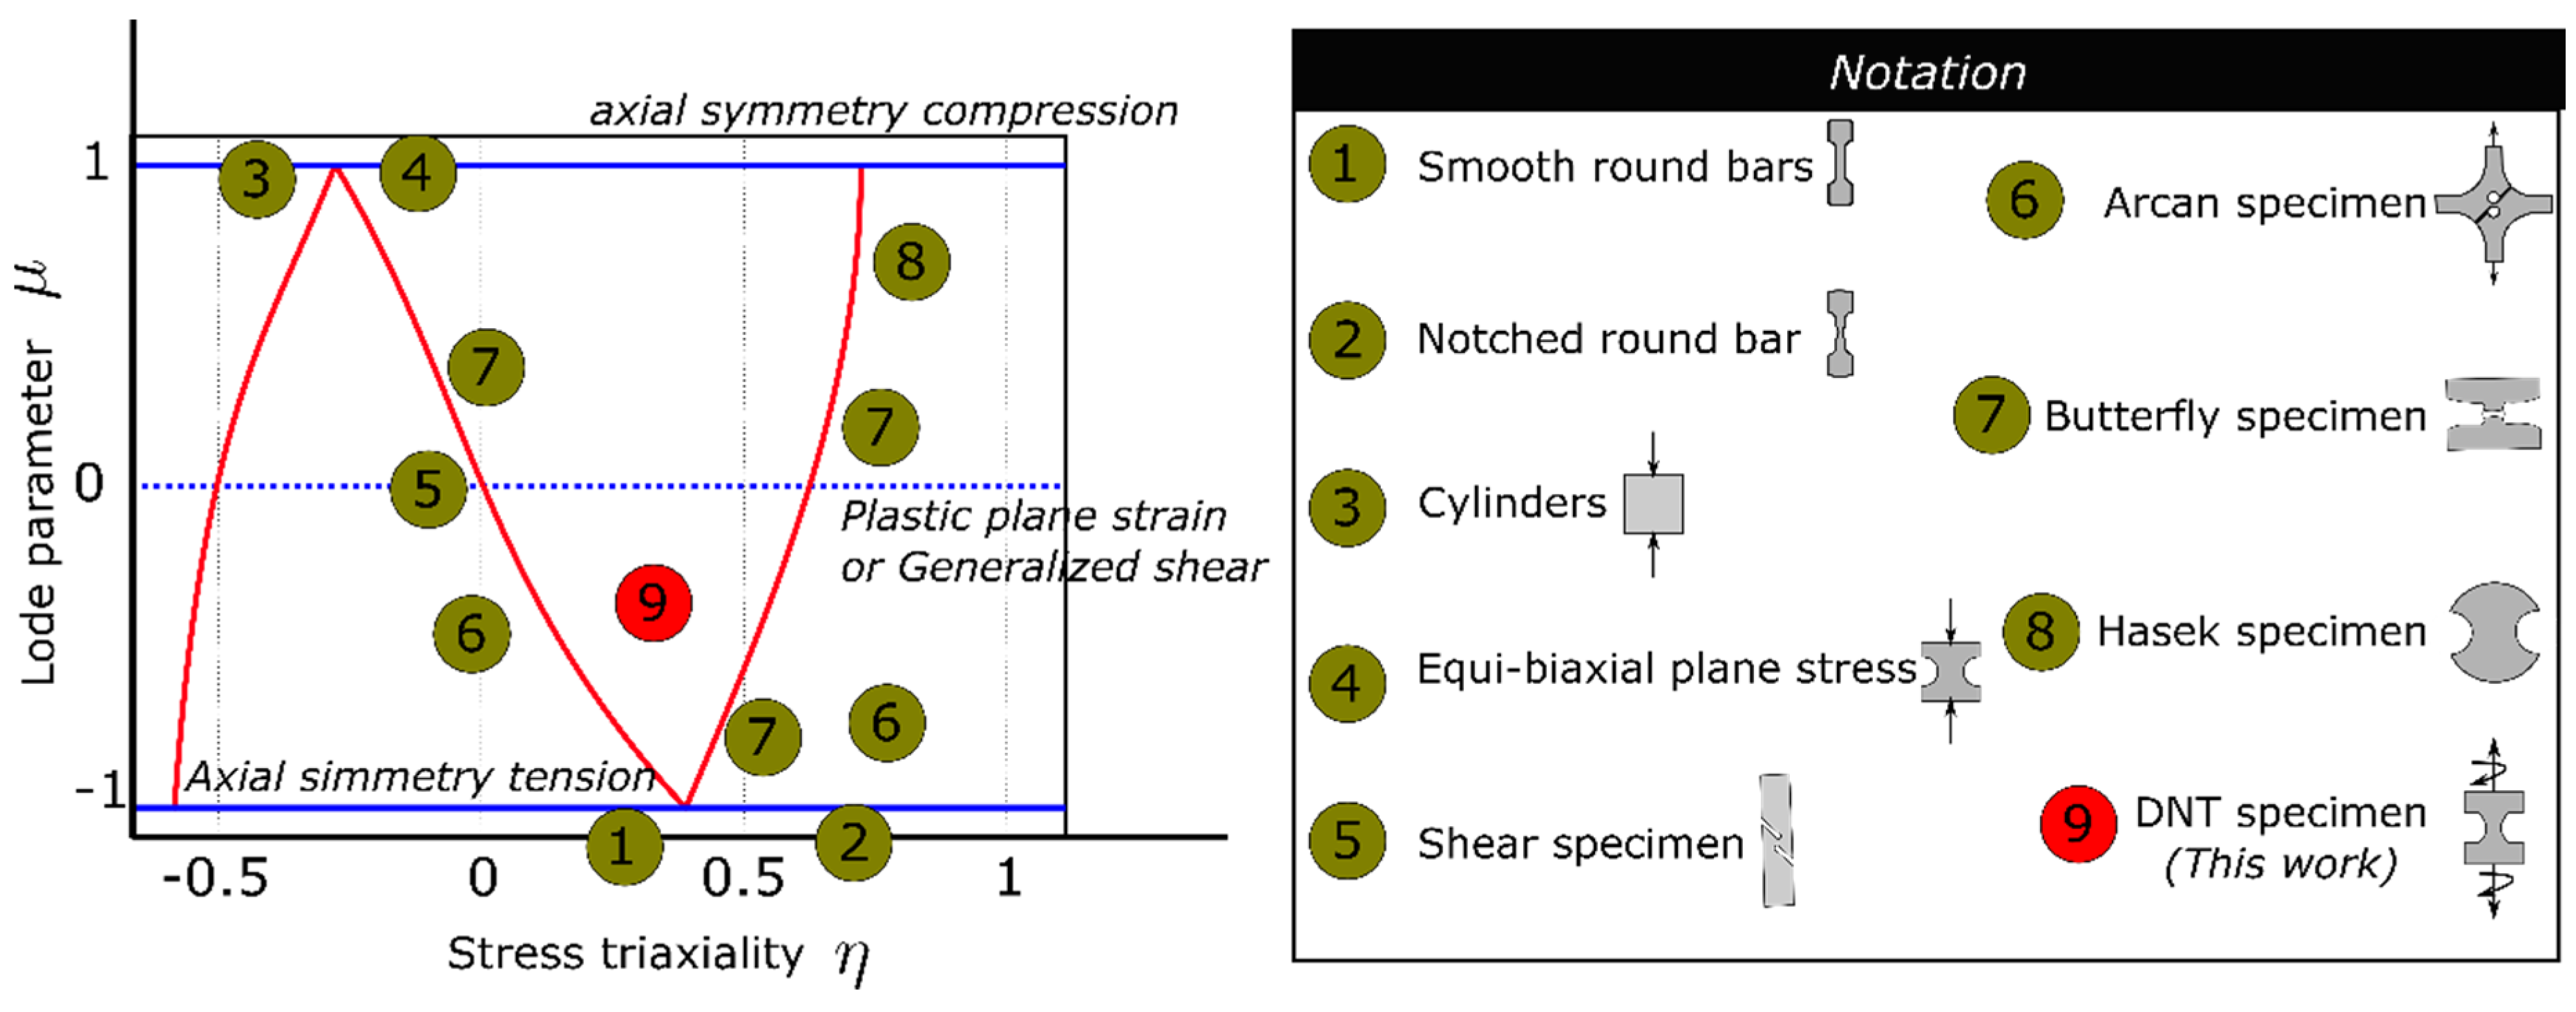
The analysis of the influence of stress triaxiality and Lode parameter on failure has been addressed by the consideration of several specimen geometries and loading methods [12]. A conceptual representation of the stress states on the plane of stress triaxiality and lode parameter is presented in Figure 1.
The relation between failure modes and stress triaxiality has not been widely studied in impact processes on metallic plates by means of the shape of the projectile nose and material thickness [1,13,14,15]. Kpenyigba et al. [13] performed experimental tests and numerical simulations to study the impact response of 1 mm thick mild steel sheets against blunt-, conical-, and hemispherical-shape projectiles. Their study revealed that the ballistic limit of this material is higher for hemispherical projectiles, followed by conical and blunt ones respectively. The failure mechanisms found to be associated to each projectile type were: the blunt projectile induced plug ejection due to high-speed shearing; the conical projectile caused failure by petaling due to piercing; and the hemispherical projectile led to radial hole expansion inducing necking and radial cracks. Based on an optimization process for the whole range of impact velocities considered and with the use of numerical models, these authors found a critial failure strain for each specific projectile shape. The stress triaxialities considered were 0 for blunt projectiles, 0.33 for conical projectiles, and 0.66 for hemispherical projectiles. Fras et al. [1] calibrated the failure parameters of the Johnson-Cook model for the aluminum alloy AA7020-T651 from quasi-static tests. However, they found that the failure parameters were not able to reproduce the plug-based failure in impact events faithfully. In this regard, the use of different parameters and of the Johnson–Cook failure model, related to the influence of the stress state temperature, allowed them to simulate the plug shape observed in the experiments. These results revealed a keen sensitivity to the change of JC parameters.
In this work, AA 2024-T351, AA 5754-H111, and AA 6082-T6 aluminum alloys are mechanically characterized by static tension–torsion tests and impact tests. The observations from static tests are compared to failure mode of the same materials at high impact velocities tests. Experimental impact tests are conducted with different projectile geometries and different thickness plate to induce different stress states. In addition, numerical models are developed for to complement the analysis of stress state (triaxiality and Lode parameter) and strain rate effects. The analysis can evaluate the appropriateness of different failure approaches considered: critical plastic deformation, Johnson-Cook, and Bai-Wierzbicki. The combined study of the experimental and numerical results illustrates the joint effects that target material behavior, projectile nose shape, and impact velocity have on the ductile failure.
2. Materials Description
Three aluminum alloys used in this work: 5754-H111, 6082-T6, and 2024-T351. 5754-H111 aluminum alloys have excellent corrosion resistance, especially to seawater and contaminated atmospheres. It is therefore very suitable for use in the marine industry. The most common applications for aluminum alloy are soil, shipbuilding, chemical welding, and nuclear structure applications. It is also commonly used in structural elements and interior panels in the automotive industry. The chemical composition of the material (% by weight) is shown in Table 1 [16].
The 6082-T6 aluminum alloys offer moderate strength with good ductility in heat-treated and aged condition. Aluminum alloy 6082 is one of the strongest alloys in the 6xxx group [16]. It can also be found in exterior airframe panels being a real alternative to conventional mild steel in automotive panels and structures. The chemical composition of the material (% by weight) is reflected in Table 1. Magnesium (0.730%) and silicon (0.990%) are the main alloying elements of this alloy.
Aluminum alloy 2024-T351 posse good combinations of high strength (especially at elevated temperatures), toughness, and, in specific instances, weldability [16]. The main applications of this material are aircraft structural components, wing tension members, hardware, truck wheels, scientist instruments, veterinary and orthopaedic braces and equipment, and in rivets because of its high strength, excellent fatigue resistance, and good strength-to-weight ratio. The chemical composition of the material (% by weight) is reflected in Table 1.
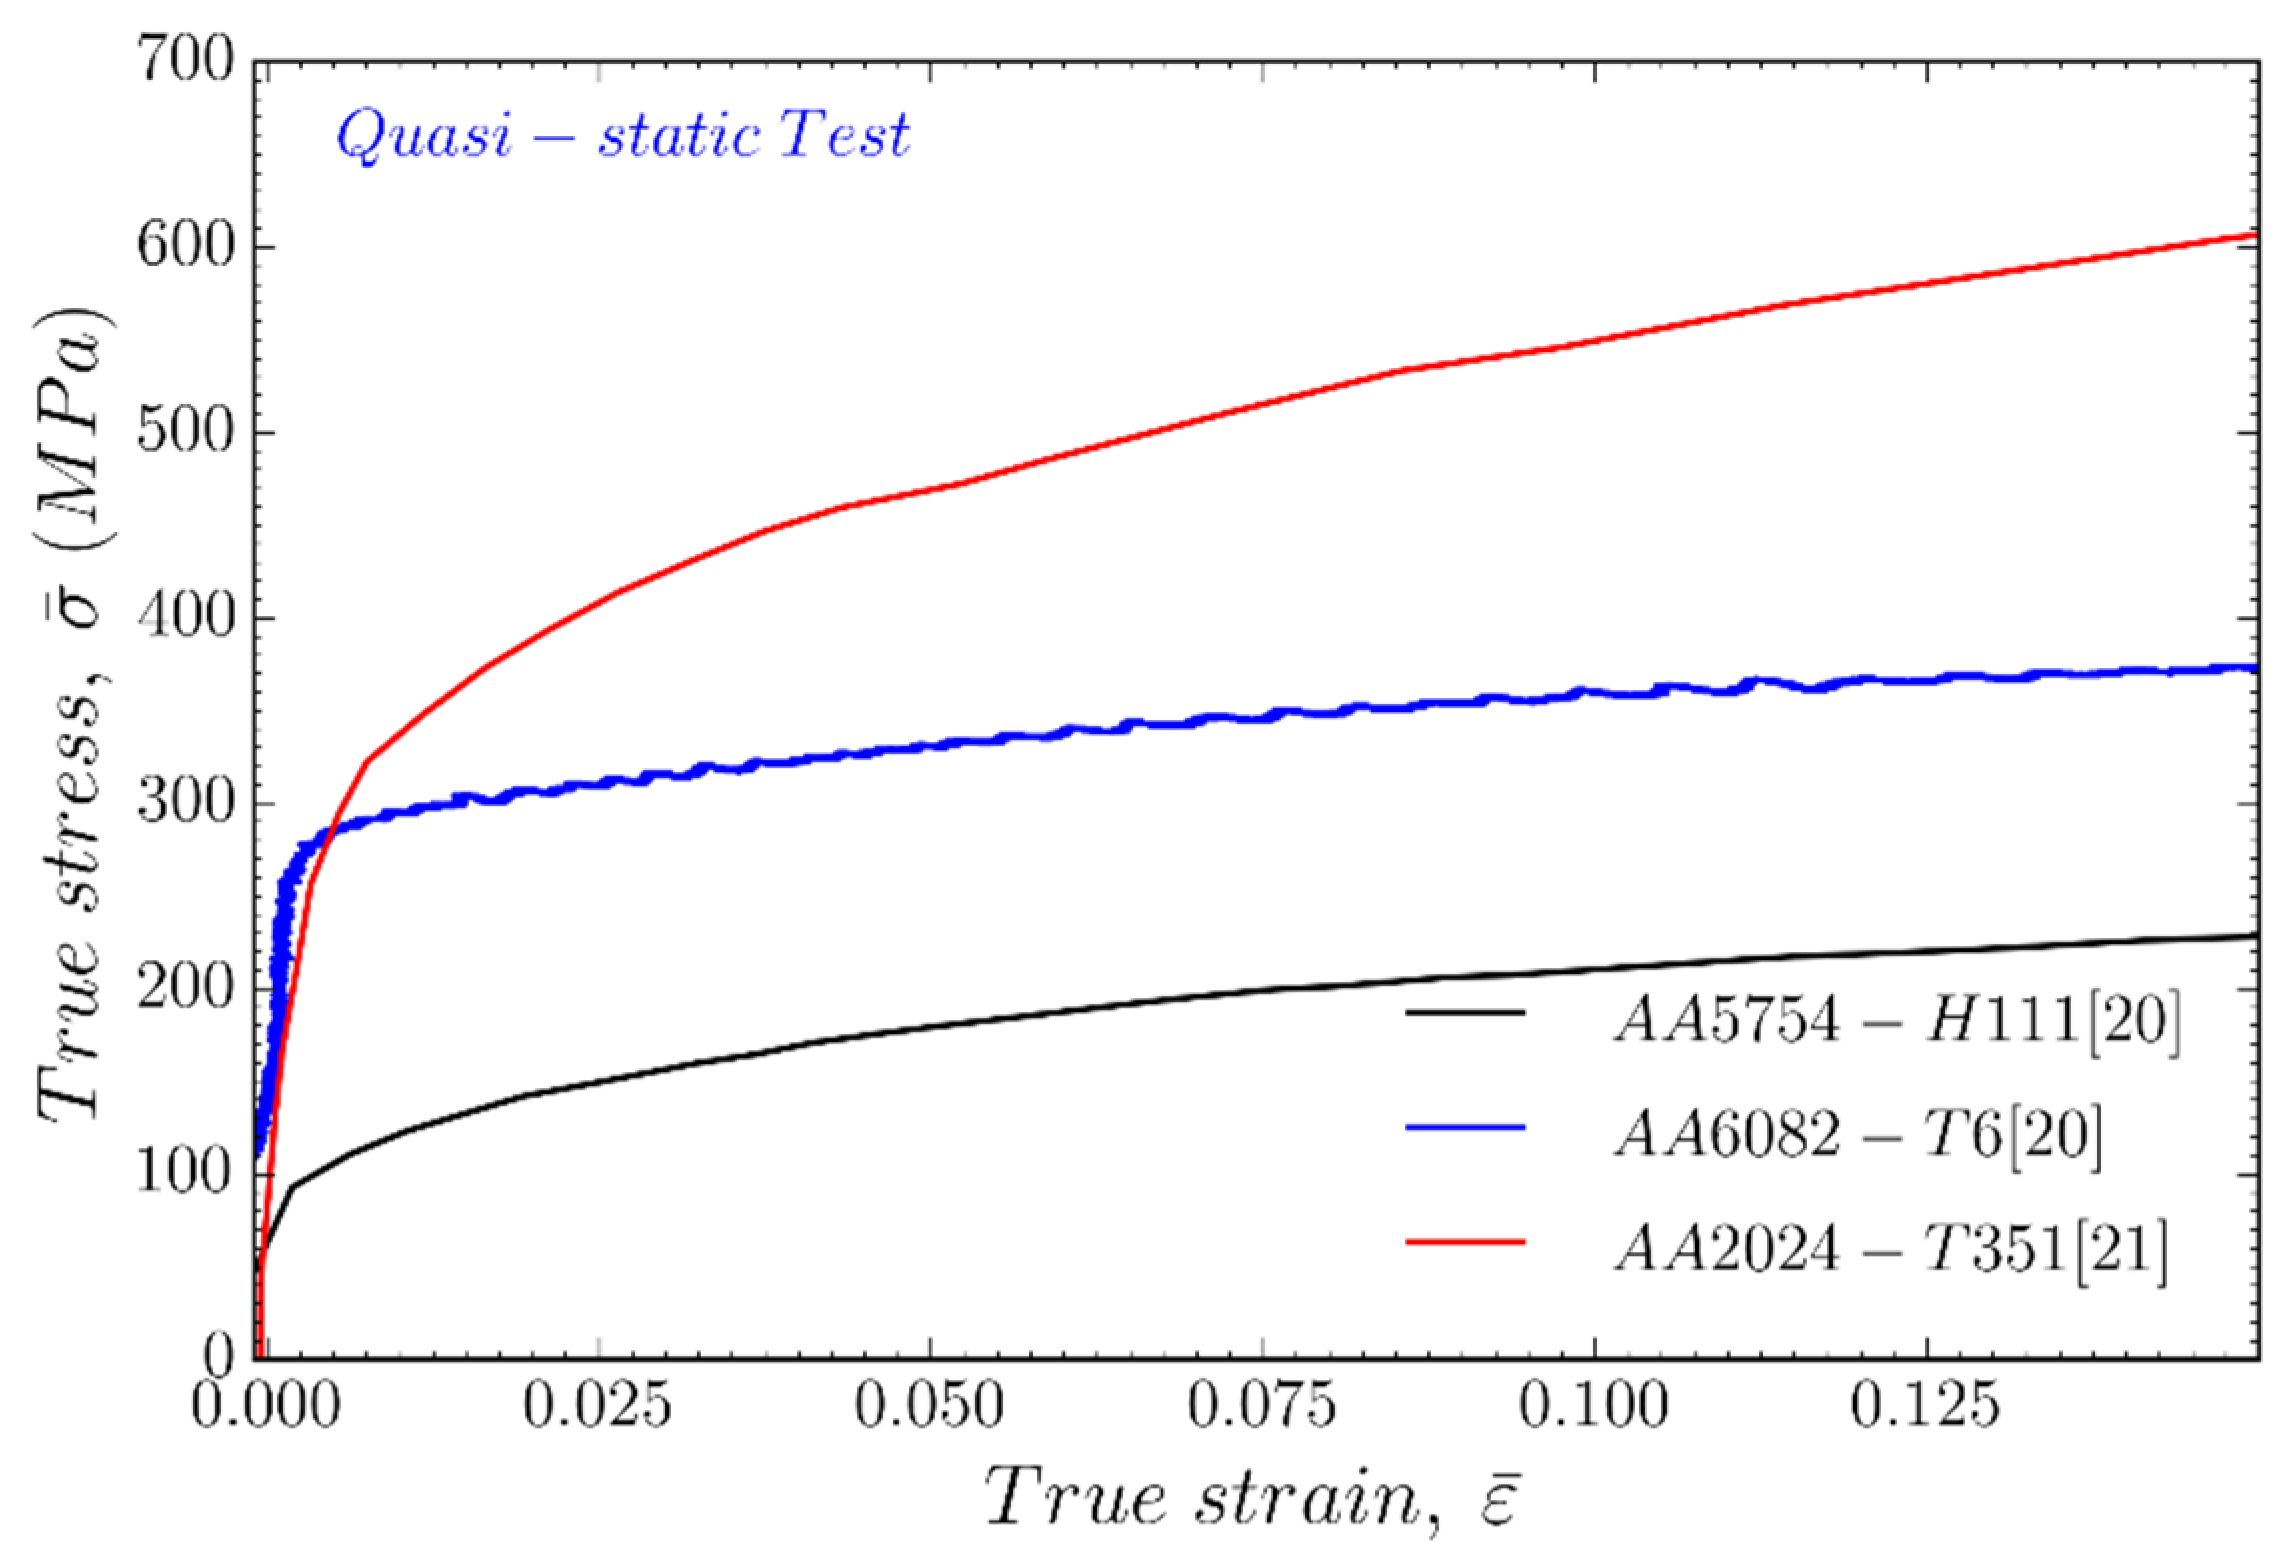
Representative quasi-static stress-strain curves are shown in Figure 2 in order to illustrate the differences in three different aluminum alloys.
3. Combined Tension-Torsion Tests
An experimental-numerical methodology, based on Barsoum and Faleskog work for Weldox steel [1], has been implemented for the aluminum alloys. The double notched tube (DNT) specimen allows for achieving low-stress triaxiality and a range of Lode parameter in combined tension and torsion. The failure locus has been constructed as a function of stress triaxiality and the third invariant of the stress deviator, confirming the combined void-shear nature of the failure. This methodology has been successfully developed on AA 2024-T351 in a previous work [17].
3.1. Experimental Methodology
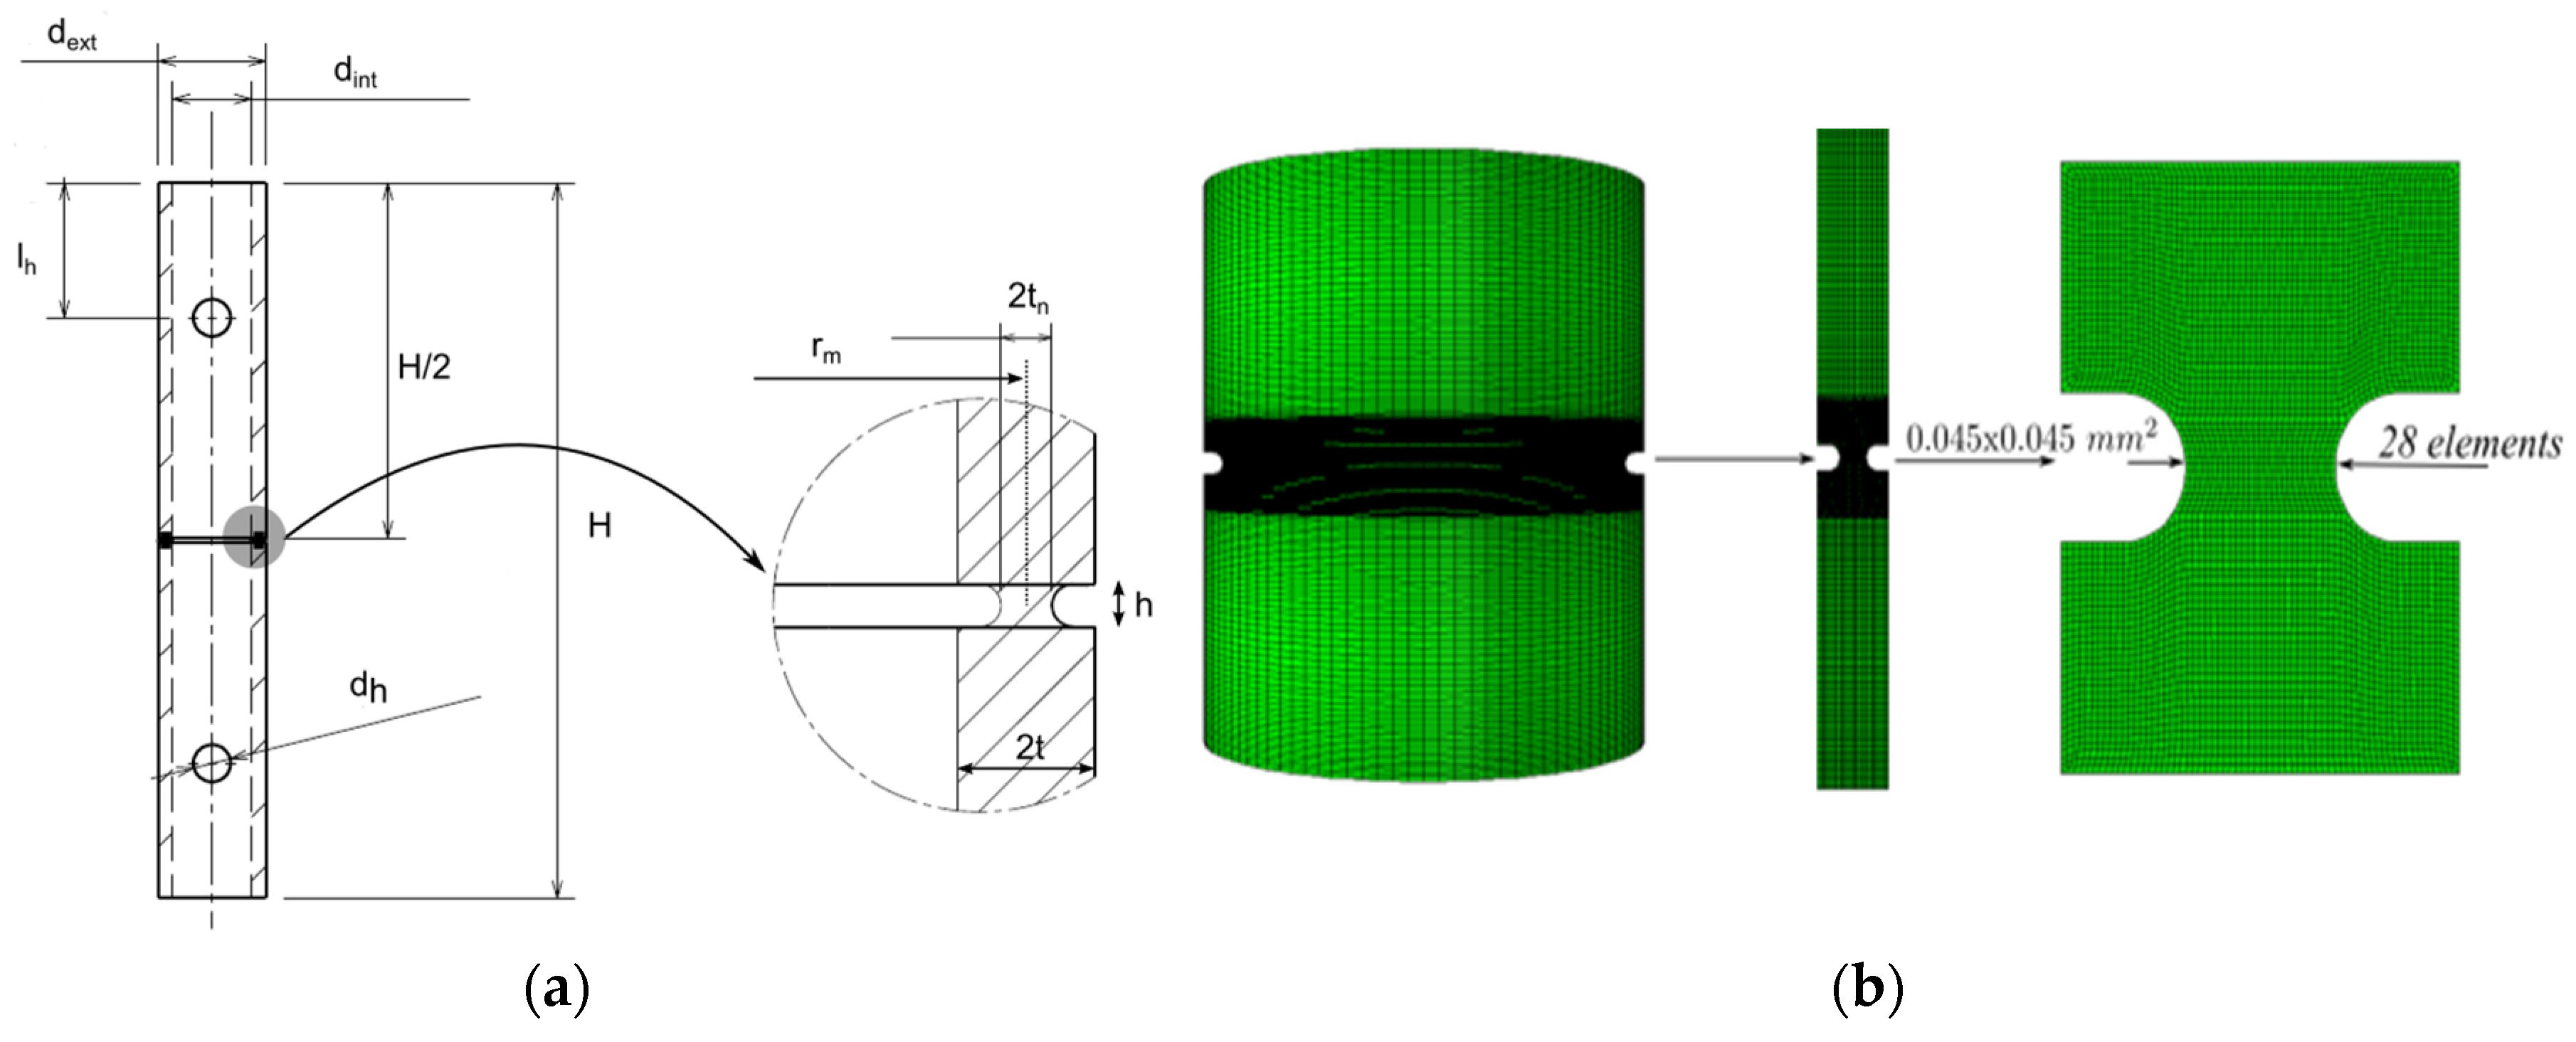
The geometry of the double notched tube (DNT) performed is based on the specimen used by Barsoum and Faleskog (Figure 3a). The dimensions of the DNT specimen are height of H = 160 mm, exterior diameter of dext = 24 mm, radius to the center of the notch of rm = 10.4 mm and internal diameter of the tube of dint = 17.6 mm. Therefore, the net section thickness at the notch is tn = 1.2 mm and the notch height h = 1.0 mm. The tensile force N and the torsional moment M are applied at the end of the specimen, and the other end is clamped. The combined loading experiments are conducted using a Servosis ME-402 machine that was modified to achieve the combination of tensile force N and torsional moment M simultaneously, defined by the loading parameter κ as
Both axial displacement and the rotation angle near the notch were monitored by Epsilon Technology’s 3550HT axial/torsional extensometer (Epsilon Technology Corp, Jackson, WY, USA).
3.2. Numerical Methodology
Due to the complexity of the study of the stress triaxiality, Lode parameter, and equivalent plastic strain at failure by experimental techniques, we follow here a numerical methodology to overcome the measurement of internal stresses in the specimen during the deformation process. To this end, a finite element model of the tension–torsion test is developed using Abaqus (6.14, Dassault Systèmes, Vélizy-Villacoublay, France) and it is used to evaluate the stress state over the notch. The double notched tube specimen was modelled using four-node axisymmetric elements with twist (CGAX4R). The element size in the gage section of both specimens was approximately 0.045 × 0.045 mm2 to guarantee spatial convergence of the solution (see Figure 3b).
3.2.1. Thermoviscoplastic Behavior
The thermoviscoplastic mechanical behavior of the aluminum alloys is defined by the Johnson–Cook (JC) model [7]. This approach assumes linear elastic behavior until reaching a yield point that depends on strain rate () and temperature and evolves following a hardening law that also depends on the equivalent plastic deformation () (see Equation (2)). The first term of Equation (2) defines the strain hardening due to plastic deformation depending on the reference yield stress A and the material constants B and n. The second term accounts for strain rate sensitivity through the material parameter C and the reference strain rate . Regarding the third term, it captures the thermal softening of the material by the thermal sensitivity parameter m.
The thermal-related term Θ depends on the current temperature T, the melting temperature Tm and a reference temperature T0 as:
In addition, the numerical model implemented in this work takes into account the temperature evolution due to heat equation assuming adiabatic conditions. This evolution is computed along the deformation process through the expression:
The Taylor–Quinney coefficient that defines the percentage of plastic work converted into heat was taken equal to β = 0.9 [18]. Although recent studies have shown that the Taylor–Quinney coefficient depends on strain rate and, therefore, is not constant [19], we consider it constant, as generally done in the literature. The density of the material is denoted by and is the specific heat at constant pressure. The constants of the Johnson–Cook model for aluminum alloys have been obtained from recent works by the authors [20,21] and are provided in Table 2 with other physical properties.
3.2.2. Failure Behavior
The numerical model presented here is developed to identify the stress state in the combined tension–torsion tests and to understand the failure mechanisms associated. To this end, the Bai–Wierzbicki (BW) failure model is defined to take into account for the stress triaxiality and the Lode angle through:
Several authors [22,23,24,25,26] have assumed a symmetric failure criterion concerning the Lode parameter. Therefore, Equation (5) is reduced to:
where are failure constants depending on the material modelled. These parameters can be obtained from tension–torsion experimental data (see Section 3.3) by using lease square method in MATLAB (R2017a, MathWorks, Natick, MA, USA) and, therefore, generating the failure surface from the existing points. The values of for the aluminum alloys considered are summarised in Table 3.
3.3. Results
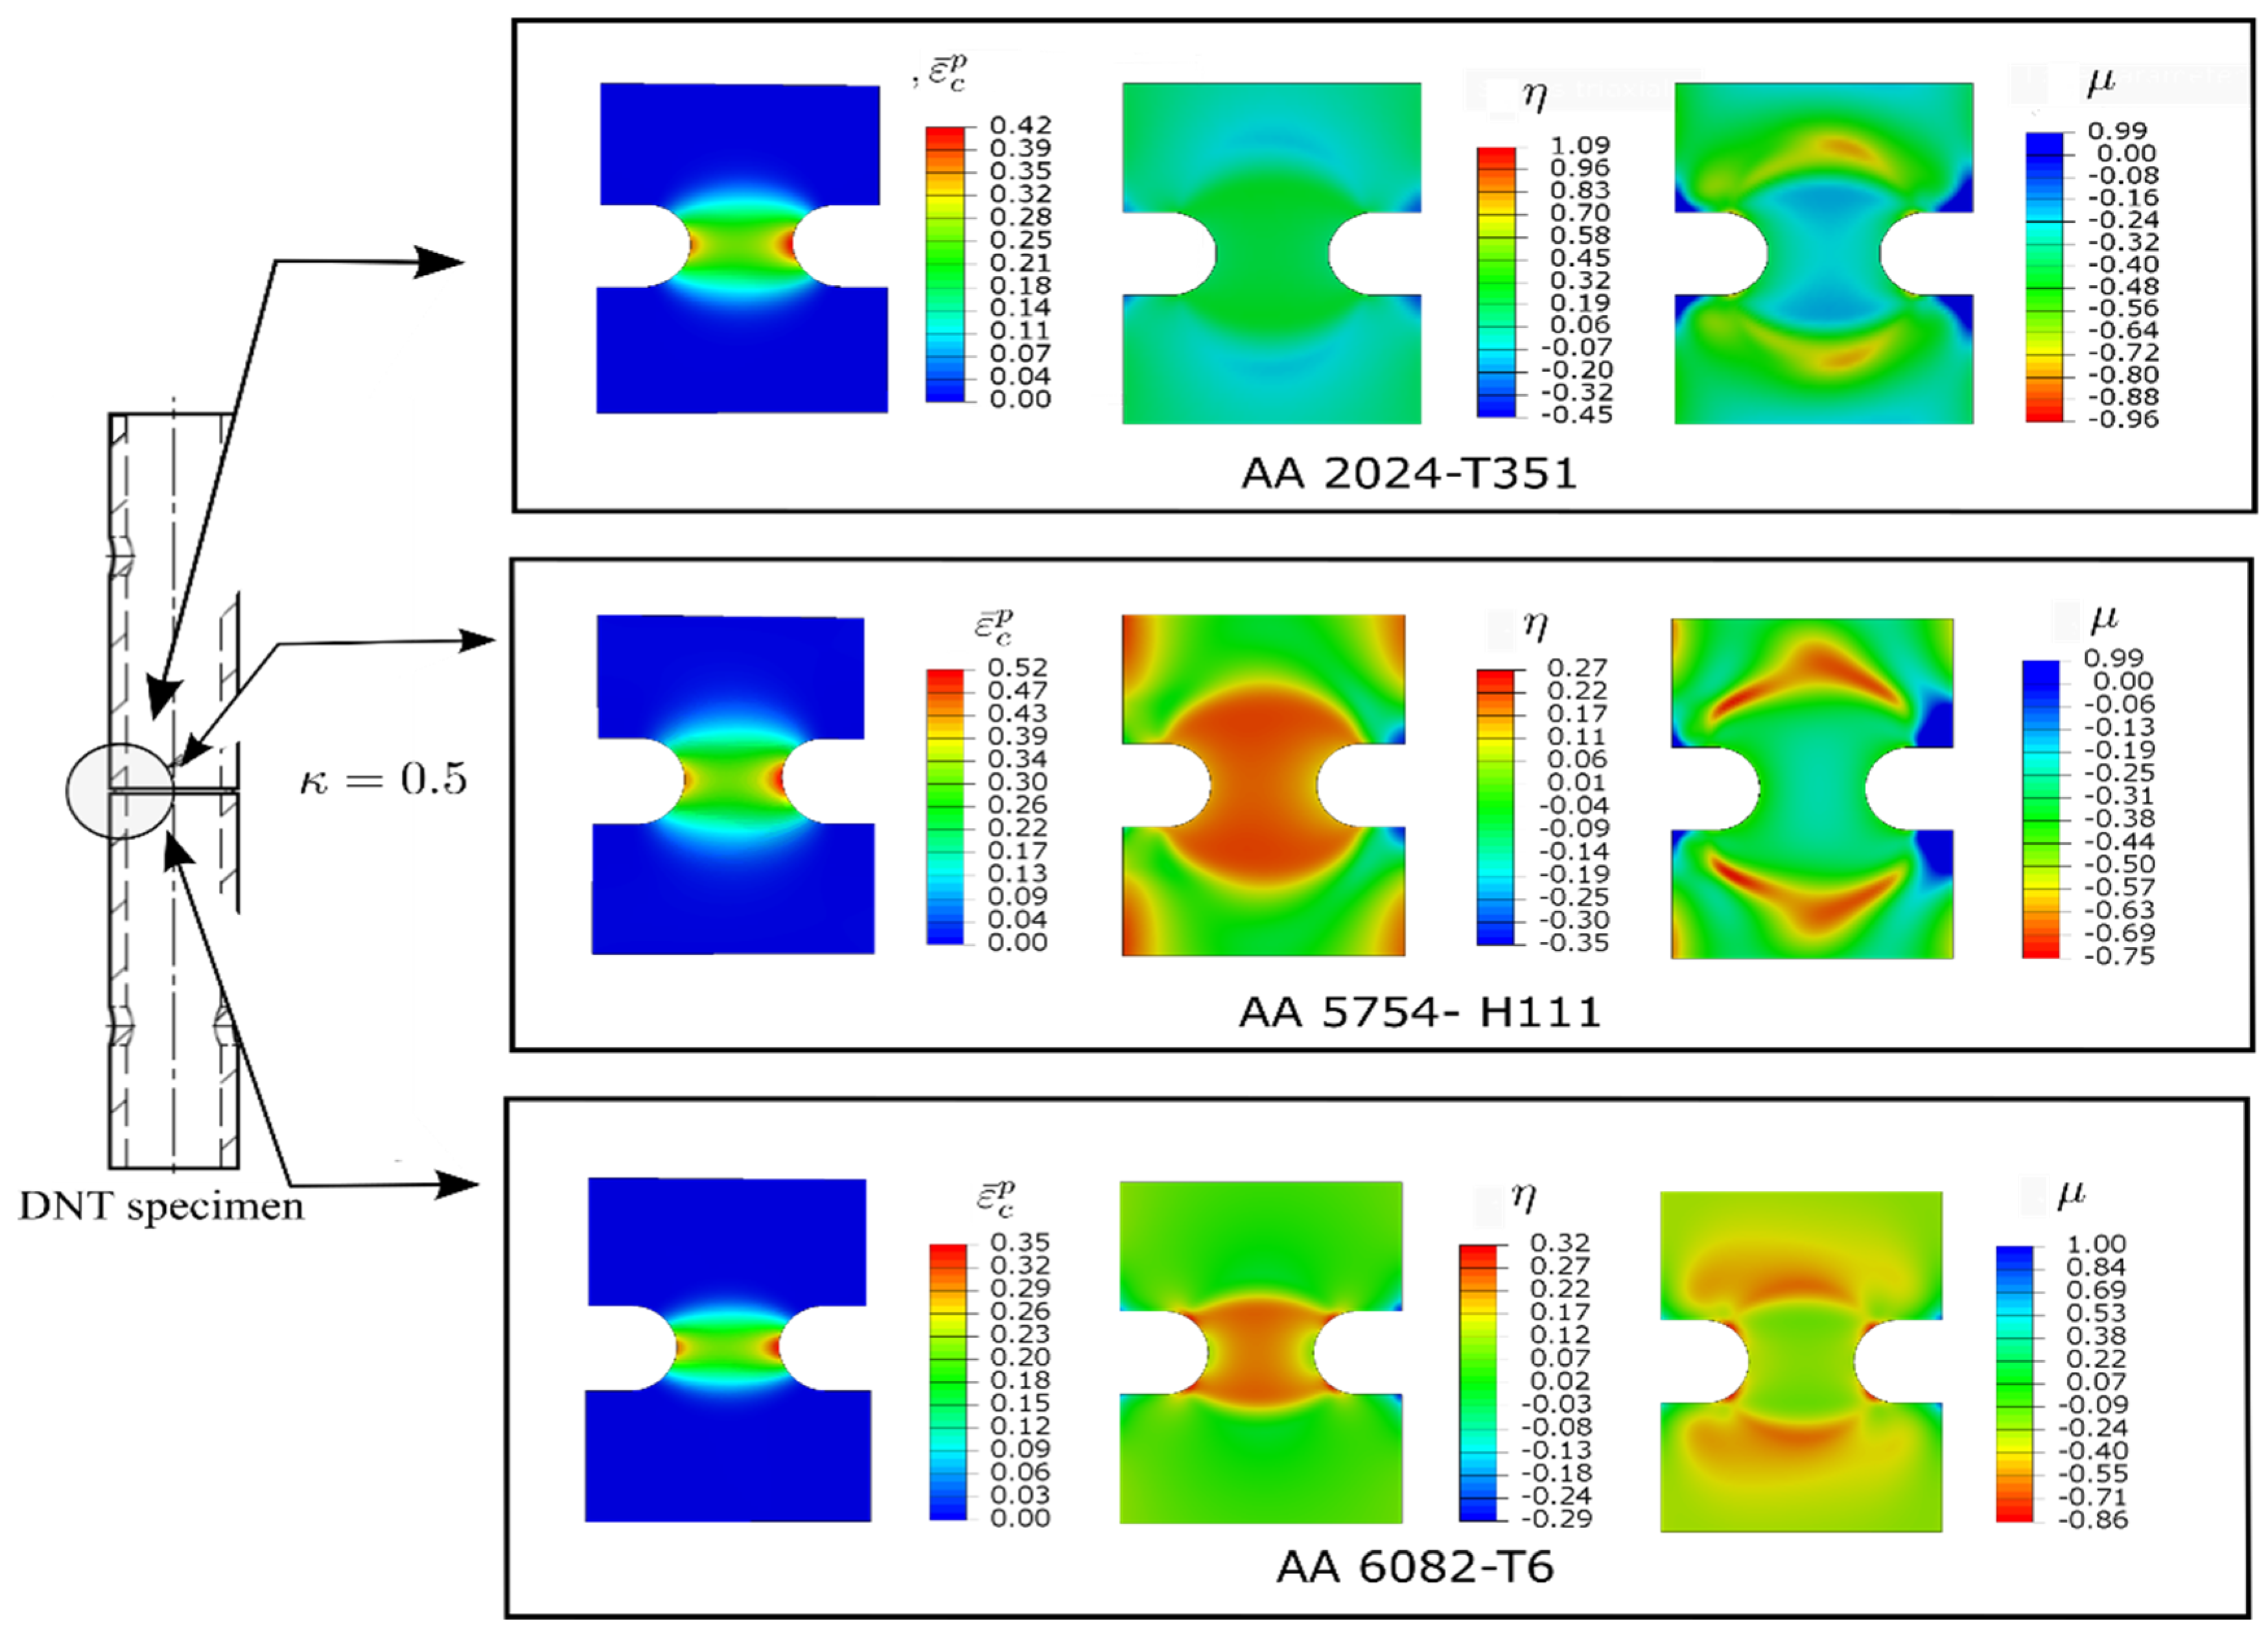
The experimental results on DNT specimens provide adequate values of displacement and rotation in the gage section. The test is strongly stable in displacement–rotation control, and failure occurs close to the middle of the gage section. The numerical results provide values of stress triaxiality from 0 to 1.2 and values of Lode parameter from −1 to 0. Figure 4 shows the localization of the plastic strain , maximum stress triaxiality η, and the maximum Lode parameter µ, in the notched region. This behavior is in agreement with the numerical results published by other authors [11,27].
Figure 5 illustrates the final stage of the test for the three materials tested. Post-mortem analysis of the impacted plates reveals different failure mechanisms depending on the material tested. As the loading parameter is increased, a change in the failure mechanisms is induced (i.e., the stress state induced by for loading conditions is shear).
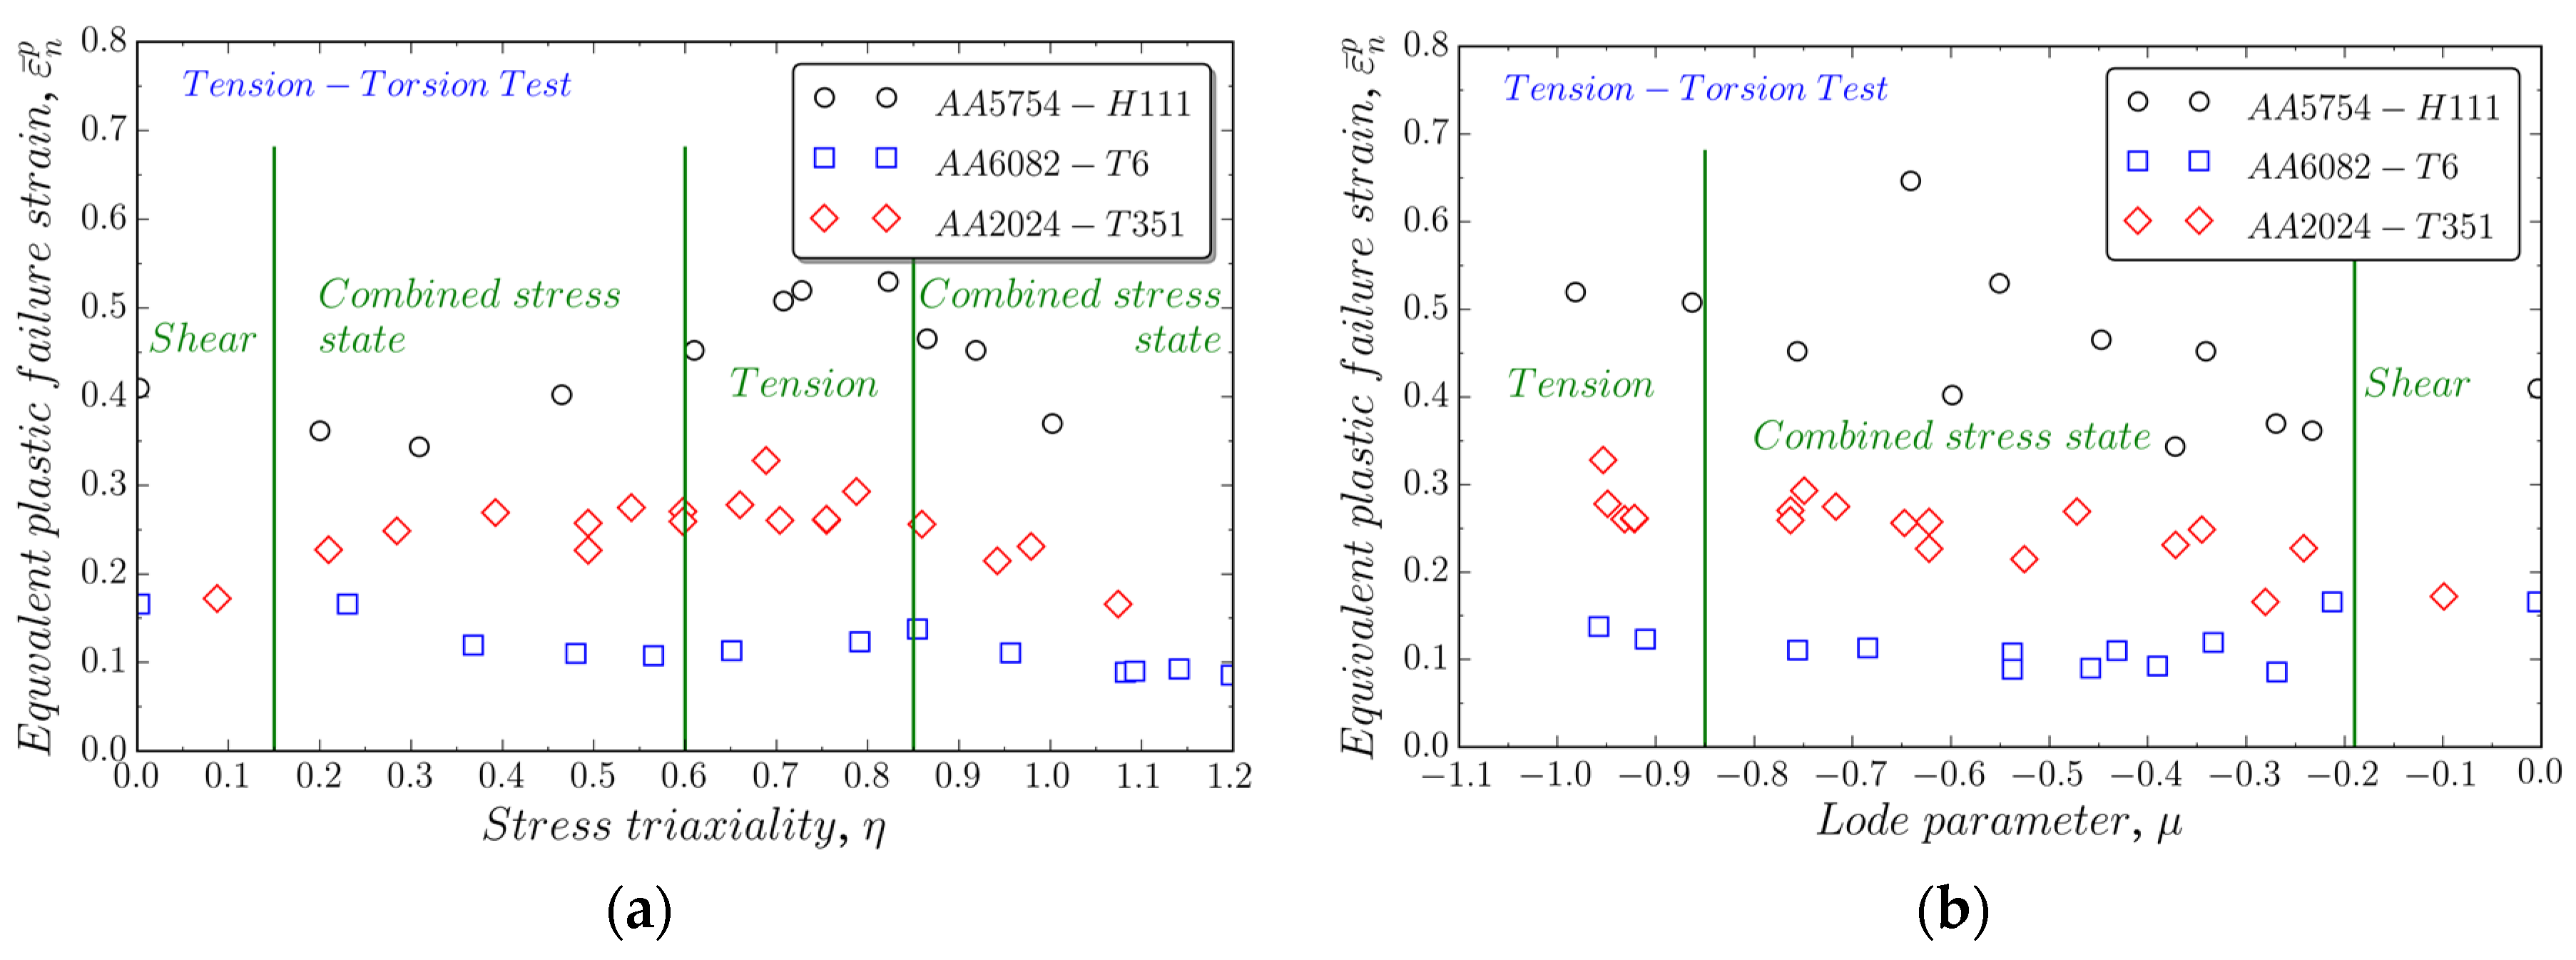
Failure locus is constructed regarding stress triaxiality and Lode parameter (Figure 6). According to the influence of the stress state, our results show that an increase in stress triaxialiaty values does not lead to a monotonically decrease in the effective plastic failure strain values. The effective plastic strain increases with the stress triaxiality up to a threshold value of µ ~ 0.68, from which begins to decrease for AA 2024-T351. However, the threshold stress triaxiality for AA 5754-H111 is µ ~ 0.8. This effect can be explained by the influence of the third invariant (Lode parameter). The transition in the rupture mechanism has also been observed for ductile steel [28]. For high-stress triaxiality values the predominant failure mechanism is governed by void growth and coalescence, and as the stress triaxiality decreases, the failure seems to change into shearing between voids. This behavior is not observed for metal presenting weak dependency on Lode parameter, as 5083-H116 aluminum alloy [22] or DH36 steel [29], where equivalent plastic strain decreases with increasing triaxiality without any change of failure mechanism.
The aluminum alloy with the highest failure deformation in quasi-static conditions is the 5xxx, 5754-H111 series, followed by AA 2024-T351, and the least ductile is AA6082-T6. Moreover, both the Lode parameter and the stress triaxiality are observed to influence the failure of the AA2024-T351 and AA5754-H111 alloys: the maximum failure strain is produced for tensile stress states. However, for the AA 6082-T6, there is not significant influence of the Lode parameter on the failure strain, being the shear states where a higher failure strain is found, as shown by Zhou [30].
From experimental studies [20,21], the following features of the alloys used in this work can be stated: AA 5754-H111 has low strength/moderate hardening, AA 6082-T6 has moderate strength/low hardening, and AA 2024-T351 has the high strength/high hardening. Barsoum et al. [10] concluded that the sensitivity to the Lode parameter increases with higher material yield strength accompanied with a decrease in hardening. However, for the aluminum alloys studied, higher differences of Lode parameter and stress triaxiality are found in moderate/high hardening materials.
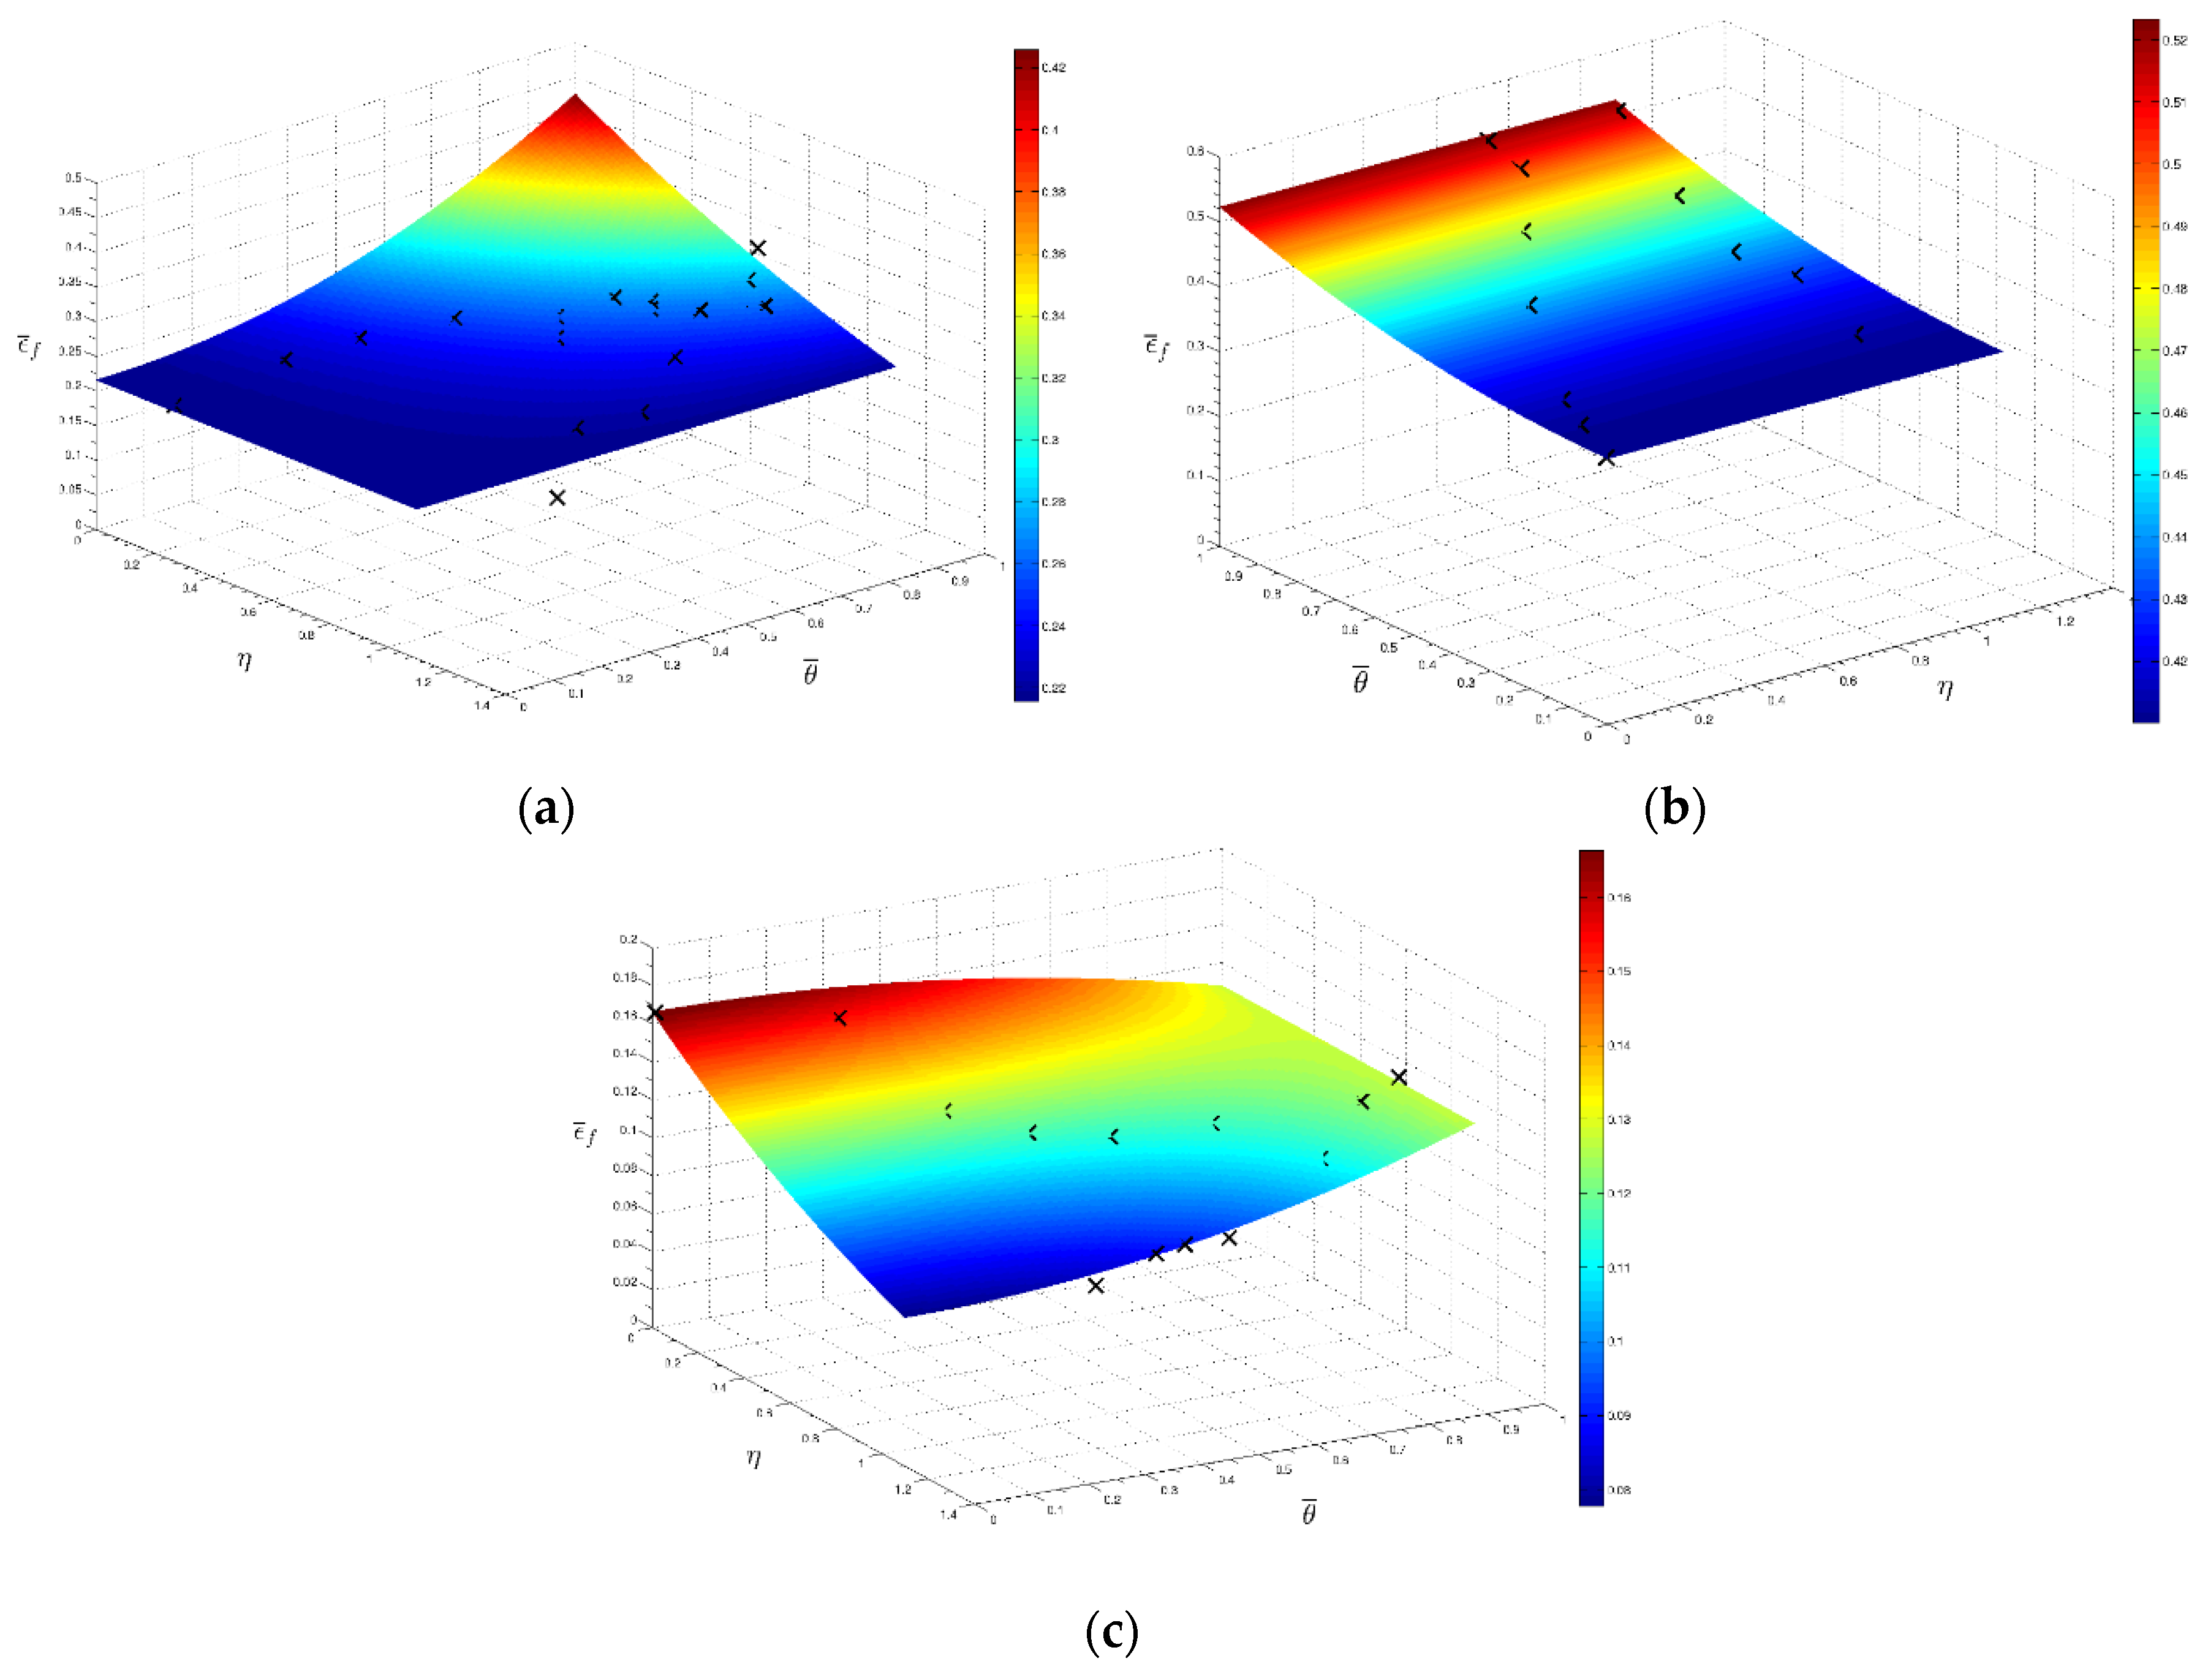
The 3D plot of the influence of the stress triaxiality and the Lode parameter on the failure strain is shown in Figure 7. The effect of the Lode parameter is negligible at high triaxiality values. The results presented in this work follow similar trends than the results published by other authors [31].
4. Perforation Tests
4.1. Experimental Methodology
In order to further analyze the influence of the stress state on the mechanical behavior and failure of aluminum alloys in more complex scenarios, we perform perforation tests at high impact velocities.
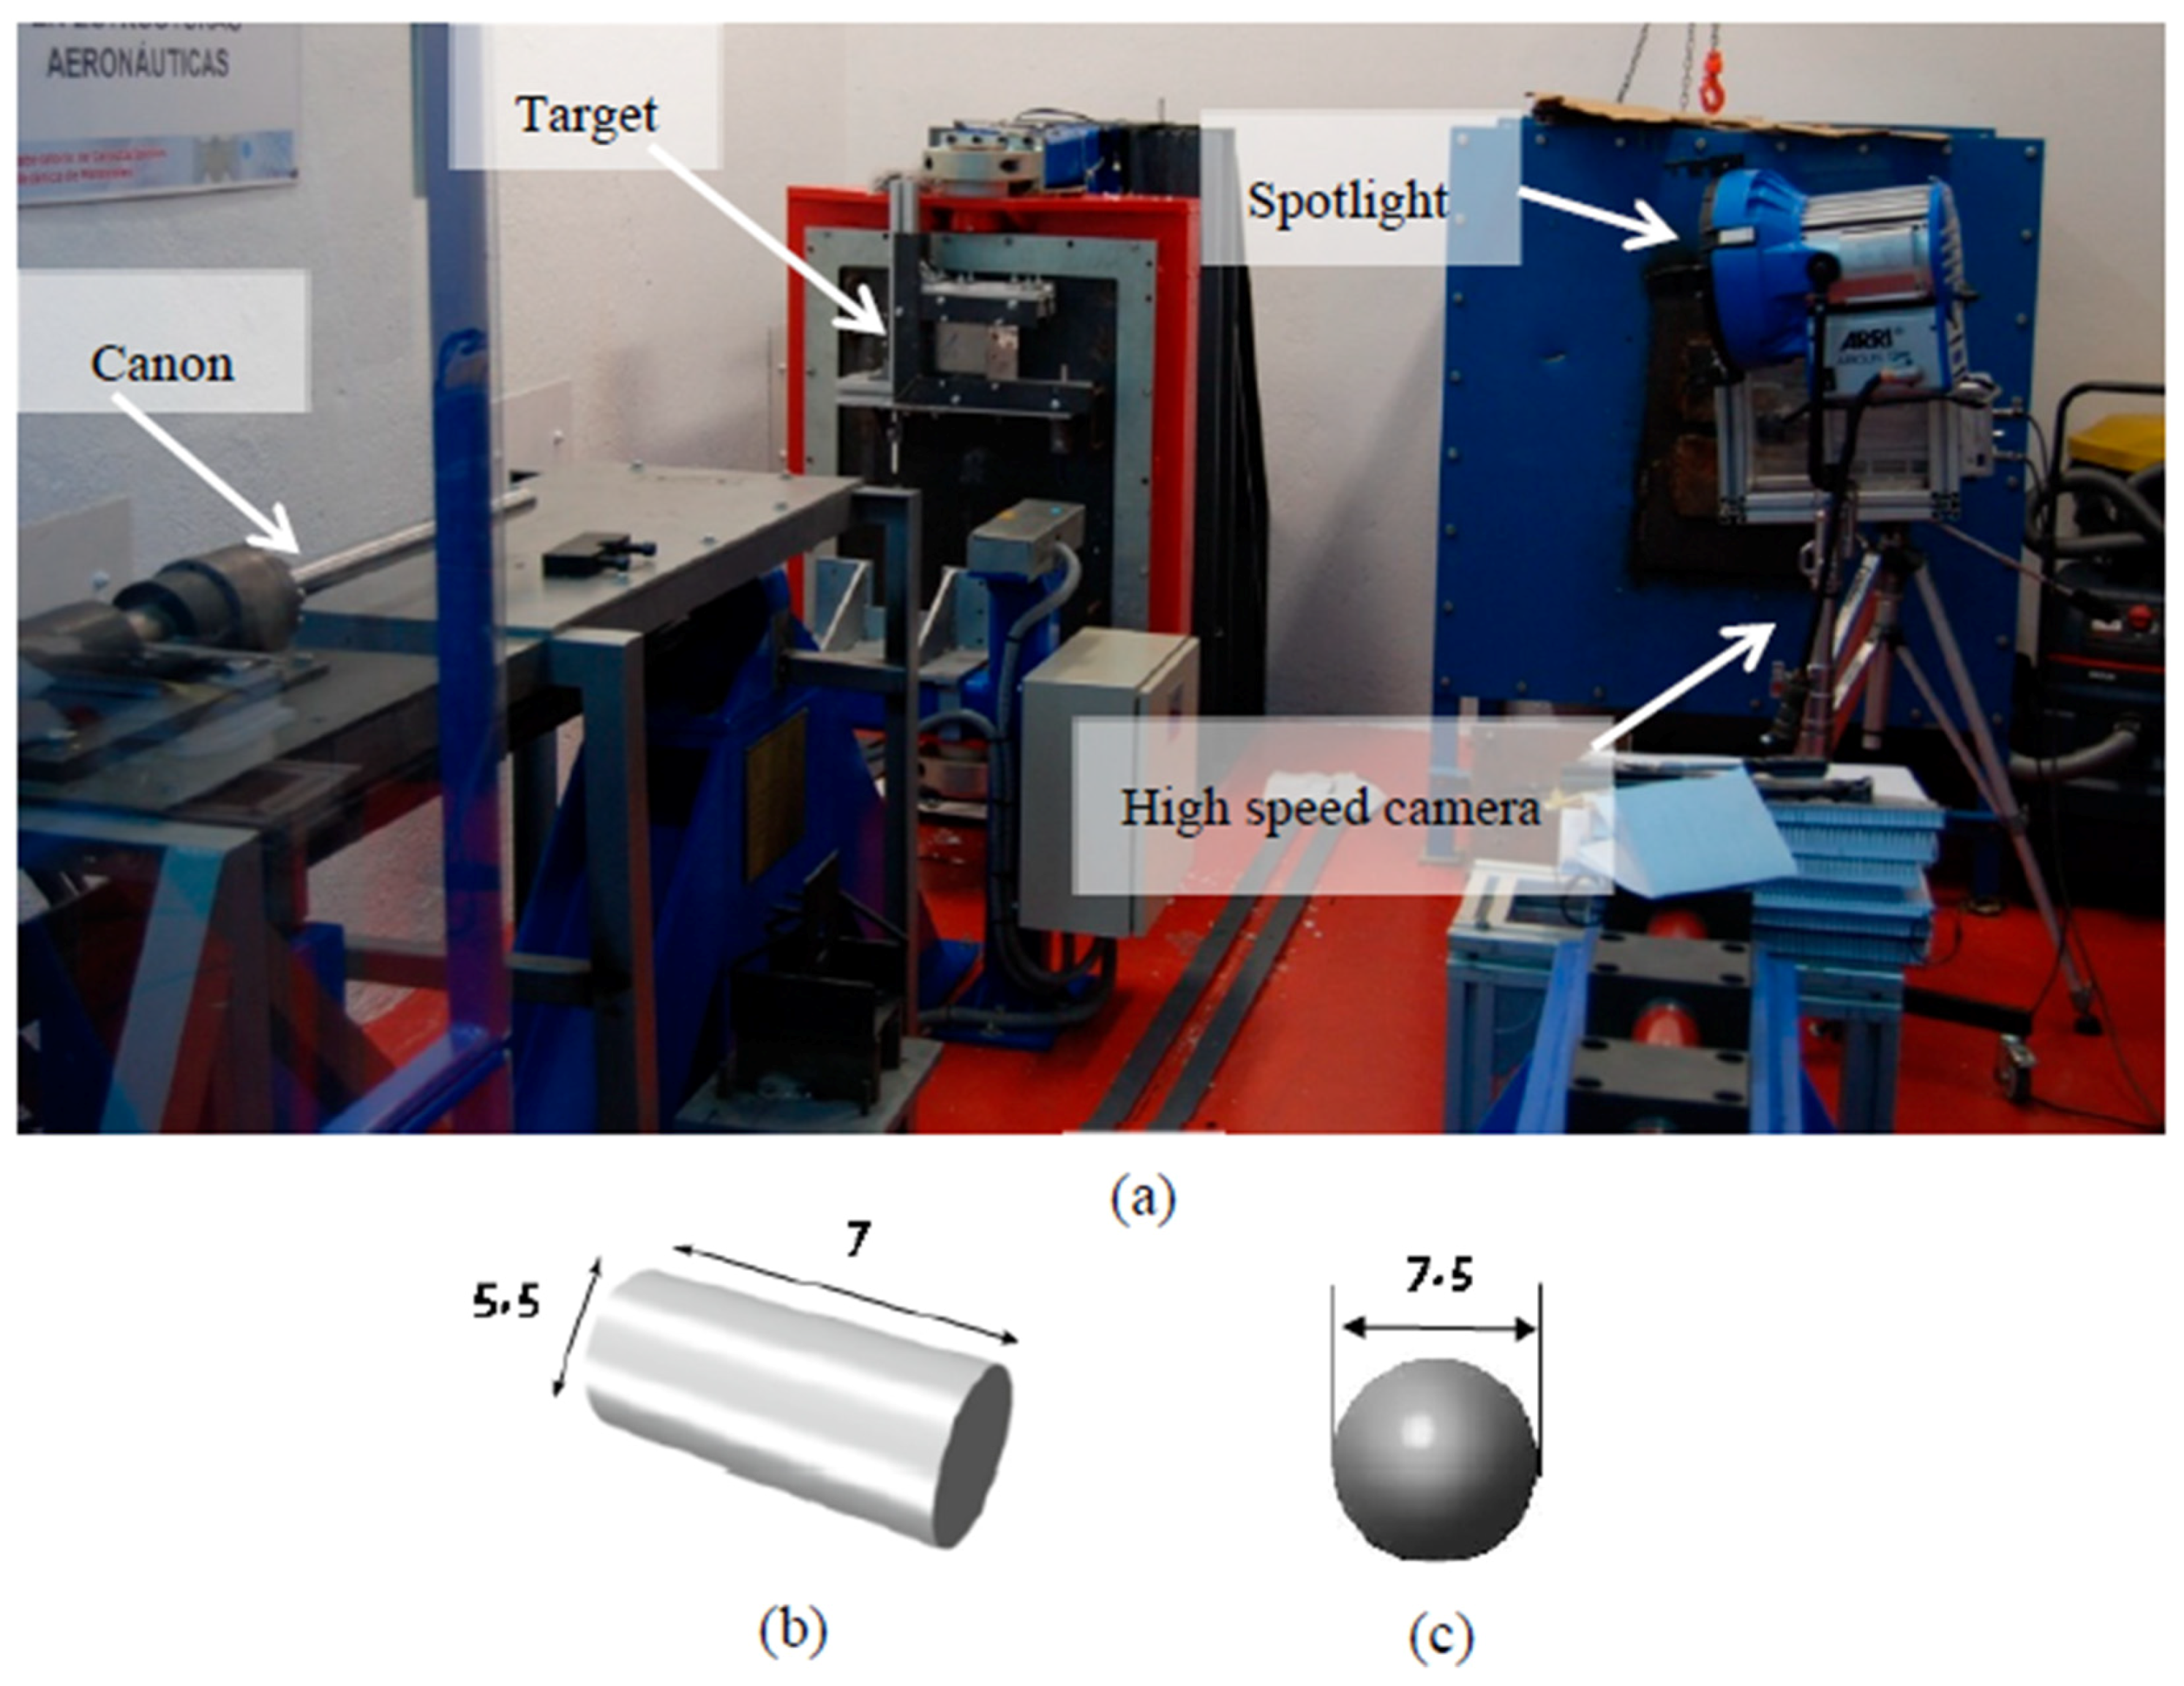
Perforation tests are commonly used for the analysis of failure of ductile materials involving high deformation rates and temperatures effects [21,32,33]. Experimental tests are conducted on aluminum plates using a pneumatic 7.62 mm caliber gas gun barrel to launch blunt projectiles of mass 1.1 g and spherical steel projectiles of mass 1.7 g at pressures up to 6 bars, to impel the composite fragment rough a 1.5 m long barrel, Figure 8. A special sabot, made of PLA, was developed to hold the blunt projectiles during the trajectory. The impact velocities applied in these experiments cover a wide range of 70 m/s < V0 < 500 m/s. It should be noted that, for all the tests performed, the projectiles showed an absence of plastic straining, damage or erosion after the impact.
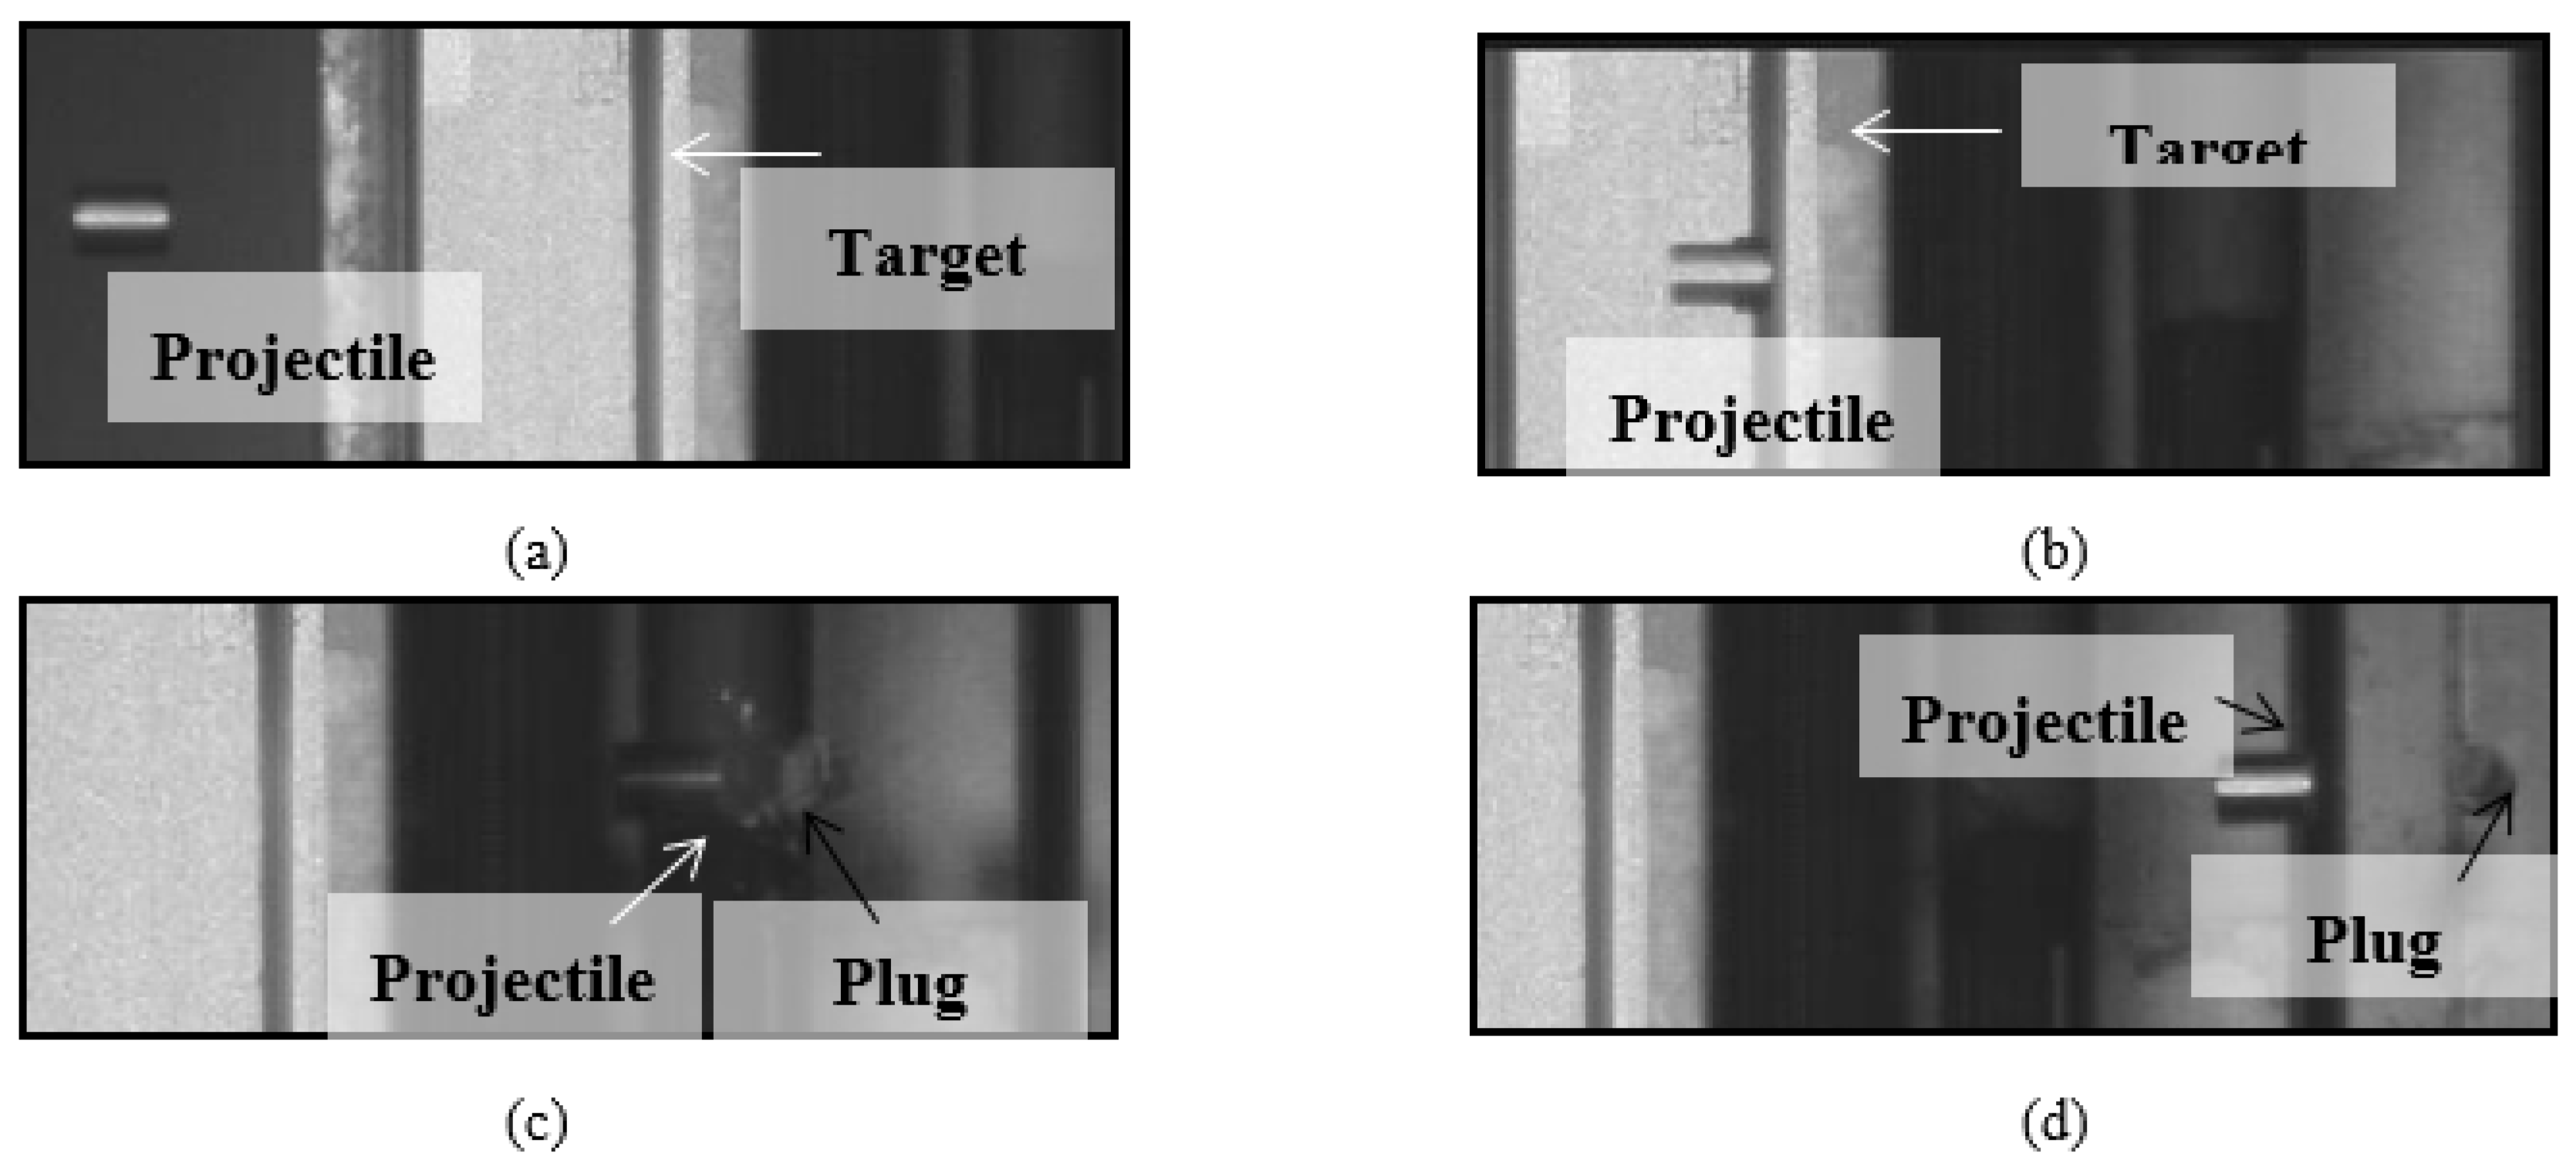
The specimens are clamped in the front and back sides of the outline of the plate; sliding effects are not observed during the test. A Photron FastCam SA-Z digital high-speed camera (Photron USA, Inc., San Diego, USA) is used to measure the impact and residual velocities when the projectiles impact and perforate the target, Figure 9. The selected frame rate (28,000 frames per second, fps) and the resolution 1024 × 744 pixels are chosen based on early testing, allowing a proper focus on the images. The high-speed camera is placed perpendicularly to the impact allowing for capturing both the entrance and the exit of the projectile from the same angle.
The projectiles are made of maraging steel with a heat treatment to reach yield stress close to . Their geometries and dimensions are shown in Figure 8b,c.
4.2. Numerical Methodology
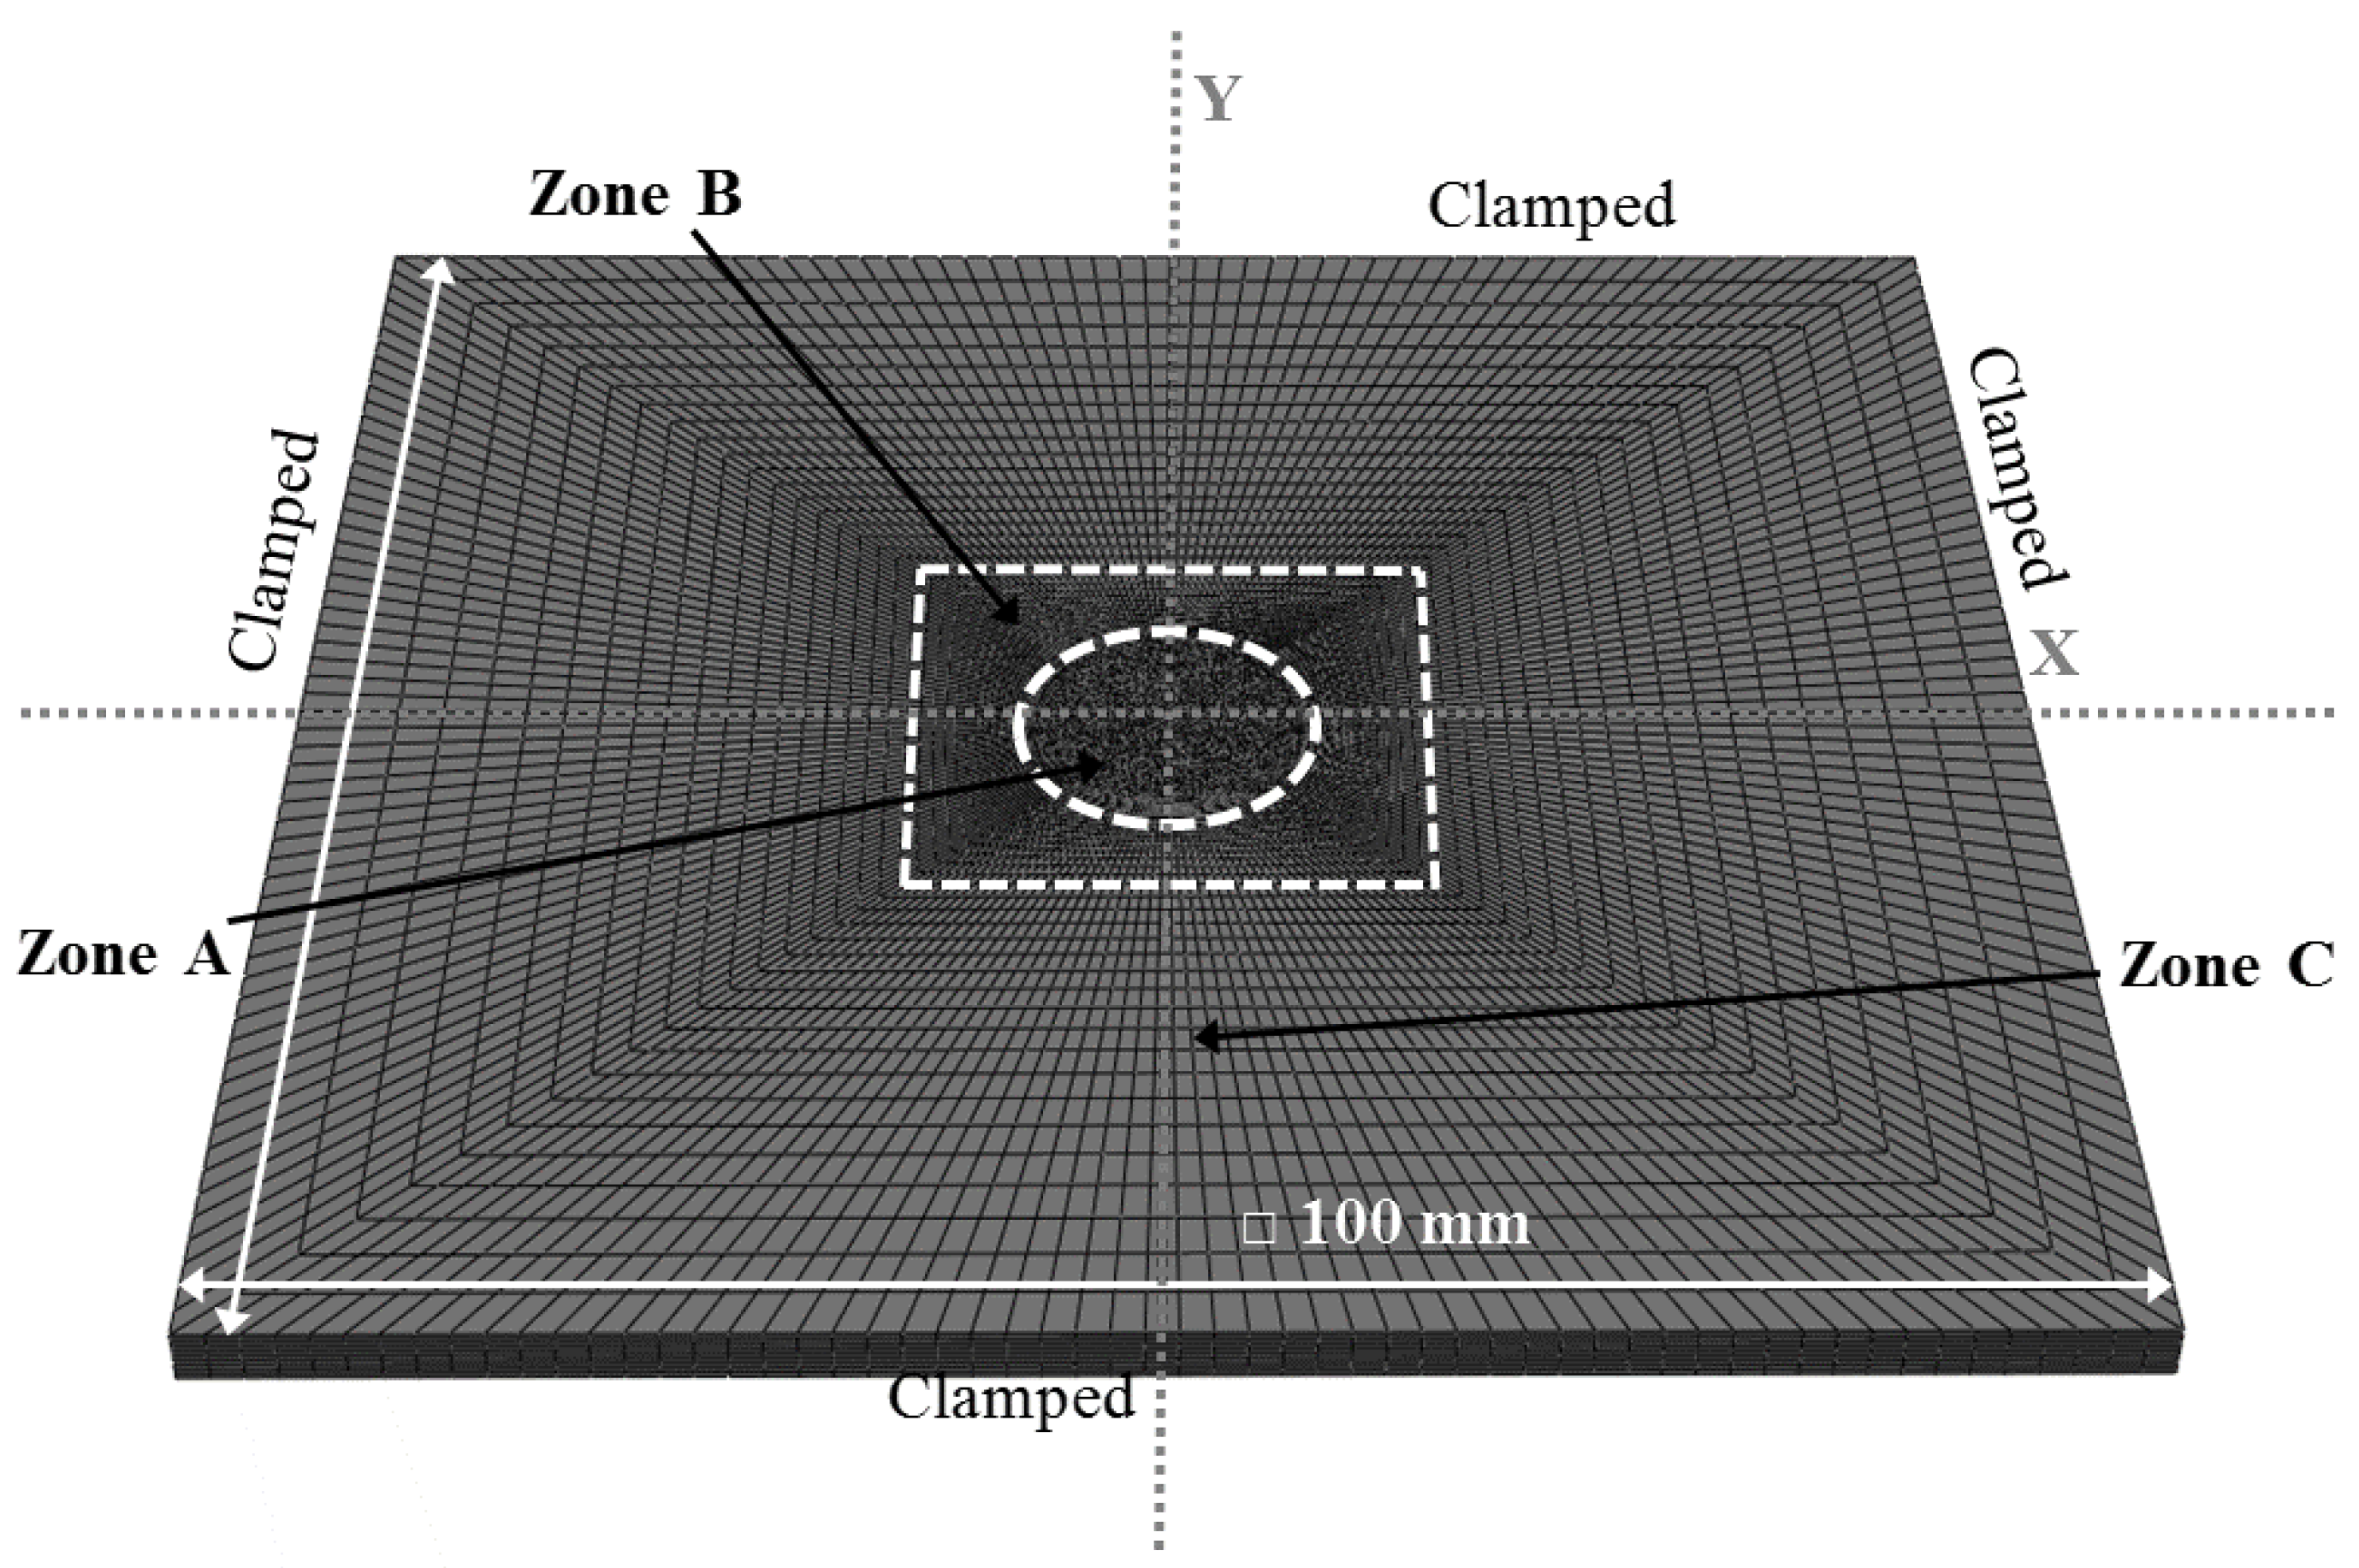
The numerical simulations of the impact problem are carried out using the commercial software Abaqus/Explicit. The geometry of the target and projectiles is the same as used in experiments. The mesh of the target plate includes a total number of 264,100 nodes and 242,500 elements (C3D8R in Abaqus notation), see Figure 10. A total number of 12 elements are defined along the thickness as recommended by Rodríguez-Martínez and co-authors [34]. This mesh has been used in a previous work, more details can be found in Rodriguez-Millan et al. [21].
4.2.1. Thermoviscoplastic Behavior
The thermoviscoplastic material behavior of the plate is defined using the Johnson–Cook model described in Section 3.2.1.
4.2.2. Failure Behavior
Three different failure criteria are used: single failure model based on a critical plastic deformation threshold; Johnson–Cook failure model [7]; and Bai–Wierzbicki model [23,24,25]. The latter is described in Equations (5) and (6), and its constants for the three aluminum alloys studied are provided in Section 3 from the tension–torsion tests. Note that the calibration on the Bai–Wierzbicki model is done with quasi-static tests and a more accurate identification of these parameters should consider potential failure dependencies on other variables such as strain rate and thermal effects due to adiabatic heating.
The first failure criterion considered is based on the consideration of a critical plastic deformation threshold (denoted in this work as C-model). This critical plastic deformation is estimated here for each combination of projectile shape and material tested by an optimization process taking into account the whole range of impact velocities. This optimization process aims at minimizing the predictive error in the residual velocity by comparison with experimental values. The final values obtained for this critical plastic deformation are summarized in Table 4 for each combination of projectile shape and material tested.
The second model used is based on the work of Johnson and Cook [7] (denoted in this work as JC model) and takes into account the dependencies of the deformation at failure on plastic strain , strain rate , temperature T, and stress triaxiality . The model is based on the following expression for damage evolution:
where D is the damage to a material element (ranging from 0, non-damage, to 1, collapse of the material), is the increment of accumulated plastic strain occurring during an integration cycle, and is the critical failure strain level. Failure is assumed when the parameter D exceeds unity. The failure strain is defined as:
where are failure constants depending on the specific material modelled. These constants are obtained from the works of Teng et al. [35] and Zhou [36,37] for AA 2024-T351 and AA6082-T6, respectively. However, the parameters for AA5754-H111 are unavailable in the literature, so the values are adjusted from the parameters of another 5xxx series alloy from [36,37]. Table 5 summarizes the values used for each material.
The projectiles are modelled with a nominal mass and a maximum diameter of 30 g and 13 mm respectively. The projectile is defined as a rigid analytical body since experimental tests revealed no plastic deformation on the projectile surface after impact. This definition allows for reducing the computational cost required in the simulations. A friction coefficient equal to 0.1 is used to define the contact between the projectiles and the plate, as done by several other authors [34,38,39,40,41].
4.3. Results
4.3.1. Experimental Results
Residual Velocity
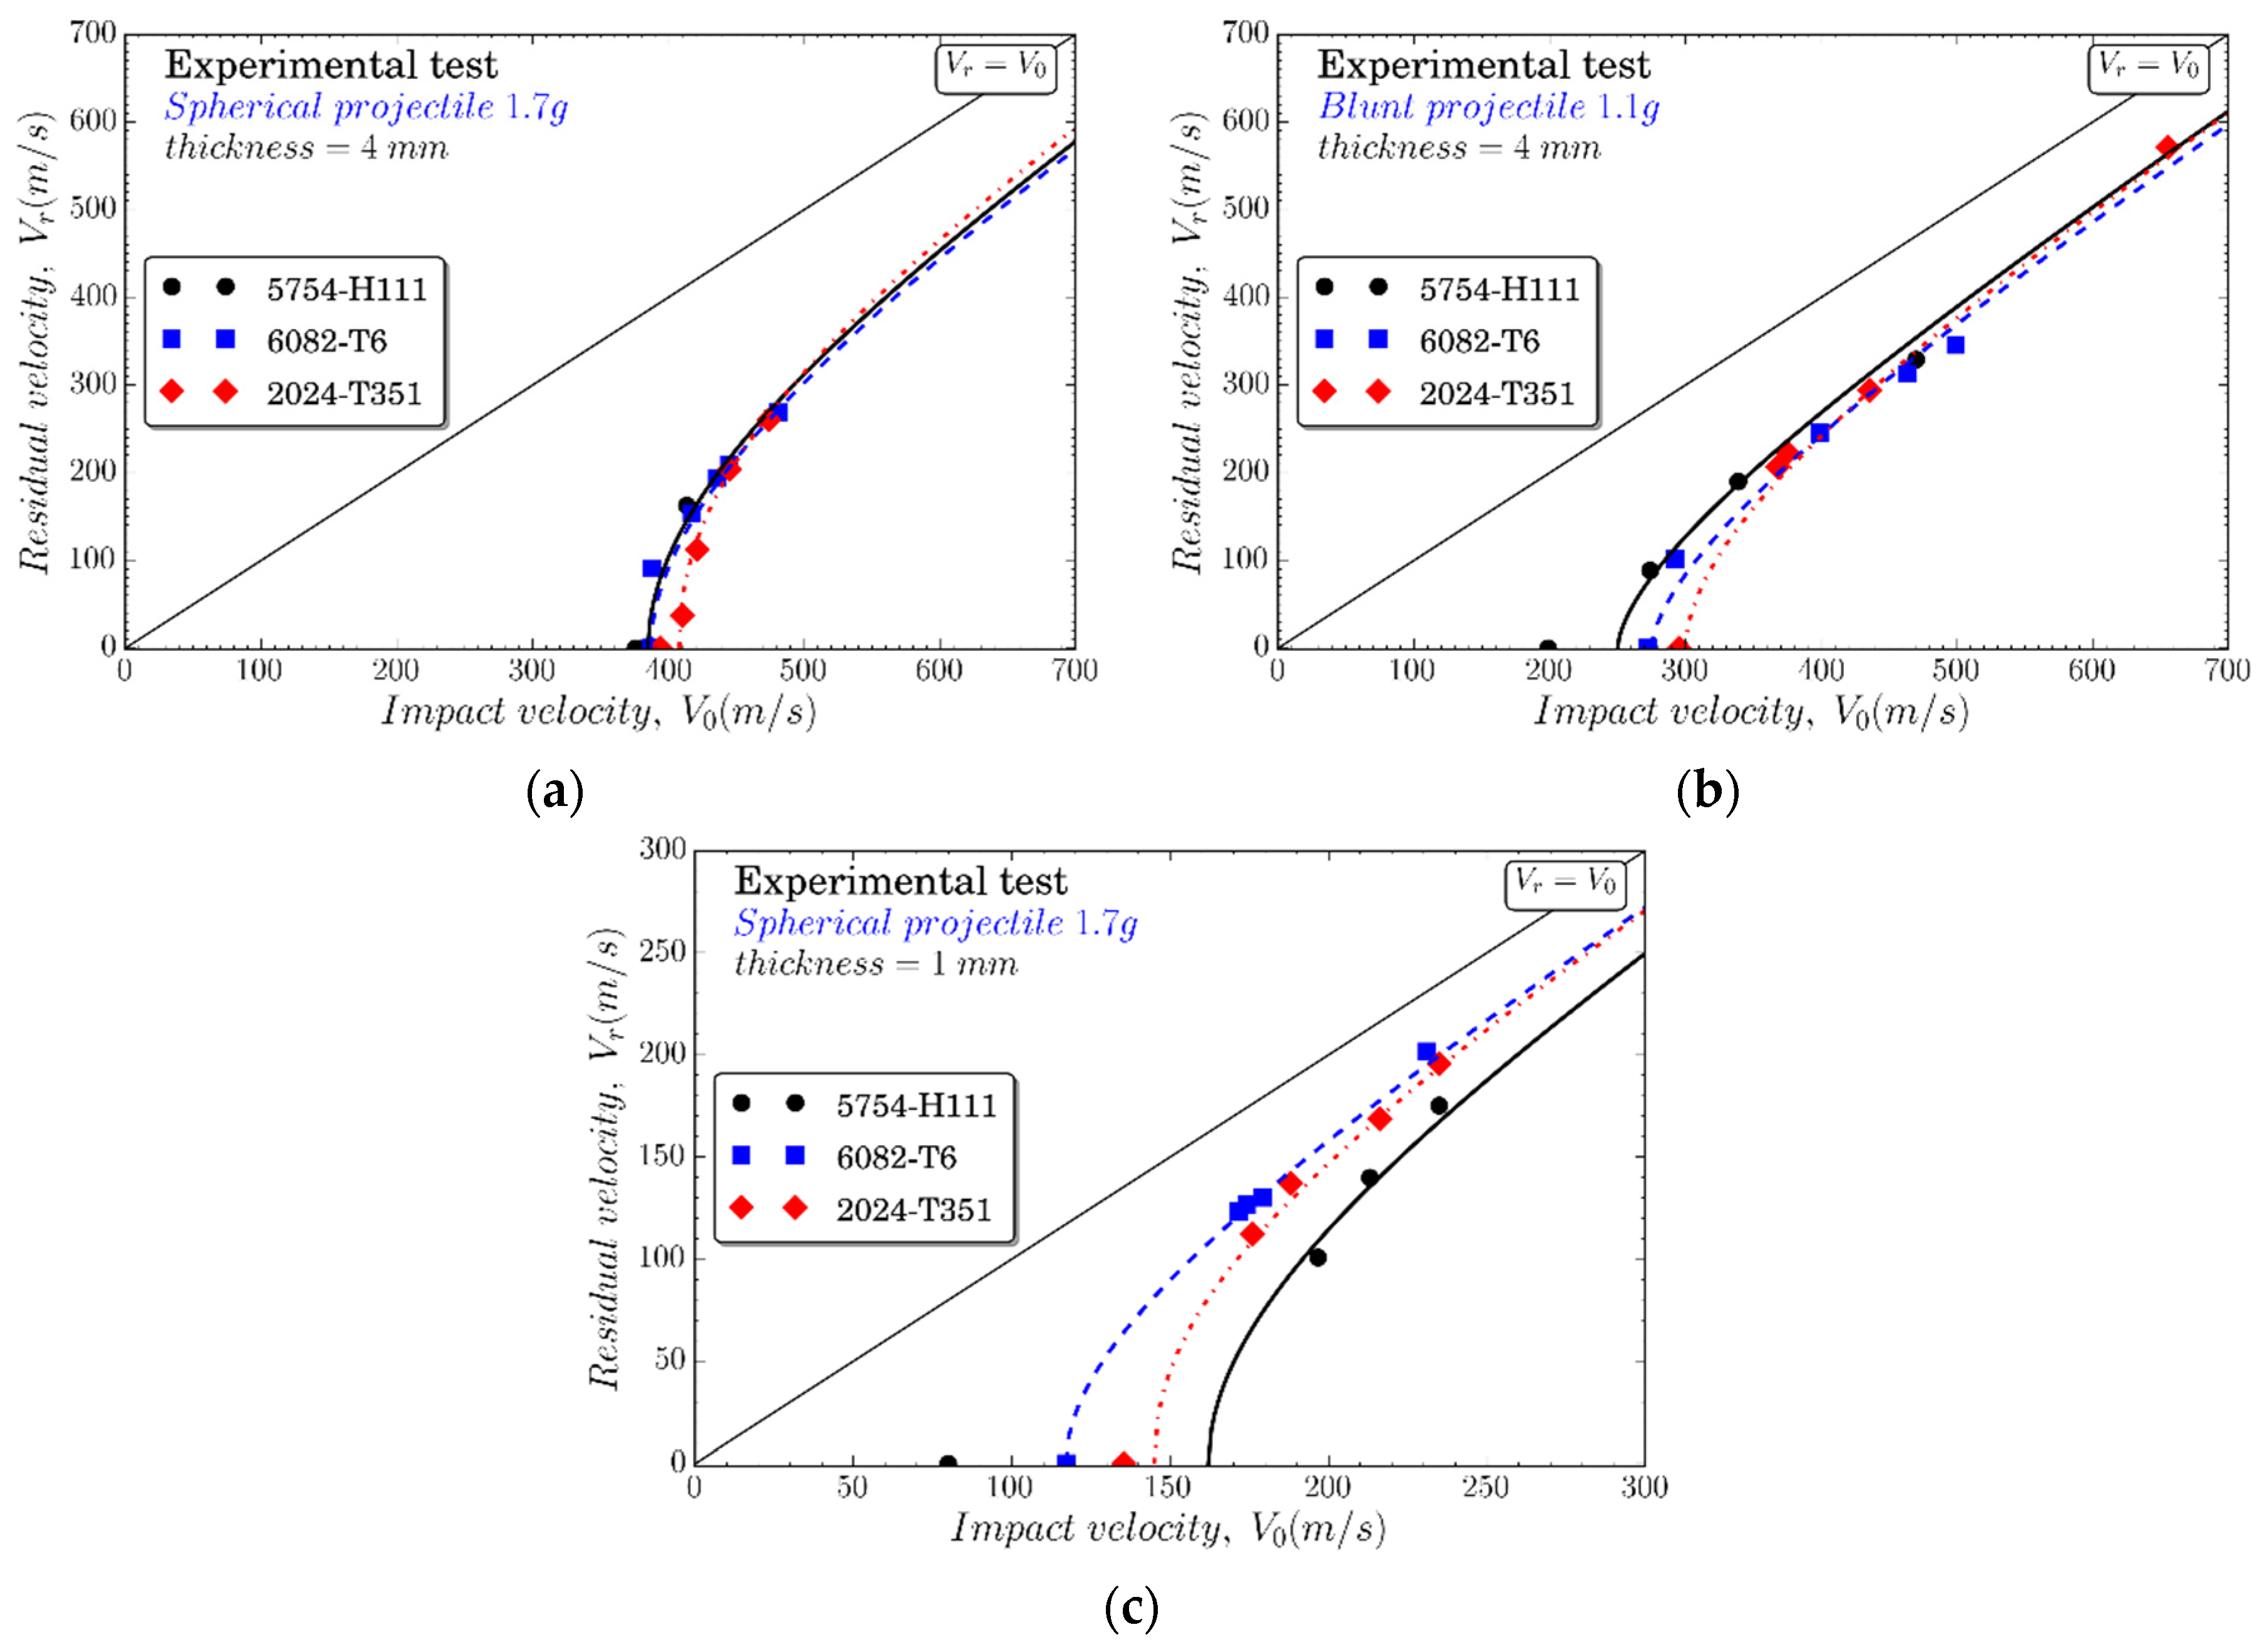
Figure 11 shows the residual velocity versus impact velocity () curves for the two different projectile shapes considered and two plate thicknesses. The results are fitted via the expression proposed by Recht and Ipson [42] as
where κ is a fitting parameter depending on the projectile shape that describes the trend of the relationship between the impact and residual velocities. For the spherical projectile, the fitting parameter obtained is κ = 1.95 for AA 5754-H111; κ = 1.90 for AA 6082-T6; and κ = 2.2 for AA 2024-T351. However, for the blunt projectile, the fitting parameter obtained is κ = 1.60 for AA 5754-H111, κ = 1.90 for AA 6082-T6, and κ = 1.8 for AA 2024-T351.
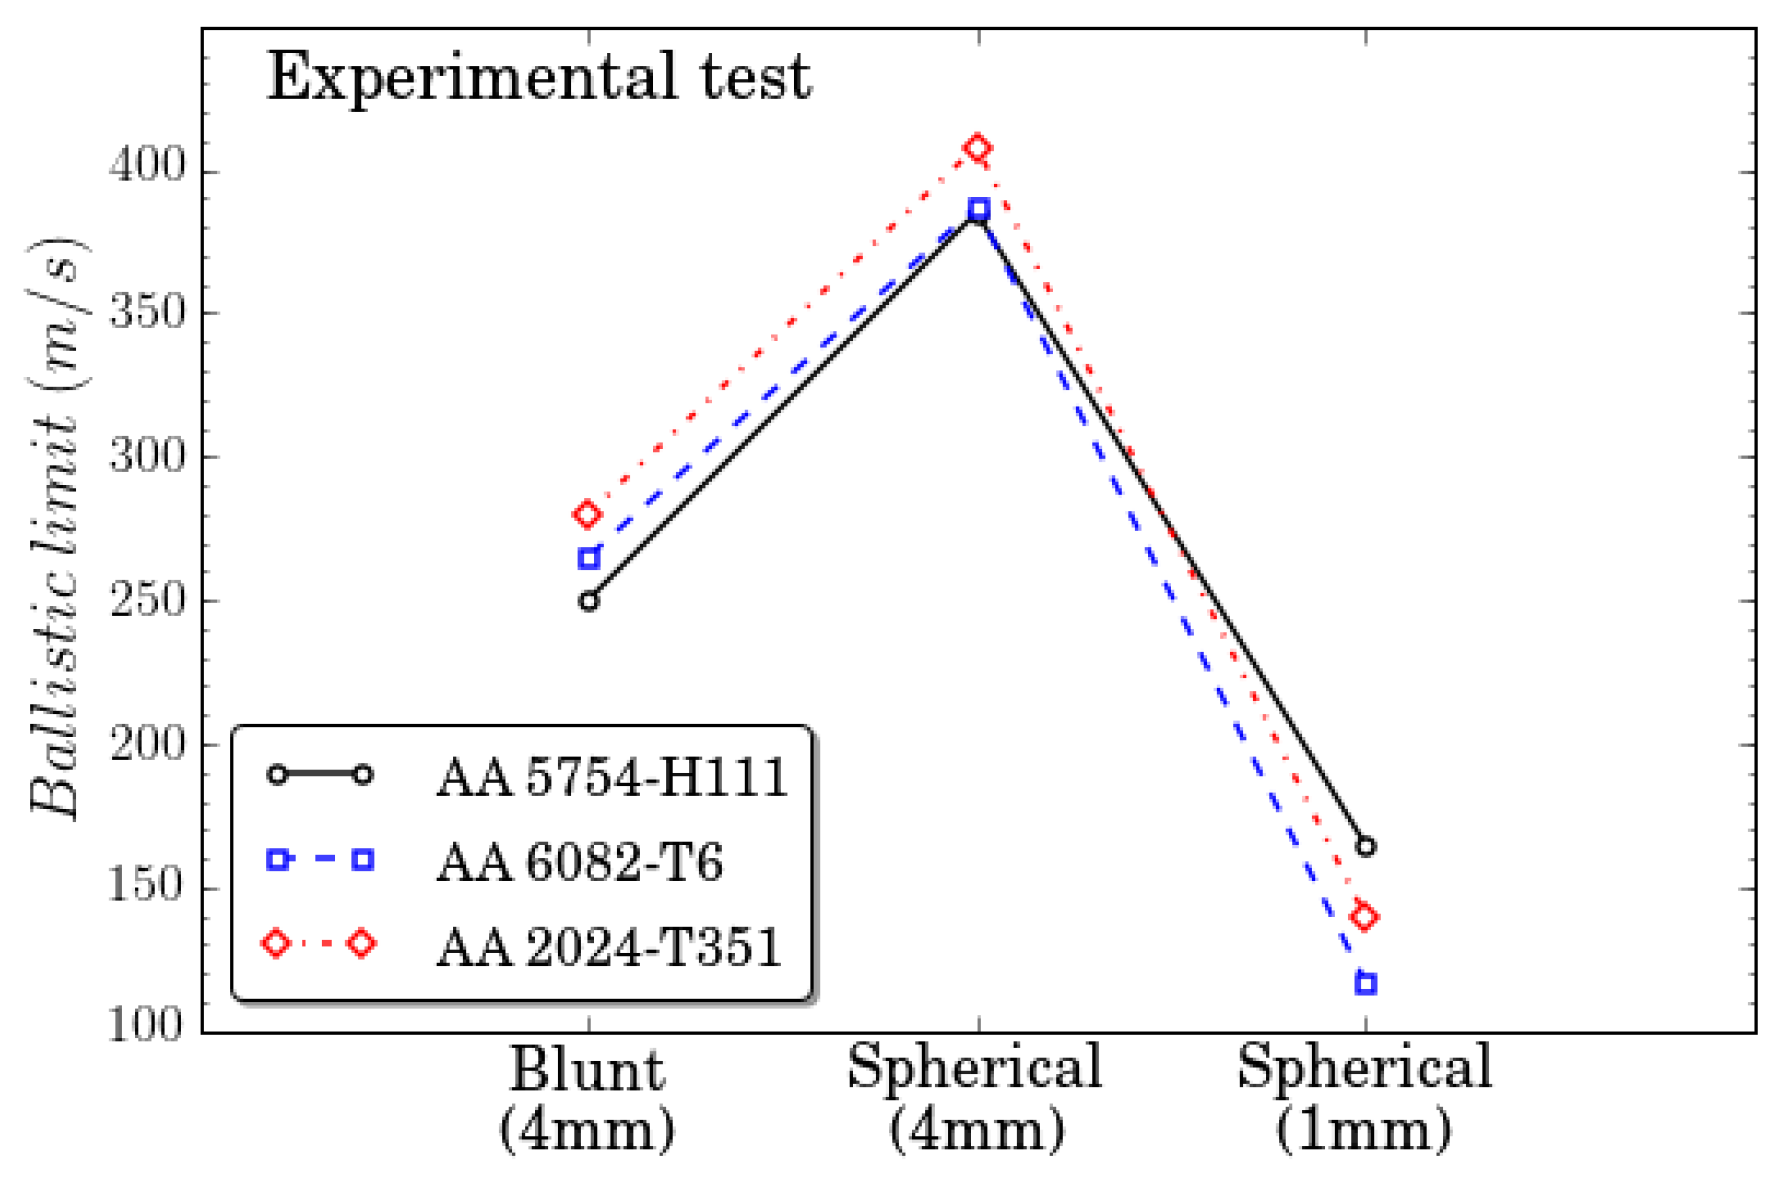
For the impact tests conducted with spherical projectiles and plate thickness of 4 mm, the ballistic limits are found to be , and for AA 5754-H111, AA 6082-T6 and AA 2024-T351, respectively. Lower ballistic limits are found for the blunt projectile: , , and for AA 5754-H111, AA 6082-T6, and AA 2024-T351, respectively. As expected, for steel sphere impacts on 1 mm thick plates, the values are considerably lower, , , and , for AA 5754-H111, AA 6082-T6, and AA 2024-T351, respectively.
Failure Mode
The variation in energy absorption capacity with different projectile nose shapes can be related to the corresponding difference in deformation and failure modes as shown in Figure 12. In this regard, Kpenyigba et al. [13] observed that the failure strain depends on the stress state induced by the projectile shape.
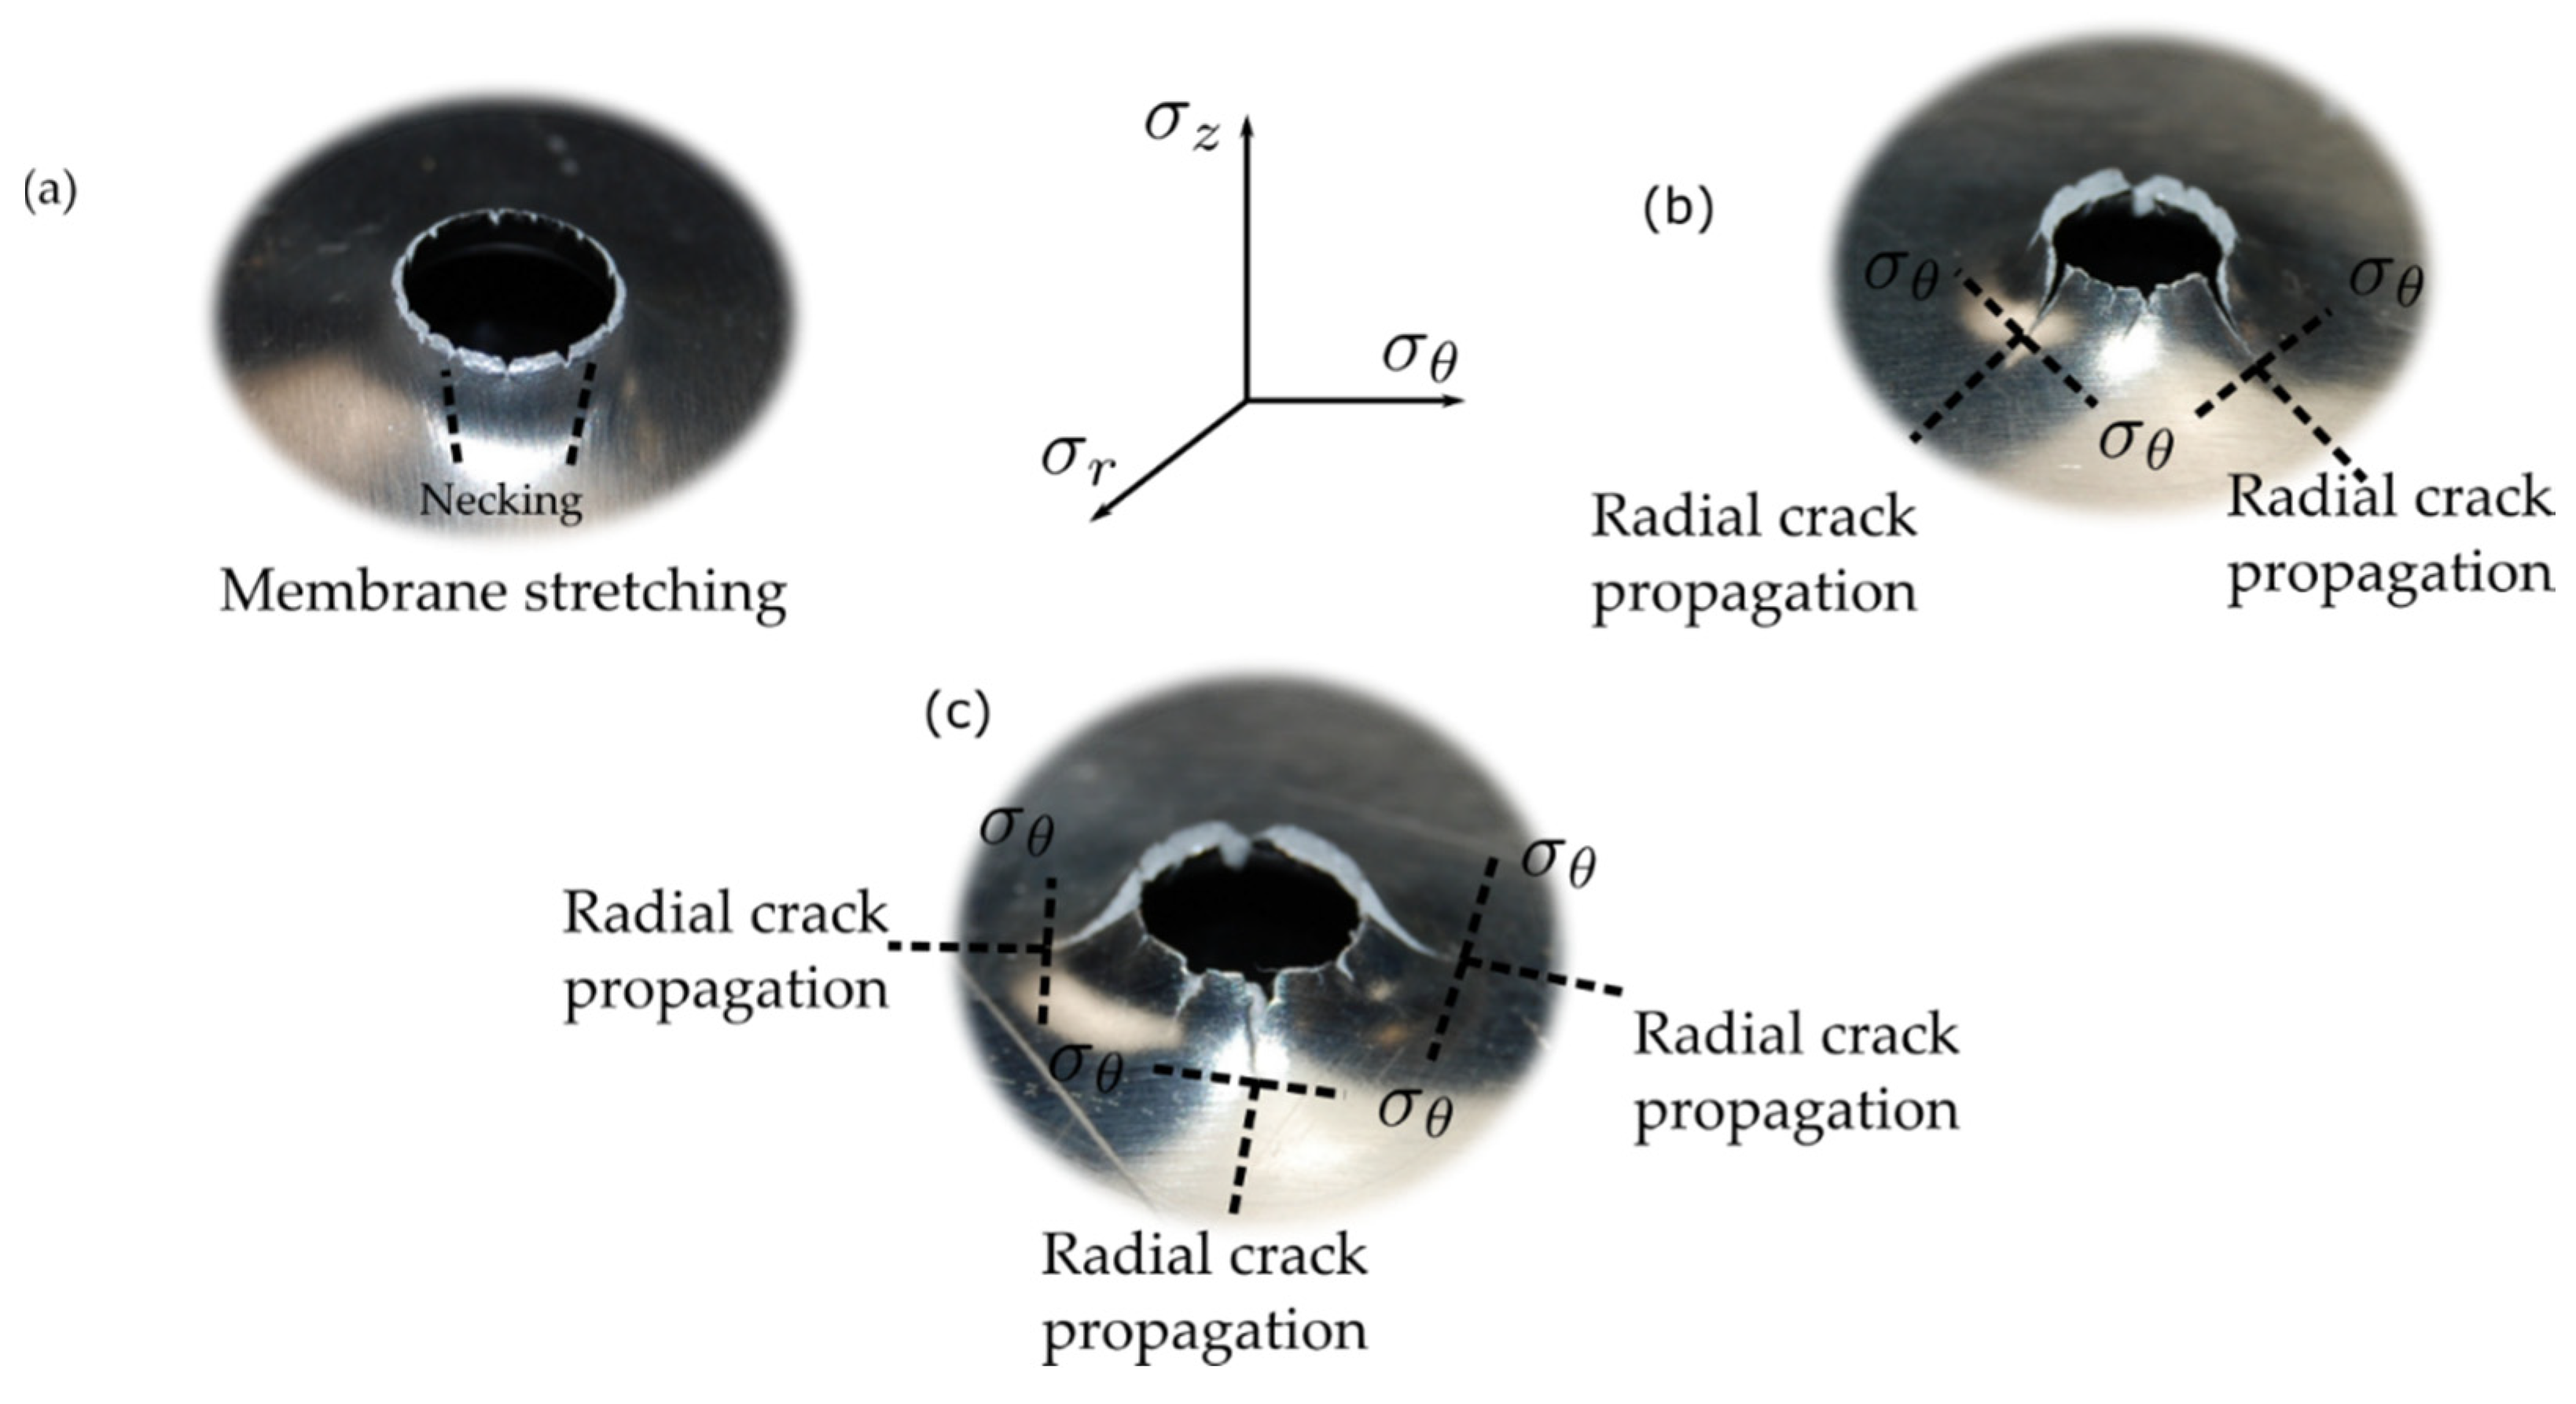
● Spherical Projectile Configuration
Spherical projectiles lead to a plate failure based on ductile hole enlargement, where the material in front of the projectile is pushed forward, see Figure 12. Localized rear bulging with radial cracks and short petals is also observed. This effect is highlighted for AA 5754-H111. The plug ejected shows a diameter similar to the projectile; however, the diameter of the perforated hole is found to be smaller than the projectile’s due to elastic recovery (spring back behavior), especially for AA 2024-T351 and AA 5754-H111.
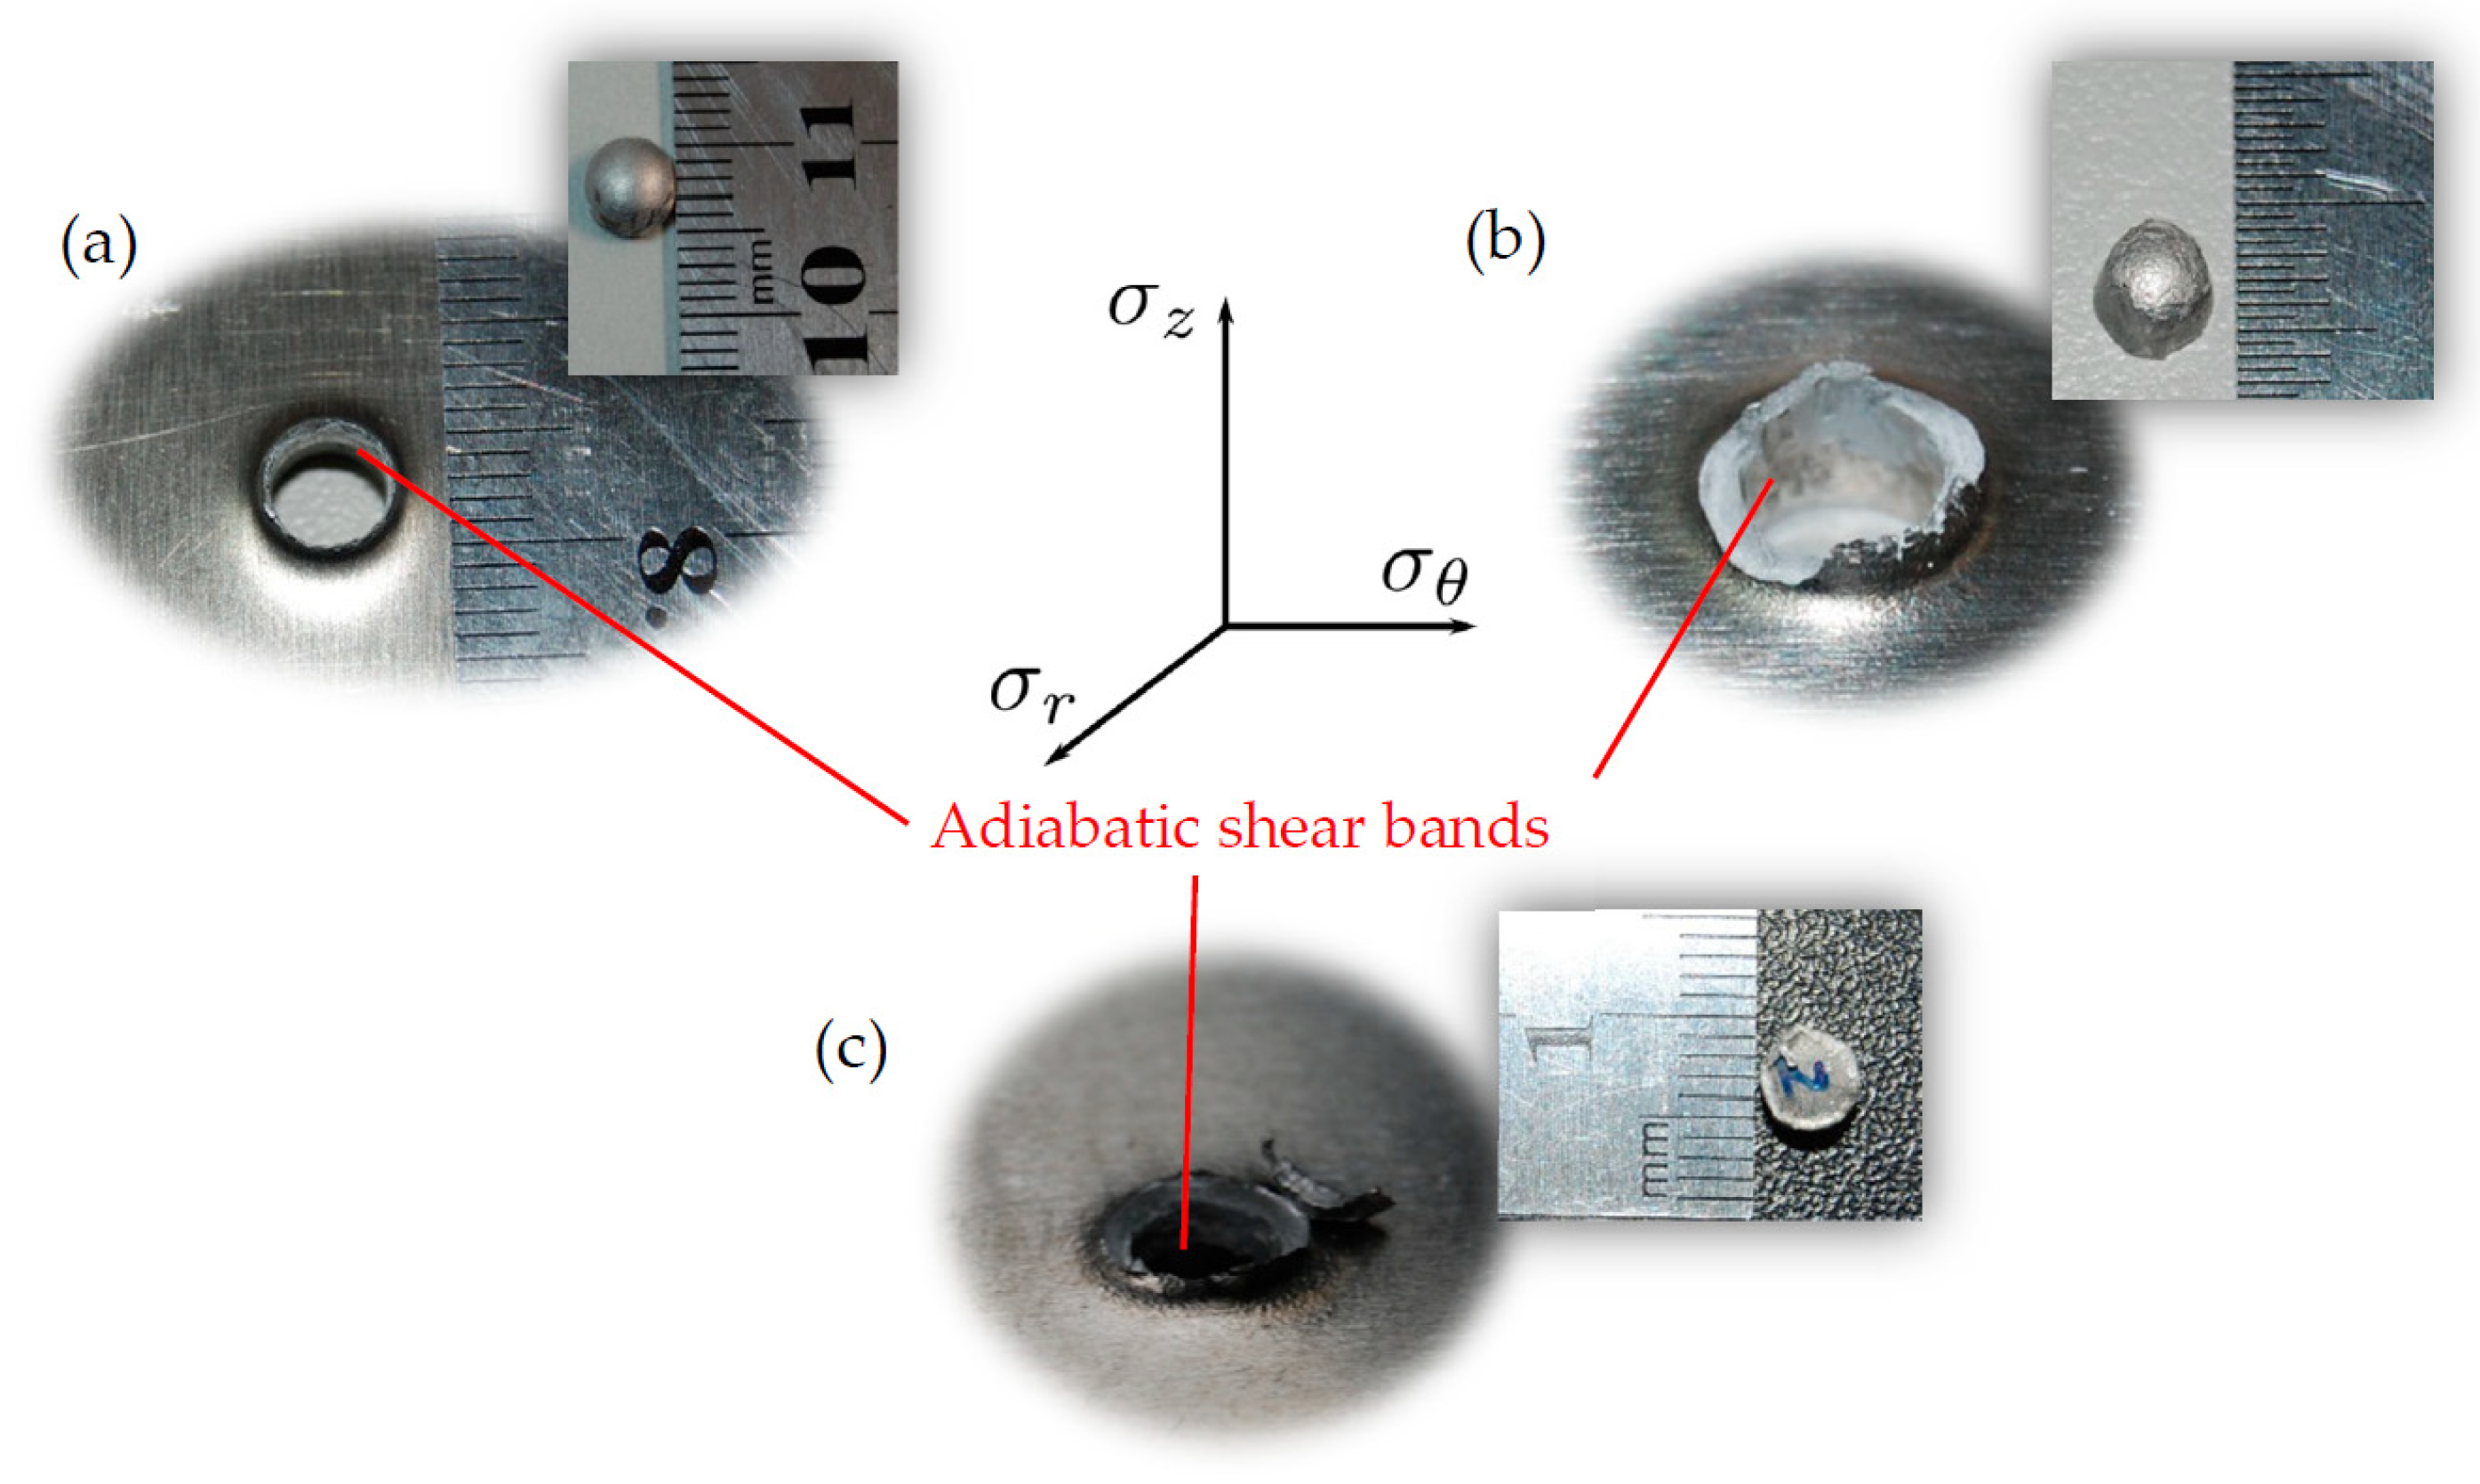
● Blunt Projectile Configuration
For the impact tests conducted with the blunt projectile, Figure 13, the failure mode of the plate is dominated by shear banding leading to the ejection of a circular plug at the final stage of the perforation. This circular plug presents a diameter equal to the projectile diameter.
4.3.2. Numerical Results
Residual Velocity
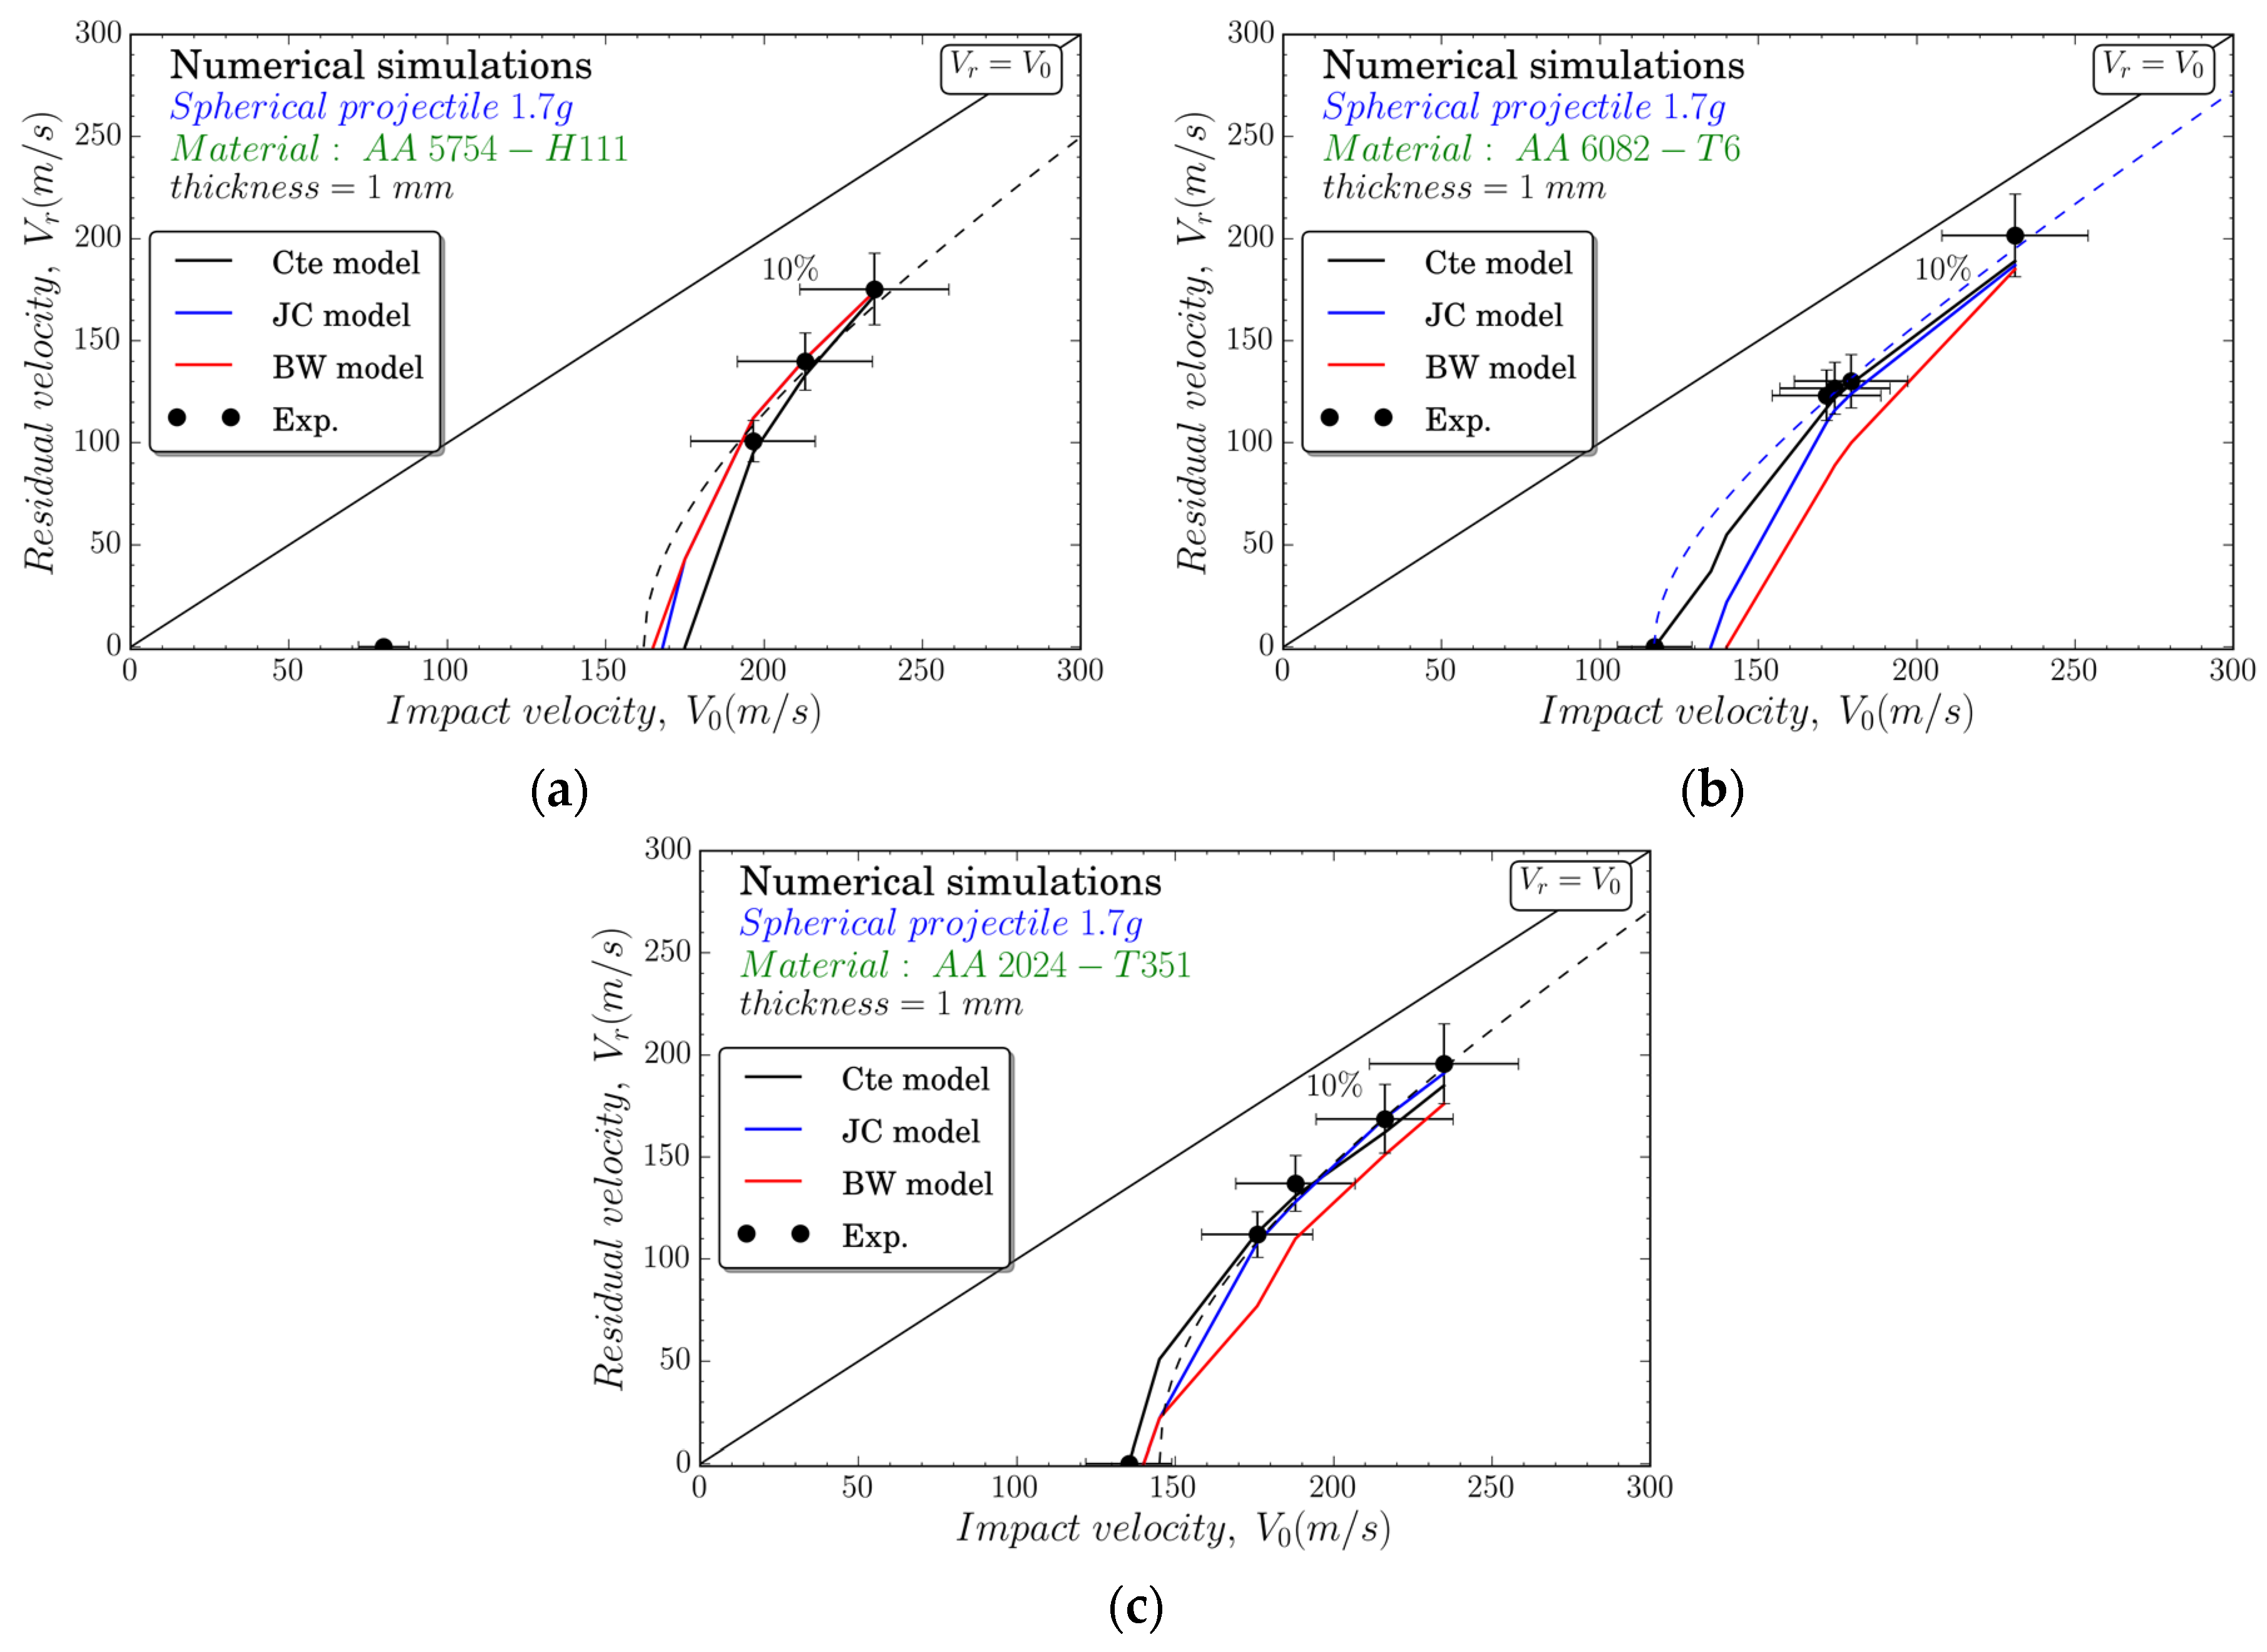
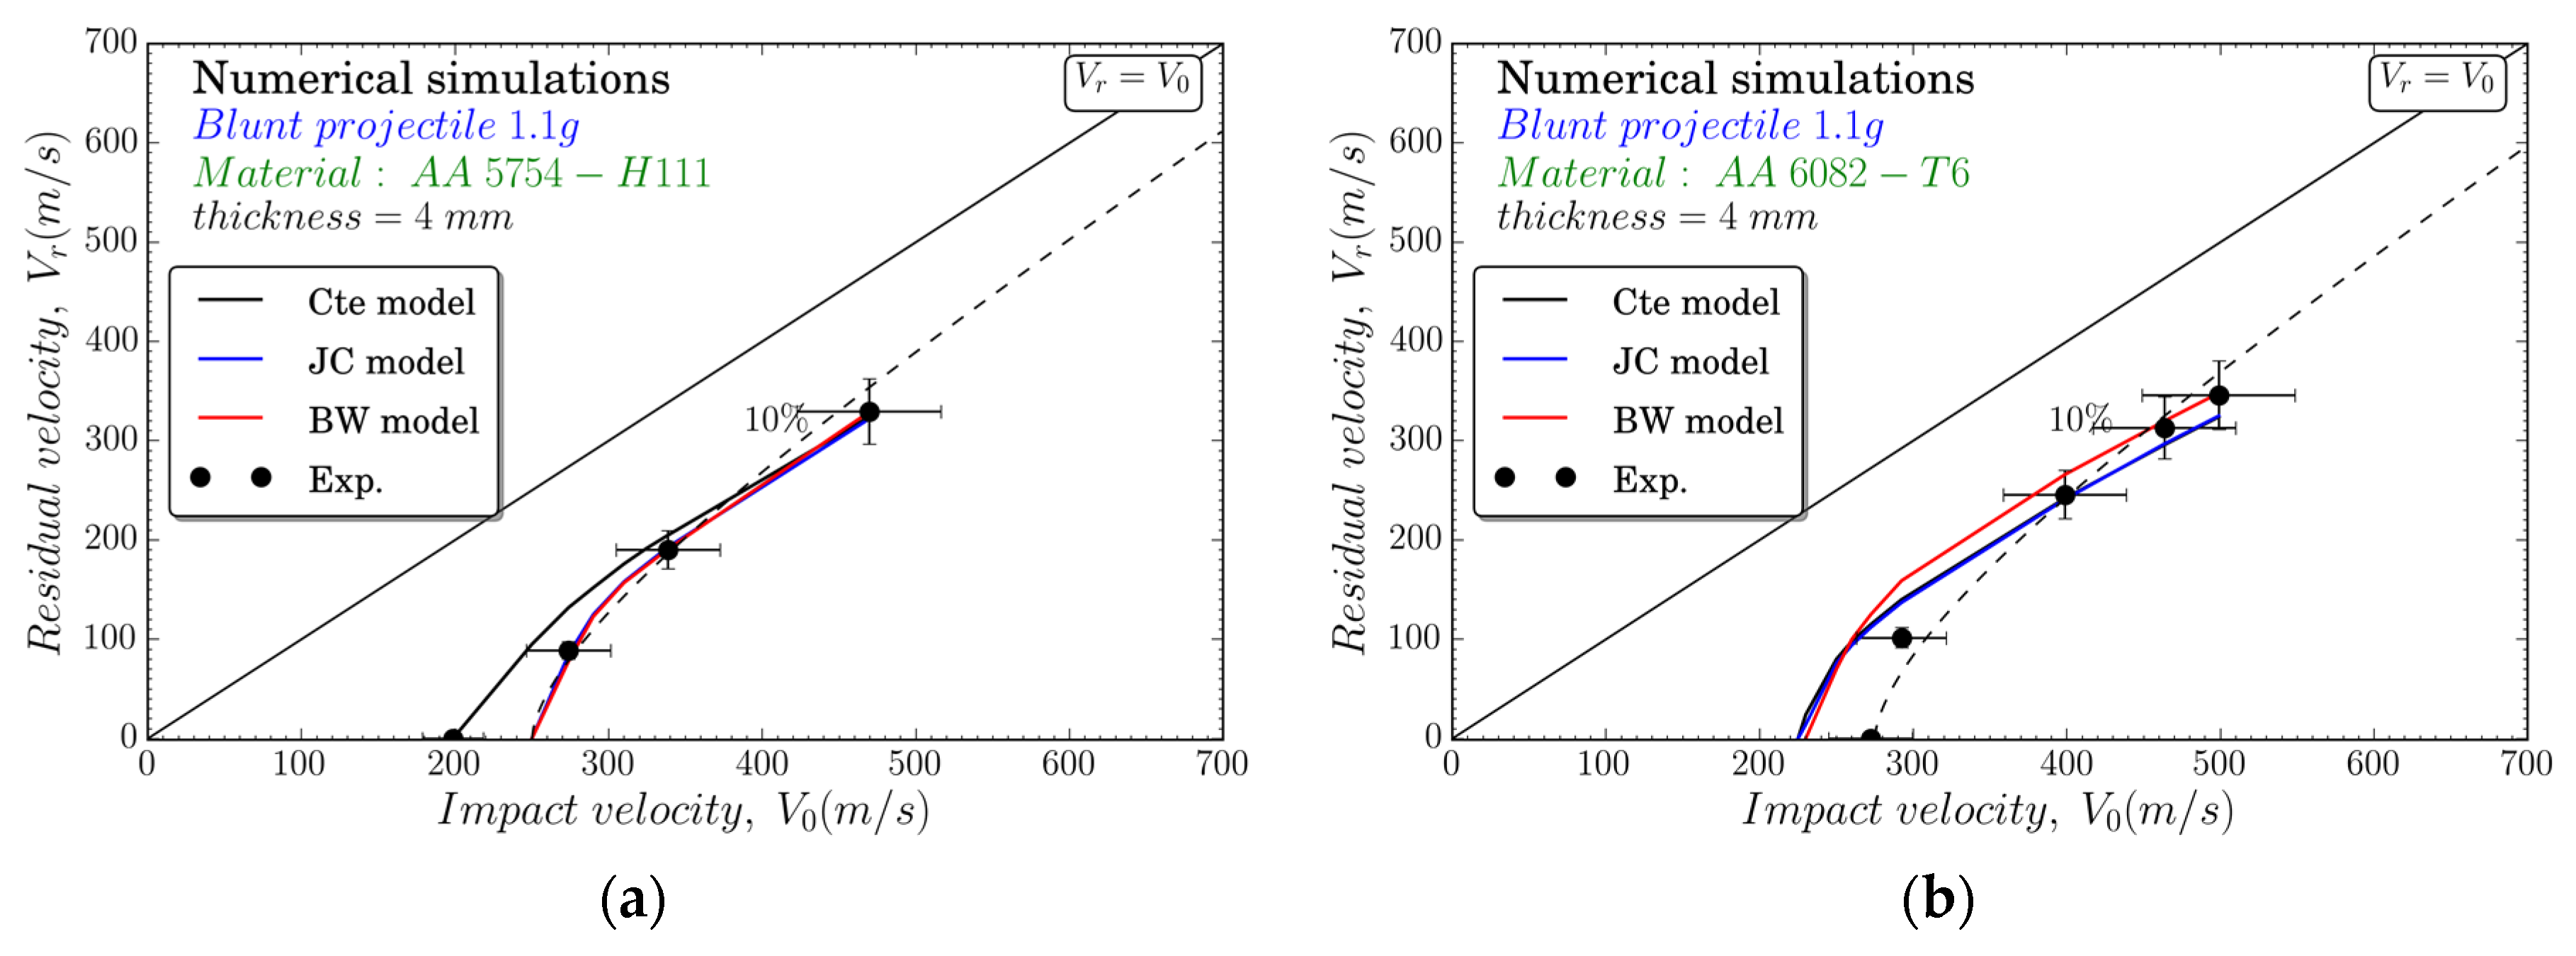
A comparison between experimental and numerical results in terms of residual versus impact velocities is carried out for the different projectile nose shapes and failure criteria used (see Figure 14, Figure 15 and Figure 16).
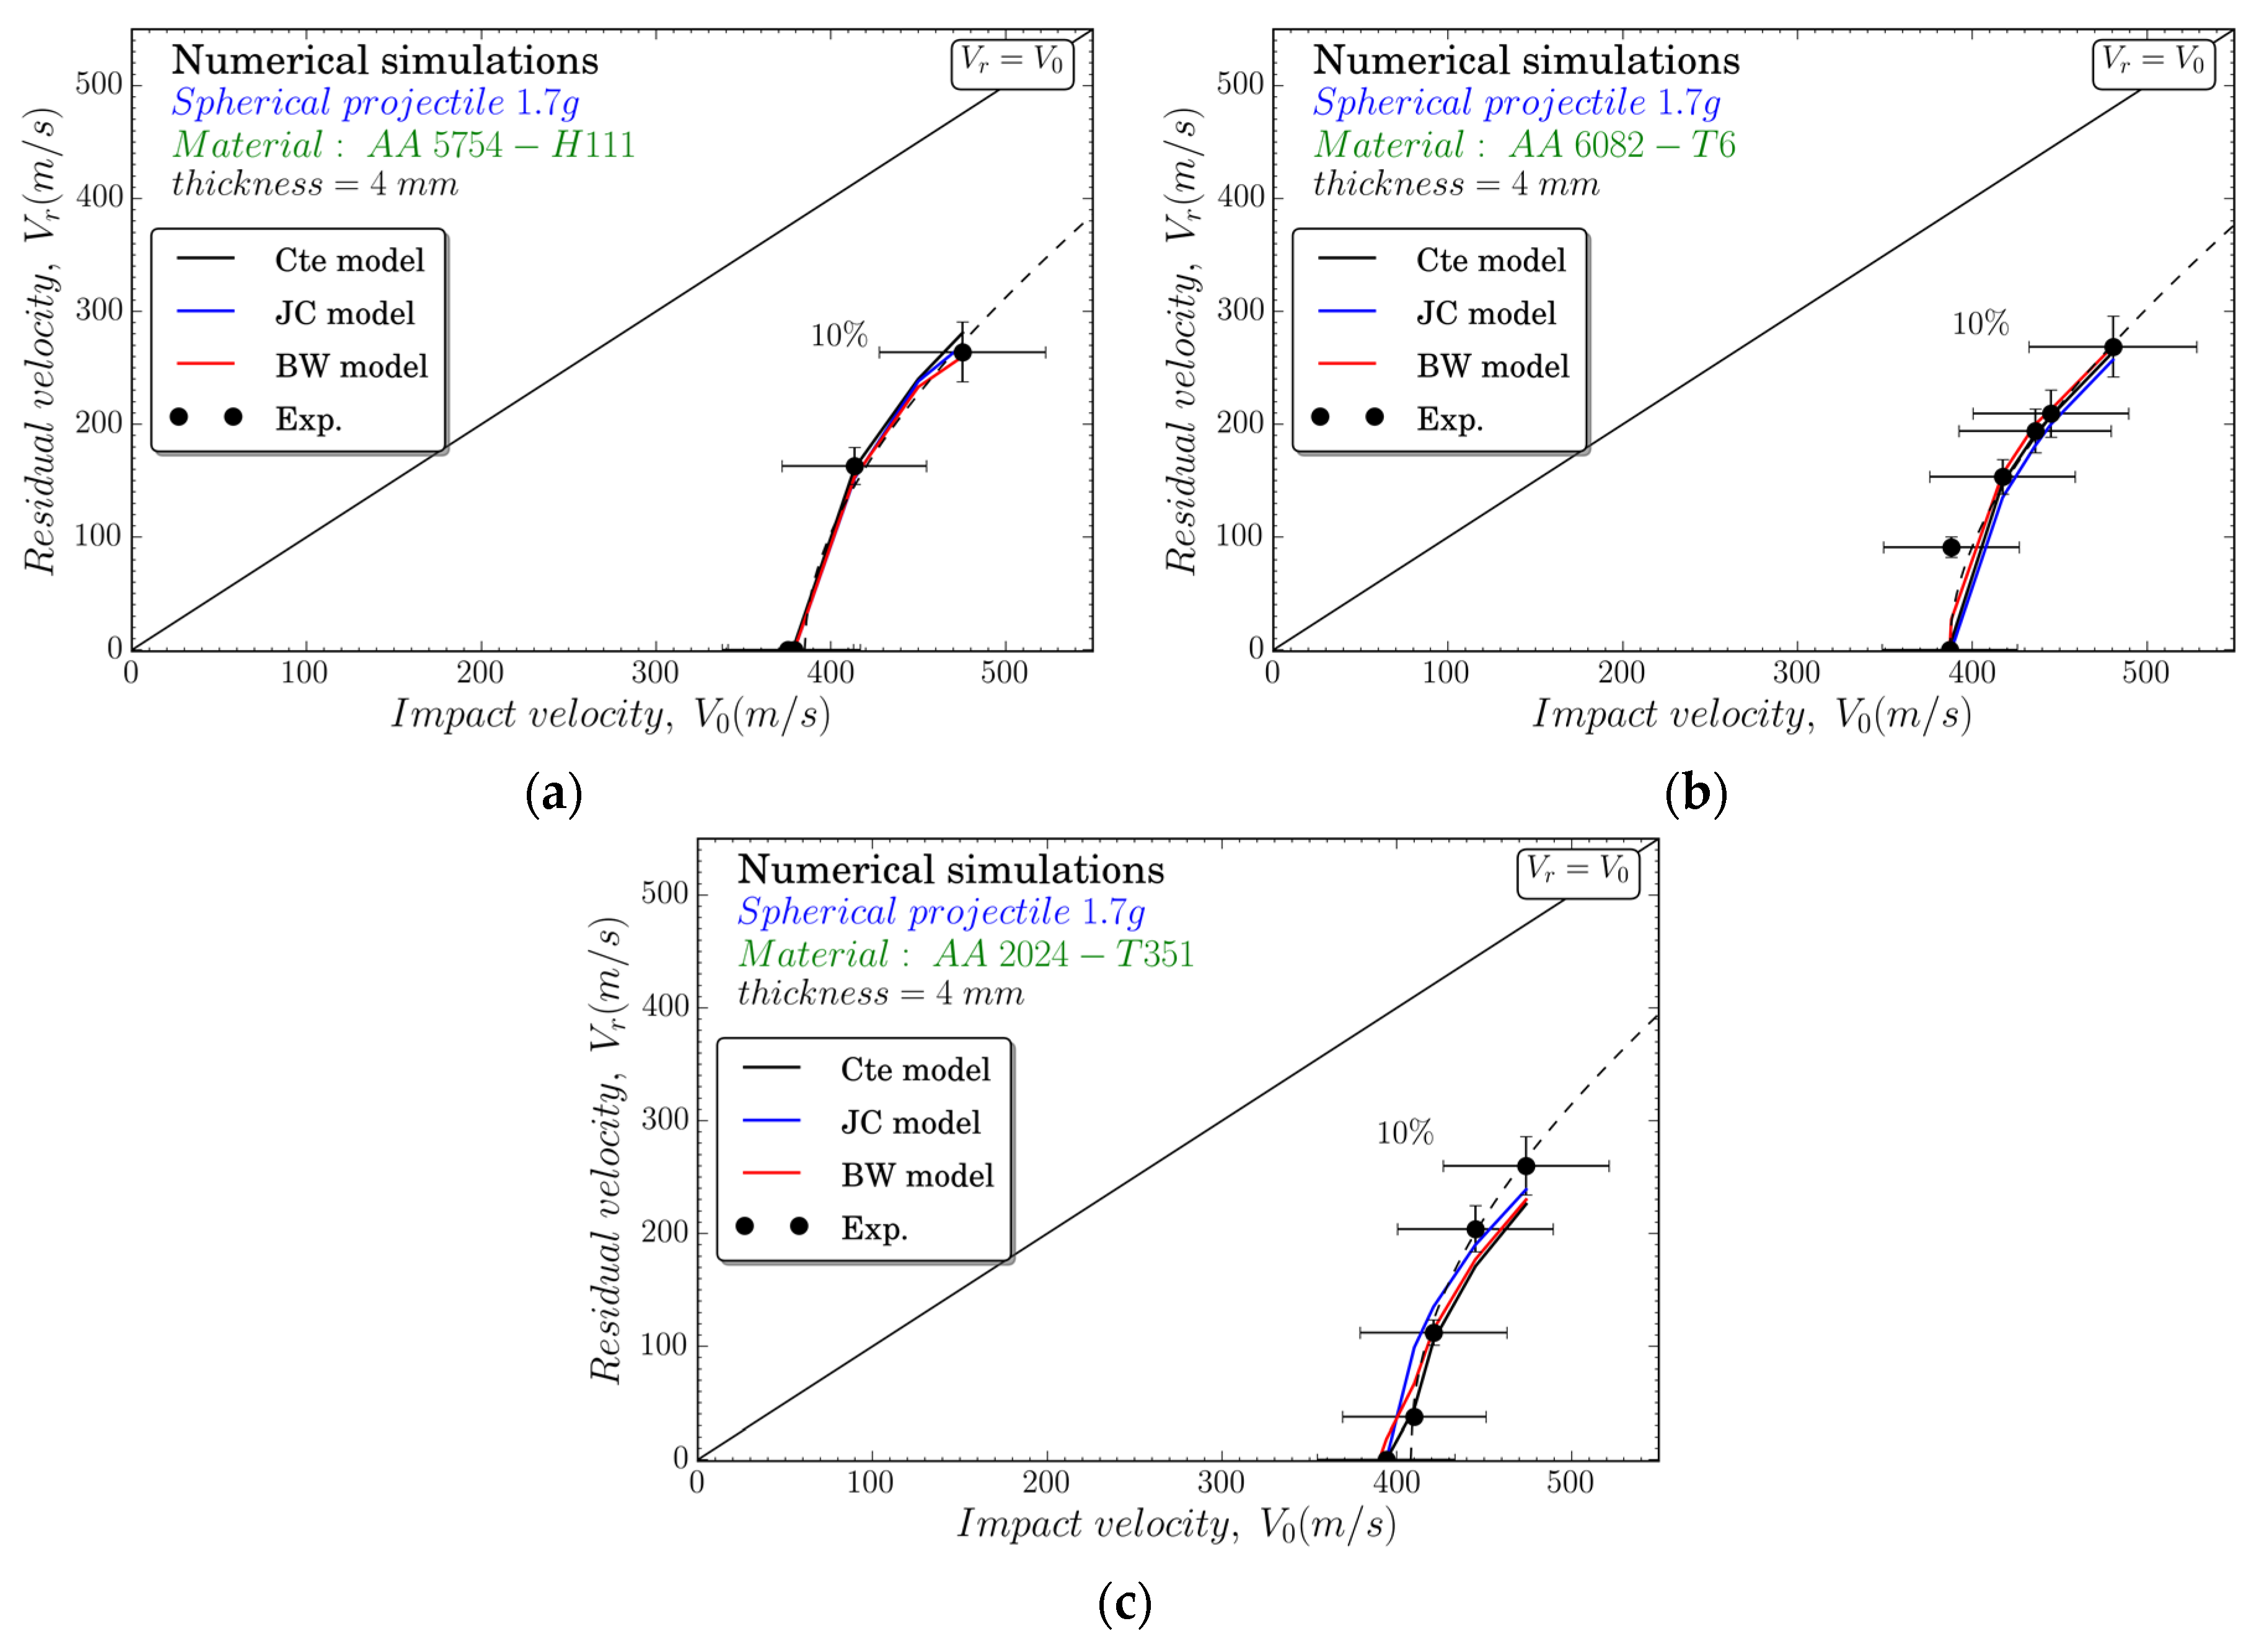
● Spherical Projectile Configuration
Figure 14 shows the residual velocity versus impact velocity curves for impact tests using spherical projectiles and 4 mm thickness plates. The residual velocity predictions are in good agreement with the experimental results. However, the JC and BW failure models present maximum variations in the ballistic limit lower than 10% of the experimental values. In general, the prediction of the whole range of residual velocities depending on impact velocities is quite complicated, as recently argued by Fras et al. [1].
In the case of impacts that also use a spherical projectile but on 1 mm thick plates, Figure 15, the B-W failure model correctly predicts the ballistic limit except in the case of AA 6082-T6, that the numerical value is overestimated by approximately 15% with respect to the experimental result. However, it correctly reproduces the behavior of the material for values above the ballistic limit. A similar result is obtained with the JC model, where a difference of approximately 10% is obtained.
● Blunt Projectile Configuration
For impacts conducted with blunt projectiles, a maximum difference of 25, 15, and 40% is found between the experimental and predicted ballistic limit velocities for AA 5754-H111, AA 6082-T6, and AA 2024-T351, respectively. According to Fras et al. [1], the impact of cylindrical projectiles is the most challenging and complex scenario, usually requiring the recalibration of the failure parameters. It can be noted in Figure 16 that, although disparity in the prediction of the ballistic limit, numerical predictions are satisfactory beyond this point.
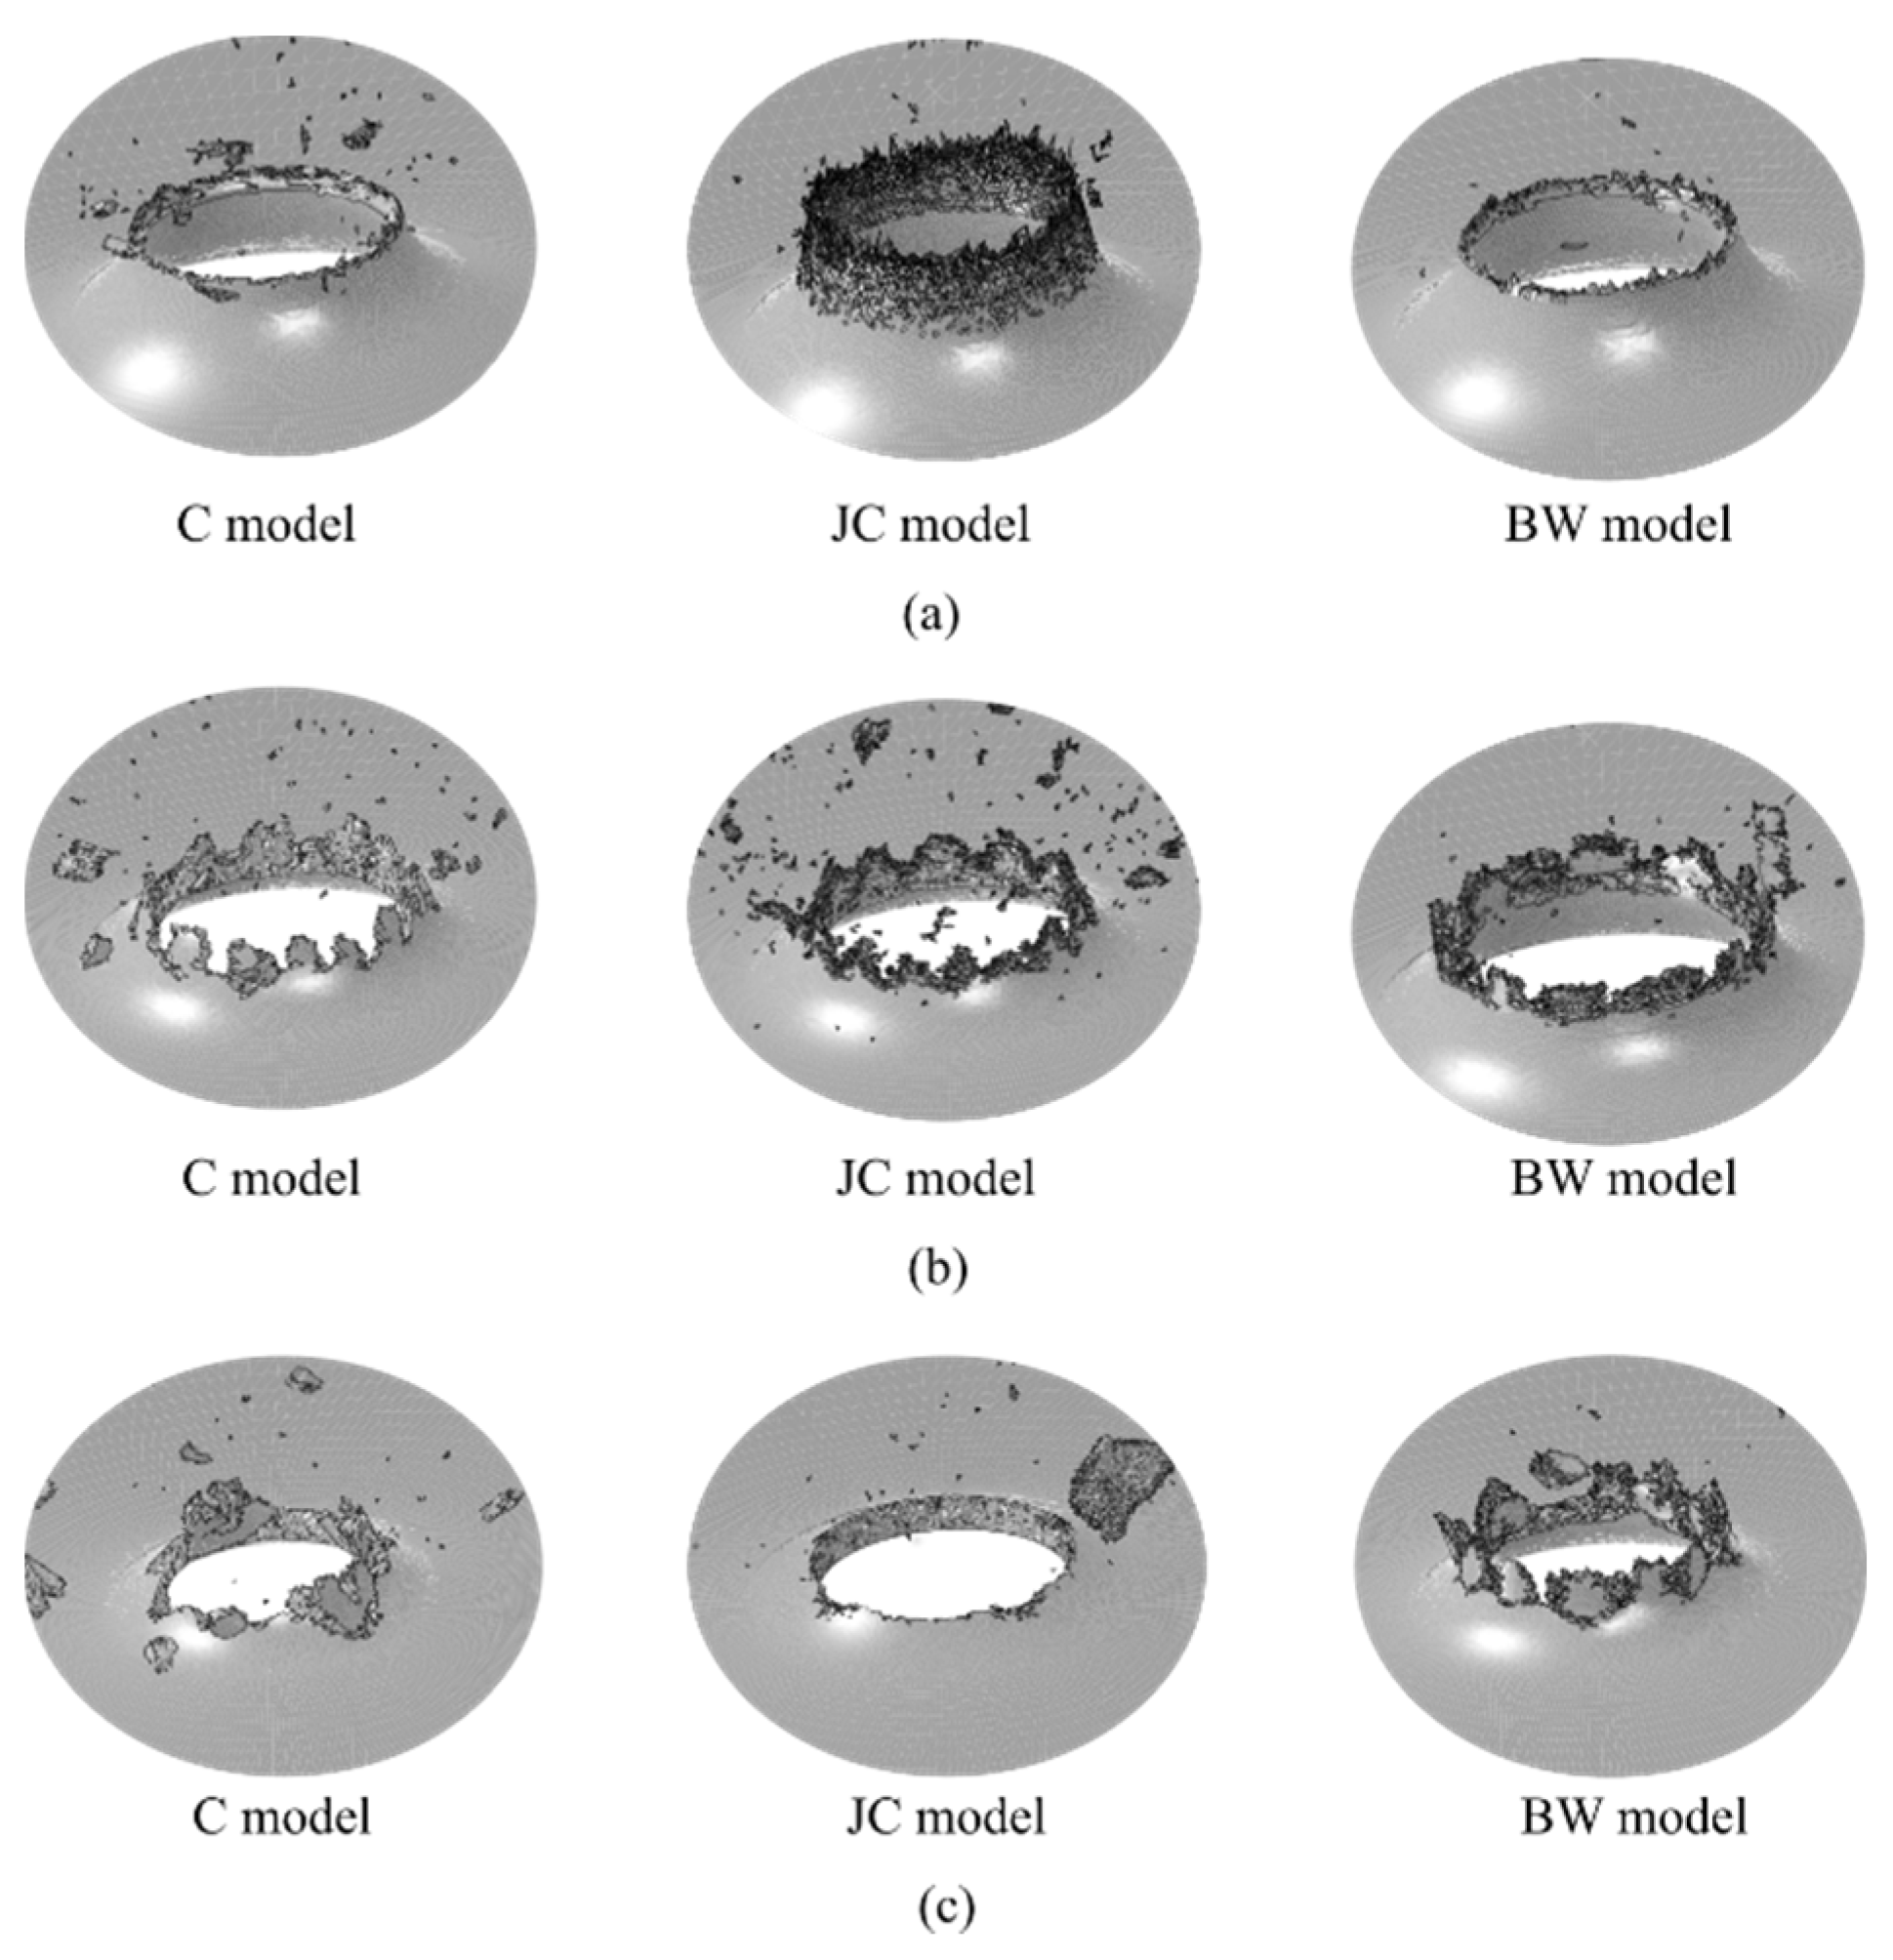
Failure Mode
Figure 17 compares the final stage of the perforation process for the different failure models and for the three different aluminum alloys studied in this work. This figure is compared with the experimental observations presented in Figure 12. The numerical predictions and experimental results in terms of failure mode are quite similar to each other. In this regard, the failure mode of the AA 5754-H111 in the numerical simulations is very close to the equivalent experimental failure mode. Compared to AA 6082-T6 and AA 2024-T351, the BW and the critical plastic deformation models show some similarity in representing radial crack propagation. The JC model is the worst predictor of the failure mechanism for the AA 2024-T351 alloy.
It should be noted that the critical plastic deformation model is calibrated to obtain the best results in residual velocity without paying attention to the failure mode.
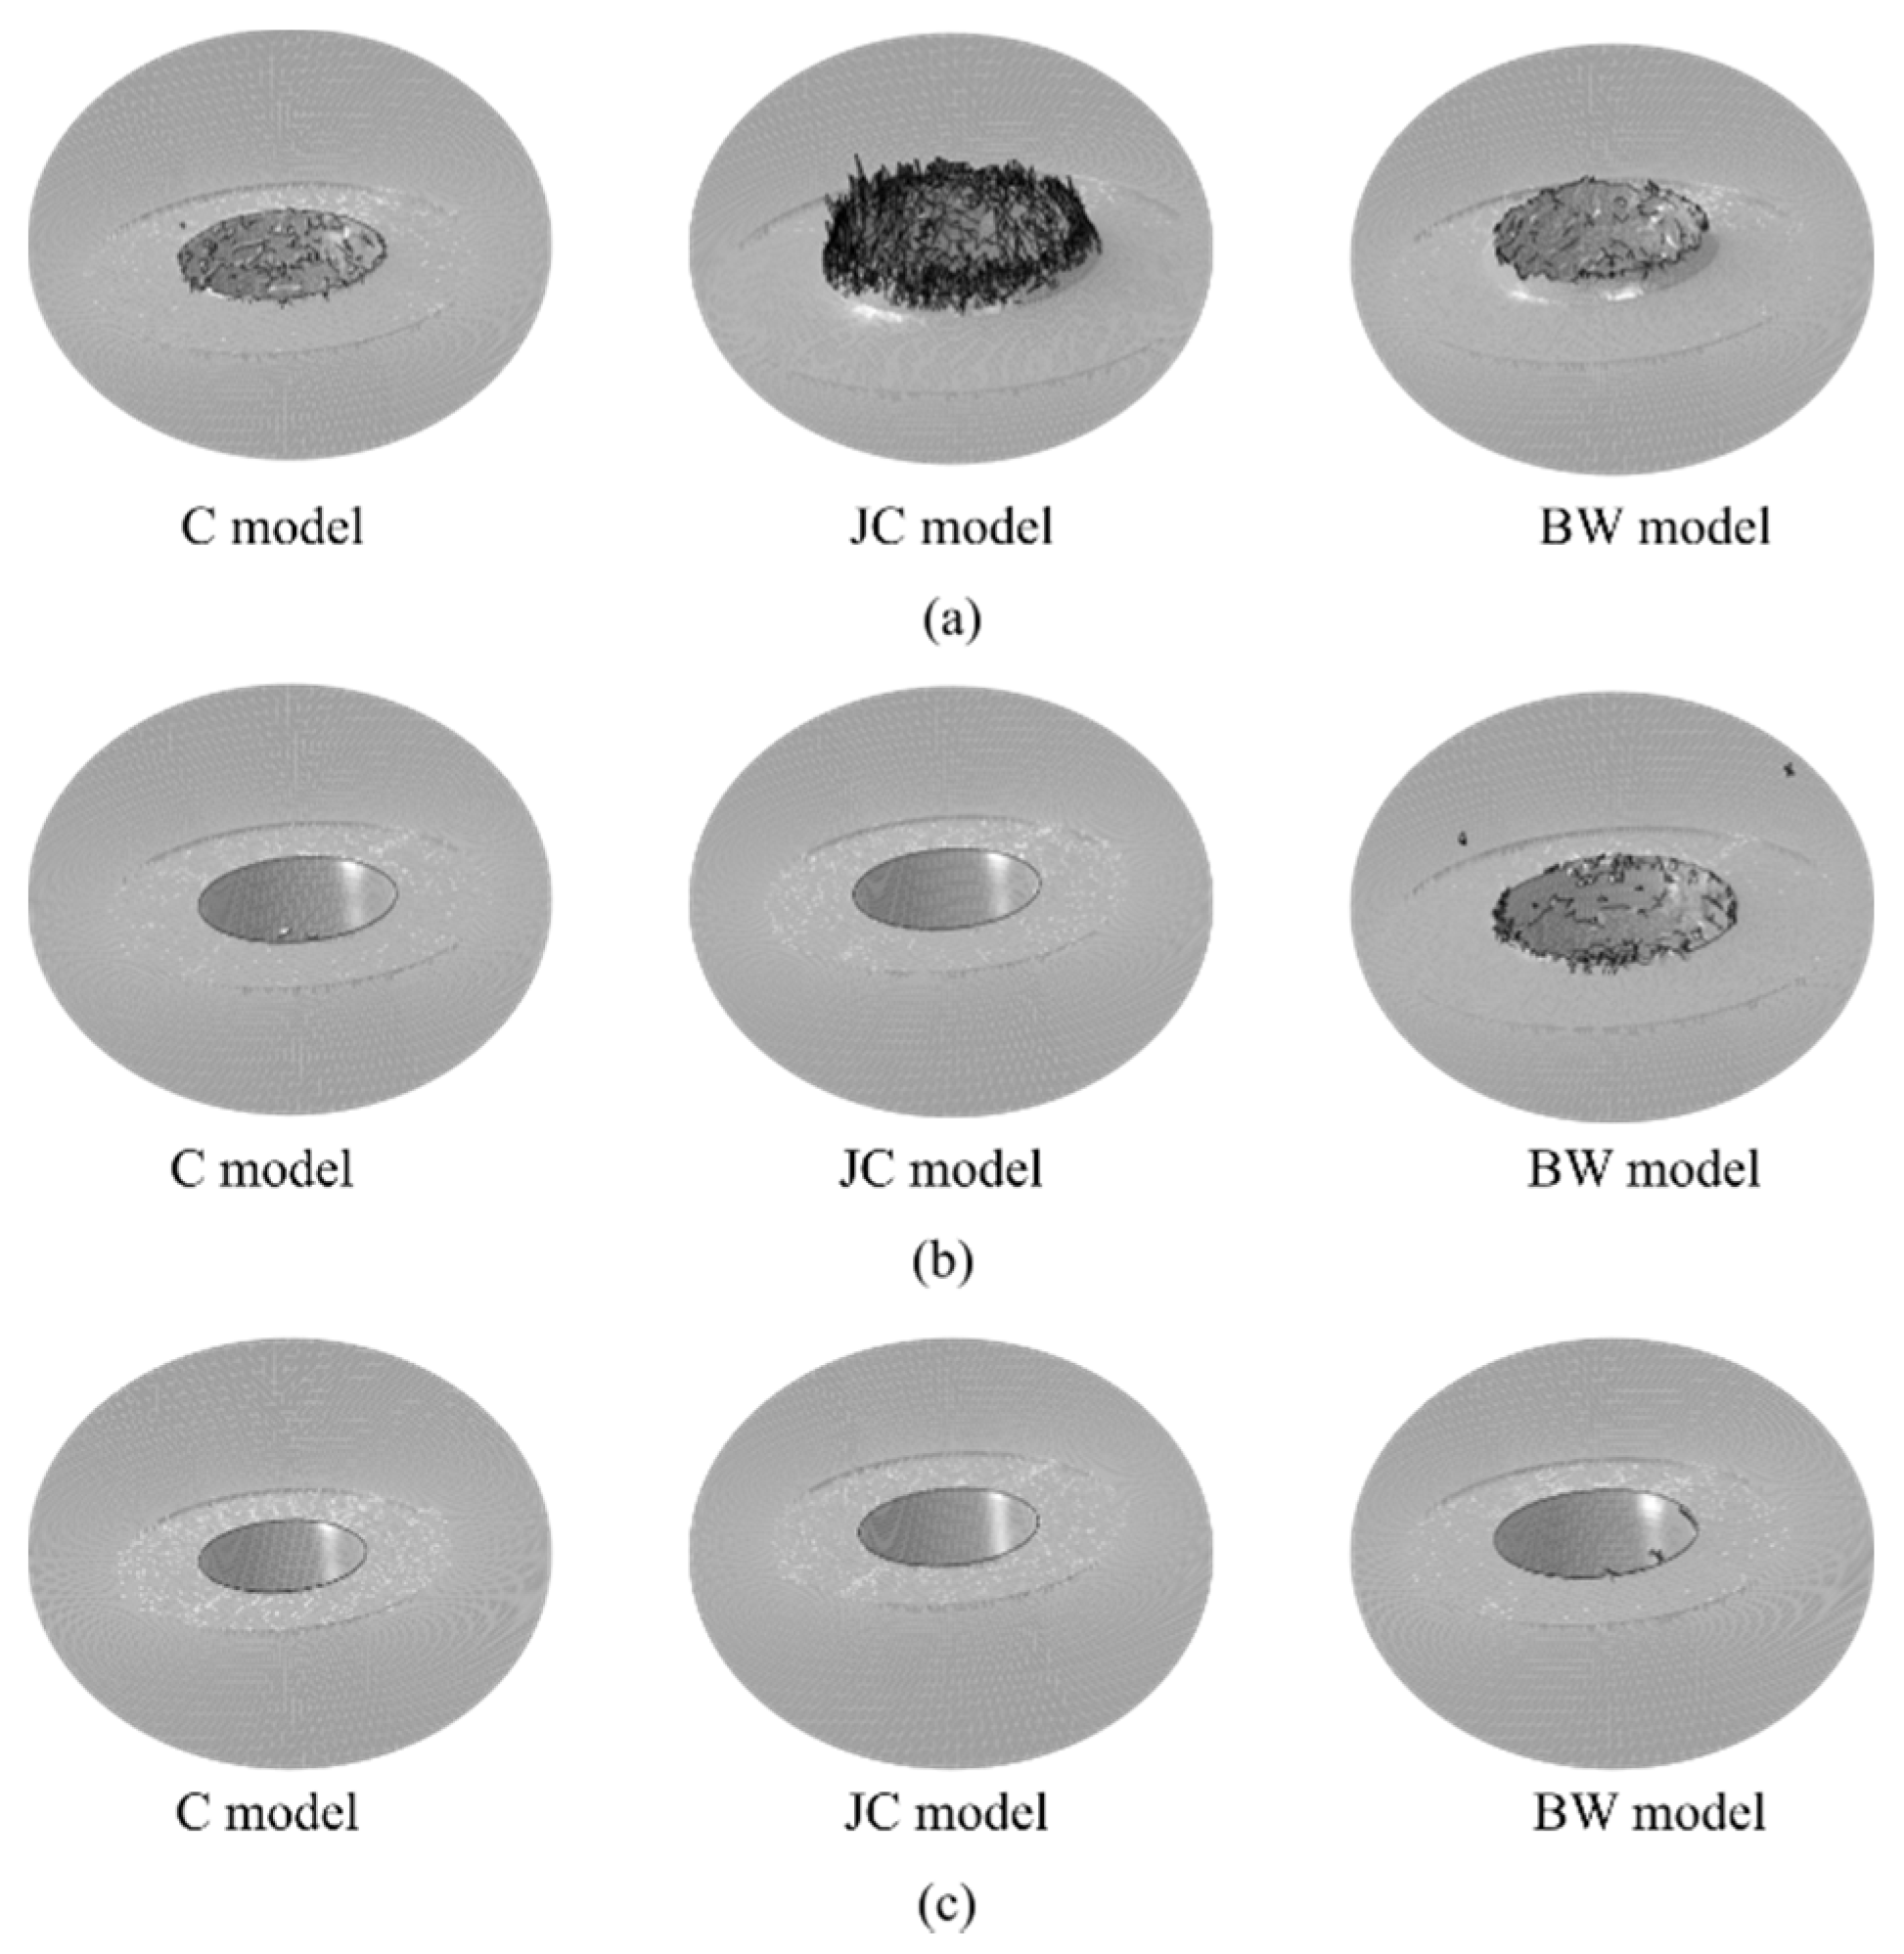
Regarding the failure mechanisms using the blunt projectile, Figure 18, all the failure models considered clearly reproduce the cut. In this regard, it should be highlighted the capacity of the BW model to allow for the plastic deformation experimentally observed around the impact zone.
5. Discussion
Tension–torsion tests have allowed to relate different stress states, by means of the Lode parameter and the stress triaxiality, with the failure strain of the three aluminum alloys studied in this work. The analysis of the influence of stress state on dynamic problems has been conducted using two projectile configurations. The three aluminum alloys considered are: AA 5754-H111, AA 6082-T6, and AA 2024-T351. The first alloy displays low initial yield stress but marked strain hardening and enhanced ductility. The second alloy shows largely different mechanical response with high initial yield stress, low strain hardening, and limited ductility. The third of them shows greater ductility and greater initial yield stress [20,21].
The ballistic limit and the failure strain of the material are strongly related to the stress state associated to the projectile shape. Figure 19 shows the ballistic limit with respect to the projectile shape and the plate thickness. It is worth noting that for higher thicknesses, in this case 4 mm, the material with the best performance is AA 2024-T351 followed by AA 6082-T6. However, for thin thicknesses, in this case 1 mm, the best performance against impact is presented by the AA 5754-H111 followed by AA 2024-T351. This may explain that the most influential parameter for low thickness is ductility and failure deformation. The maximum failure strains obtained in the tension–torsion tests were given for AA 5754-H111 and then for AA 2024-T351.
The critical plastic deformations obtained from the experimental-numerical impact results depending on the projectile shape, show the influence of the tension state on failure, see values in Table 4. Also note that the critical plastic deformations obtained from the impact tests are higher than the respective ones from tension–torsions tests. This fact may be due to the influence of the strain rate on the material failure or to the influence of temperature increments within the material due to adiabatic heating (especially relevant under high strain rate loading conditions).
The Lode parameter has been constantly highlighted as an essential variable to be included in the formulation of failure models. From our results, we think that a wider set of characterization experiments should be conducted in order to better calibrate the BW failure model and its dependencies on stress state. However, the work done here and the values provided in Table 3 for this model parameters, have been found acceptable to reproduce the impact events tested.
6. Conclusions
The experimental and numerical results obtained in this paper could be synthesized as:
- -
- Tension–torsion tests and impact tests are conducted on three aluminum alloys: AA 5754-H111, AA 6082-T6, and AA 2024-T351. Tests are performed covering a wide range of stress triaxialities and Lode parameters.
- -
- The observations from tension–torsion tests allow to identify the material parameters of failure models that take into account stress state sensitivity. These results are compared to failure mode at impact conditions with the aim of analysing the influence of strain rate, triaxiality, and Lode parameter on the mechanical response of aluminum alloys. In this regard, higher failure strain values are found for dynamic (ballistic/perforation) tests in comparison with quasi-static (tension–torsion tests). This fact indicates that more characterization tests are needed to properly define failure when the material is exposed to dynamic loading where strain rate sensitivity (high strain rates) and temperature sensitivity (due to adiabatic heating) are expected.
- -
- The geometry of the projectile plays a dertermining role in the resulting stress state in the targeted structure. On this point, different stress states lead to different failure modes.
- -
- Target strength increase may not lead to decreasing ballistic limit when other thickness plate is used.
- -
- The critical plastic deformation, Johnson–Cook and Bai-Wierbicki models require extensive calibration in order to correctly reproduce the failure mechanisms during impact events involving different projectile geometries. In this regard, further characterization tests to account for strain rate and temperature dependencies are needed.
Author Contributions
A.A., A.R., and M.R.-M. conceived and designed the experiments; A.R. performed the experiments; A.A., A.R., D.G.-G., and M.R.-M. analyzed the data; D.G.-G. and M.R.-M. developed the numerical simulations; A.A., A.R., D.G.-G., and M.R.-M. wrote the paper.
Funding
This research received no external funding
Acknowledgments
The researchers of the University Carlos III are indebted to the Ministerio de Economía y Competitividad de España (Project DPI2014-57989-P) and Vicerrectorado de Política Científica UC3M (Project 2013-00219-002) for the financial support.
Conflicts of Interest
The authors declare no conflict of interest.
References
- Fras, T.; Colard, L.; Lach, E.; Rusinek, A.; Reck, B. Thick AA7020-T651 plates under ballistic impact of fragment-simulating projectiles. Int. J. Impact Eng. 2015, 86, 336–353. [Google Scholar] [CrossRef]
- McClintock, F.A.A.; Kaplan, S.M.M.; Berg, C.A.A. Ductile Fracture by Hole Growth in Shear Bands. Int. J. Fract. Mech. 1966, 2, 614–644. [Google Scholar] [CrossRef]
- McClintock, F.A. A Criterion for Ductile fracture by the Growth of Holes. J. Appl. Mech. 1968, 32, 363–372. [Google Scholar] [CrossRef]
- Rice, J.; Tracery, D. On the Ductile Enlargement of Voids in triaxial stress fields. J. Mech. Phys. Solids 1969, 17, 201–217. [Google Scholar] [CrossRef]
- Hancock, J.; MacKenzie, A. On the Mechanism of Ductile Failure in High-Strength steels subjected to multi-axial stress-states. J. Mech. Phys. Solids 1975, 24, 147–169. [Google Scholar] [CrossRef]
- Le Roy, G.; Embury, J.D.; Edward, G.; Ashby, M.F. A model of ductile fracture based on the nucleation and growth of voids. Acta Metall. 1981, 29, 1509–1522. [Google Scholar] [CrossRef]
- Johnson, G.R.; Cook, W.H. Fracture characteristics of three metals subjected to various strains, strain rates, temperatures and pressures. Eng. Fract. Mech. 1985, 21, 31–48. [Google Scholar] [CrossRef]
- Mohr, D.; Henn, S. Calibration of Stress-triaxiality Dependent Crack Formation Criteria: A New Hybrid Experimental–Numerical Method. Exp. Mech. 2007, 47, 805–820. [Google Scholar] [CrossRef]
- Ebnoether, F.; Mohr, D. Predicting Ductile Fracture of Low Carbon Steel Sheets: Stress-based versus Mixed Stress/Strain-based Mohr-Coulomb Model. Int. J. Solids Struct. 2012. [Google Scholar] [CrossRef]
- Barsoum, I.; Faleskog, J.; Pingle, S. The effect of stress state on ductility in the moderate stress triaxiality regime of medium and high strength steels. Int. J. Mech. Sci. 2012, 1–10. [Google Scholar] [CrossRef]
- Barsoum, I.; Faleskog, J. Rupture mechanisms in combined tension and shear—Experiments. Int. J. Solids Struct. 2007, 44, 1768–1786. [Google Scholar] [CrossRef]
- Bai, Y.; Wierzbicki, T. A new model of metal plasticity and fracture with pressure and Lode dependence. Int. J. Plast. 2008, 24, 1071–1096. [Google Scholar] [CrossRef]
- Kpenyigba, M.; Jankowiak, T.; Rusinek, A.; Pesci, R. Influence of projectile shape on dynamic behavior of steel sheet subjected to impact and perforation. Thin-Walled Struct. 2013, 65, 93–104. [Google Scholar] [CrossRef] [Green Version]
- Dey, S.; Børvik, T.; Teng, X.; Wierzbicki, T.; Hopperstad, O.S. On the ballistic resistance of double-layered steel plates: An experimental and numerical investigation. Int. J. Solids Struct. 2007, 44, 6701–6723. [Google Scholar] [CrossRef]
- Dey, S.; Børvik, T.; Hopperstad, O.S.; Leinum, J.R.; Langseth, M. The effect of target strength on the perforation of steel plates using three different projectile nose shapes. Int. J. Impact Eng. 2004, 30, 1005–1038. [Google Scholar] [CrossRef]
- Callister, W.D. Materials Science and Engineering: An Introduction; John Wiley & Sons. Inc.: New York, NY, USA, 1994. [Google Scholar]
- Rodríguez-Millán, M.; Vaz-Romero, Á.; Arias, Á. Failure behavior of 2024-T3 aluminum under tension–torsion conditions. J. Mech. Sci. Technol. 2015, 29, 4657–4663. [Google Scholar] [CrossRef]
- García-González, D.; Rodríguez-Millán, M.; Vaz-Romero, A.; Arias, A. High impact velocity on multi-layered composite of polyether ether ketone and aluminum. Compos. Interfaces 2015, 1–11. [Google Scholar] [CrossRef]
- Rittel, D.; Zhang, L.H.; Osovski, S. The dependence of the Taylor–Quinney coefficient on the dynamic loading mode. J. Mech. Phys. Solids 2017, 107, 96–114. [Google Scholar] [CrossRef]
- Rodríguez-Millán, M.; Vaz-Romero, A.; Rusinek, A.; Rodríguez-Martínez, J.A.; Arias, A. Experimental Study on the Perforation Process of 5754-H111 and 6082-T6 Aluminum Plates Subjected to Normal Impact by Conical, Hemispherical and Blunt Projectiles. Exp. Mech. 2014, 54, 729–742. [Google Scholar] [CrossRef]
- Rodriguez-Millan, M.; Garcia-Gonzalez, D.; Rusinek, A.; Abed, F.; Arias, A. Perforation mechanics of 2024 aluminum protective plates subjected to impact by different nose shapes of projectiles. Thin-Walled Struct. 2018, 123, 1–10. [Google Scholar] [CrossRef]
- Gao, X.; Zhang, T.; Hayden, M.; Roe, C. Effects of the stress state on plasticity and ductile failure of an aluminum 5083 alloy. Int. J. Plast. 2009, 25, 2366–2382. [Google Scholar] [CrossRef]
- Xue, L. Damage accumulation and fracture initiation in uncracked ductile solids subject to triaxial loading. Int. J. Solids Struct. 2007, 44, 5163–5181. [Google Scholar] [CrossRef]
- Wierzbicki, T.; Bao, Y.; Lee, Y.-W.; Bai, Y. Calibration and evaluation of seven fracture models. Int. J. Mech. Sci. 2005, 47, 719–743. [Google Scholar] [CrossRef]
- Xue, L. Ductile Fracture Modeling—Theory, Experimental Investigation and Numerical Verification; Massachusetts Institute of Technology: Cambridge, MA, USA, 2007. [Google Scholar]
- Graham, S.M.; Zhang, T.; Gao, X.; Hayden, M. Development of a combined tension–torsion experiment for calibration of ductile fracture models under conditions of low triaxiality. Int. J. Mech. Sci. 2012, 54, 172–181. [Google Scholar] [CrossRef]
- Bao, Y. Dependence of ductile crack formation in tensile tests on stress triaxiality, stress and strain ratios. Eng. Fract. Mech. 2005, 72, 505–522. [Google Scholar] [CrossRef]
- Bao, Y.; Wierzbicki, T. Prediction of Ductile Crack Formation in Uncracked Bodies; Massachussetts Institute of Technology: Cambridge, MA, USA, 2003. [Google Scholar]
- Gao, X.; Zhang, G.; Roe, C. A Study on the Effect of the Stress State on Ductile Fracture. Int. J. Damage Mech. 2010, 19, 75–94. [Google Scholar] [CrossRef]
- Zhou, J.; Hayden, M.; Gao, X. An investigation of the strain rate and temperature effects on the plastic flow stress and ductile failure strain of aluminum alloys 5083-H116, 6082-T6 and a 5183 weld metal. Proc. Inst. Mech. Eng. Part C J. Mech. Eng. Sci. 2012. [Google Scholar] [CrossRef]
- Bai, Y.; Teng, X.; Wierzbicki, T. On the Application of Stress Triaxiality Formula for Plane Strain Fracture Testing. J. Eng. Mater. Technol. 2009, 131, 021002. [Google Scholar] [CrossRef]
- Garcia-Gonzalez, D.; Rodriguez-Millan, M.; Rusinek, A.; Arias, A. Investigation of mechanical impact behavior of short carbon-fiber-reinforced PEEK composites. Compos. Struct. 2015, 133, 1116–1126. [Google Scholar] [CrossRef] [Green Version]
- Garcia-Gonzalez, D.; Rodriguez-Millan, M.; Rusinek, A.; Arias, A. Low temperature effect on impact energy absorption capability of PEEK composites. Compos. Struct. 2015, 134, 440–449. [Google Scholar] [CrossRef]
- Rodríguez-Martínez, J.A.; Rusinek, A.; Pesci, R.; Zaera, R. Experimental and numerical analysis of the martensitic transformation in AISI 304 steel sheets subjected to perforation by conical and hemispherical projectiles. Int. J. Solids Struct. 2012. [Google Scholar] [CrossRef] [Green Version]
- Teng, X.; Wierzbicki, T.; Hiermaier, S.; Rohr, I. Numerical prediction of fracture in the Taylor test. Int. J. Solids Struct. 2005, 42, 2929–2948. [Google Scholar] [CrossRef]
- Zhou, J.; Gao, X.; Hayden, M.; Joyce, J.A. Modeling the Ductile Fracture Behavior of an Aluminum Alloy 5083-H116 Including the Residual Stress Effect. Eng. Fract. Mech. 2012, 85, 103–116. [Google Scholar] [CrossRef]
- Zhou, J. Numerical Modeling of Ductile Fracture; University of Akron: Akron, OH, USA, 2013. [Google Scholar]
- Børvik, T.; Langseth, M.; Hopperstad, O.S.S.; Malo, K.A.; Berstad, T. Perforation of 12 mm thick steel plates by 20 mm diameter projectiles with flat, hemispherical and conical noses Part II: Numerical simulations. Int. J. Impact Eng. 2002, 27, 37–64. [Google Scholar] [CrossRef]
- Gupta, N.K.; Iqbal, M.A.; Sekhon, G.S. Experimental and numerical studies on the behavior of thin aluminum plates subjected to impact by blunt- and hemispherical-nosed projectiles. Int. J. Impact Eng. 2006, 32, 1921–1944. [Google Scholar] [CrossRef]
- Arias, A.; Rodríguez-Martínez, J.A.; Rusinek, A. Numerical simulations of impact behavior of thin steel plates subjected to cylindrical, conical and hemispherical non-deformable projectiles. Eng. Fract. Mech. 2008, 75, 1635–1656. [Google Scholar] [CrossRef] [Green Version]
- Rodríguez-Martínez, J.A.; Rusinek, A.; Arias, A.; Rodríguez-Martínez, A.; Rusinek, A.A. Thermo-viscoplastic behavior of 2024-T3 aluminum sheets subjected to low velocity perforation at different temperatures. Thin-Walled Struct. 2010, 47, 1268–1284. [Google Scholar] [CrossRef] [Green Version]
- Recht, R.F.; Ipson, T.W. Ballistic Perforation Dynamics. J. Appl. Mech. 1963, 30, 384–390. [Google Scholar] [CrossRef]
Figure 1.
Conceptual representation of the stress states on the plane of stress triaxiality and Lode parameter.
Figure 1.
Conceptual representation of the stress states on the plane of stress triaxiality and Lode parameter.
Figure 2.
Stress-strain curves of aluminum alloys used.
Figure 3.
(a) Geometry and dimensions of DNT specimen; (b) numerical model of DNT specimen.
Figure 4.
Contour plot of plastic strain at failure, stress triaxiality and Lode parameter in the notch region for the three different aluminum alloys.
Figure 4.
Contour plot of plastic strain at failure, stress triaxiality and Lode parameter in the notch region for the three different aluminum alloys.
Figure 5.
Experimental results. The final stage of the tension–torsion process for different loading conditions. (a) Detail of the notch, (b) AA 2024-T351, (c) AA 6082-T6, and (d) AA 5754-H111.
Figure 5.
Experimental results. The final stage of the tension–torsion process for different loading conditions. (a) Detail of the notch, (b) AA 2024-T351, (c) AA 6082-T6, and (d) AA 5754-H111.
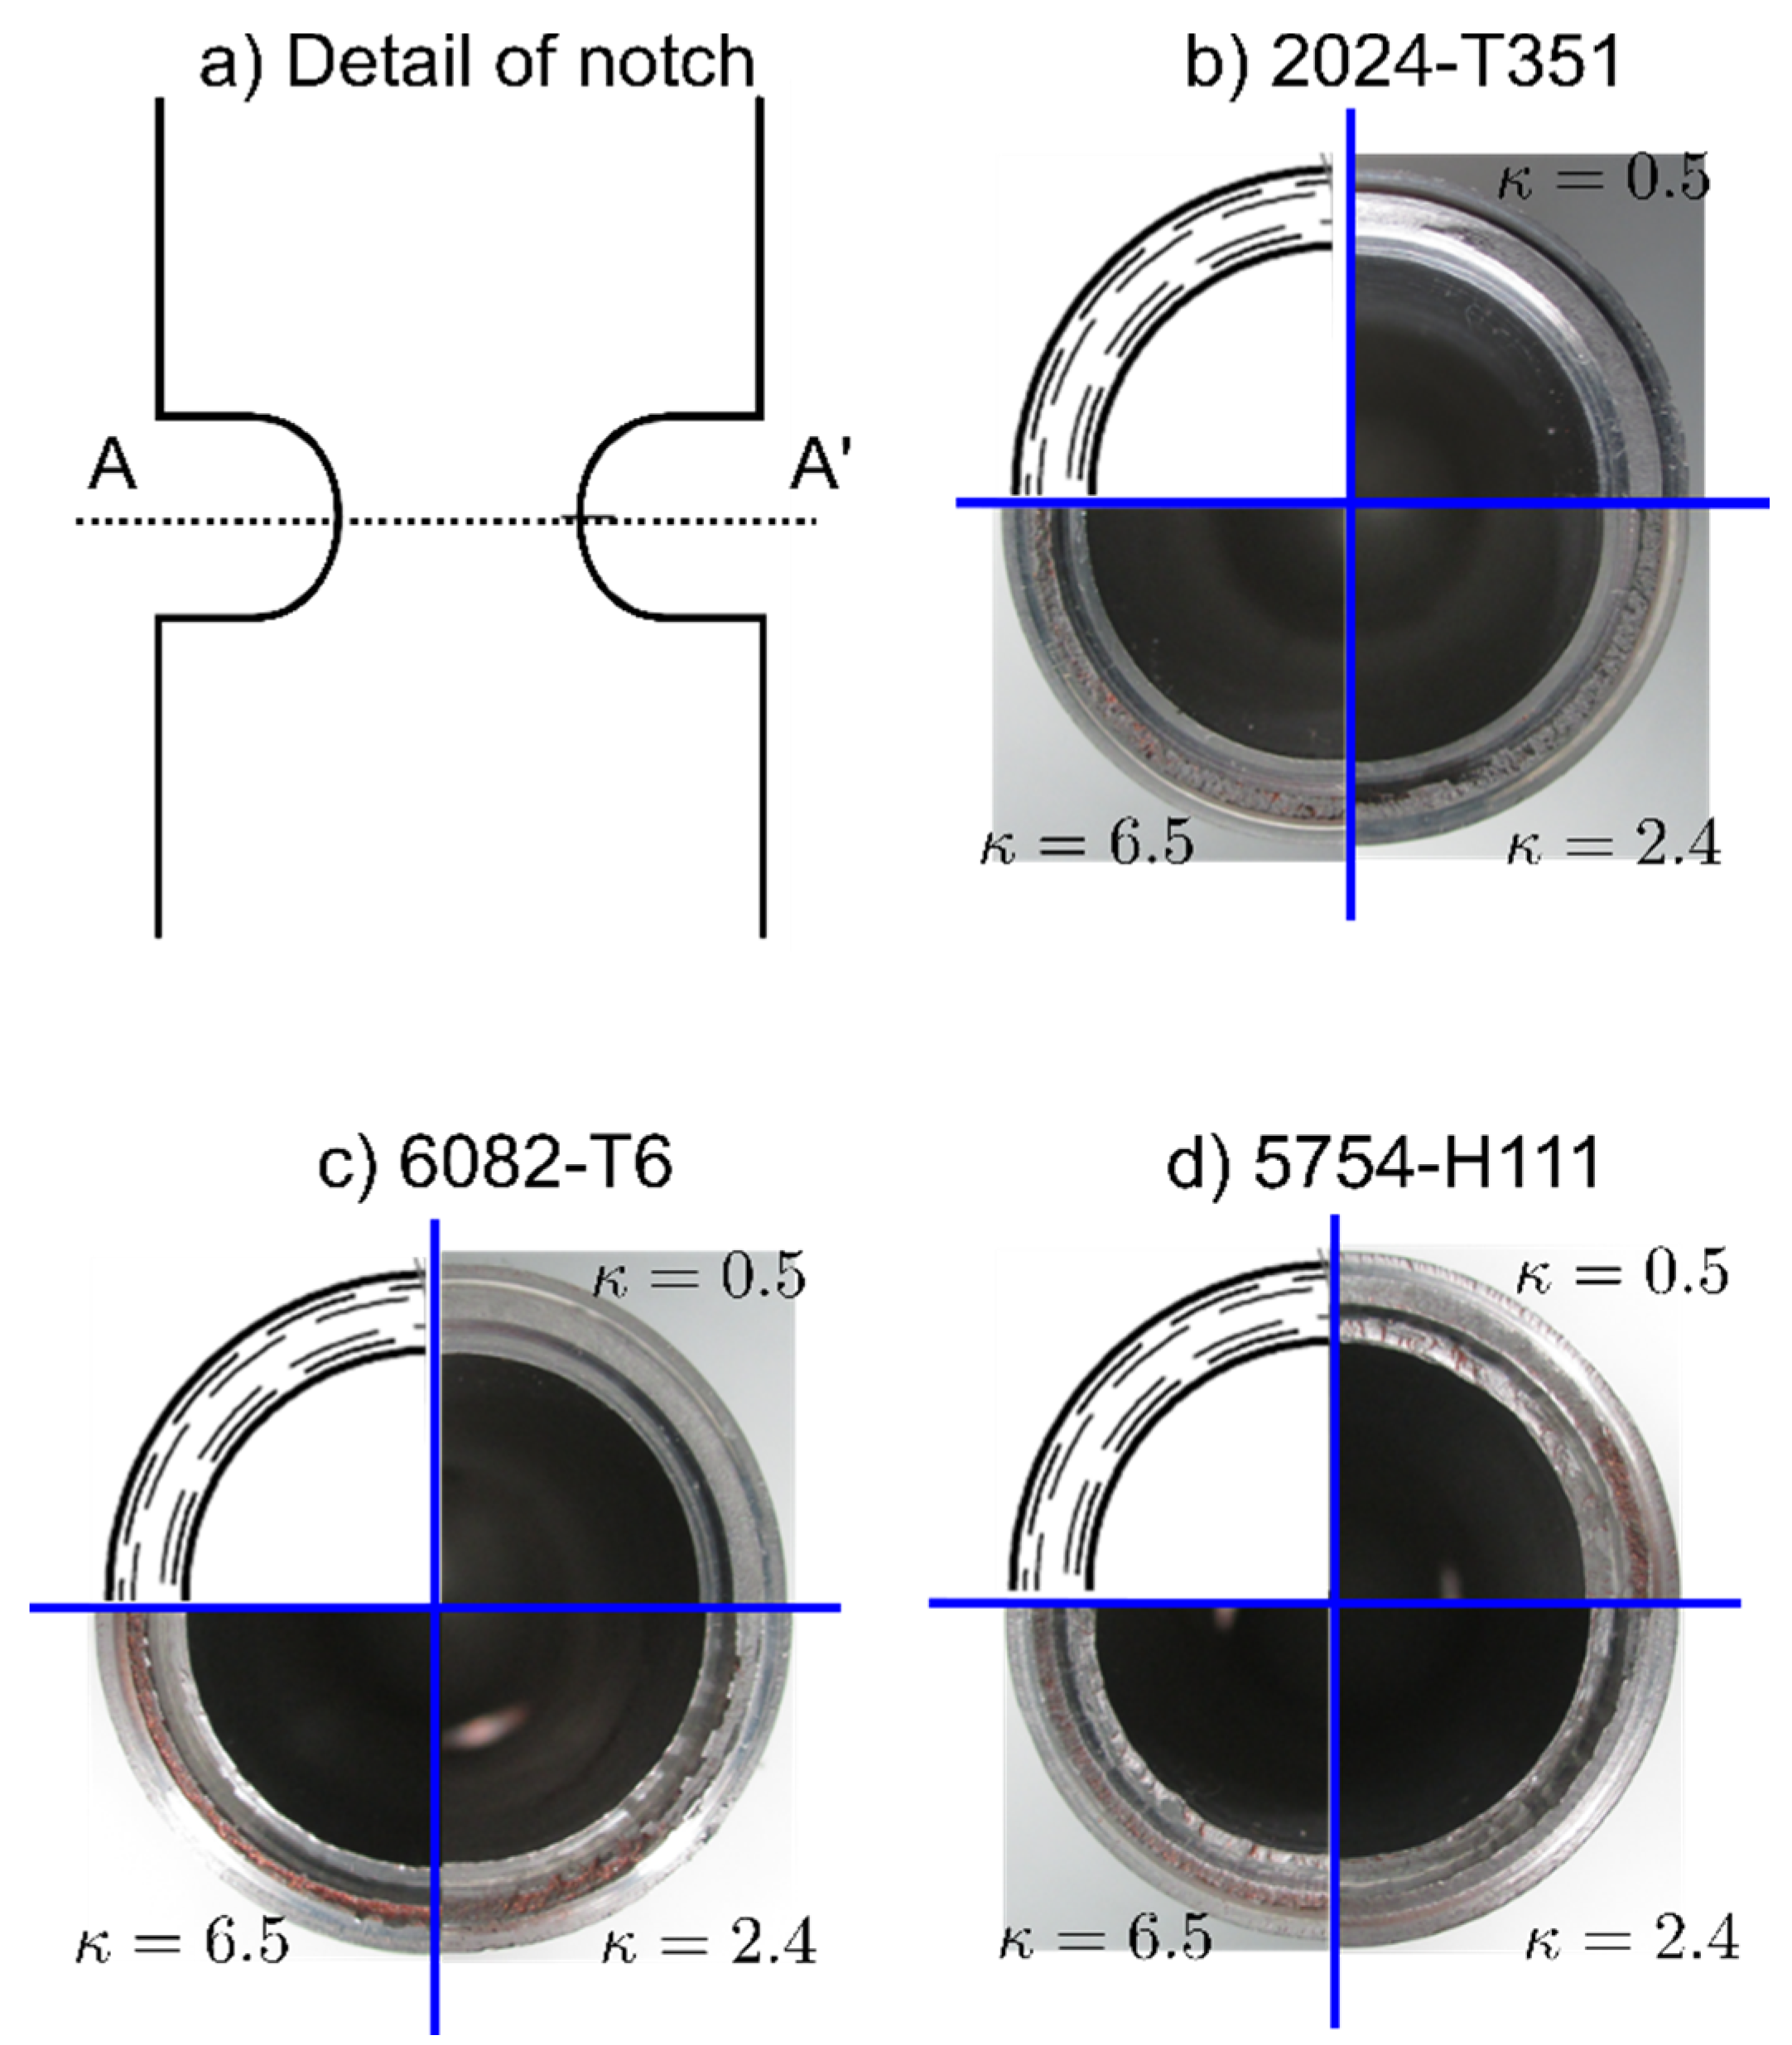
Figure 6.
Failure locus on the space of equivalent plastic strain versus: (a) stress triaxiality; (b) Lode parameter.
Figure 6.
Failure locus on the space of equivalent plastic strain versus: (a) stress triaxiality; (b) Lode parameter.
Figure 7.
3D plot of strain failure versus stress triaxiality and Lode parameter for: (a) AA 2024-T351; (b) AA 5754-H111; (c) AA 6082-T6.
Figure 7.
3D plot of strain failure versus stress triaxiality and Lode parameter for: (a) AA 2024-T351; (b) AA 5754-H111; (c) AA 6082-T6.
Figure 8.
(a) Scheme of experimental set up used for perforation test. Geometry and dimensions (mm) of the projectiles used in the perforation test: (b) blunt projectile; (c) spherical projectile.
Figure 8.
(a) Scheme of experimental set up used for perforation test. Geometry and dimensions (mm) of the projectiles used in the perforation test: (b) blunt projectile; (c) spherical projectile.
Figure 9.
High-speed camera sequence of the impact process to obtain Vo and Vr. (a) and (b) before impact imagens and; (c) and (d) after impact imagens.
Figure 9.
High-speed camera sequence of the impact process to obtain Vo and Vr. (a) and (b) before impact imagens and; (c) and (d) after impact imagens.
Figure 10.
Target mesh used in the numerical simulations.
Figure 11.
Comparison of residual velocity versus impact velocity for the three aluminum alloys studied: (a) spherical projectile and 4 mm thick plates; (b) blunt projectile and 4 mm thick plates; (c) spherical projectile and 1 mm thick plates.
Figure 11.
Comparison of residual velocity versus impact velocity for the three aluminum alloys studied: (a) spherical projectile and 4 mm thick plates; (b) blunt projectile and 4 mm thick plates; (c) spherical projectile and 1 mm thick plates.
Figure 12.
Experimental results: spherical steel projectile configuration. The final stage of the impact process for: (a) AA 6082-T6; (b) AA 5754-H111; (c) AA2024-T351.
Figure 12.
Experimental results: spherical steel projectile configuration. The final stage of the impact process for: (a) AA 6082-T6; (b) AA 5754-H111; (c) AA2024-T351.
Figure 13.
Experimental results: blunt projectile configuration. The final stage of the impact process for: (a) AA 6082-T6; (b) AA 5754-H111; (c) AA2024-T351.
Figure 13.
Experimental results: blunt projectile configuration. The final stage of the impact process for: (a) AA 6082-T6; (b) AA 5754-H111; (c) AA2024-T351.
Figure 14.
Spherical projectile configuration. Thickness = 4 mm. Comparison of residual velocity Vr versus impact velocity V0 between experiments and numerical simulations for: (a) AA 5754-H111; (b) AA 6082-T6; (c) AA 2024-T351.
Figure 14.
Spherical projectile configuration. Thickness = 4 mm. Comparison of residual velocity Vr versus impact velocity V0 between experiments and numerical simulations for: (a) AA 5754-H111; (b) AA 6082-T6; (c) AA 2024-T351.
Figure 15.
Spherical projectile configuration. Thickness = 1 mm. Comparison of residual velocity Vr versus impact velocity V0 between experiments and numerical simulations for: (a) AA 5754-H111; (b) AA 6082-T6; (c) AA 2024-T351.
Figure 15.
Spherical projectile configuration. Thickness = 1 mm. Comparison of residual velocity Vr versus impact velocity V0 between experiments and numerical simulations for: (a) AA 5754-H111; (b) AA 6082-T6; (c) AA 2024-T351.
Figure 16.
Blunt projectile configuration. Thickness = 4 mm. Comparison of residual velocity Vr versus impact velocity V0 between experiments and numerical simulations for: (a) AA 5754-H111; (b) AA 6082-T6; (c) AA 2024-T351.
Figure 16.
Blunt projectile configuration. Thickness = 4 mm. Comparison of residual velocity Vr versus impact velocity V0 between experiments and numerical simulations for: (a) AA 5754-H111; (b) AA 6082-T6; (c) AA 2024-T351.
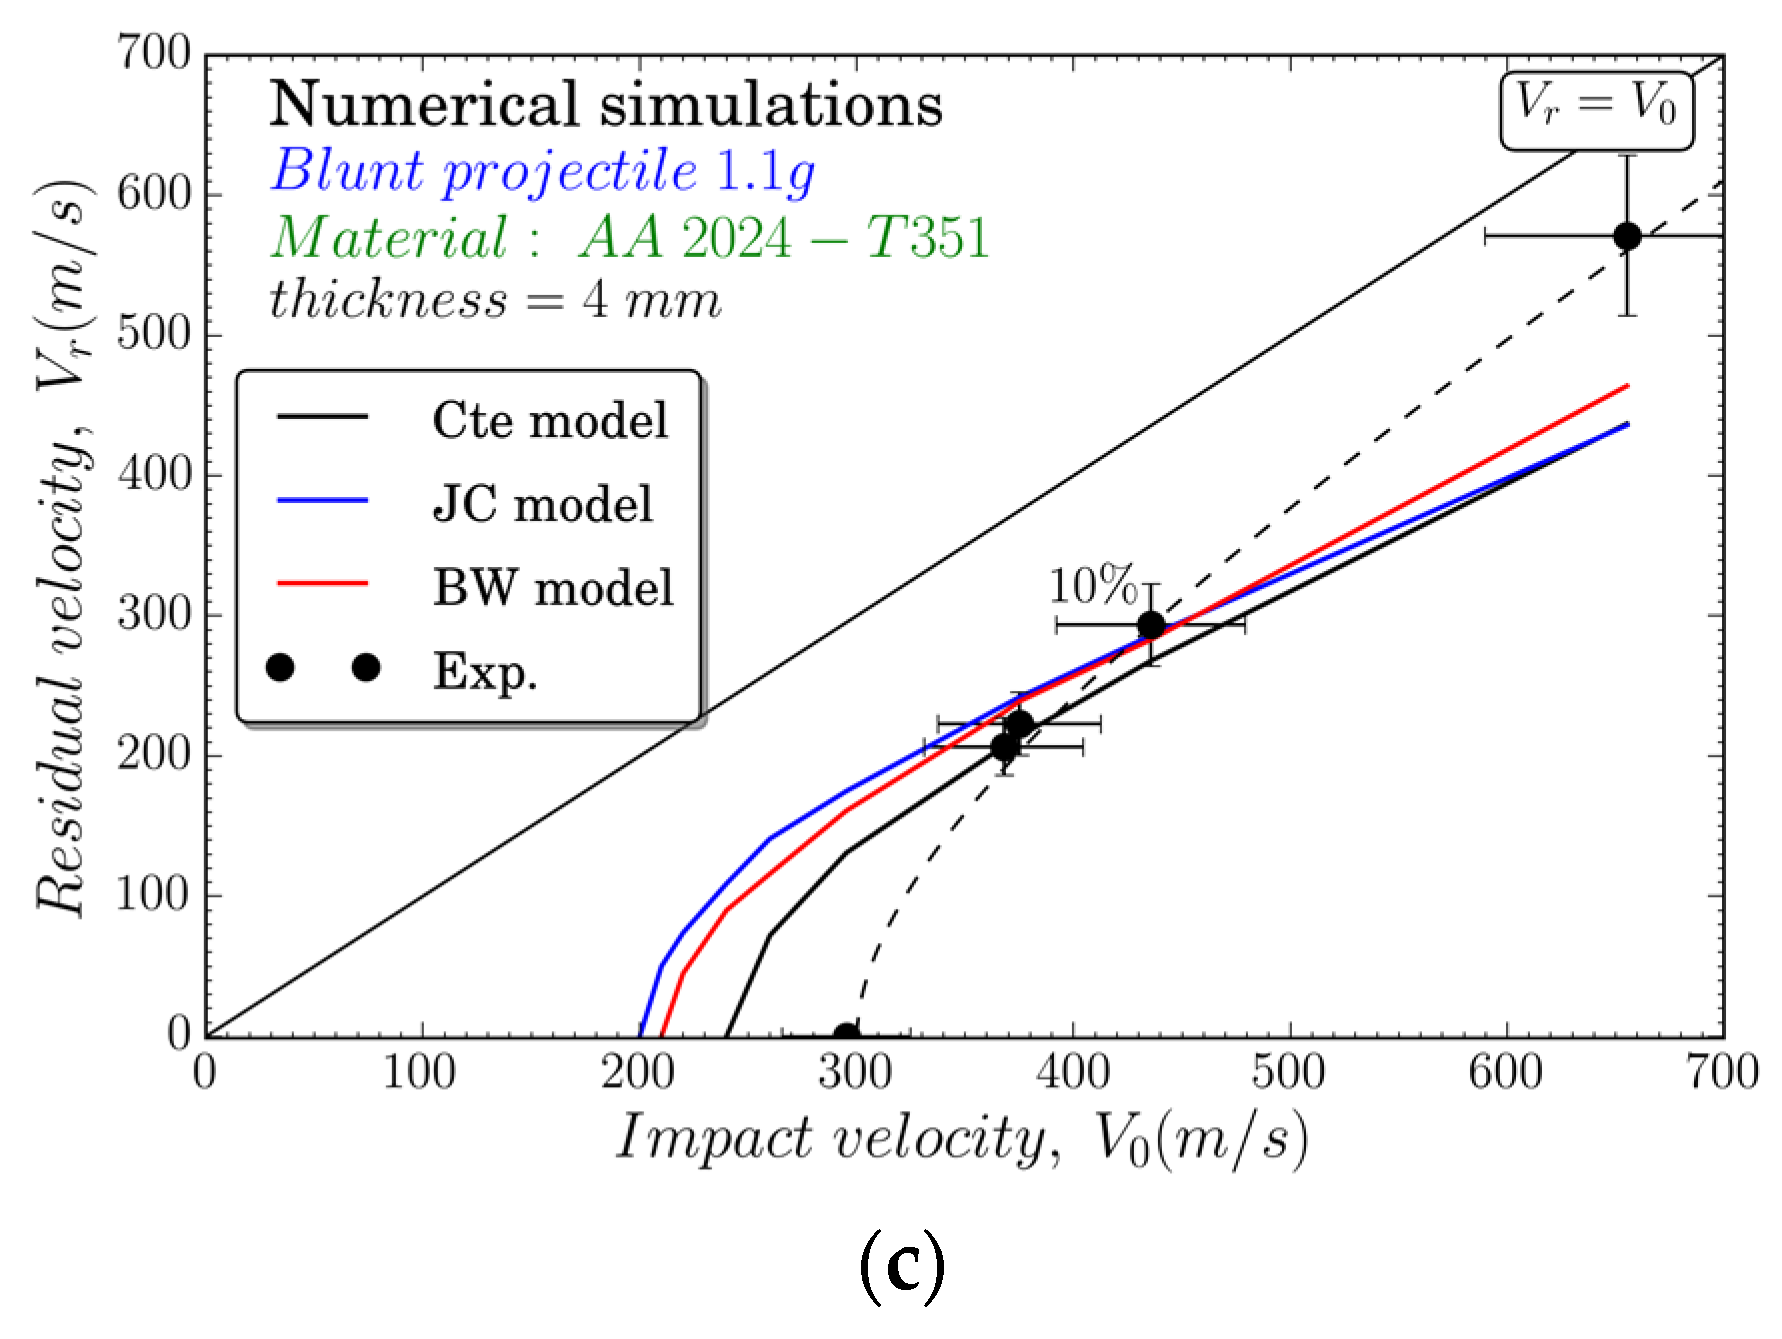
Figure 17.
Details of the failure mode of targets impacted by spherical steel projectiles: (a) AA 5754-H111; (b) AA 6082-T6; (c) AA 2024-T351.
Figure 17.
Details of the failure mode of targets impacted by spherical steel projectiles: (a) AA 5754-H111; (b) AA 6082-T6; (c) AA 2024-T351.

Figure 18.
Details of the failure mode of targets impacted by blunt projectiles: (a) AA 5754-H111; (b) AA 6082-T6; and (c) AA 2024-T351.
Figure 18.
Details of the failure mode of targets impacted by blunt projectiles: (a) AA 5754-H111; (b) AA 6082-T6; and (c) AA 2024-T351.
Figure 19.
Ballistic limit velocity versus projectile nose shape for the three materials tested.

Table 1.
Chemical composition of AA 5754-H111, AA 6082-T6, and AA 2024-T351 (% by weight)
| Material | Mn | Si | Cr | Fe | Cu | Zn | Ti | Mg | Ni |
|---|---|---|---|---|---|---|---|---|---|
| AA 5754-H111 | 0.260 | 0.290 | 0.030 | 0.320 | 0.040 | 0.020 | 0.030 | 2.8 | - |
| AA 6082-T6 | 0.450 | 0.990 | 0.030 | 0.410 | 0.080 | 0.040 | 0.030 | 0.730 | 0.010 |
| AA 2024-T351 | 0.3–0.9 | 0.500 | 0.1 | 0.500 | 3.8–4.9 | 0.25 | 0.15 | 1.2–1.8 | - |
Table 2.
Material properties and Johnson–Cook parameters of aluminum alloys
| Parameter | AA 2024-T351 | AA 5754-H11 | AA 6082-T6 |
|---|---|---|---|
| Elasticity | |||
| 70 | 68 | 70 | |
| 0.3 | 0.3 | 0.3 | |
| Thermoviscoplastic behavior | |||
| 352 | 28.13 | 201.55 | |
| 440 | 278.67 | 250.87 | |
| 0.42 | 0.183 | 0.206 | |
| 3.3 × 10⁻⁴ | 0.1 | 0.001 | |
| 0.0083 | 0.00439 | 0.00977 | |
| 1.7 | 2.527 | 1.31 | |
| Other physical constants | |||
| 2700 | 2700 | 2700 | |
| 0.9 | 0.9 | 0.9 | |
| 900 | 900 | 900 | |
| 293 | 293 | 293 | |
| 775 | 873 | 855 | |
Table 3.
Bai–Wierzbicki parameters of aluminum alloys.
| Parameters | AA 2024-T351 | AA 5754-H11 | AA 6082-T6 |
|---|---|---|---|
| 0.42 | 0.52 | 0.12 | |
| 0.61 | 0 | 0 | |
| 0.21 | 0.41 | 0.16 | |
| 0.0013 | 0 | 0.69 |
Table 4.
Critical plastic deformations for each combination of projectile shape and material tested
| Projectile | AA 2024-T351 | AA 5754-H111 | AA 6082-T6 |
|---|---|---|---|
| Spherical | 0.51 | 1.5 | 0.74 |
| Blunt | 0.28 | 0.6 | 0.36 |
Table 5.
Johnson-Cook failure model parameters
| Parameter | AA 2024-T351 | AA 5754-H111 | AA 6082-T6 |
|---|---|---|---|
| 0.13 | −0.20 | 0.0164 | |
| 0.13 | 1.133 | 2.245 | |
| −1.5 | −0.229 | −2.798 | |
| 0.011 | 0.0897 | 0.007 | |
| 0 | 7.978 | 3.65 |
© 2018 by the authors. Licensee MDPI, Basel, Switzerland. This article is an open access article distributed under the terms and conditions of the Creative Commons Attribution (CC BY) license (http://creativecommons.org/licenses/by/4.0/).
Share and Cite
MDPI and ACS Style
Rodriguez-Millan, M.; Garcia-Gonzalez, D.; Rusinek, A.; Arias, A. Influence of Stress State on the Mechanical Impact and Deformation Behaviors of Aluminum Alloys. Metals 2018, 8, 520. https://doi.org/10.3390/met8070520
AMA Style
Rodriguez-Millan M, Garcia-Gonzalez D, Rusinek A, Arias A. Influence of Stress State on the Mechanical Impact and Deformation Behaviors of Aluminum Alloys. Metals. 2018; 8(7):520. https://doi.org/10.3390/met8070520
Chicago/Turabian StyleRodriguez-Millan, Marcos, Daniel Garcia-Gonzalez, Alexis Rusinek, and Angel Arias. 2018. "Influence of Stress State on the Mechanical Impact and Deformation Behaviors of Aluminum Alloys" Metals 8, no. 7: 520. https://doi.org/10.3390/met8070520
Note that from the first issue of 2016, this journal uses article numbers instead of page numbers. See further details here.