1. Introduction
The Additive Manufacturing (AM) process is based on layer manufacturing without any additional tools or machining processes. Direct Metal Laser Sintering (DMLS) and Selective Laser Melting (SLM) are two promising Additive Manufacturing technologies. Both of them are powder bed-based technologies [
1,
2,
3,
4,
5,
6].
The concept of layered built parts dates from more than one century ago. AM enables manufacturing without tools, using just one AM machine fed by a CAD model. This is split into two-dimensional layers with constant thickness, by specific software; the layers can be regarded as areas that will be melted with proper thickness. Every new layer is fused with the previous one during the AM process. The part is progressively built, repeating this process until the last layer is stacked.
There are several AM technologies, depending on the handled material, on how the material is applied or fused, etc. Powder Bed technology is based on material application on the entire building surface; afterwards, the laser or electron beam melts the area that corresponds to the sliced surface. The process is repeated until part completion. Wire or powder feed technology is based on the step-by-step material application and melting until the surface that corresponds to the sliced layer is formed. In this case, the material is applied to the surface that is being manufactured only. A further classification of the AM techniques deals with the principle of material melting (laser beam, electro beam, electro-arc etc.). In almost all the technologies for AM of metal parts, the material is completely melted and bonding between layers is achieved during solidification. DMLS and SLM are nowadays quite close technologies [
5,
6]. A slight difference between them arises from the mechanism of powder fusion. In particular, in the case of SLM, a full melting occurs, whereas for DMLS, selective laser sintering causes the powder to fuse together. Anyway, they are commonly regarded as basically the same technique, being grouped under the powder bed fusion technologies according to the Standard [
7]. The aforementioned different acronyms mostly arise from different trademarks, which both aim at stressing the use of laser as power source.
At the early stages of development of these technologies, components after manufacturing were remarkably porous, as not full density could be achieved, due to partial fusion. The melting and sintering processes were different, and the processed materials were mainly based on Iron, Copper and Nickel alloy. Moreover, additional processing was mandatory, to achieve better density and fusion [
8,
9].
AM technologies are more and more used in the industrial field and are also attracting interest with regard to biomechanics. Using 3D CT scanners, it is possible to model custom implants that perfectly fit the person’s need [
10,
11,
12]. Materials with good bio-compatibility can be processed by AM, which gives them good potentials for dental and medical purposes [
13].
The layer-based manufacturing provides a particular microstructure affecting the build parts that is different from the casted structure of the same wrought material. In AM, material melting and cooling rates are very high. Fast melting is the result of high energy concentration, whereas fast cooling arises from the small amount of melted material with low surrounding temperature. This high temperature gradient usually induces high tensile residual stresses. Part building starts on thick steel plate (base-plate). The part can be built directly on the plate or with an additional support structure, stacked between the plate and the part. Its purpose is part constraining; moreover, it facilitates heat flow from the part during the scanning (melting) process. The support structure needs to be strong enough to efficiently restrain any kind of deformation that residual stress can cause. The generation of a residual stress state affecting the fabricated component is indeed a drawback of this process that is usually tackled by suitable heat or surface treatments. Machine manufacturers usually provide some data regarding the mechanical properties of AM built parts in the material datasheets [
14]. However, these mainly deal with static properties, such as ultimate tensile strength, yield strength, hardness, mechanical characteristics before and after ageing, etc. Therefore, there is a great interest towards the fatigue response and the impact of the post-manufacture treatments.
Maraging steel is one of the most promising materials, for use in Additive Manufacturing [
15]. Density of AM built parts are generally higher than 90%. The hardness of AM-built parts from Maraging Steel is incremented up to 50 HRC after the aging heat treatment, thus making it well comparable to that of wrought material [
14]. It has good mechanical properties, and it can be a good candidate for high-carbon steel substitution. It is resistant to corrosion and crack initiation during tempering and has good machinability [
16,
17,
18]. It has a relatively high ultimate tensile strength (UTS) after the heat treatment, around 2000 MPa. Therefore, it is a promising material to be used for structures operating under high states of load in many fields. The mentioned properties become more attractive, considering that AM technologies gives the chance to build a multi-part object as a single part [
19], making it possible to build monolithic complexly shaped components in small batches. Research contributions on the Fatigue limit (FL) and the fatigue strength (FS) of Maraging steel made by some of AM processes are quite limited, to the best of the authors’ knowledge. A recent study is presented in [
20]; however, this study is more devoted to the additively processed material performance under low-cycle, rather than to its high cycle fatigue response, depending on different build or post-process parameters. The present paper presents a follow-up of a previous research by the same authors [
21].
Components produced by AM can have different orientation with respect to the stacking direction of the layers. The aim of the previous research was to explore the effect of build orientation on the fatigue strength of Maraging Steel samples built by DMLS EOS M280 machine. The obtained results indicate that part orientation did not have significant effect on FS and FL when the parts were treated by micro-shot peening and heat treatment after the stacking process, thus meeting the powder producer recommendations. The components had then been machined with 0.5 mm allowance in order to get an optimal surface finishing. The aforementioned outcomes were also confirmed by the study [
22] involving the same material. A further research [
23] was then focused on Stainless Steel PH1 and led to a partial confirmation: some effect was observed in this case, probably due to different material properties and stacking parameters.
Literature studies dealing with the effects of the stacking process on the mechanical properties of the parts made by AM are few. Most research deals with the effects of the process parameters as well as of post-processing on tensile static strength [
24,
25,
26]. Few papers are concerned with the fatigue strength of Aluminium alloy [
27,
28,
29], Inconel alloy [
30], and Titanium alloy [
31]. Review papers have been written, trying to collect all the technologies and all the available mechanical testing results [
32]. However, a lack of consistency between the testing procedures and the obtained results can be noticed, when all these data are merged together.
There is nowadays an increasing interest in lowering down post-manufacturing expenses in AM, and in speeding up the process from design to installation. Sometimes, post-processing is not possible, for instance, when treating lattice structures, cooling channels in injection moulds or in turbine blades. In particular, machining or shot-peening cannot be performed on internal surfaces; on the other hand, running a heat treatment could be expensive and time-consuming. This interest is also explored by some recent studies [
6,
33,
34,
35] that have dealt with the fatigue properties of Ti-6Al-4V or Stainless Steels in their as-built states, or with the effects of post-manufacture treatments. An intensive study is needed to clarify if post-processing treatments, including machining or heat treatment, can be skipped and, if so, how the best compromise between costs and strength can be accomplished. This was the main motivation that led to this study, whose aim was to investigate the effects of heat treatment, machining, and shot-peening on the fatigue response of DMLS-built Maraging Steel vs. the as-fabricated state.
Issues of novelty arise from the lack of extensive campaigns involving this material in the scientific literature, dealing with its response in the as-built state and with the joint effects and, possibly, the interaction of the aforementioned post-manufacture part-processing strategies. A further issue of novelty arises from the use of an ANOVA-based statistical method. This makes it possible to compare the determined S-N curves in the finite life domain and to assess the significance of the aforementioned effects and interactions.
This topic has been tackled experimentally: for this purpose, an experimental campaign has been arranged as a factorial plane, with a total amount of five treatment combinations. Fatigue tests have been run on all the sample types, finally working out the fatigue curves in the finite life domain and the fatigue limits. These results have then been compared and discussed, based on statistical methods.
2. Materials and Methods
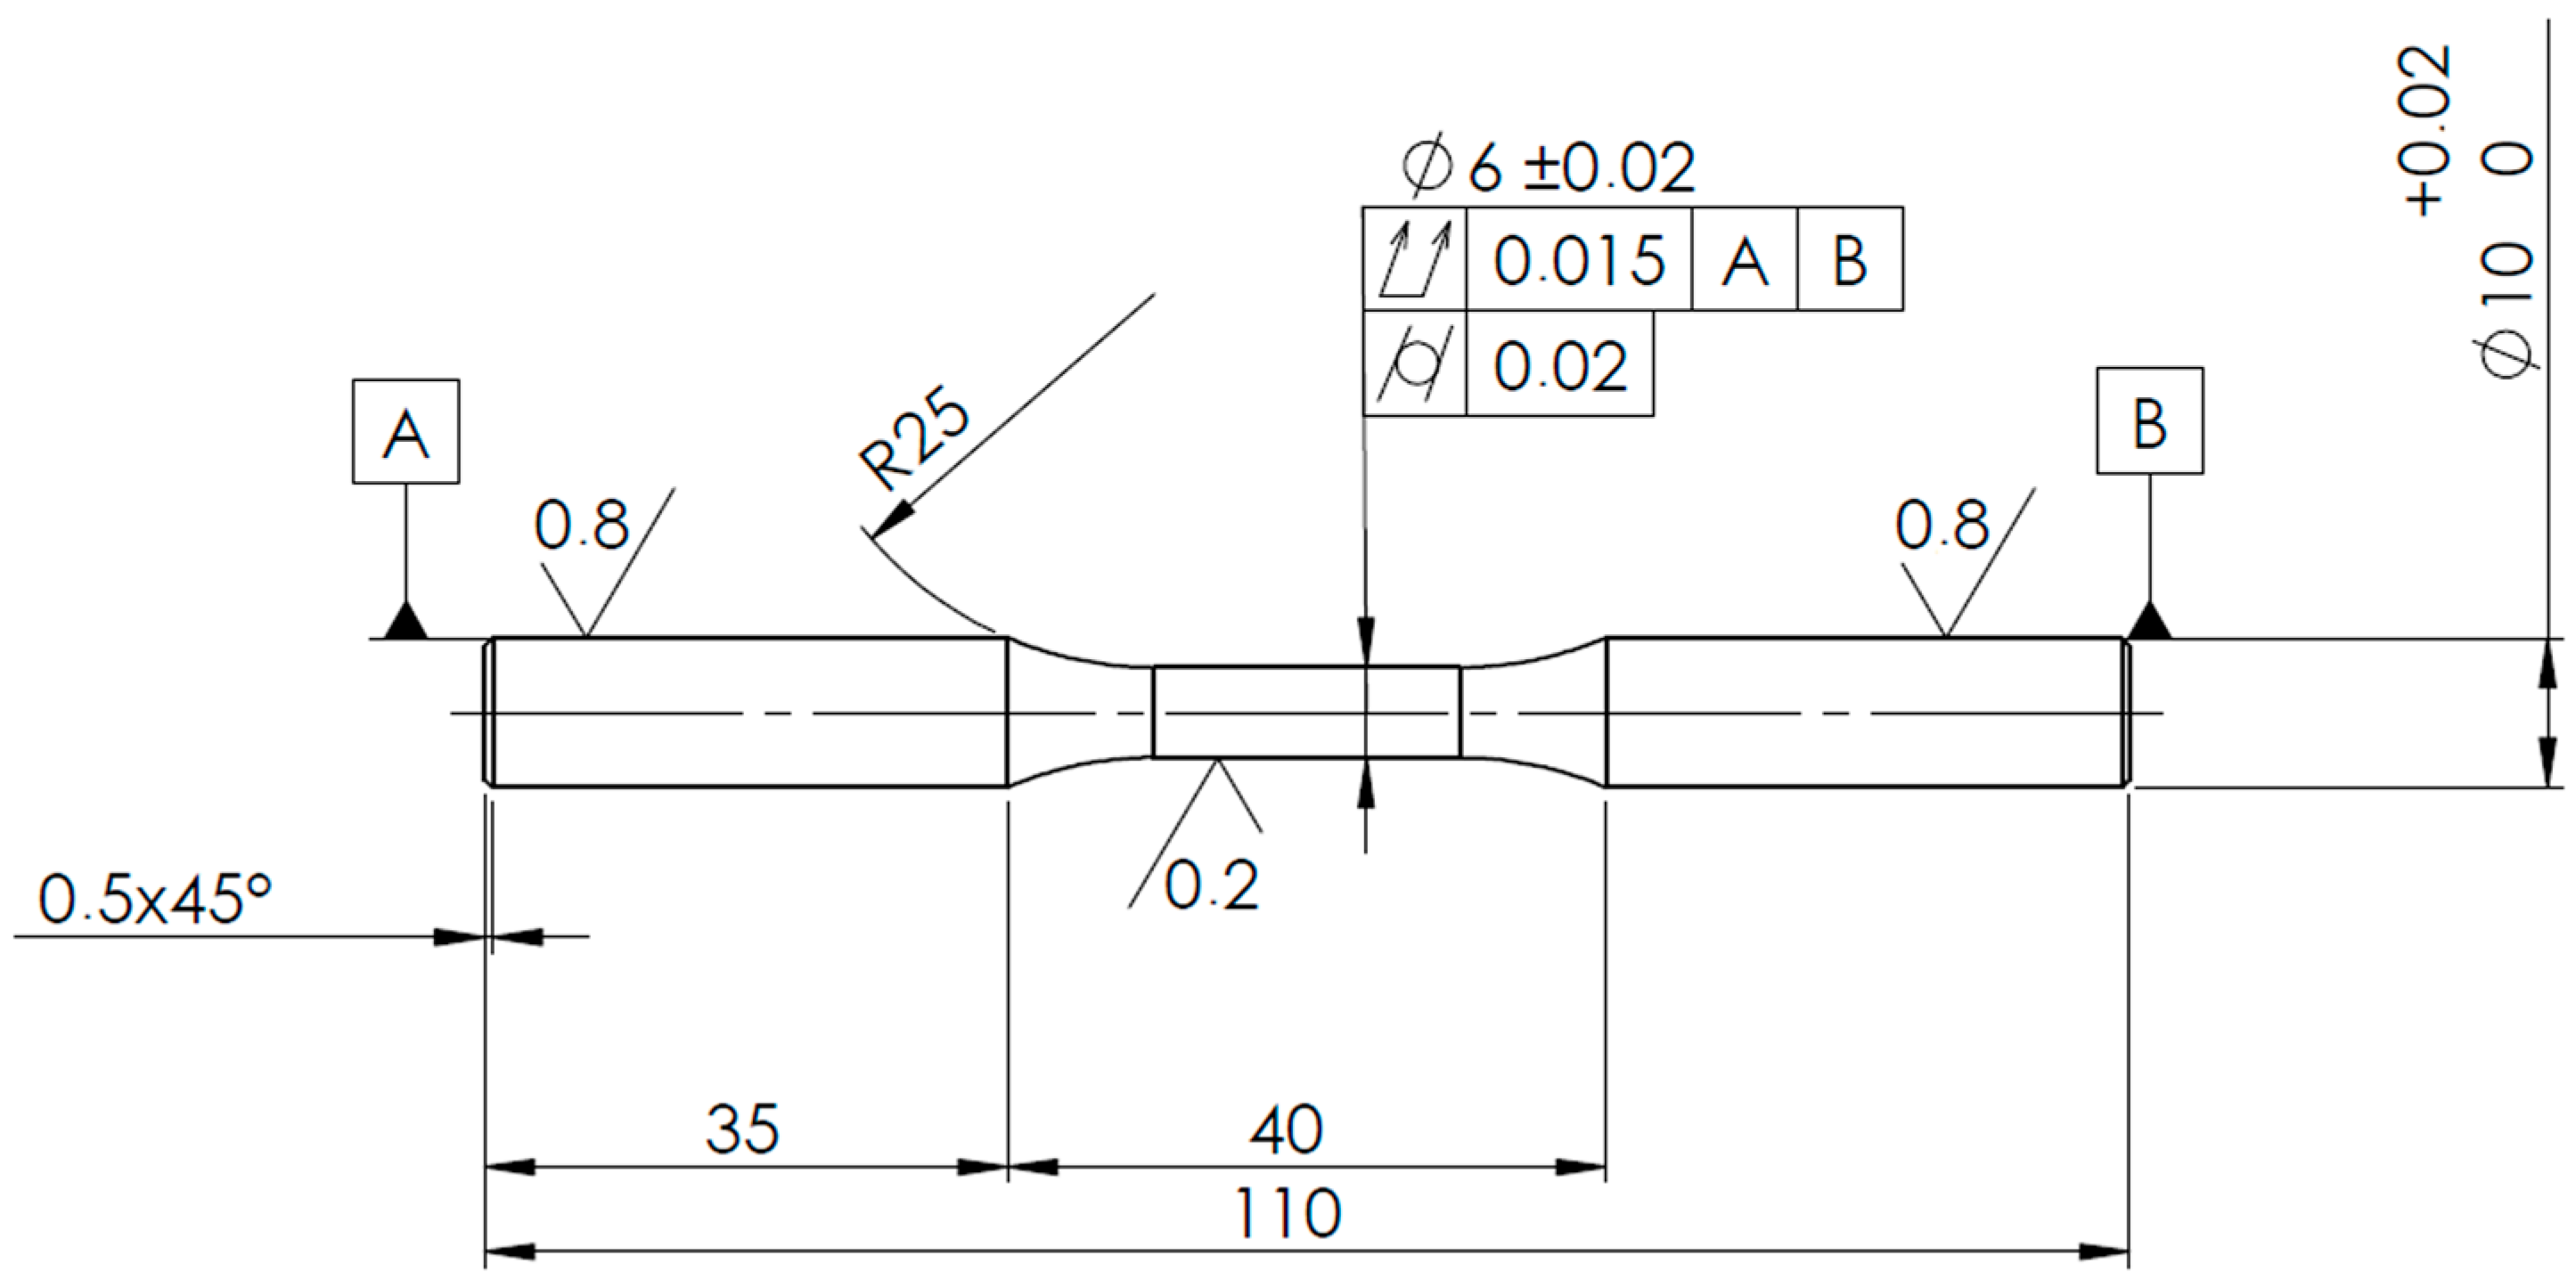
The testing procedure was based on ISO 1143 Standard for rotating bending fatigue testing [
36]. The Standard defines the testing procedure, the load scheme, and the specimen geometry. Specimens were designed with cylindrical smooth geometry with uniform 6 mm diameter at the gage. The smallest recommended dimension by the Standard has been chosen as the best compromise between Standard consistency and manufacturing costs. A sample drawing including its dimensions as well as dimensional and geometrical tolerances is shown in
Figure 1. It must be pointed out that the specification regarding surface quality was not considered for the “as built” condition, to properly account for the effect of machining.
The specimens have been manufactured by M280 DMLS machine (EOS GmbH—Electro Optical Systems, Krailling, Germany), equipped by Ytterbium fibre laser with 200 W power and emitting 0.2032 mm thickness and 1064 nm wavelength infrared light beam [
37]. Specimen material was MS1 Maraging steel MS1 (by EOS GmbH–Electro Optical Systems, Germany), equivalent to 1.2709 steel [
38] and also reported as 18% Ni Maraging 300 or AISI 18Ni300. The chemical composition of the material is provided in
Table 1. Specimen manufacturing was done in the processing chamber of the machine with working area of 250 × 250 mm in horizontal plane and with maximum building height up to 325 mm. The base plate was preheated to the temperature of 40 °C.
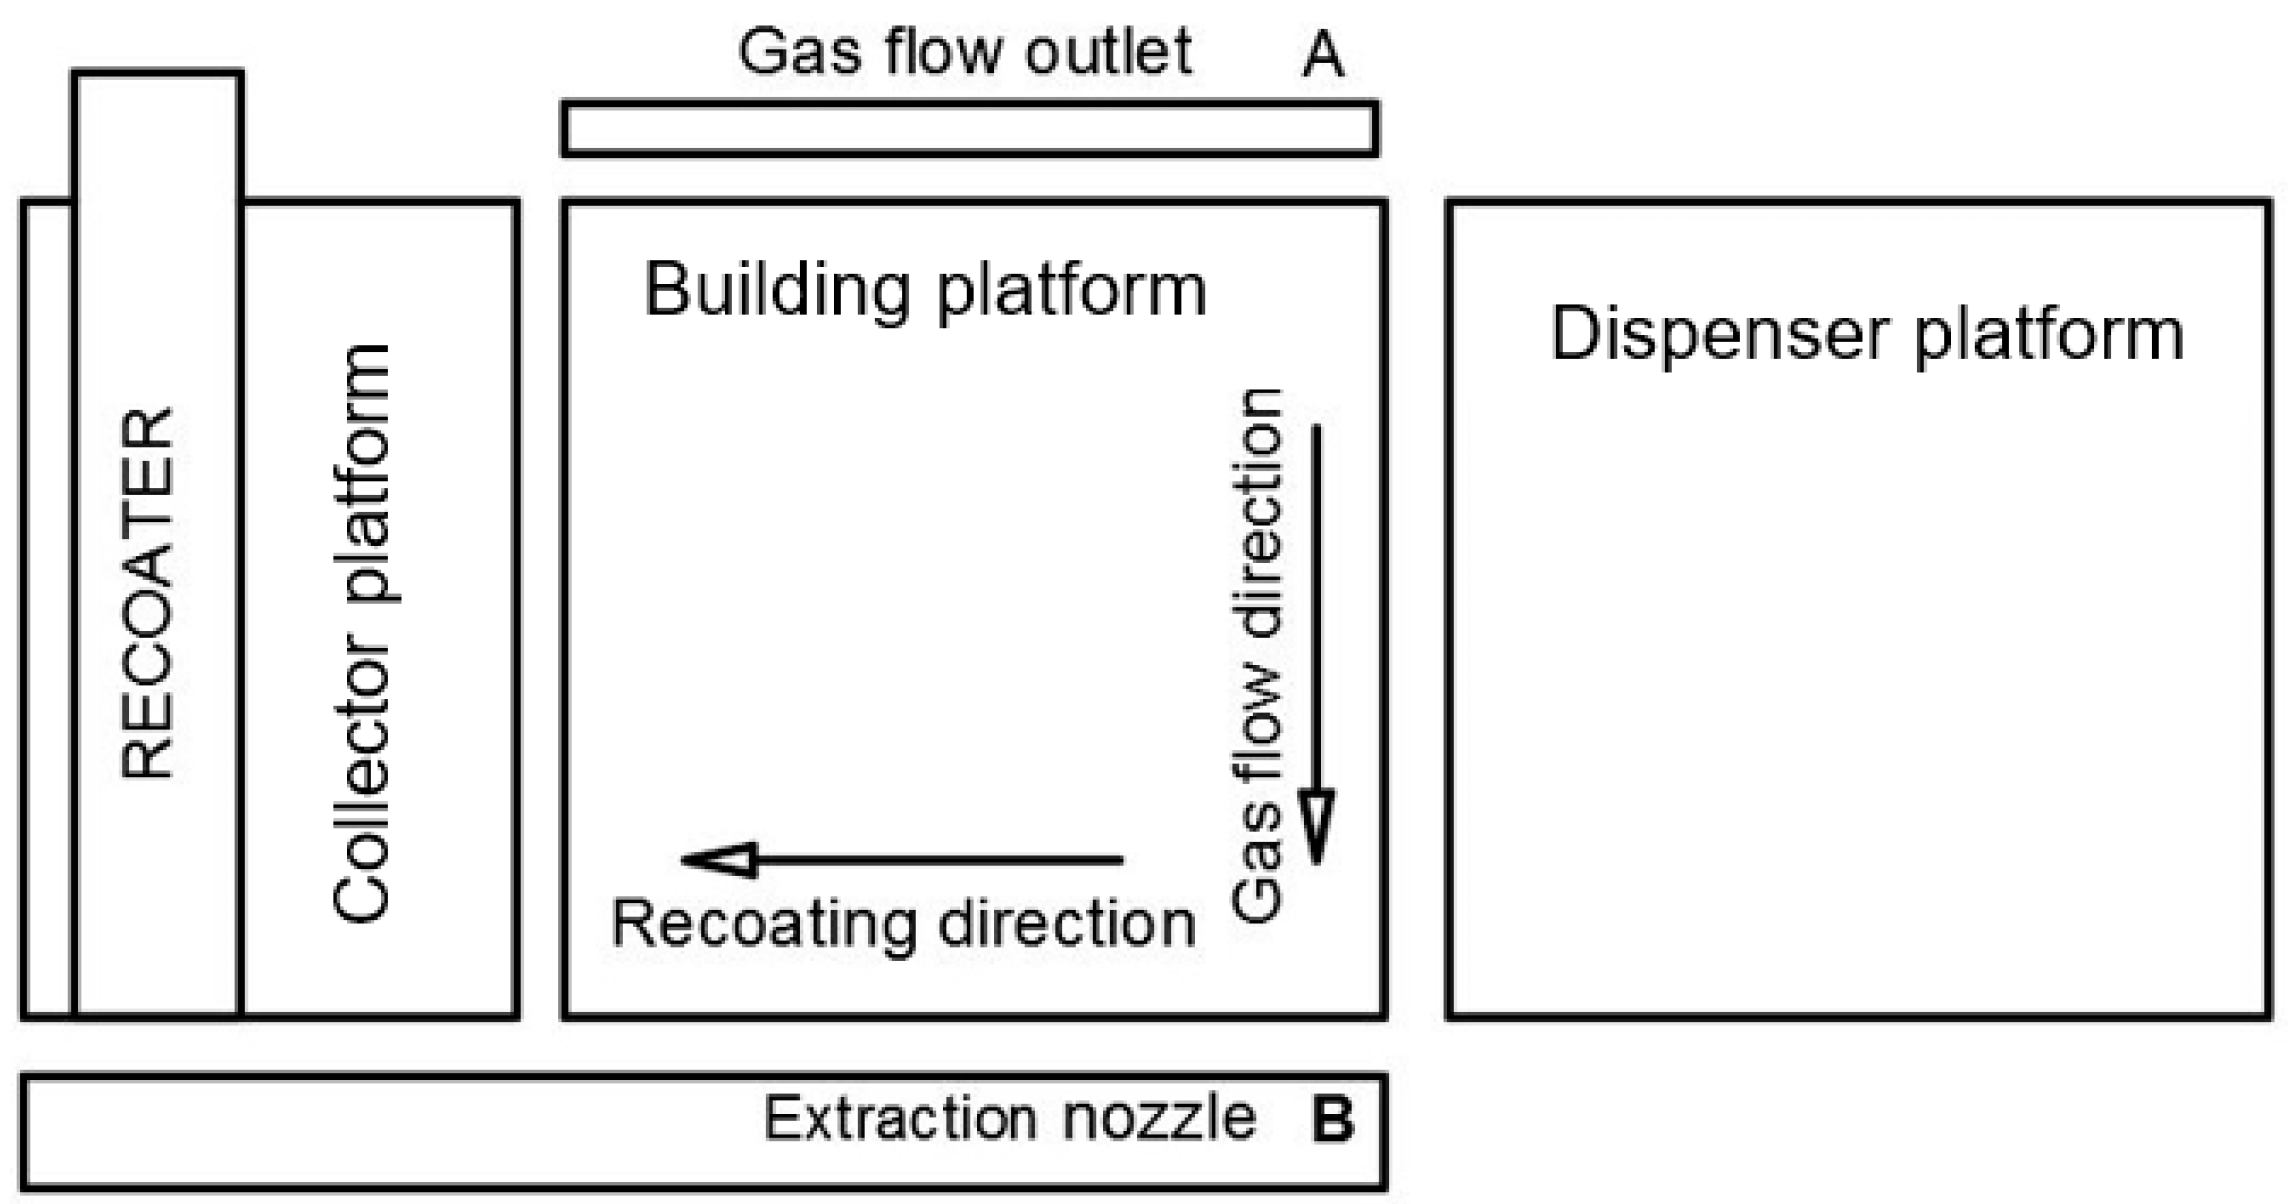
The Manufacturing process typically takes place in nitrogen inert atmosphere, generated from compressed air by nitrogen generator that is built inside the machine. The process chamber consists of three platforms and recoater: The Dispenser platform, where material powder is contained, the Building platform, on which the base plate is set and the building process is done, and the Collector platform for the collection of the excess material. A scheme of the building chamber is shown in
Figure 2.
The material was applied with 40 µm thickness that corresponds to the recommended layer thickness for MS1 Maraging Steel. The building parameters (laser speed, laser power, laser offset, layer thickness, etc.) of the EOSINT M280 for MS1 sample manufacturing were kept constant for all the stacking tasks. They were provided by the EOS as a predetermined set of parameters named “PERFORMANCE”. This parameter set can be regarded as a good compromise between surface quality and manufacturing speed.
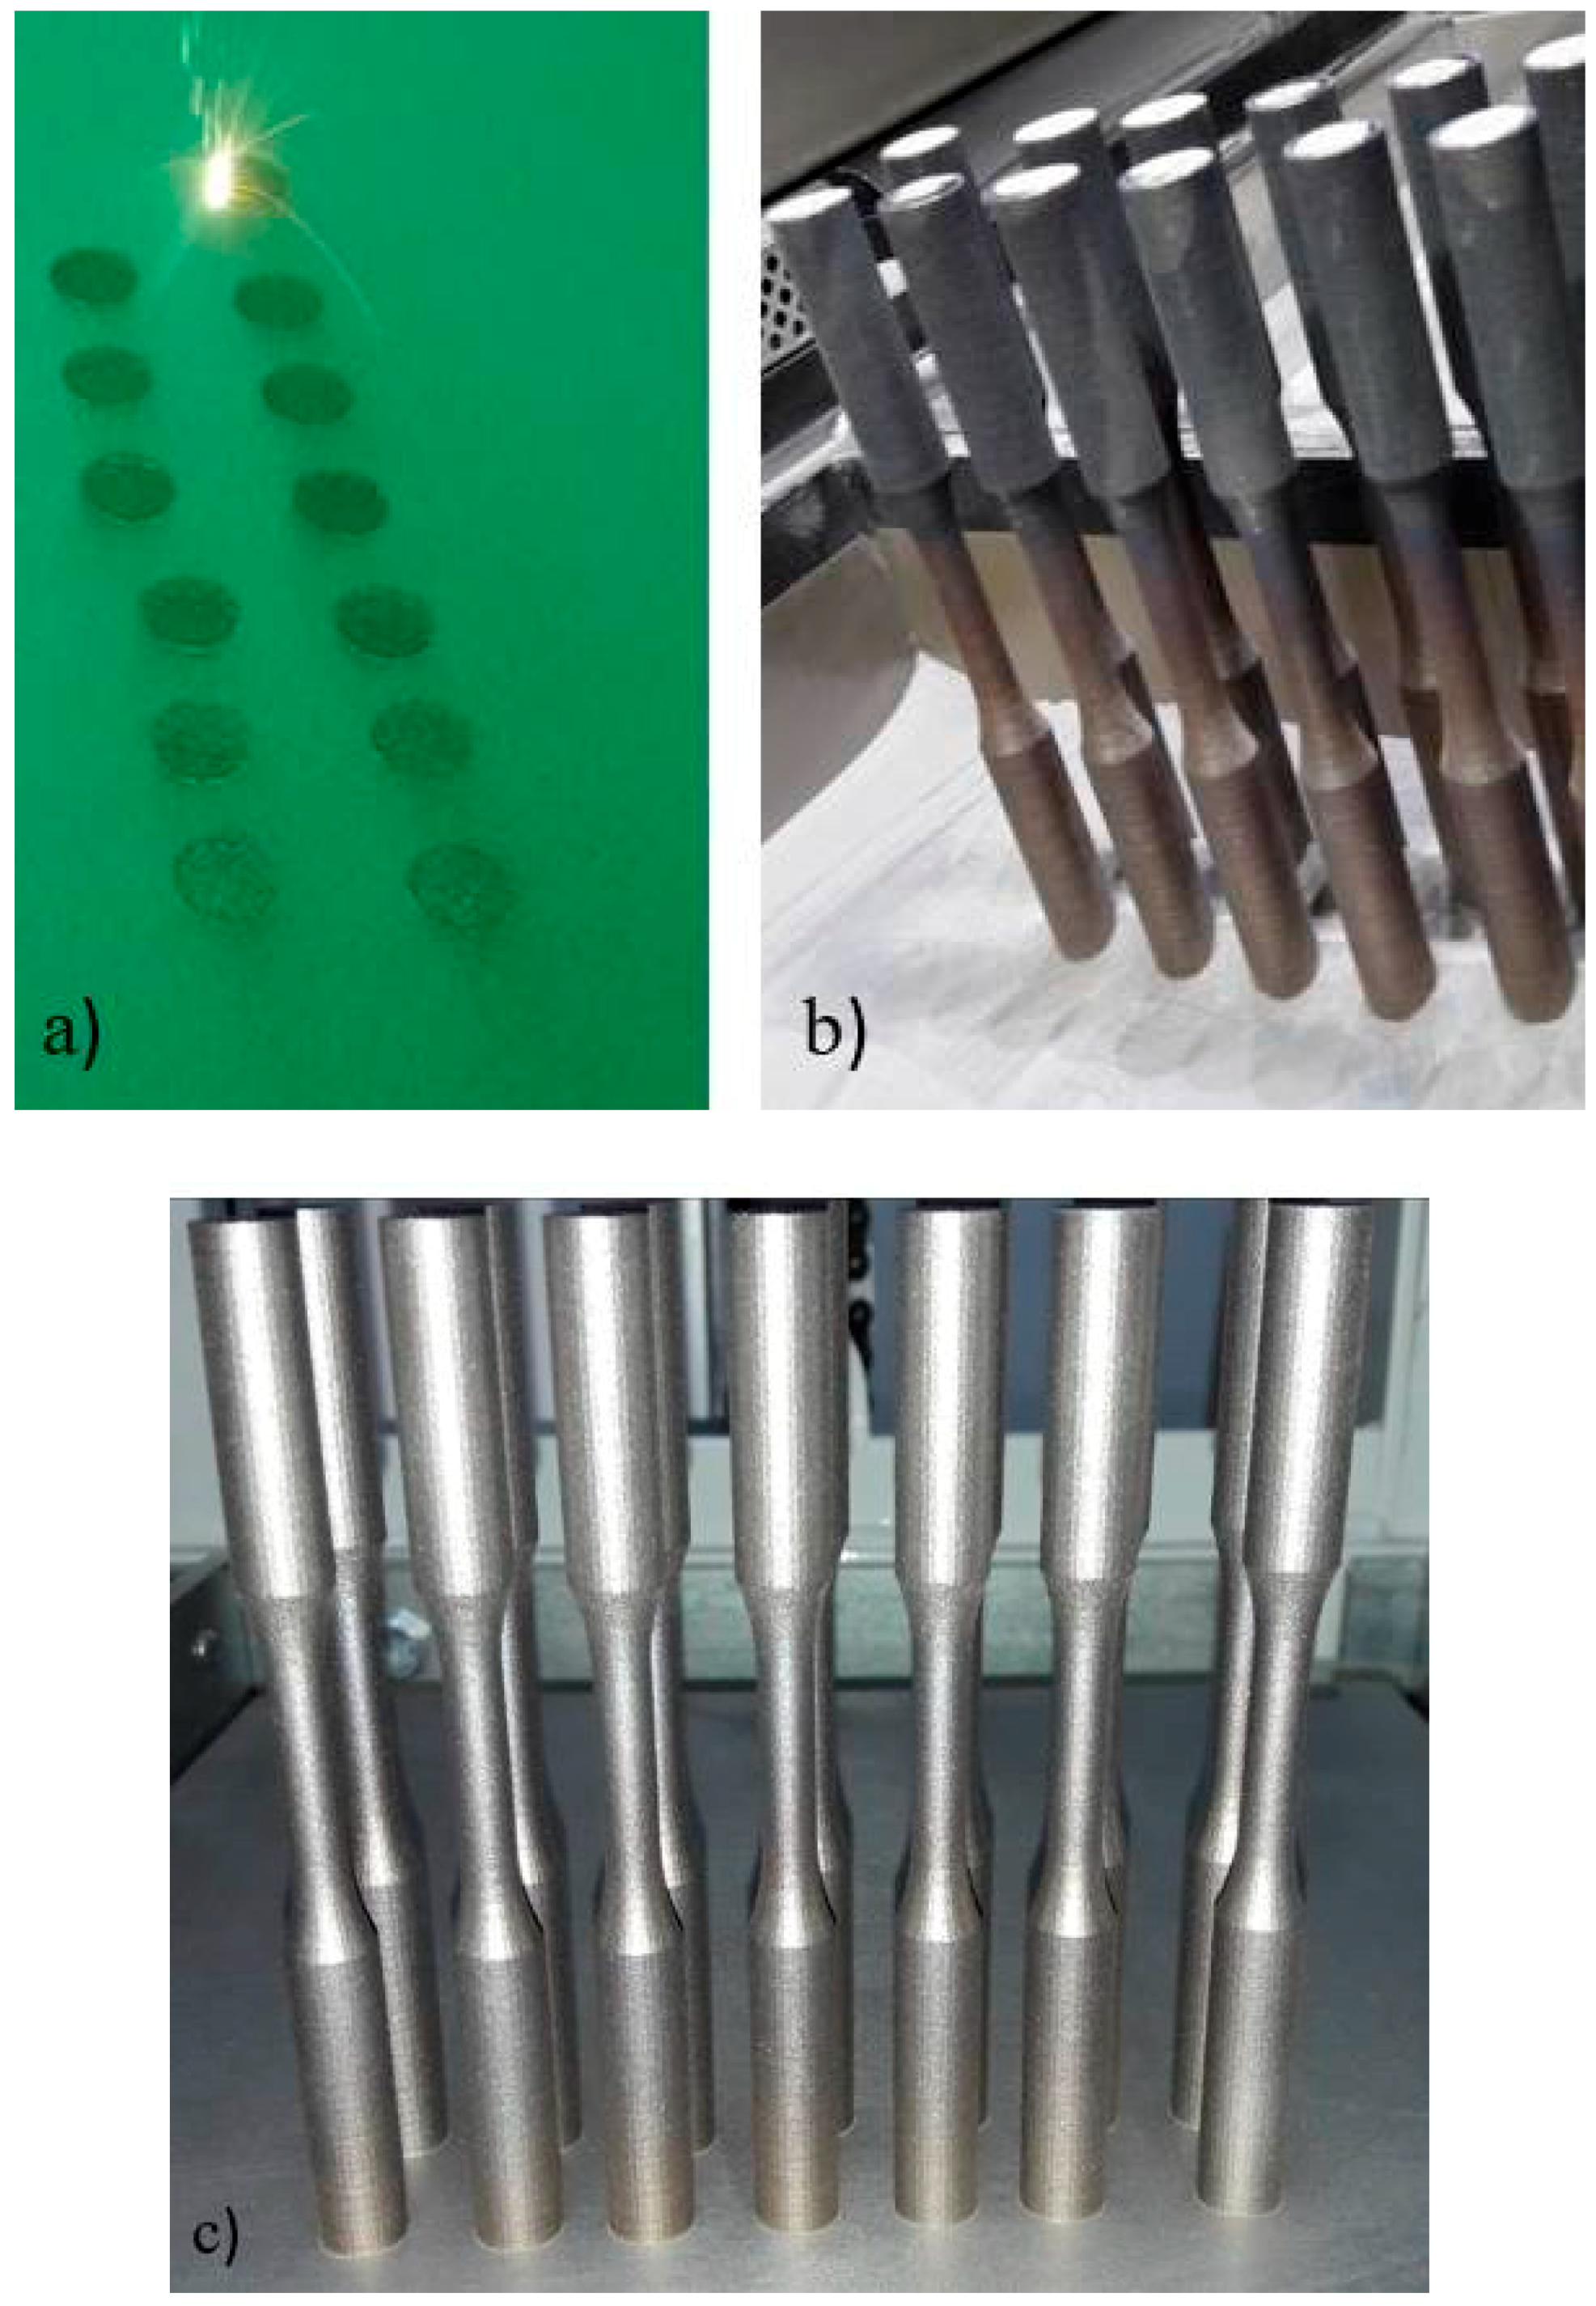
The scanning strategy consisted of parallel traces on every layer; layer by layer, the scanning strategy was rotated by an angle of 67°. The contour of the scanned surface was finally rescanned in order to get better surface quality. An example of the scanning process is shown in
Figure 3a.
The specimens were built directly on the base plate, with vertical orientation, without using a support structure (
Figure 3c). Proceeding this way, the surface quality of the specimens in the as-fabricated state was unaffected by the support structure teeth traces on the surface, as conversely would have been with different build orientations. After the building process, the specimens were taken from the process chamber, cleaned from excessive powder by micro-shot-peening, using stainless steel spherical shots with 400 μm diameter under a flow pressure of 5 bar. This treatment is usually performed to close the process-induced porosities and to generate compressive residual stresses that reduce the tensile residual state induced upon fabrication. The samples were then cut off from the base plate, by wire cutting with Electrical Discharge Machining (EDM).
The samples planned for heat treatment underwent age-hardening by heating in oven. The temperature was increased from room temperature to 490 °C in 1 h; afterwards, they were kept at constant temperature for an additional 5 h (total 6 h process), before gradual cooling in fresh air. This heat treatment is usually recommended to achieve a reduction of the process-induced tensile residual stresses, with a potential beneficial effect on the fatigue response of the built parts [
39,
40]. Then, the specimens planned for machining, were ground with 0.5 mm allowance with the aim of achieving the surface quality requirement in the drawing in
Figure 1, according to the ISO 1143 Standard [
36], as well as to improve the fatigue performance.
The experimental campaign was arranged, according to the scheme in
Table 2: in particular, the 2-by-2 design was run first, in order to investigate the impacts of heat treatment and machining with surface refinement. The sample set named N involved samples that underwent micro-shot-peening, but neither heat treatment nor machining. The samples from set M were micro-shot-peened and then machined, whereas those of set H underwent micro-shot-peening and subsequent aging treatment. Finally, for the HM condition, consisting in peened, heat-treated and machined samples, the curve determined in [
22], integrating the results in [
21], was used. As explained in this reference, this can be regarded as the most general and reliable model for the fatigue behaviour of Maraging Steel MS1 in the full treatment condition at the current state of the art.
The experimental design was then completed by the addition of a further combination, named MP: in this case, the samples underwent machining just after fabrication and then shot-peening by steel shots with 0.7 mm diameter. This surface treatment was carried out with shot flow under 5 bar pressure. This latest combination was added to investigate the effect of the different post-processing order on the fatigue response. The main motivation supporting this choice was that, despite the material manufacturer recommendations, the beneficial residual stress state yielded by post-fabrication peening was likely to be completely removed by the subsequent machining with 0.5 allowance.
All the samples have undergone geometry measurement, to check that requirements have been met. Diameter dimension and surface roughness have been measured at the head and at the gage. For this purpose, a micrometre screw gage (with the resolution of 0.01 mm) and a portable surface roughness tester (with the resolution of 0.01 μm, Handysurf E-30A; Carl Zeiss AG, Oberkochen, Germany) have been used.
Diameter measurement checks have been done at two points at the heads, replicating measurement with 90° rotations at each point, for a total of eight replications, including both the specimen heads. Diameter at the gage was measured at three points, with two replications for each, by 90° rotation, for an overall number of 6 replications.
Surface roughness on both the heads and on the gage was measured over 8 replications. In particular, roughness was averaged over 4-mm runs along the longitudinal axis, considering 90° angled spots with two repetitions for each. Measurement at the gage was performed only on the samples that got broken during the fatigue testing, due to the impossibility of correctly aligning the roughness tester in the unbroken ones. However, the retrieved measurements were sufficient to get evidence of the roughness mean value at gage.
Some average values of the diameter and surface roughness measurements are provided in
Table 3 with reference to Set N. For the sake of synthesis, the other results concerning the measured roughness are not provided. It is worth mentioning that, considering a mean value over all the manufactured samples, R
a at gage for the machined specimens (sets M, HM) is 0.5 μm. This value is remarkably incremented, by almost one order of magnitude, up to 4.2 μm, for the samples that did not undergo machining (N, H). Finally, the peening treatment after machining also leads to a roughness increase up to 1 μm, as an effect of the dimples generated by shot impacts.
The fatigue tests were carried out, loading the samples under four-point rotary bending, using the same testing machine as in [
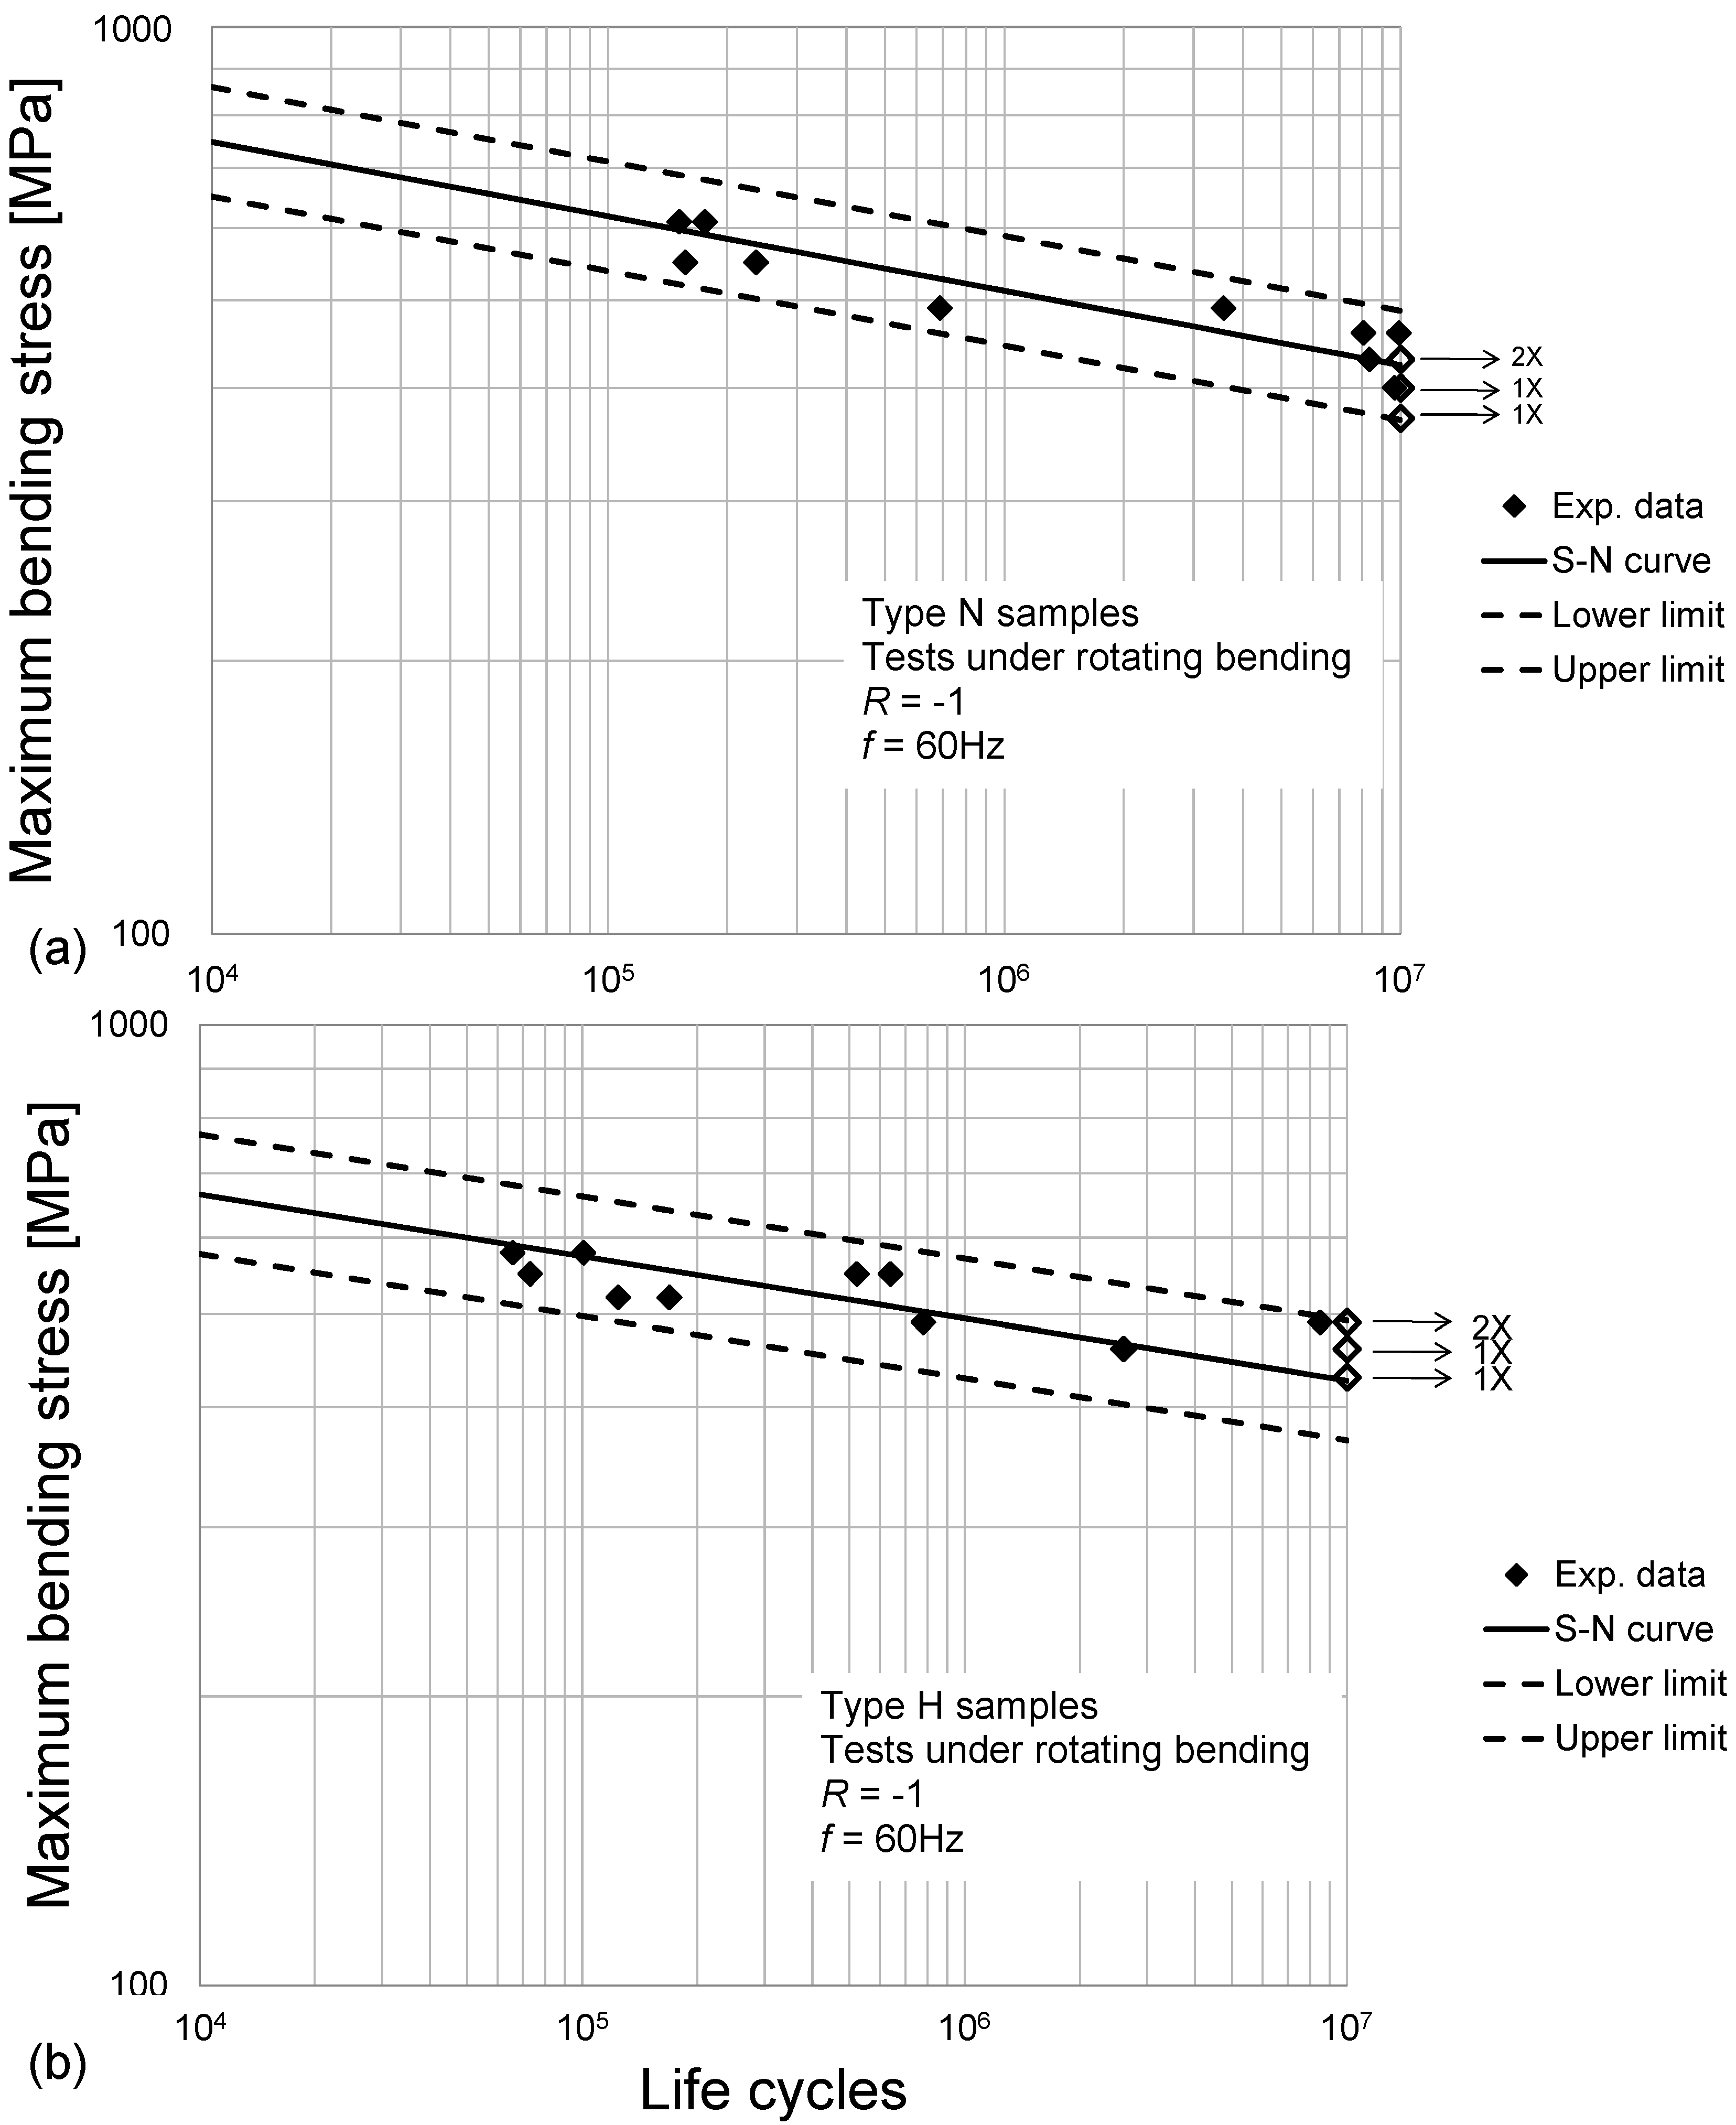
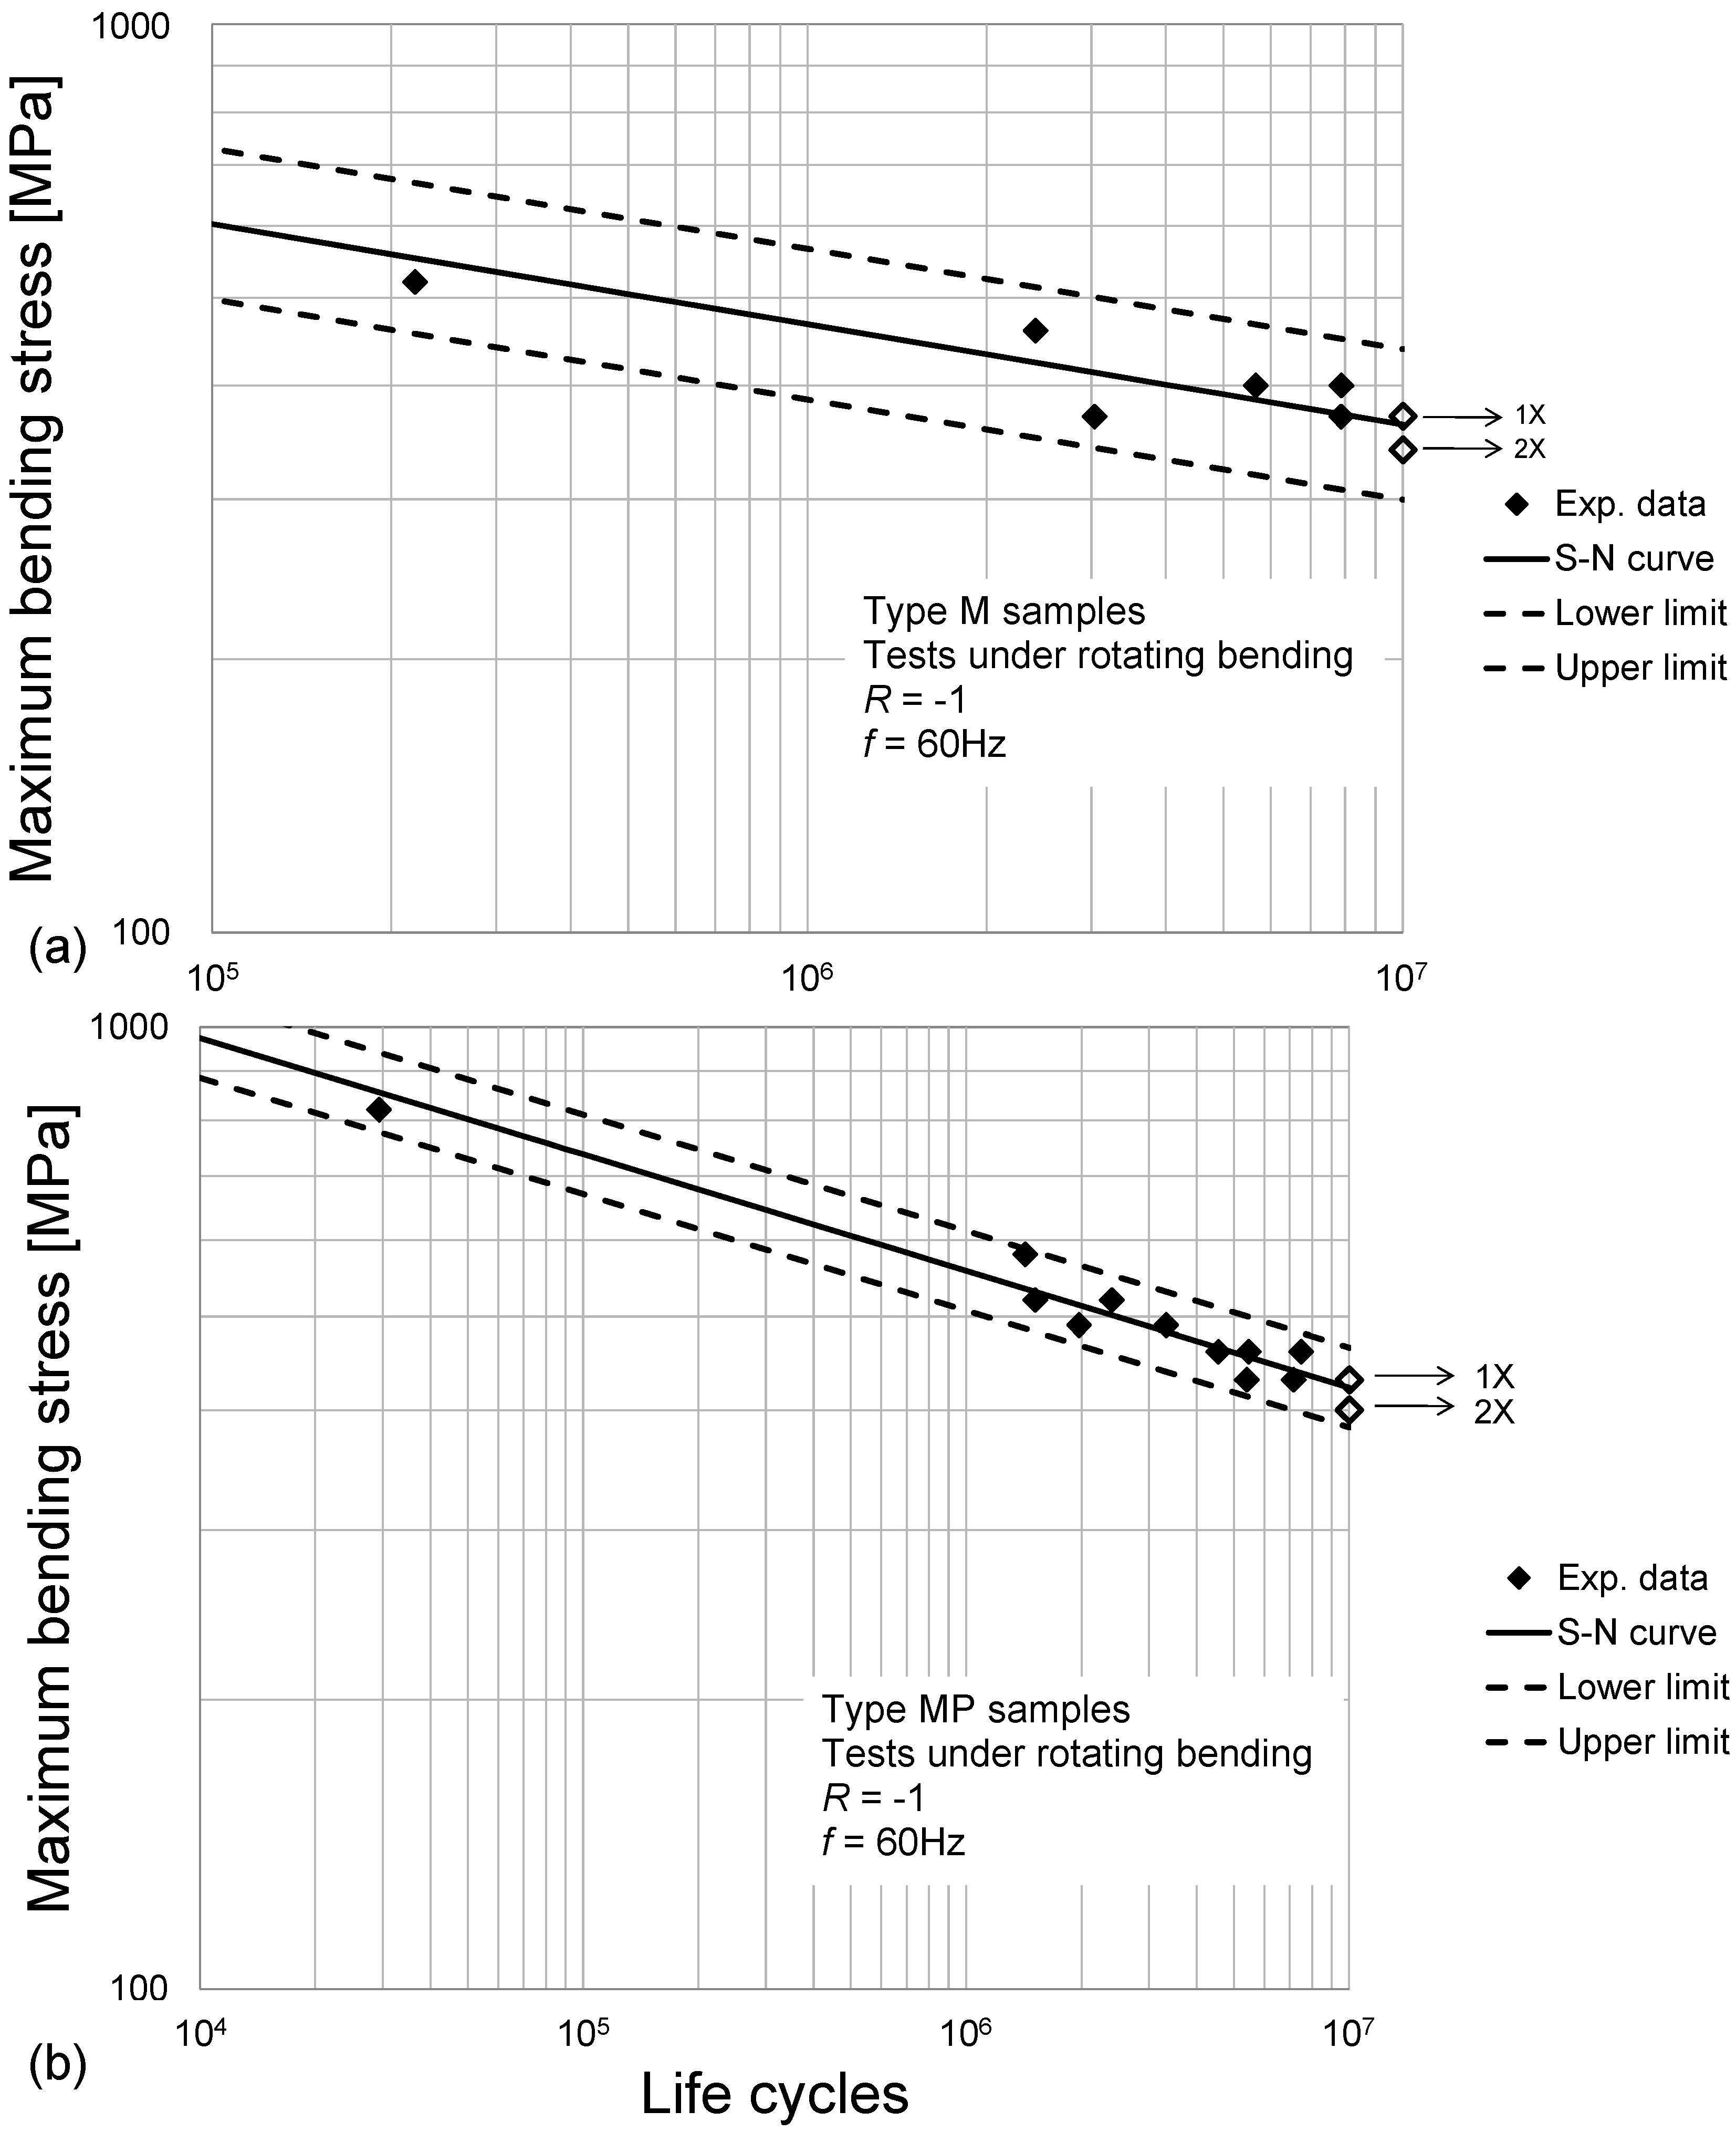
21]. Tightening was done in such a way that specimen heads could not have any chance to revolve inside chuck collets. After the specimen was mounted, the radial misalignment of the gage section was checked, as recommended by the aforementioned Standard. Testing was performed with stress ratio R = −1 and with the frequency of 60 Hz. Each test was conducted in the load-controlled mode, applying a proper stress amplitude; related values are provided in full details in the next Section.
The samples were tested until failure or until 10
7 cycles to be regarded as run-out. Each sample set consisted of 7 to 15 specimens. Using the aforementioned procedure, it was possible to obtain FL and the S-N curve for finite life domain. The fatigue limit was obtained by the Dixon stair-case method for a small number of sample trials with failure or non-failure outcomes [
41]. The Dixon method is a modified stair-case method that makes it possible to estimate FL even from small series of nominal trials (in this case, four to seven). Standard deviation was estimated to assess the uncertainty and to determine the confidence band for FL. ISO 12107 was used for processing the data in finite life domain [
42]. Data were linearly interpolated in logarithmic diagrams. Upper and lower bounds of the logarithmic curve were determined, based on the standard deviation of fatigue life, with the probability of failure of 90% for upper limit and 10% for lower limit and with the confidence level of 90%.
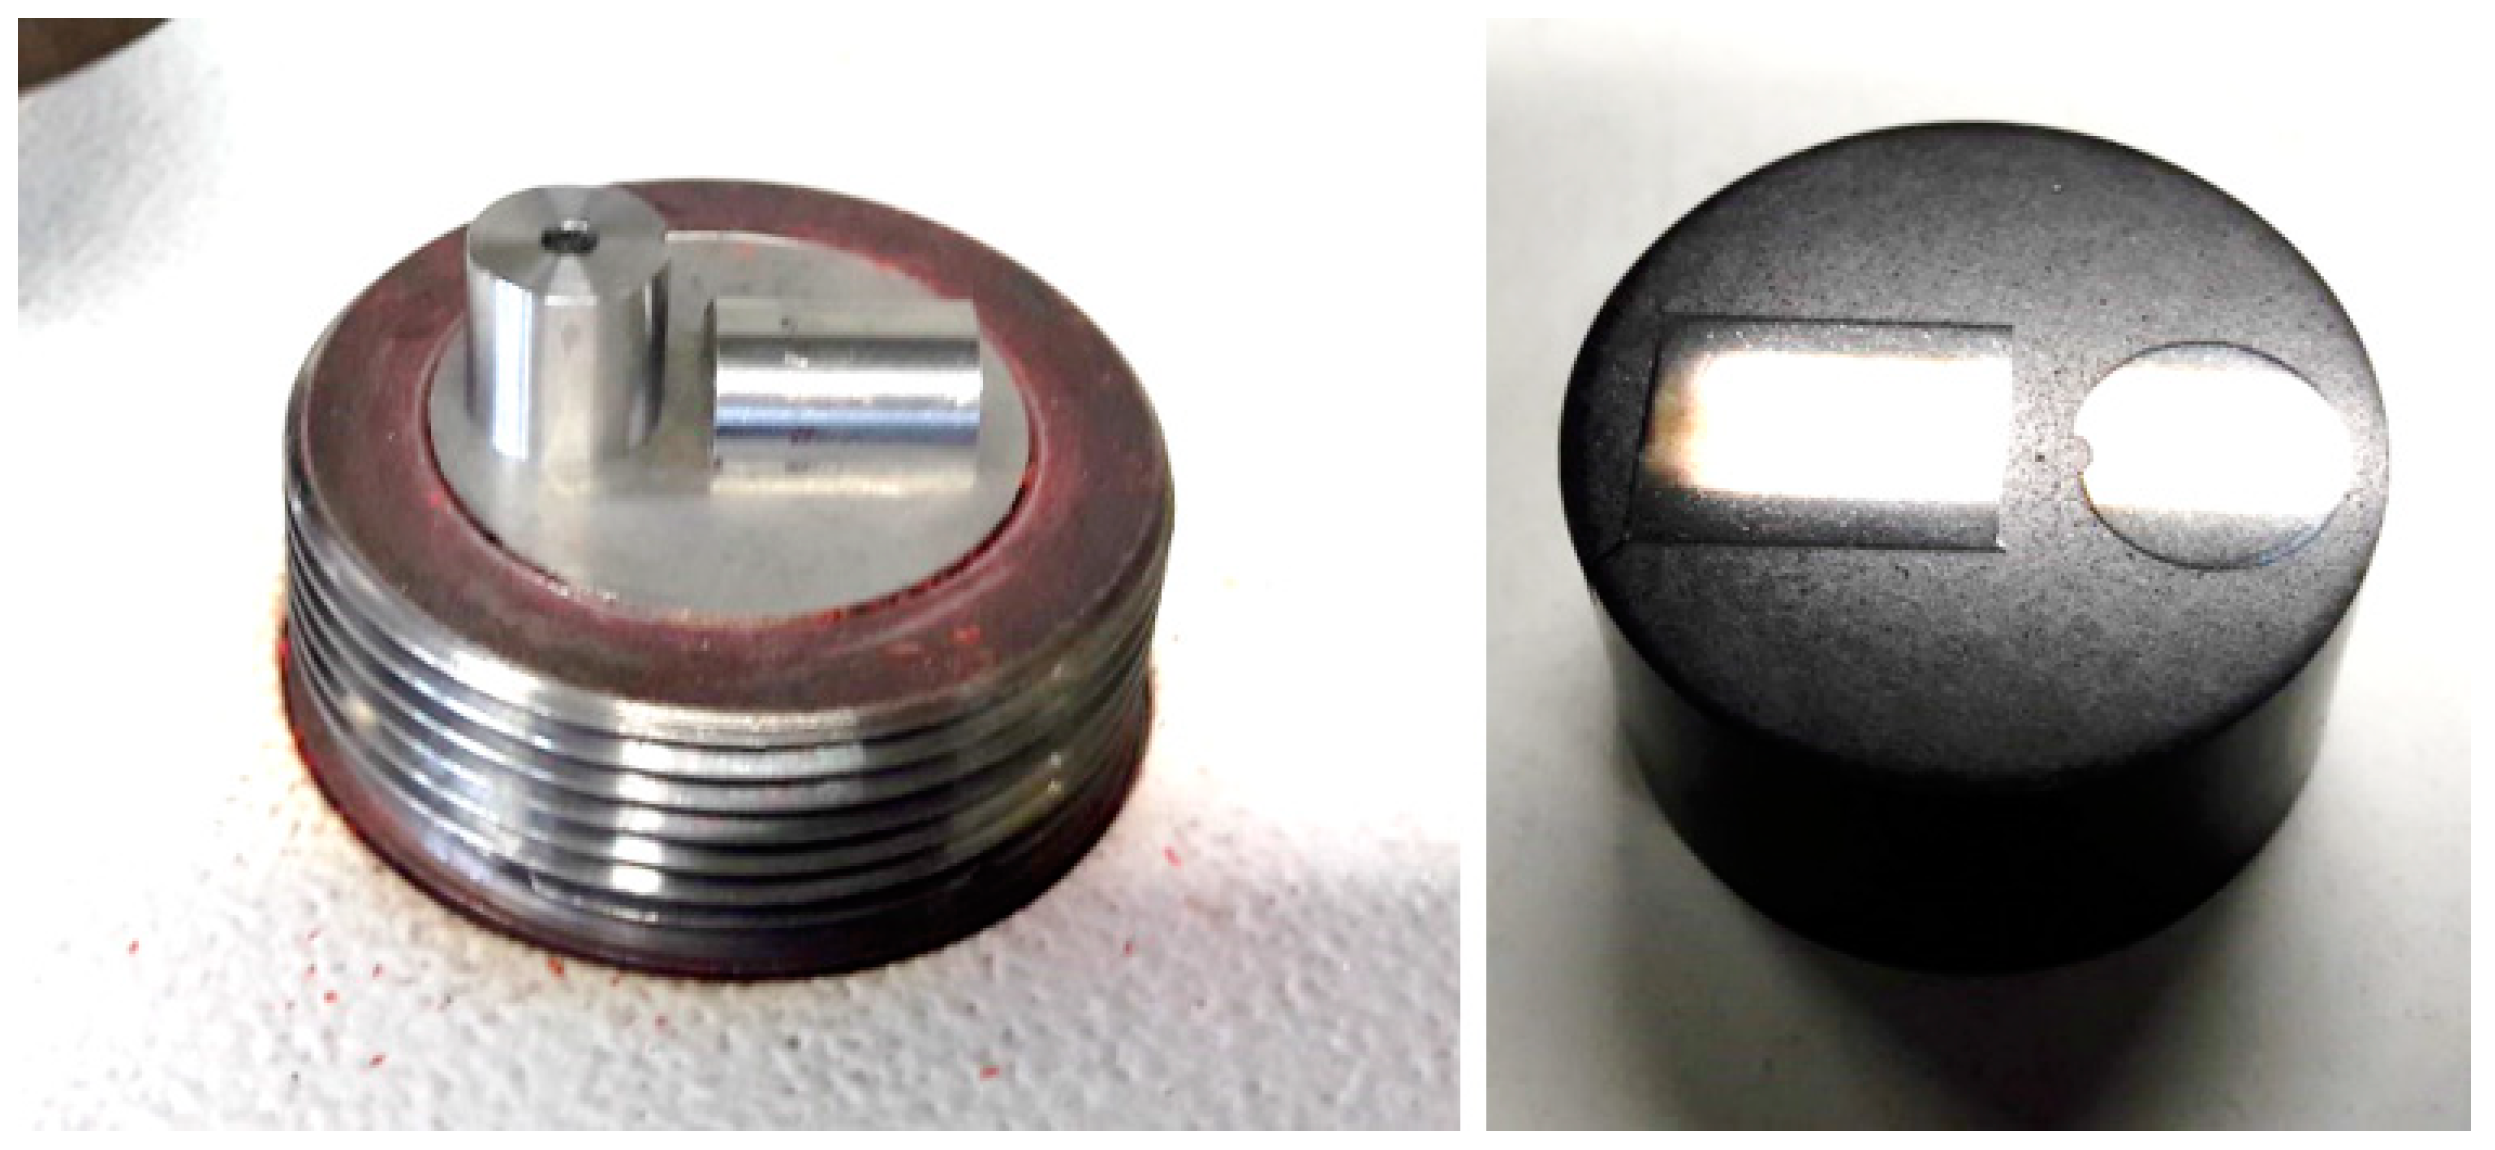
Fractographic and micrographic analysis have been done as well for some samples, after the end of the testing campaign to examine fracture initiation and propagation areas. In particular, some specimens were cut, embedded into phenolic resin, and polished for micrographic analysis, as in
Figure 4. The specimen surface was etched with combination of 150 cc of water (H
2O), 50 cc of Chloridric Acid (HCl), 25 cc of Nitric Acid (HNO
3), and 1 g of Calcium Chloride. Etching was done at room temperature for 70 s. A Stemi 305 stereo-microscope (by ZEISS, Oberkochen, Germany) has been utilized for fractographies, whereas an Optiphot-100 optical microscope (by Nikon, Melville, NY, USA) has been used for both micrographic and (more zoomed) fractographic analyses.
4. Discussion
The S-N curves in the finite life domain were processed by the ANOVA-based methodology that was introduced in [
43] and successfully applied in [
23], based also on more conventional applications in [
44,
45]. For the sake of clarity, the data-processing procedure is briefly resumed below. The first analysis involved the four treatments of the aforementioned 2-by-2 design, i.e., Sets N, M, H, and HM. In the experimental plan in
Table 2, these treatments are accommodated in the first two rows and in the first two columns of the experimental design.
All the data have been processed in the logarithmic scale: in particular,
Si indicates the 10-base logarithm of
σi, considering the fatigue curves in
Table 8 and in [
21,
22]. As a first step, row (
,
) and column (
,
) means have been computed, combining the functions in Equations (3) to (6). In particular,
can be regarded as the first row mean, i.e., as the mean S-N curve for the H and M Sets being accommodated in the first row of the experimental design (
Table 2). On the other hand,
indicates the first column mean, i.e., the mean S-N curve for the treatments (Sets N and H) in the first column of the design. Similar meanings also apply to the second row mean,
, and the second column mean,
. For the sake of clarity, the conventional nomenclature for ANOVA [
46] is utilized here, to indicate the mean terms and the other parameters to be determined in the following.
The overall mean (grand mean over all the four Sets) was then computed as reported in Equation (7):
The “Sum of Squares between Rows” (
SSBR), i.e., the term depending on the effect of the “Row” factor, namely heat treatment, was determined as in Equation (8), where the sum of squares are weighted by the factor 2, considering that the row means are averaged over two S-N curves.
The “Sum of Squares between Columns”,
SSBC, which is related to the effect of the “Column” factor, i.e., of machining, was similarly determined as in Equation (9), where the weight factor is 2, as an effect of the column means being averaged over two fatigue curves.
Finally, the interaction term,
SSI, was determined as in Equation (10).
Regarding SSBR, SSBC, and SSI, the related functions were converted into scalars by the computation of their integral means over the lifespan considered in the fatigue campaign in the finite life domain. The error term was finally determined as the sum of the squares of the residuals between the actual experimental data and the predicted ones based on the S-N curves.
All the data were then processed as a conventional two-way
ANOVA, provided that the sum of squares terms were scaled, dividing them by the related degrees of freedom. The Analysis of Variance was followed by the Fisher test, to discuss the significance of the effects of the heat treatment and of machining along with their interaction. The outcome (reported in
Table 9), based on a lifespan ranging from 10
4 to 10
7, was that both factors were highly significant, accepting a probability of error, commonly regarded as p-value, in the order of 10
−5. The interaction is also significant with a p-value around 10
−6.
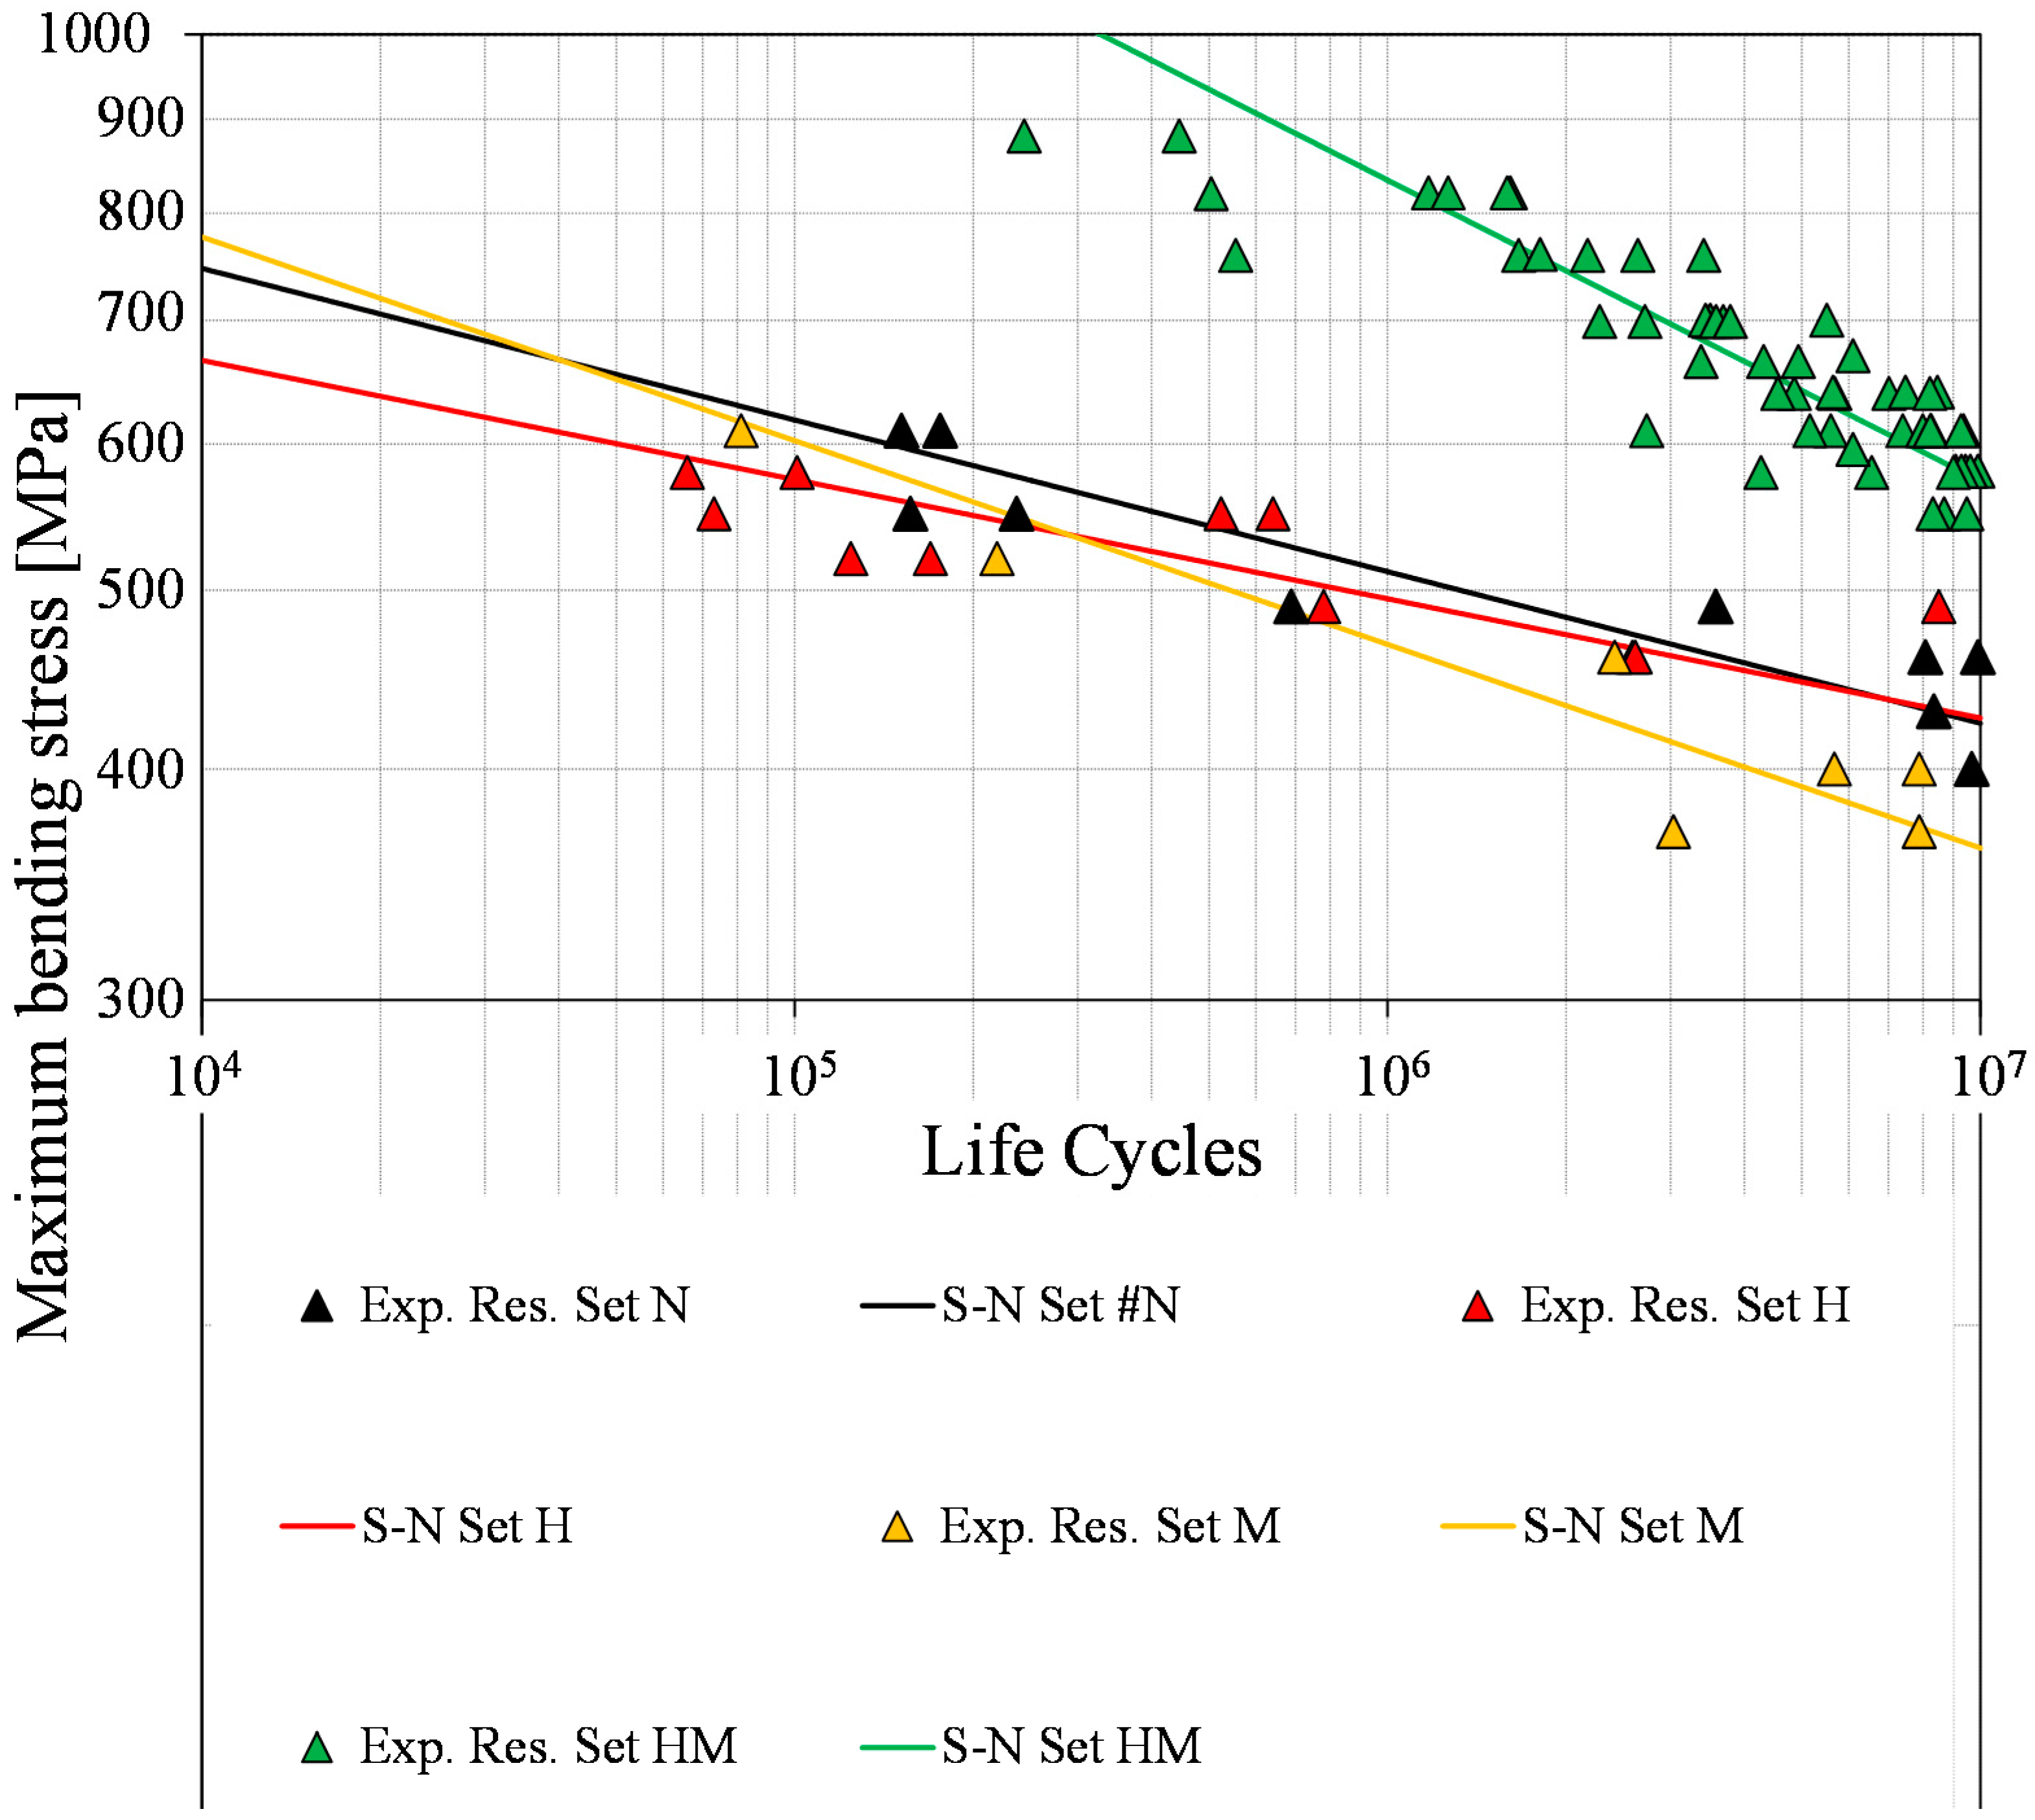
The four curves, corresponding to the sets referenced as N, M, H, and HM are plotted together in the graph in
Figure 7. It can be observed that, starting from the curve for Set N, colored in black, the red one for Set H is very close, whereas the yellow one for Set M indicates a slightly lower strength.
These results were interpreted in the light of a further analysis. The same procedure being described in [
43], regarding one-way ANOVA, was here applied to compare the two curves (black and red) corresponding to the Sets (N and H) in the as-built state with and without heat treatment. The same procedure was subsequently applied to compare the S-N plots (black and yellow) for the samples without heat treatment in the as-fabricated state (Set N) or that underwent machining (Set M). In both cases, the statistical tests indicate the differences between the couples of curves are not significant. In other words, the curve for Set N is statistically the same as that for Set H and also as that for Set M. Regarding the effect of heat treatment without machining, it must be remarked that the build process of a Maraging Steel usually leads to a not-high-tensile residual stress field, due to the low coefficient of thermal expansion (CTE), if compared to that of other materials, e.g., Stainless Steel 15-5 PH [
23]. In fact, the lower the CTE, the lower the induced residual stresses [
23,
47]. Therefore, considering the lower amount of residual stresses, being also reduced by micro-shot-peening, the application of heat treatment becomes ineffective. In other words, the peening treatment seems to provide a sufficient contribution against the process-induced not remarkably high tensile residual stresses.
The further outcome of the performed analysis, i.e., the counter-intuitive slightly detrimental effect of machining, especially regarding the fatigue limit, can be explained with reference to the beneficial compressive residual stresses induced by micro-shot-peening being removed by machining. This result indicates that the positive effect of surface finishing is compensated by the simultaneous removal of the superficial layers, where the peening-induced compressive state was able to provide some protection against crack propagation. This effect can be observed in the not-heat-treated samples, where micro-shot-peening plays indeed an important role at relaxing the detrimental tensile residual stresses, as also remarked in the previous paragraph.
Finally, regarding the forth curve, the green one for the HM condition, it keeps much higher than all the others. It indicates the high positive interaction between the two considered factors: in other words, if they are applied together, they have a synergic effect at remarkably enhancing the fatigue strength. On one hand, the heat treatment becomes highly beneficial on a refined surface, when the effect of shot peening is removed through machining. On the other hand, machining is also significantly beneficial, as it refines the surface, while simultaneously the heat treatment drops down the residual stress state induced by the stacking process (while the effect of the peening treatment is completely removed).
It is important to make a specific remark about the effect of the aging heat treatment. This seems to be highly effective, only if it is carried out on a refined surface, whereas its effect drops down to zero, and may be even detrimental, when it is performed on a coarse surface in the as-built state. A possible reason for this occurrence is that the aging treatment makes the Maraging steel much more notch-sensitive. This property is commonly related to the increase of the material UTS, which is actually remarkably incremented by the aging treatment according to ref. [
14,
38]. Therefore, the aging treatment turns to be highly beneficial only on a machined refined surface, but may be detrimental on as-built parts with surface asperities and process-induced defects at a sub-surface level. Regarding this point, some results by fractographic analyses are provided in the following.
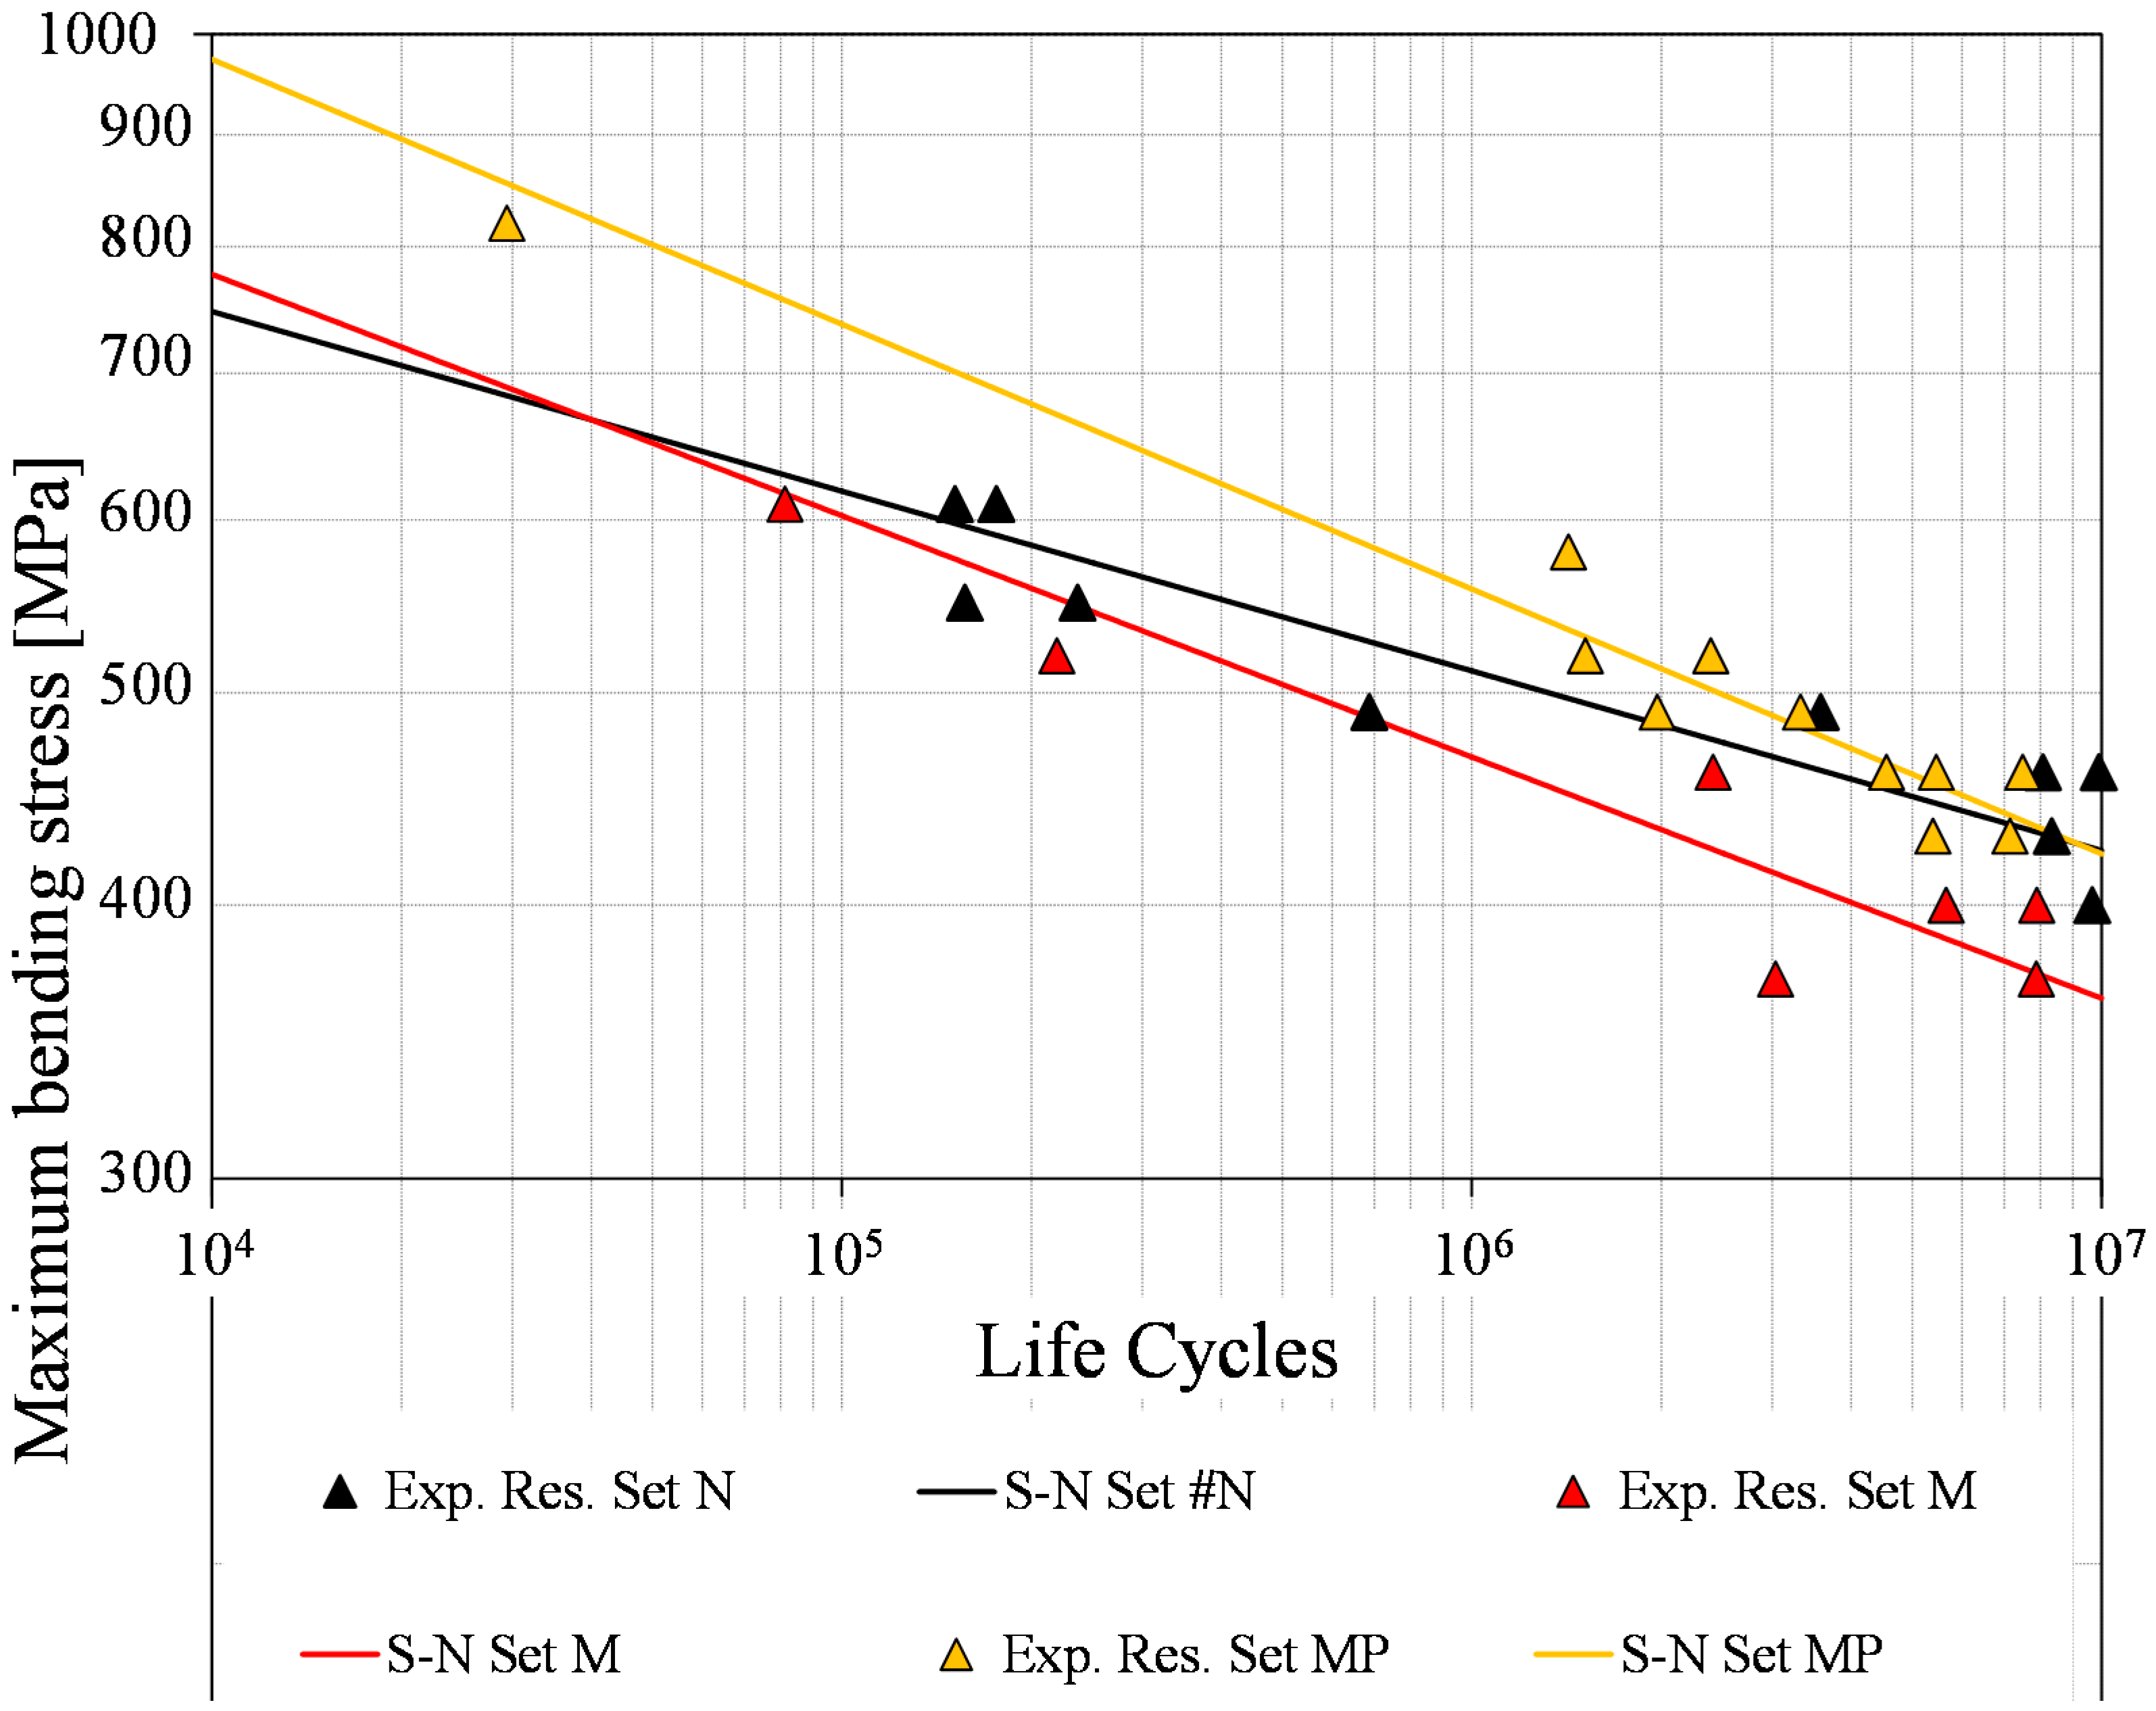
A final analysis was conducted, also including the curve for the MP Set. The S-N curves for Sets N, M, and MP, i.e., for all the Sets, which did not undergo the aging treatment, are plotted together in
Figure 8. The tool of one-way ANOVA with three levels has been utilized to compare the three curves, as concisely described below.
A grand mean curve
has initially been computed as in Equation (11), where S indicates the 10-base logarithm of the stress corresponding to a generic fatigue life, and the subscript refers to the Set type, according to
Table 2 and
Table 8.
can be regarded as the grand mean of the S-N curves of all the sets with different treatments in the first row of
Table 2. The ANOVA nomenclature [
46] is again used to indicate the mean and the sum of squares.
Then, an “
SSBC′” term, being related to the effect of post-processing (machining, shot-peening, and related order), has been determined as in Equation (12).
As above, the error term was estimated as the sum of the squares of the residuals between the experimental actual yields and the estimated ones, according to the determined fatigue curves. Scalar terms were then worked out as the integral means of the quadratic terms over the investigated life span. The analysis proceeded as a conventional one-factor ANOVA after scaling the scalar terms that were divided by their degrees of freedom.
The result was that the fatigue strength in the finite life domain is significantly incremented, when shot-peening is performed after machining, i.e, when the curve for the MP Set is compared to the other two. This outcome is a further proof for the importance of shot-peening: applying it after machining makes it possible to take advantage of both the induced compressive residual stress (which compensates for that induced by the building process, in absence of heat treatment) and the better surface finishing.
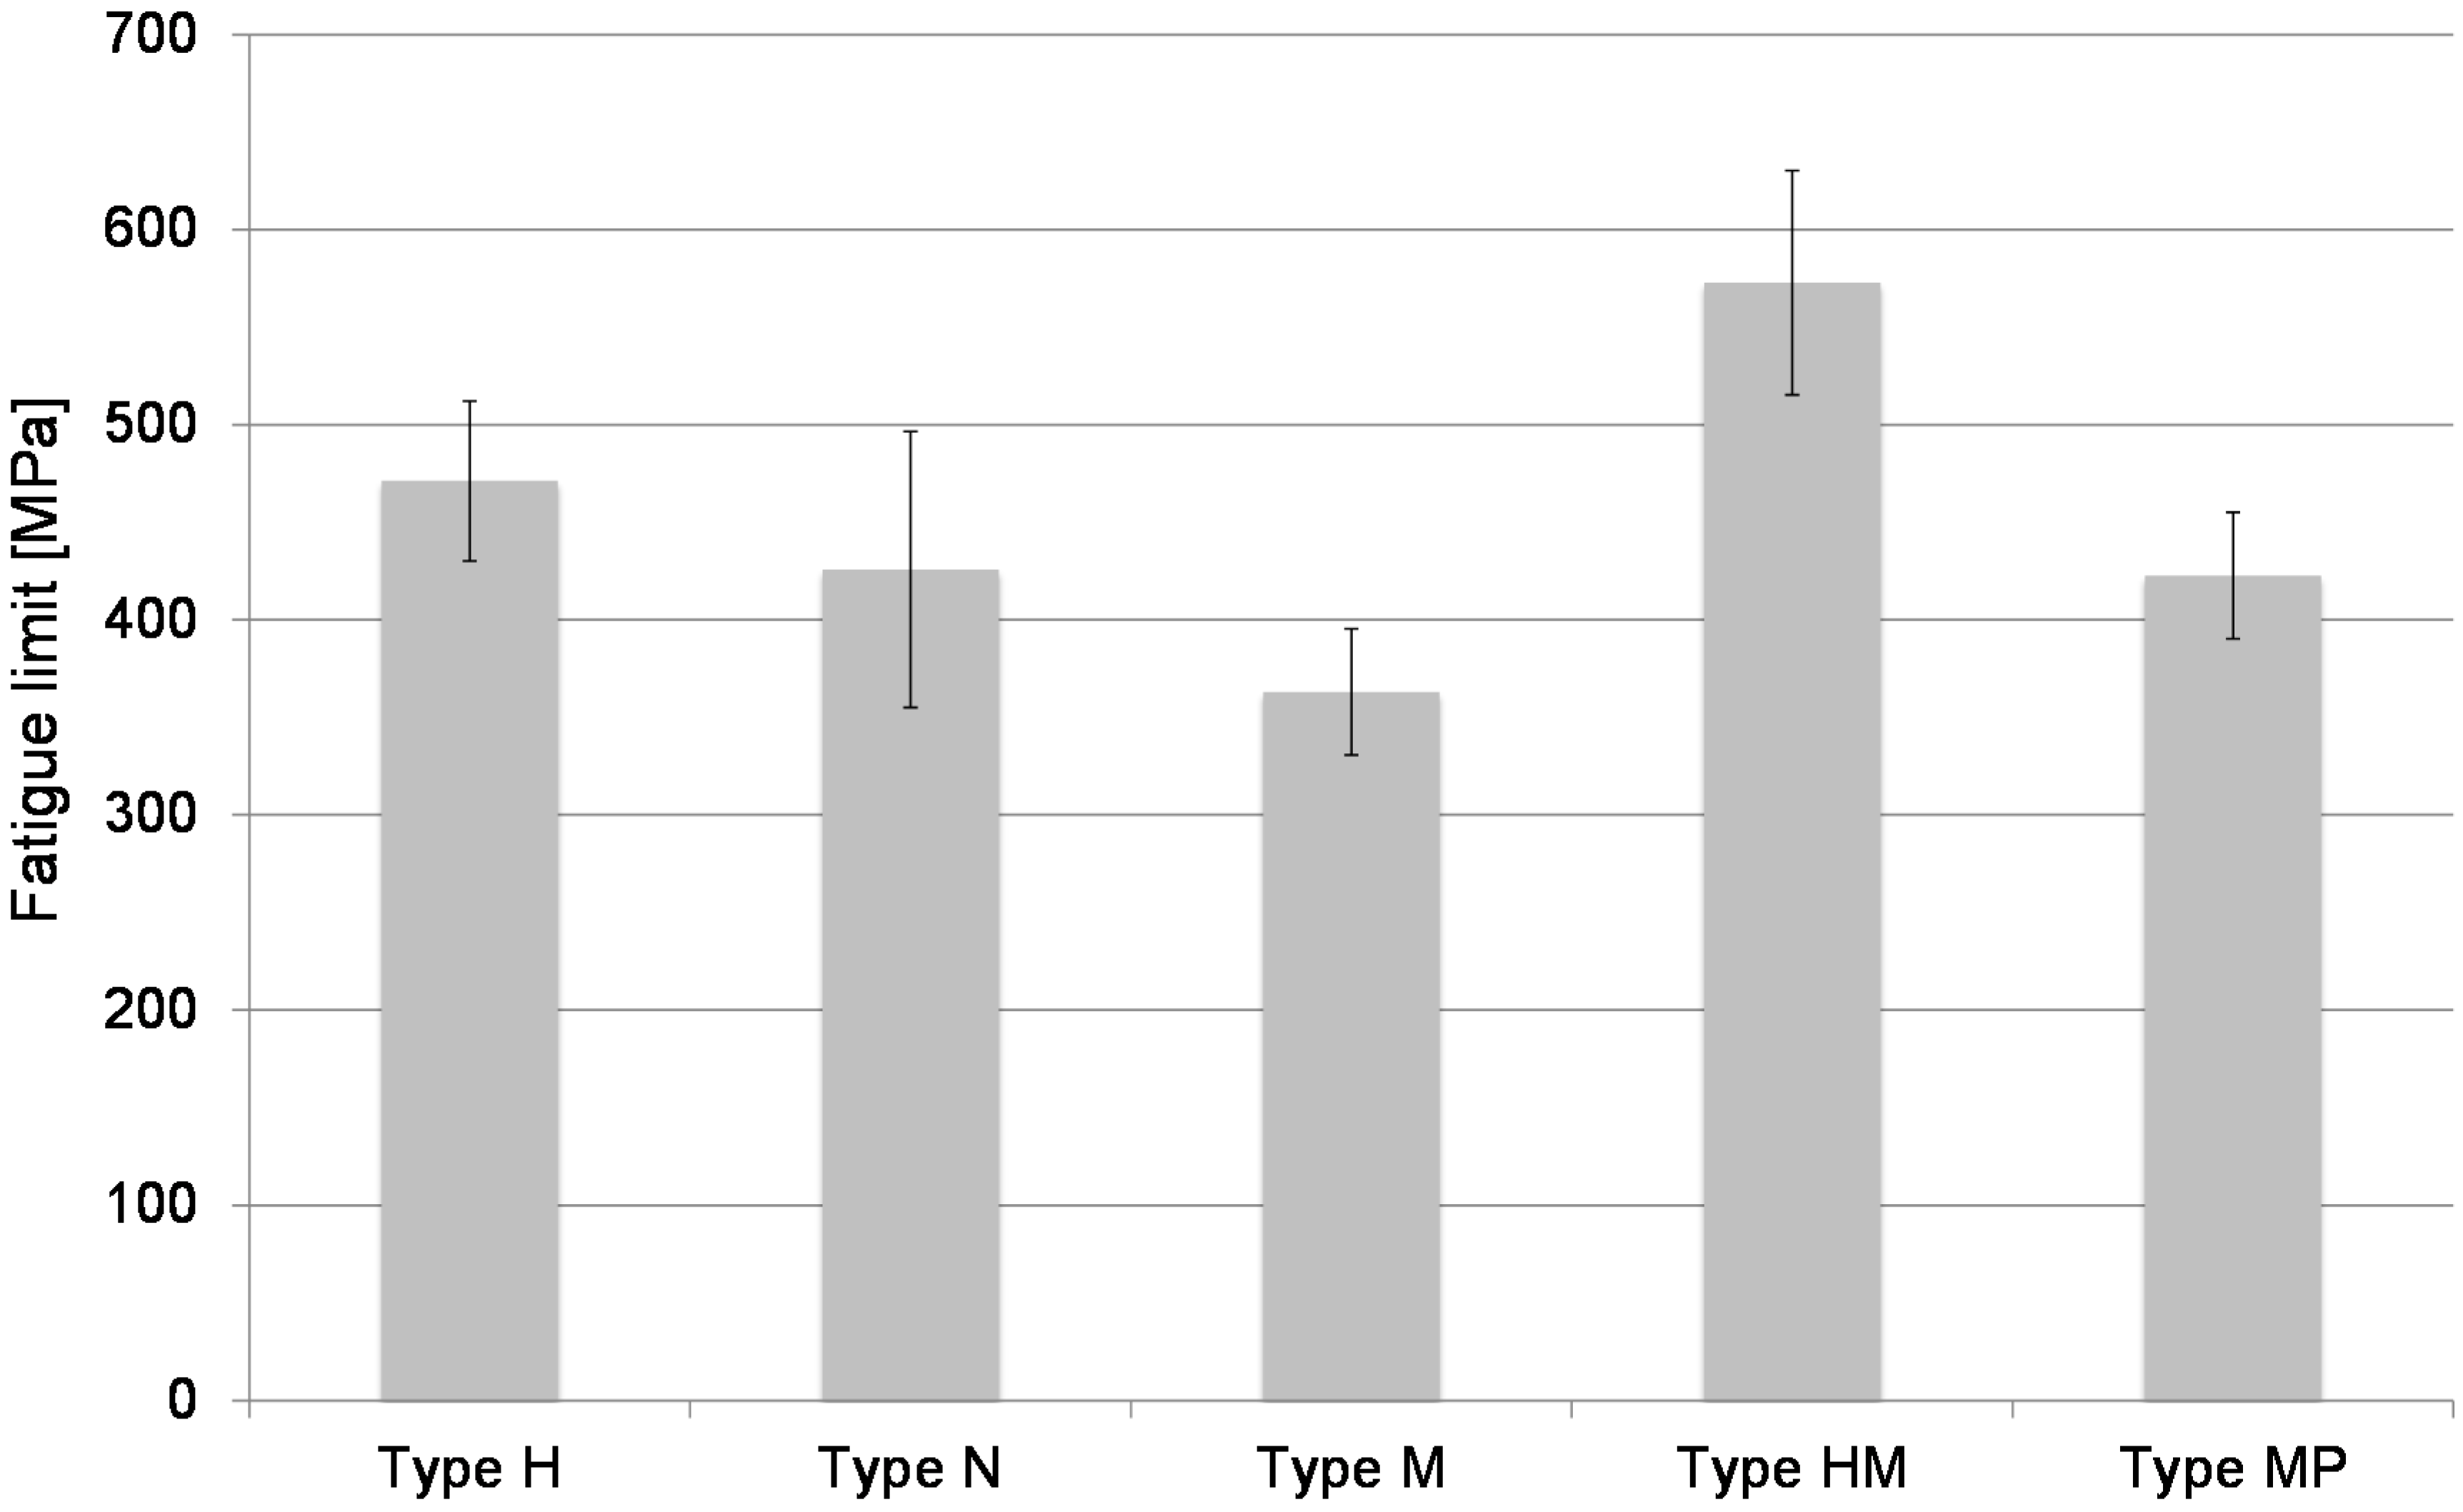
The fatigue limits for all the sample types with their confidence band (90% confidence level) are shown in the bar graph in
Figure 9. As mentioned above, the fatigue limits were worked out by the Dixon method with related confidence analysis, except for Set HM: in this case, the fatigue limit was extrapolated by the S-N curve as the stress corresponding to an expected life of 10
7 cycles. The scatter evaluated in the finite life region was also applied at the fatigue limit, while keeping the same level of confidence for comparison purposes [
48]. The estimated value of FL for sample type HM is 573 MPa, for sample type H is 471 MPa, for sample type N is 426 MPa, for sample type M is 363 MPa, and for Set MP is 423 MPa. The sample sets named H and HM underwent heat treatment, whereas the other threes did not undergo heat treatment. The UTS of MS1 Maraging Steel is 1100 MPa in the as-built condition; after hardening, it is drastically incremented up to 2050 MPa, corresponding to almost 100% increase of UTS following heat treatment [
38].
Regarding Sample types HM and H, their FL is respectively 28% and 23% of UTS. Sample types N, M, and MP were without hardening and their FL is, as expected, indeed lower, but respectively, 38%, 33%, 38% of the corresponding UTS for the not heat-treated material. Moreover, the Sets N and MP have very close FLs, whereas the latter yields much better performance for finite life, as remarked above. This indicates that the effect of shot-peening after machining turns out to be negligible for infinite life. These ratios are much lower than the commonly accepted ratios of FL over UTS of 50% for wrought material following machining, but are in agreement with some literature research, when considering as-built parts [
49,
50]. This is not surprising, due to the layered characteristic of specimens. Sample type N proved to have a greater FL than machined sample type M.
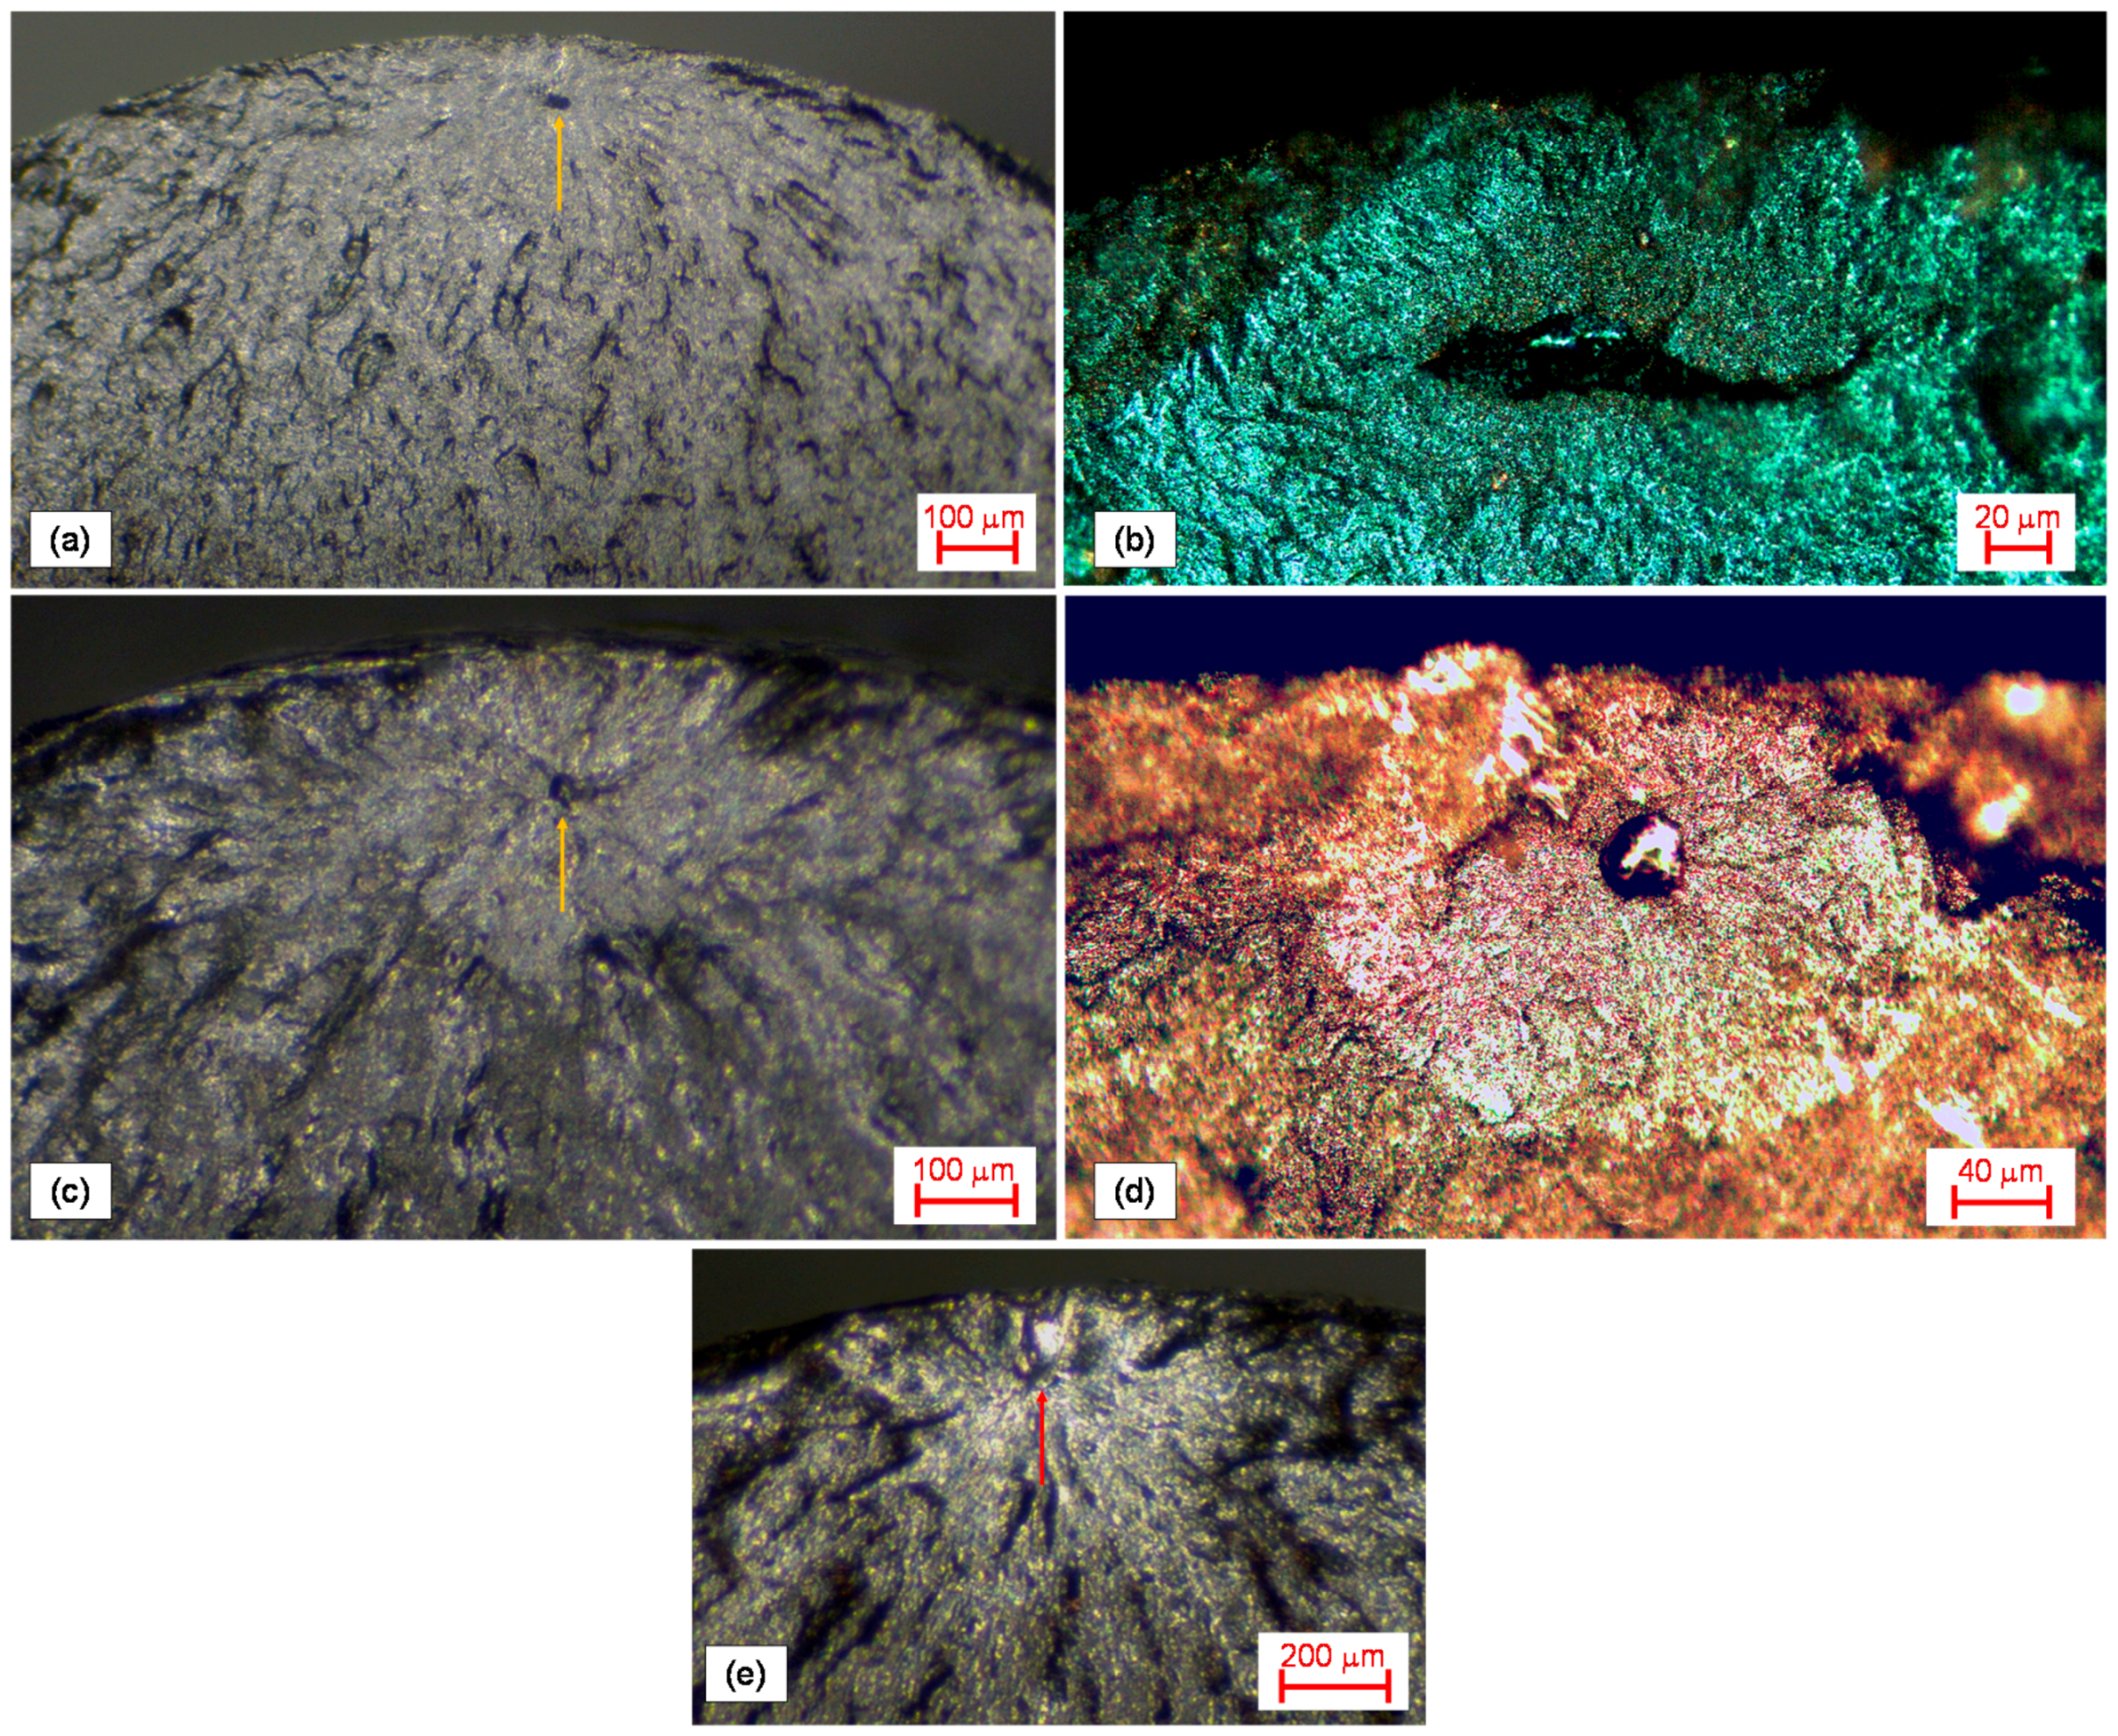
During fractographic and micrographic analysis, some porosities were observed. During the fractographic analysis of both the surfaces of the broken sample, it was found that crack initiation usually occurs at one point on the surface or, more frequently, just beneath it, at a distance of about 80 μm from the edge. Some amount of voids and inclusions were noticed on fractured surfaces of all samples. It is indeed possible that voids or inclusions were responsible for crack initiation: most cracks seem to actually start from these defects. Only one crack initiation point was generally observed. Some examples of fractures that initiated from sub-surface defects are depicted in
Figure 10 with regard to all the Sets involved in the experimental campaign.
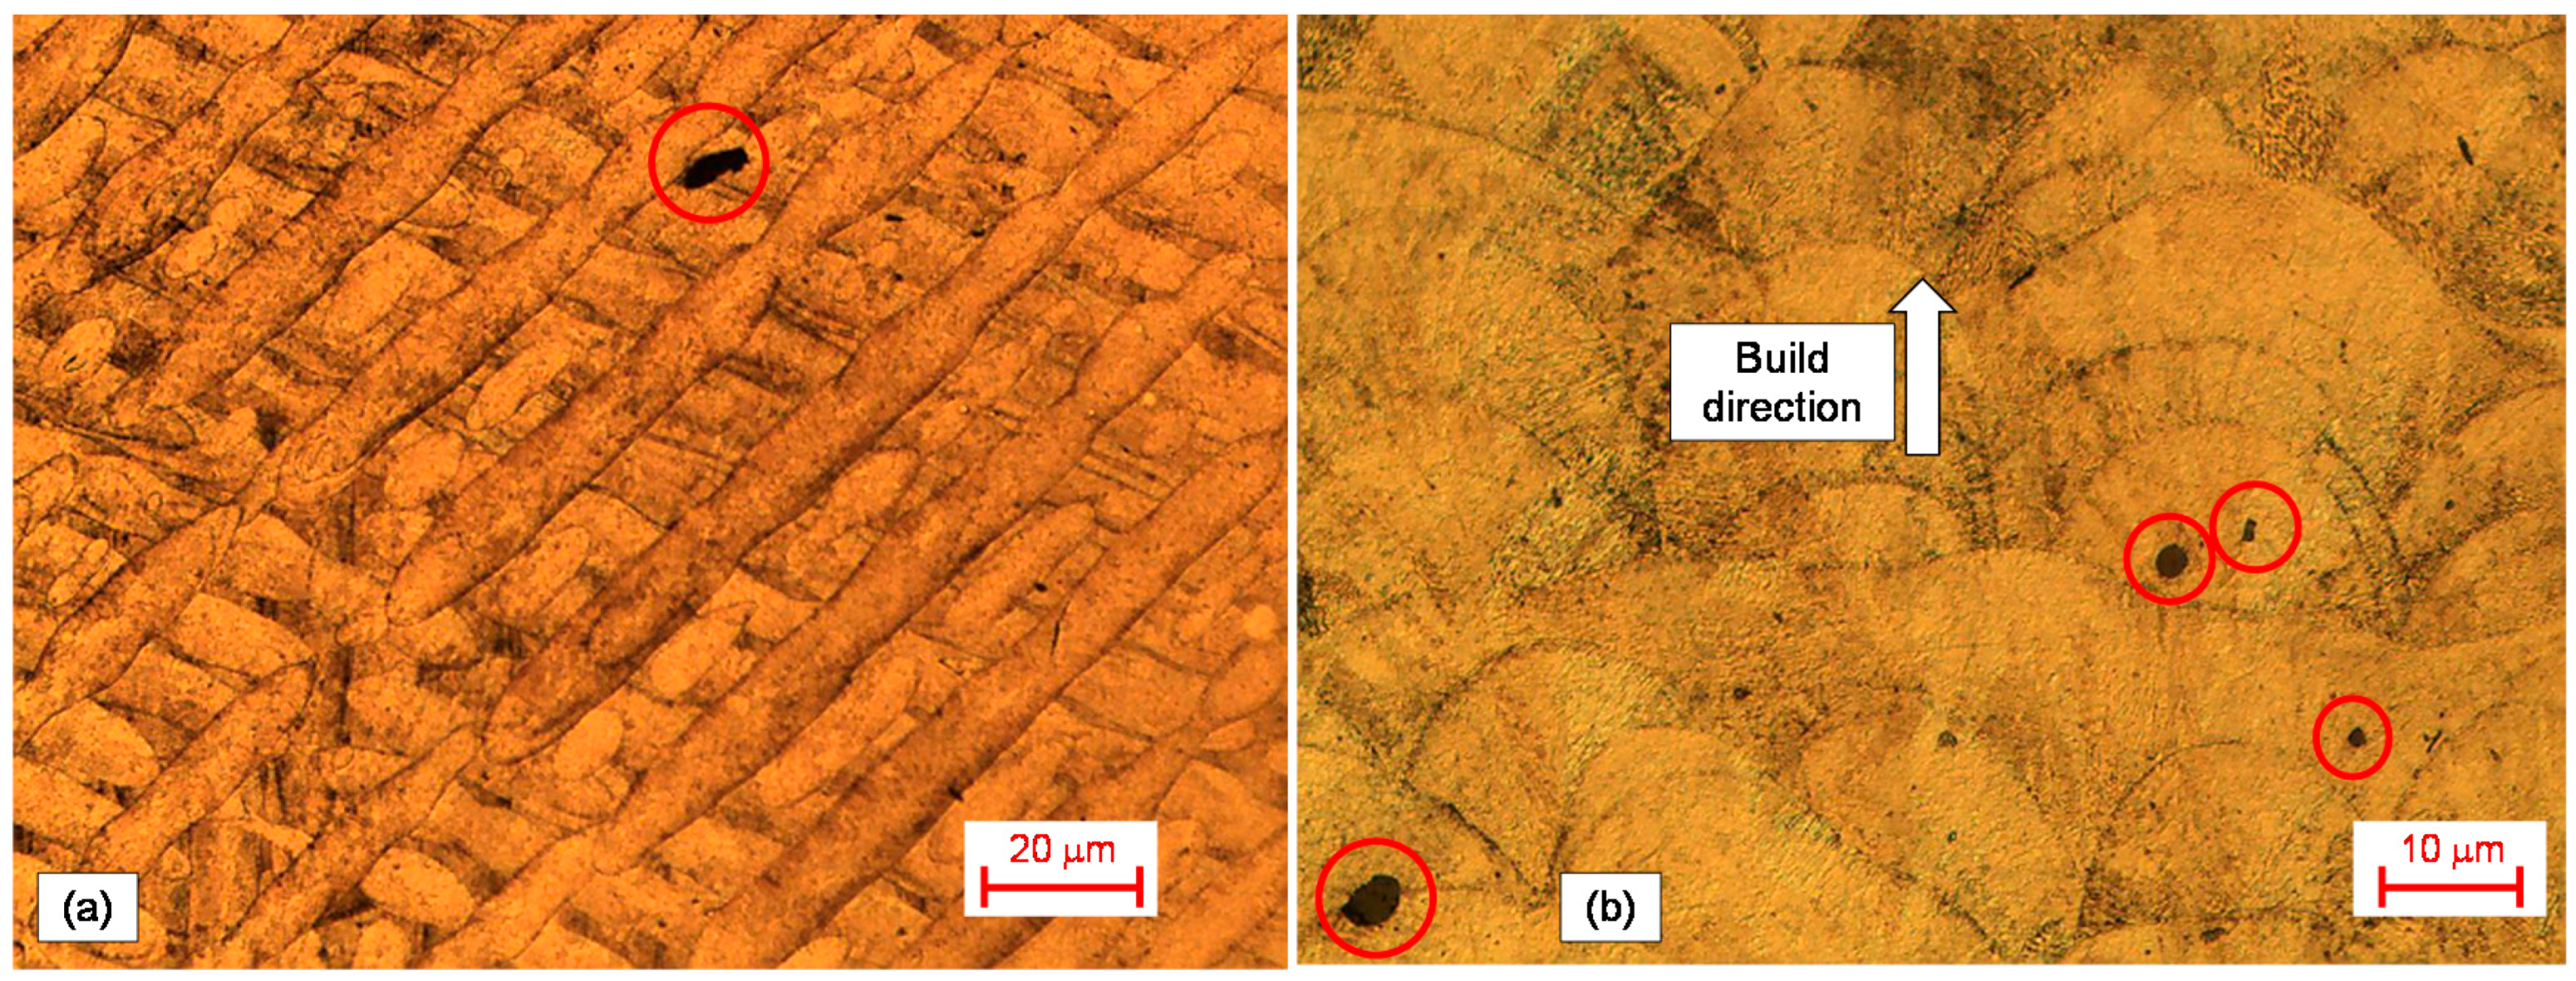
Micrographies indicated that laser scanning traces were visible both in longitudinal and in transverse sections, regardless of heat treatment execution. Some inclusions were noticed and are marked with circles in
Figure 11, which refers to a sample of Set N. The scanning pattern in the build plane section in
Figure 11a indicates some scanning traces underneath with rotation angles corresponding to the aforementioned angle of 67°. Specimens without heat treatment, like those
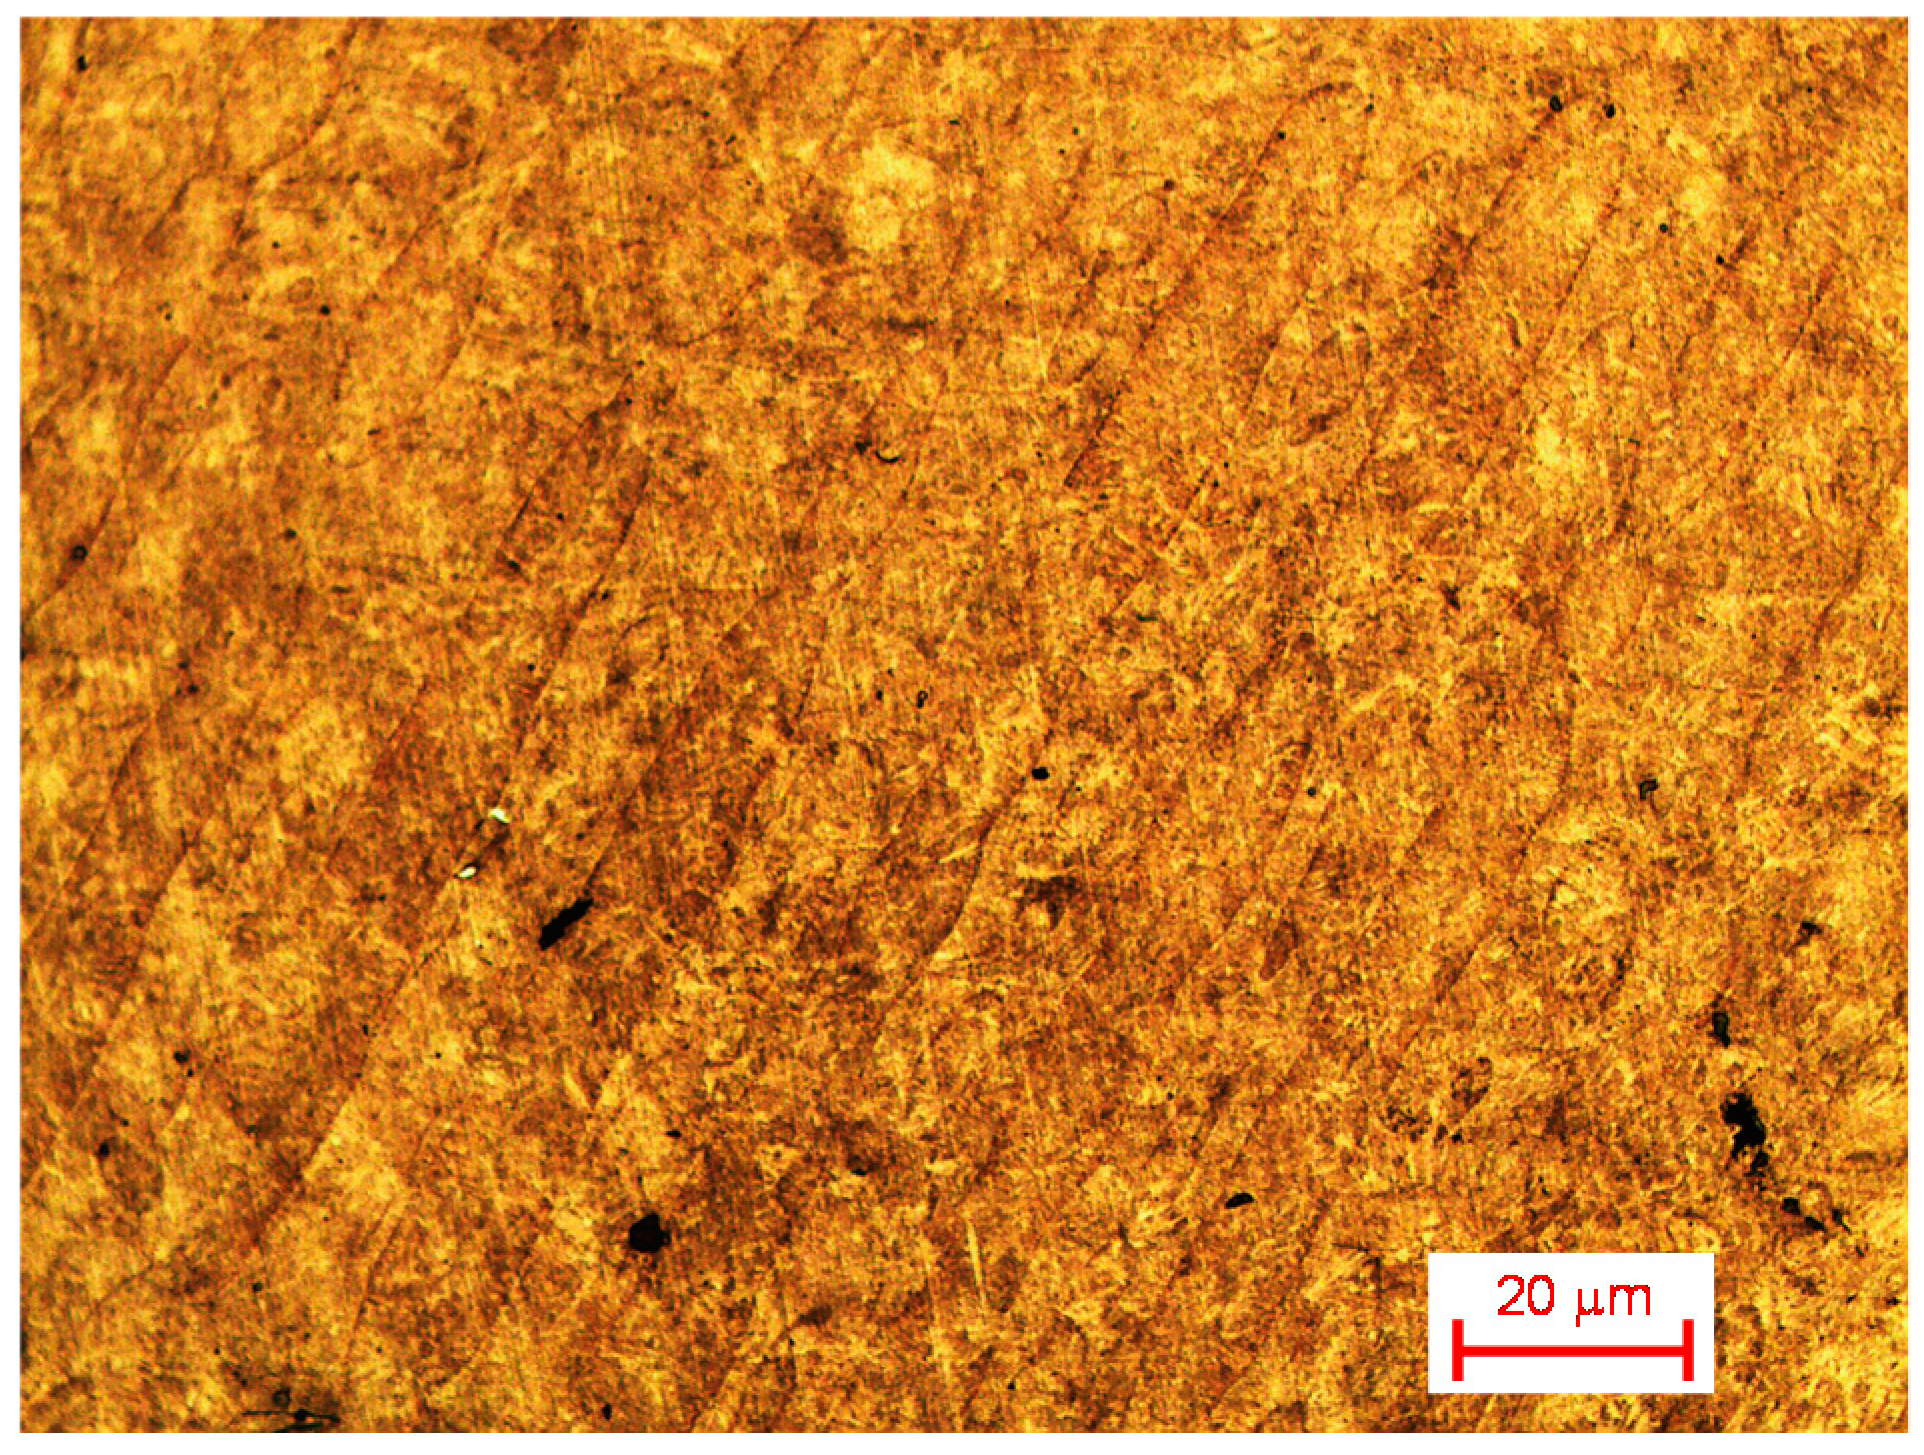
Figure 11 refers to, had more pronounced scanning traces than those that had undergone the heat treatment by age hardening, which had, conversely, a more uniform microstructure. The microstructure of a sample of Set H is shown in
Figure 12. This outcome indicates that heat treatment had some effect on fusion of the laser traces but was not effective at completing deleting these traces. For all the sample types, a comparable amount of inclusion was observed. Heat treatment had no effect on the presence of porosities in material.

 ,
, 


