Article

The Impact of Strain Heterogeneity and Transformation of Metastable Austenite on Springback Behavior in Quenching and Partitioning Steel

1
Institute of Engineering Technology, University of Science and Technology Beijing, Beijing 100083, China
2
School of Advanced Engineering, University of Science and Technology Beijing, Beijing 100083, China
3
College of Engineering, Yantai Nanshan University, Yantai 265700, China
4
Materials Department of Automotive Engineering Research Institute, Chery Automobile Co., Ltd., Wuhu 241009, China
*
Authors to whom correspondence should be addressed.
Metals 2018, 8(6), 432; https://doi.org/10.3390/met8060432
Submission received: 3 May 2018 / Revised: 29 May 2018 / Accepted: 5 June 2018 / Published: 7 June 2018

Abstract

:
Multiple strengthening methods, such as high dislocation density, high twin density, small grain size, and metastable austenite phase can give high strength to ultra-high strength steels (UHSSs). However, the high strength of UHSSs often results in a greater tendency for springback when applied in manufacturing vehicle components. In the present study, two types of UHSSs, dual-phase (DP) steel and quenching and partitioning (QP) steel are investigated to study the springback behavior during the bending process. Results indicated that both the strain heterogeneity and the transformation of retained austenite impacted the springback behavior. The springback angle of the DP steel increased with the increase in bending angle, which was caused by the increasing degree of strain heterogeneity. However, the springback angle of the QP steel decreased to a 14.75° when QP specimens were strained at a 104° bending angle due to the inhibiting effect of the phase transformation. This indicated that there was preferential phase transformation in the thickness direction in the retained austenite of the outer and inner zones. The phase transformation caused low strain heterogeneity, which resulted in a lower tendency for springback. The results suggested that QP steel could possess lower springback at a proper bending angle.

1. Introduction

Recently, ultra-high strength steels (UHSSs) have attracted much attention from researchers and automobile manufacturers because of their remarkable properties of high strength and ductility. Compared to conventional steel, the higher strength of UHSSs ensures there is greater potential for weight reduction [1,2,3]. Particularly, in order to accomplish a better balance of strength and ductility, Speer et al. [4] proposed the quenching and partitioning (QP) process to obtain stabilized austenite in a martensitic microstructure. As a result of the existence of transformation-induced plasticity (TRIP) effect, the newly developed QP steel also possesses high strength and great ductility with few alloy additions [5,6]. However, the high strength achieved by high strain hardening in UHSSs often results in a greater tendency for springback when applied in manufacturing vehicle components for the automotive industry using stamping technologies [7].
For accurate springback prediction, several material models are modified based on material properties, such as the Bauschinger effect [8], transient behavior [9], nonlinear elastic behavior [10], and modulus change behavior [11]. Based on the material properties, Eggertsen and Mattiasson [12] modified the yield functions and the hardening laws and concluded that the yield functions and the hardening laws have a greater impact on the predicted springback. Yang et al. [13] also reported that taking into account the change of Young’s modulus and obtaining a precise hardening function facilitate the accuracy of springback prediction. Furthermore, Wang et al. [14] simulated the loading process more accurately using a non-saturating kinematic Swift model and adopted inertia relief as a new control approach in springback calculation for the unloading process. However, there are still some problems in springback prediction of TRIP-assisted steel. Lee et al. [15,16] combined the homogeneous anisotropic hardening model and quasi-plastic-elastic strain formulations to describe the elasticity and plasticity behavior of DP steel and TRIP steel. The combined model characterizes flow curves of DP steel and predicts the springback very well. However, springback prediction is not good for TRIP steel, mainly due to its deformation-induced martensitic transformation-dependent flow behavior. Hence, the transformation of metastable austenite is considered to be a crucial essential in predicting the springback of TRIP-assisted UHSSs. The transformation of metastable austenite may cause the springback prediction of TRIP-assisted UHSSs to become more difficult. However, less attention has been focused on the relation between the transformation of metastable austenite and the springback behavior of TRIP-assisted steel so far [17,18].
The aim of this paper is to investigate the springback behavior of quenching and partitioning steel during the bending process. Moreover, the relationship between the springback behavior and the strain heterogeneity was analyzed. Additionally, the impact of transformation of metastable austenite on the springback was further investigated using dual-phase steel without transformation of metastable austenite as a reference.

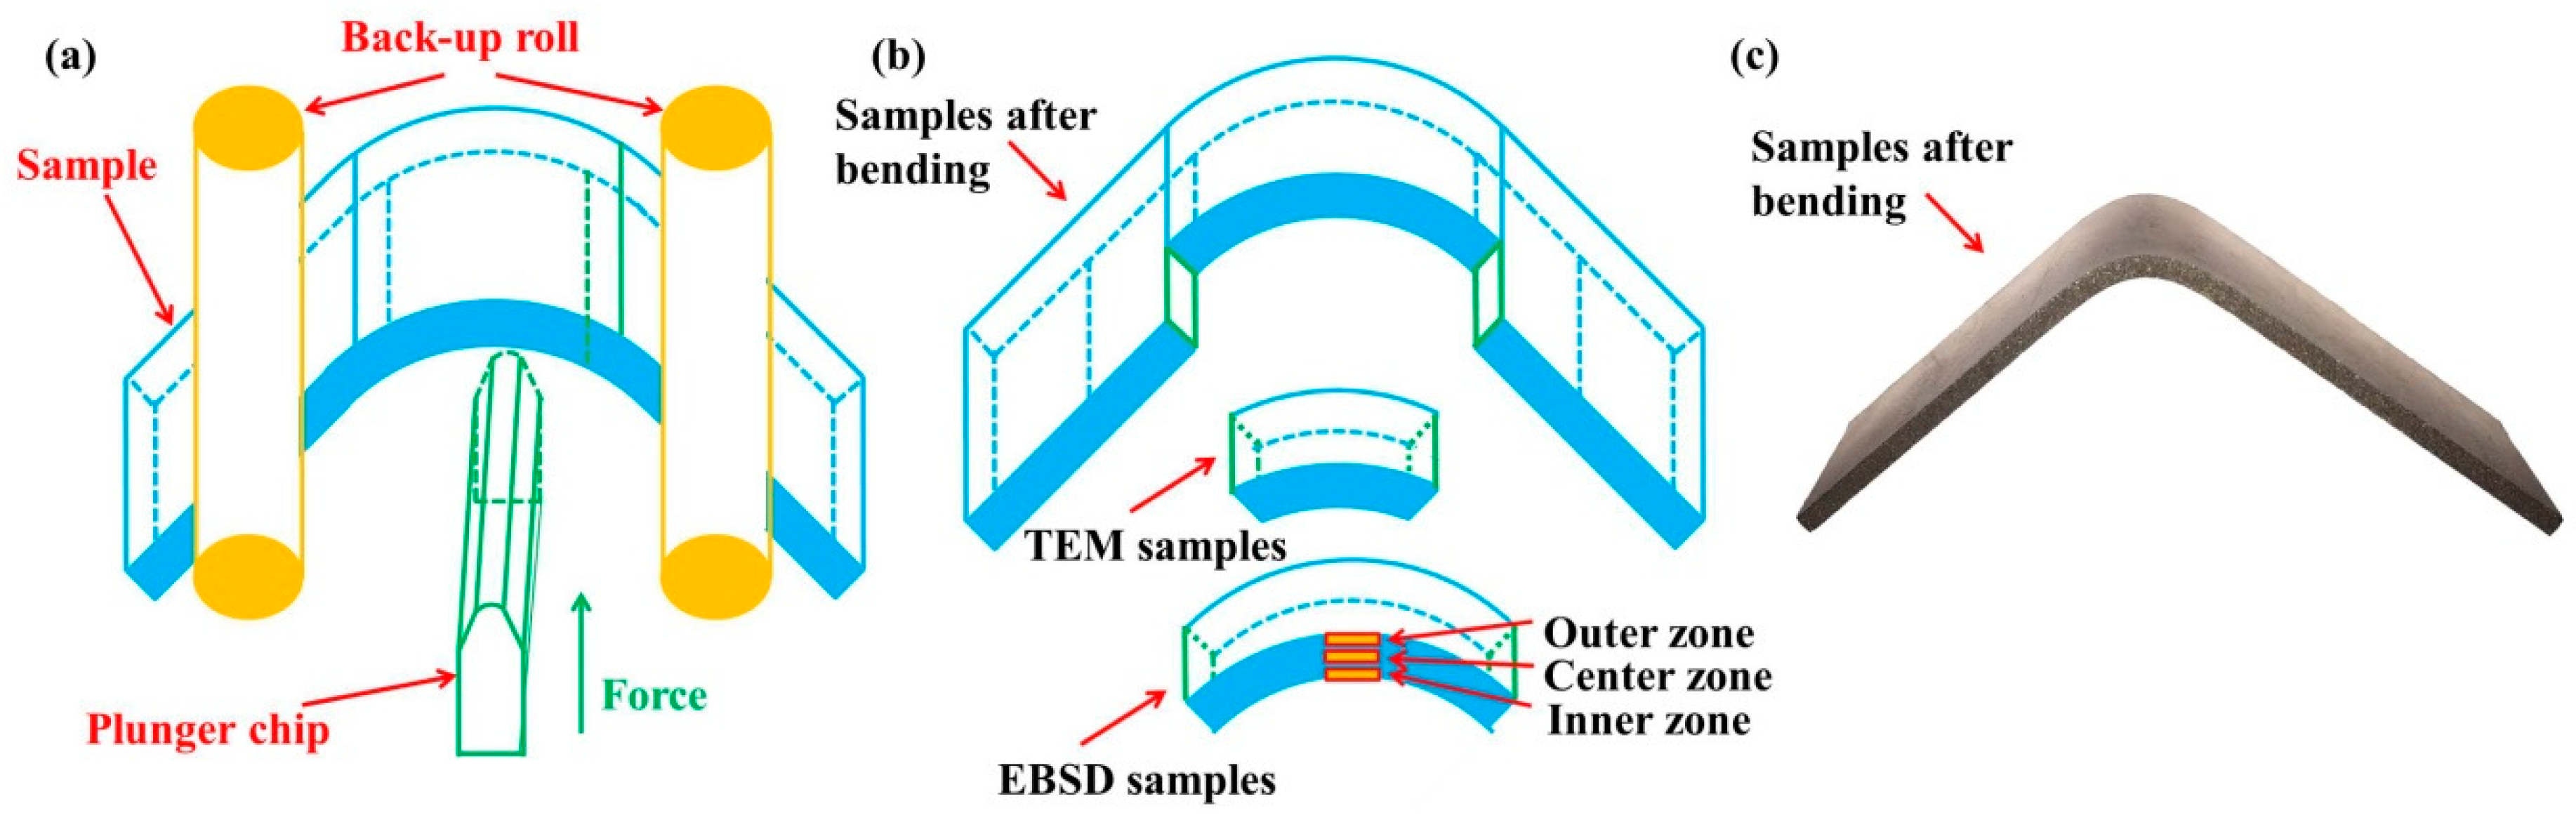
2. Experimental Procedure

The study focused on 1300-MPa-grade cold-rolled QP steel and 1200-MPa-grade DP steel. The cold-rolled QP and dual phase (DP) steels, with a 1.2-mm thickness, were provided by Hansteel. The compositions of QP and DP steel are listed in Table 1. The bending test samples were cut from the QP and DP steel along the rolling direction with length and width of 66 mm and 20 mm, respectively, in accordance with the VDA238-100 standard. Bending tests were conducted with a deformation rate of 2 mm/min on a CMT 5105 universal testing machine (SANS Testing Machine Co., Shenzhen, China), as displayed in Figure 1a–c. During the bending process, DP and QP specimens were bent to different press depths. Pictures were taken when the specimen was under bending and after springback. Based on the photos of specimens before and after springback, the springback angles of DP and QP steel were calculated. Three specimens at every bending angle were calculated. The accuracy of measurement was ensured based on the repeated specimens. Furthermore, the bending angles were calculated based on Equations (1)–(4) [19].
g = ( R + L 2 ) 2 + ( R + a S ) 2
h = 2 ( R + a ) 2 [ ( R + L 2 ) ] + 2 ( R + L 2 ) 3 2 ( R + a S ) 2 [ ( R + L 2 ) ]
i = ( R + a ) 4 2 ( R + a ) 2 ( R + L 2 ) 2 ( R + a S ) 2 ( R + a ) 2 + ( R + a S ) 2 ( R + L 2 ) 2 + ( R + L 2 ) 4
α = 2 { arctan [ ( R + a ) 2 ( h 2 4 g i h 2 g + R + L 2 ) 2 ( R + a S ) h h 2 4 g i 2 g ] 180 π }
where R and L represent the roll radius and the distance of two rolls, respectively; S and a are the stroke depth and the specimen thickness, respectively; α is the bending angle of the specimens; and g, h, and i are the intermediate variables of the calculation process.
Transmission electron microscopy (TEM, F20 FEI, Hillsboro, OR, USA) and electron backscattered diffraction (EBSD, Nordlys-II & Channel 5.0, Oxford, UK) were used to characterize the microstructure. TEM and EBSD specimens were cut from the bending specimens as shown in Figure 1b. After mechanical grinding, EBSD samples were polished and electro-polished at room temperature using a solution containing 95 vol % C2H5OH and 5 vol % HClO4. The TEM samples were mechanically ground to a thickness of 50 µm and then electro-polished with a twin-jet electropolisher (Struers TenuPol-5, Copenhagen, Denmark) at −20 °C using a solution containing 85 vol % C2H5OH and 15 vol % HClO4. The retained austenite (RA) volume fraction of QP steel was measured using X-ray diffraction (XRD, STOE, Darmstadt, Germany) and calculated based on the integrated intensity of (200)α, and (211)α ferrite/martensite peaks and (200)γ, (220)γ, and (311)γ austenite peaks.

3. Results and Discussion

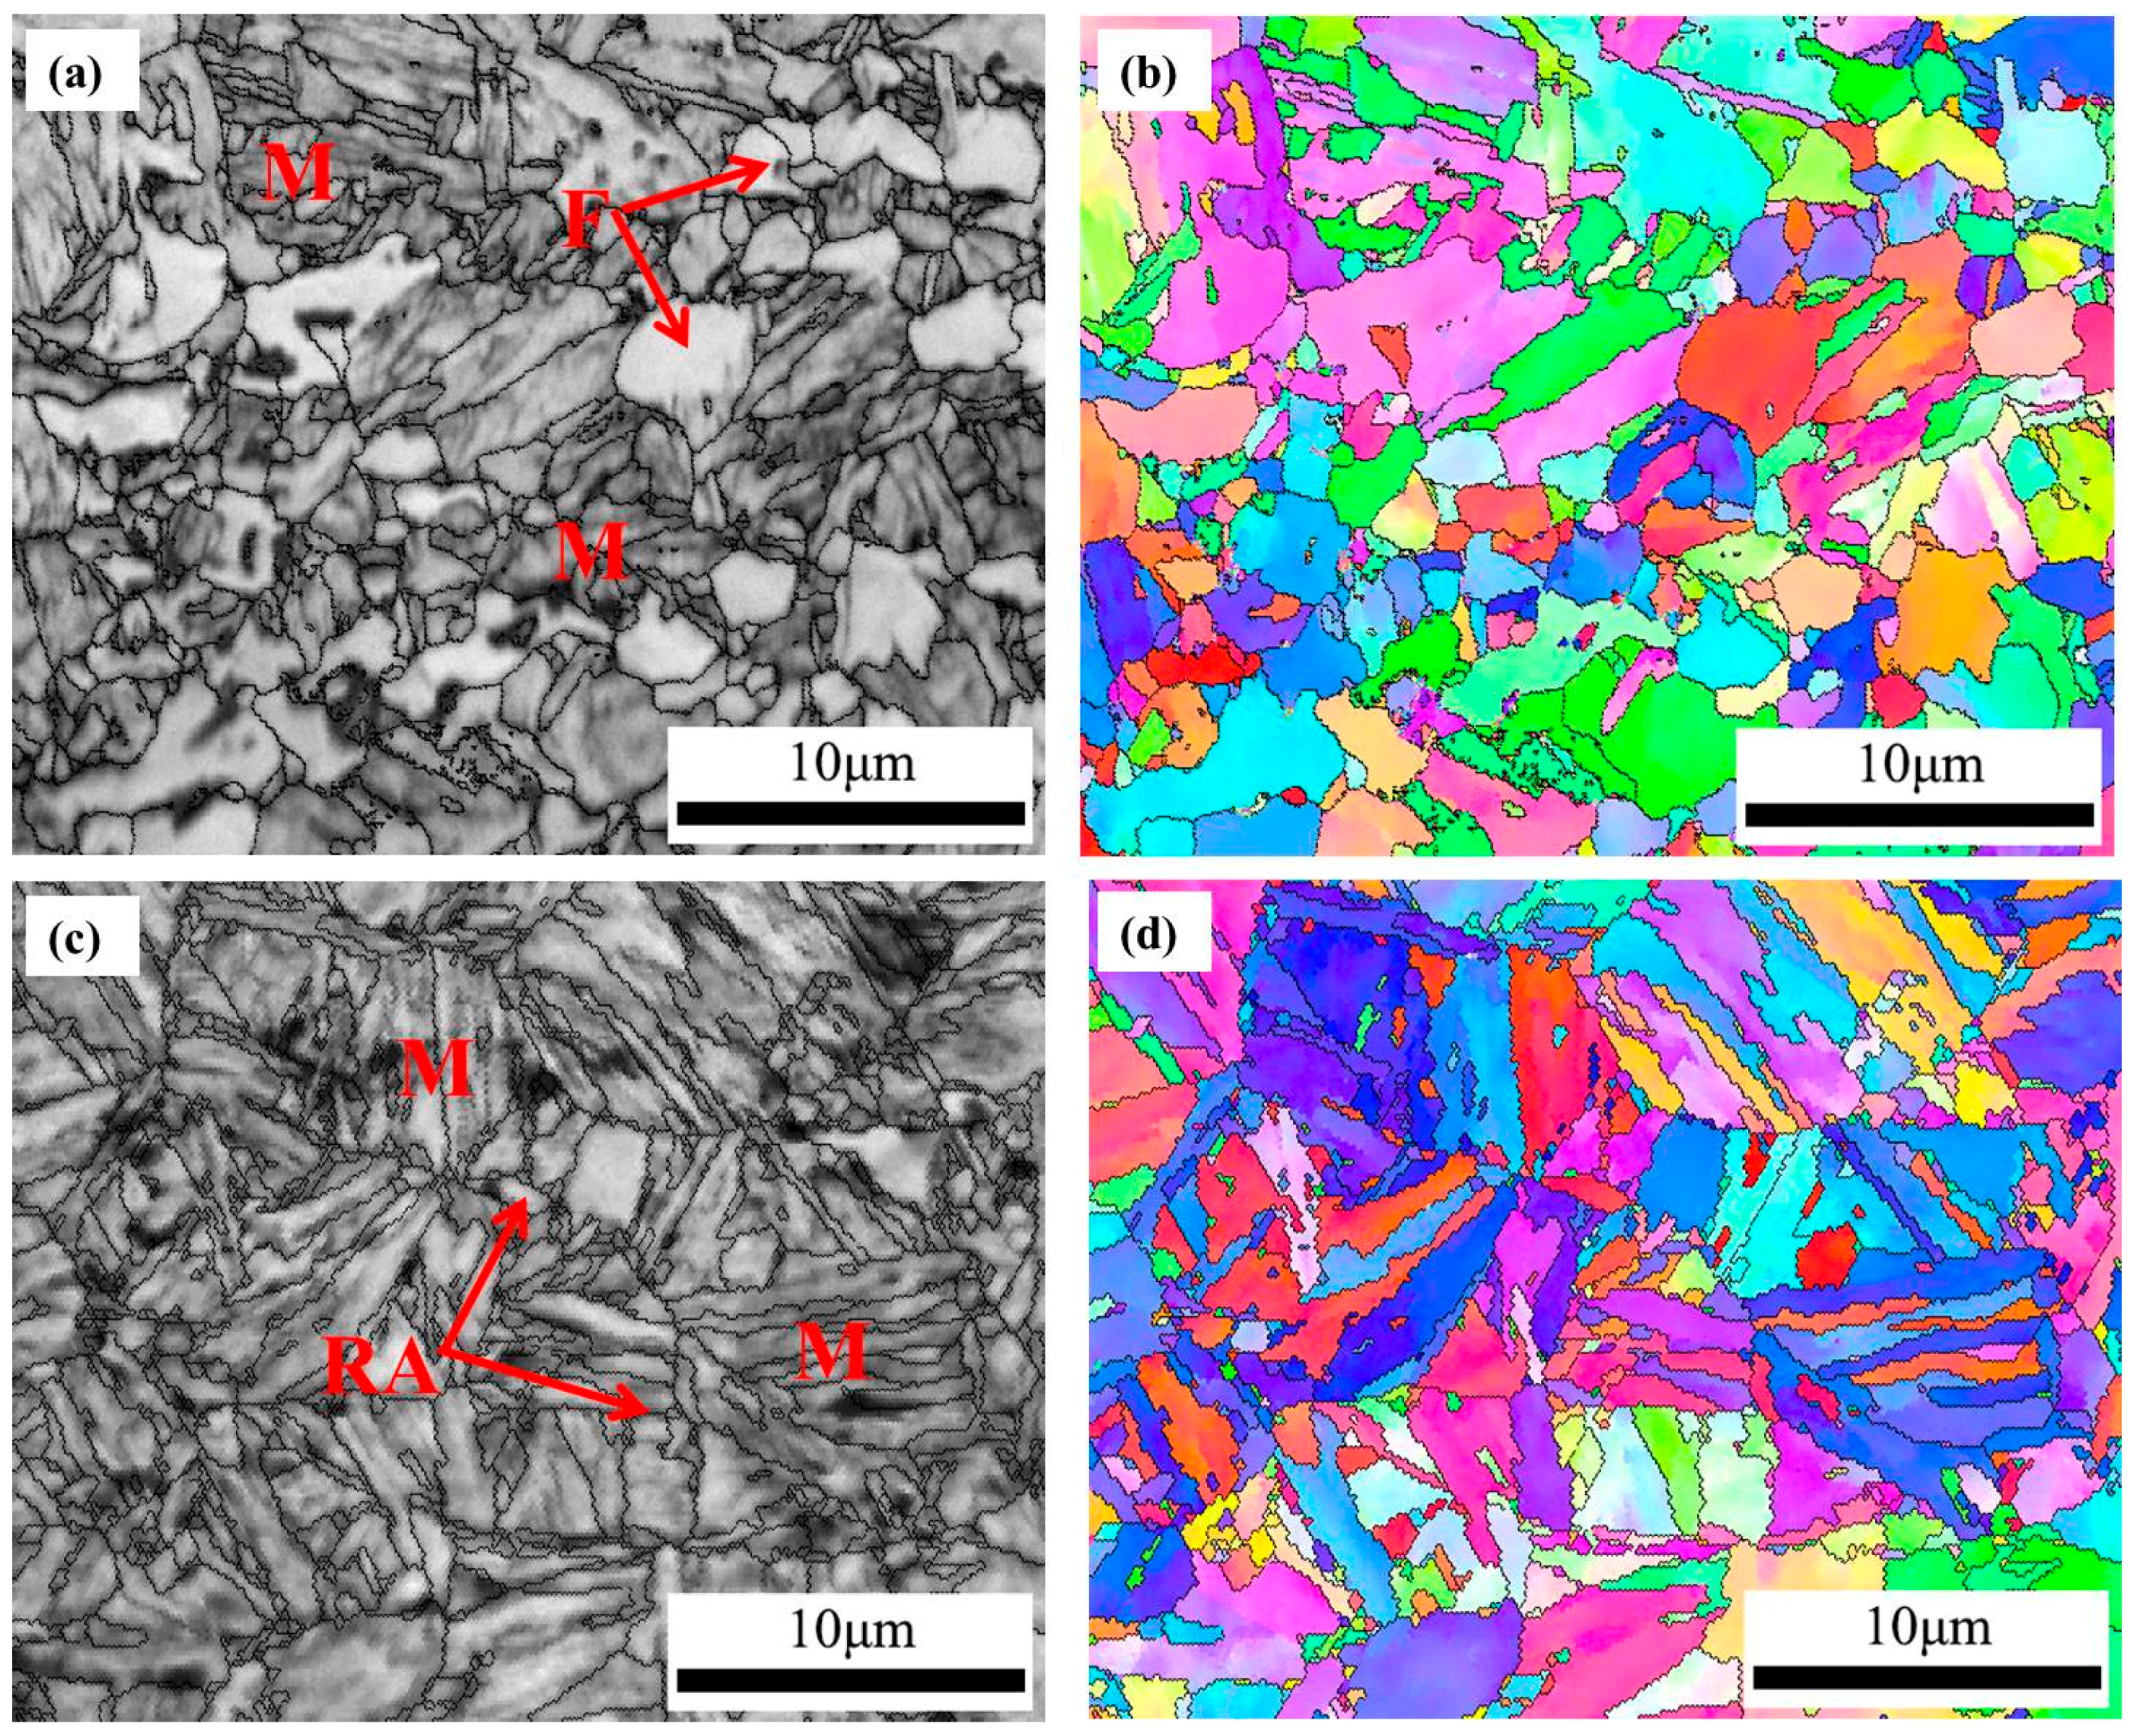
3.1. Initial Microstructures

The microstructure of DP and QP steel prior to deformation is shown in Figure 2. As depicted in Figure 2a,b, the DP steel sheets had lath-like martensite and island-like ferrite, distributed homogeneously across the material. The microstructure of the QP steel contained martensite and retained austenite (Figure 2c,d). The retained austenite was highlighted by red arrows in Figure 2c. The retained austenite volume fraction in QP steel was 15.9%, which was evaluated using XRD and EBSD analysis. The difference between the results of both RA volume fraction measurement techniques was small (i.e., maximum of 1.4%).

3.2. Bending Springback Properties

The bending springback properties of the DP and QP steel are shown in Figure 3, as a function of bending angle. Figure 3a illustrated that the stress of the DP steel and QP steel increased rapidly with the bending angle. The DP steel yielded at a bending angle of around 10°, followed by significant bending deformation. However, the QP steel yielded at a bending angle of around 17°. Such differences in yielding are often found in unixial tension tests of automotive steel because of the different strengths [20,21]. Interrupted bending specimens, strained at 74°, 104°, and 128°, were conducted for the purpose of investigating the springback properties. Figure 3b shows the plot of springback angle versus bending angle in both DP and QP steel. The springback angle of the DP steel increased with the increase in the bending angle. This phenomenon is in accordance with the results of Peng et al. [22] and Li et al. [16]. Nevertheless, the springback angle of the QP steel strained at 104° was lower than that strained at 74°. After achieving a low value of 14.75° at the bending angle of 104°, the springback angle obtained a relatively high value of 18.05° when QP steel was strained at 128°. Moreover, the springback angles of the QP steel deformed at different angles were higher than that of DP steel. According to Gardiner [23] and Wollter [24], springback angle is dependent on yield strength and elastic modulus during bending. DP steel and QP steel have the same elastic modulus (202 GPa). Thus, the high springback angle of the QP steel was probably attributable to the high yield strength.

3.3. Microstructure Characterization of the DP and QP Steel

3.3.1. Deformation Microstructure of the DP Steel

Microstructure characterization of the bending specimen at a 74° angle is compiled in Figure 4. Grain boundary maps (Figure 4a,c) of the EBSD measurements revealed that the majority of the angles of the grain boundary had values below 15° (low-angle grain boundary; LAGB; black) in the outer zone and the inner zone of the bending specimen. However, the specimen revealed the majority of the high-angle grain boundaries (HAGB; >15°; green and yellow) were in the center zone (Figure 4b). It is a known fact that the low angle grain boundary represents the degree of deformation [25,26]. Thus, the large misorientation difference in the grain boundary at different zones indicated that the strain heterogeneity occurred during the bending test. The strain heterogeneity of bending specimens is also illustrated in local misorientation distribution maps displayed in Figure 4. From Figure 4d–f, the local misorientations of the outer zone and inner zone were around 2°, while the local misorientation of the center zone was around 1°. Betanda et al. [27] reported that local misorientation distribution maps are an effective indicator of local strain in crystal materials. Therefore, the difference in the local misorientation also confirmed the occurrence of strain heterogeneity. In order to reliably characterize deformation of the DP steel during the bending test, the local misorientation data were used as a measure. Quantification results for the local misorientation are compiled in Figure 5a. The relative frequency of low-angle local misorientation (LALM, <1°) in the center zone was relatively higher than that of the inner zone and the outer zone, while the relative frequency of the high-angle local misorientation (HALM, ≥1°) was lower. This result also manifested the strain heterogeneity of specimens in the thickness direction. Moreover, strain heterogeneity also occurred in the samples strained at 104° and 128°.
To characterize the degree of strain heterogeneity, the difference in kernel average misorientation (KAM) was used [28,29]. Figure 5b presents the difference in kernel average misorientation when specimens deformed at different bending levels. In Figure 5b, Doc represents the KAM difference between the outer zone and the center zone; and DIc is the KAM difference between the inner zone and the center zone. From Figure 5b, it could be seen that Doc and DIc increased as the increasing bending angle, indicating that the degree of strain heterogeneity was increasing during bending. According to Zajkani et al. [30], the springback behavior is related to strain heterogeneity of different zones in thickness direction. A higher degree of strain heterogeneity corresponded to a higher tendency for springback. Thus, the springback angle of the DP steel increased with the increase in the bending angle, which corresponded well with the results in Figure 3b.

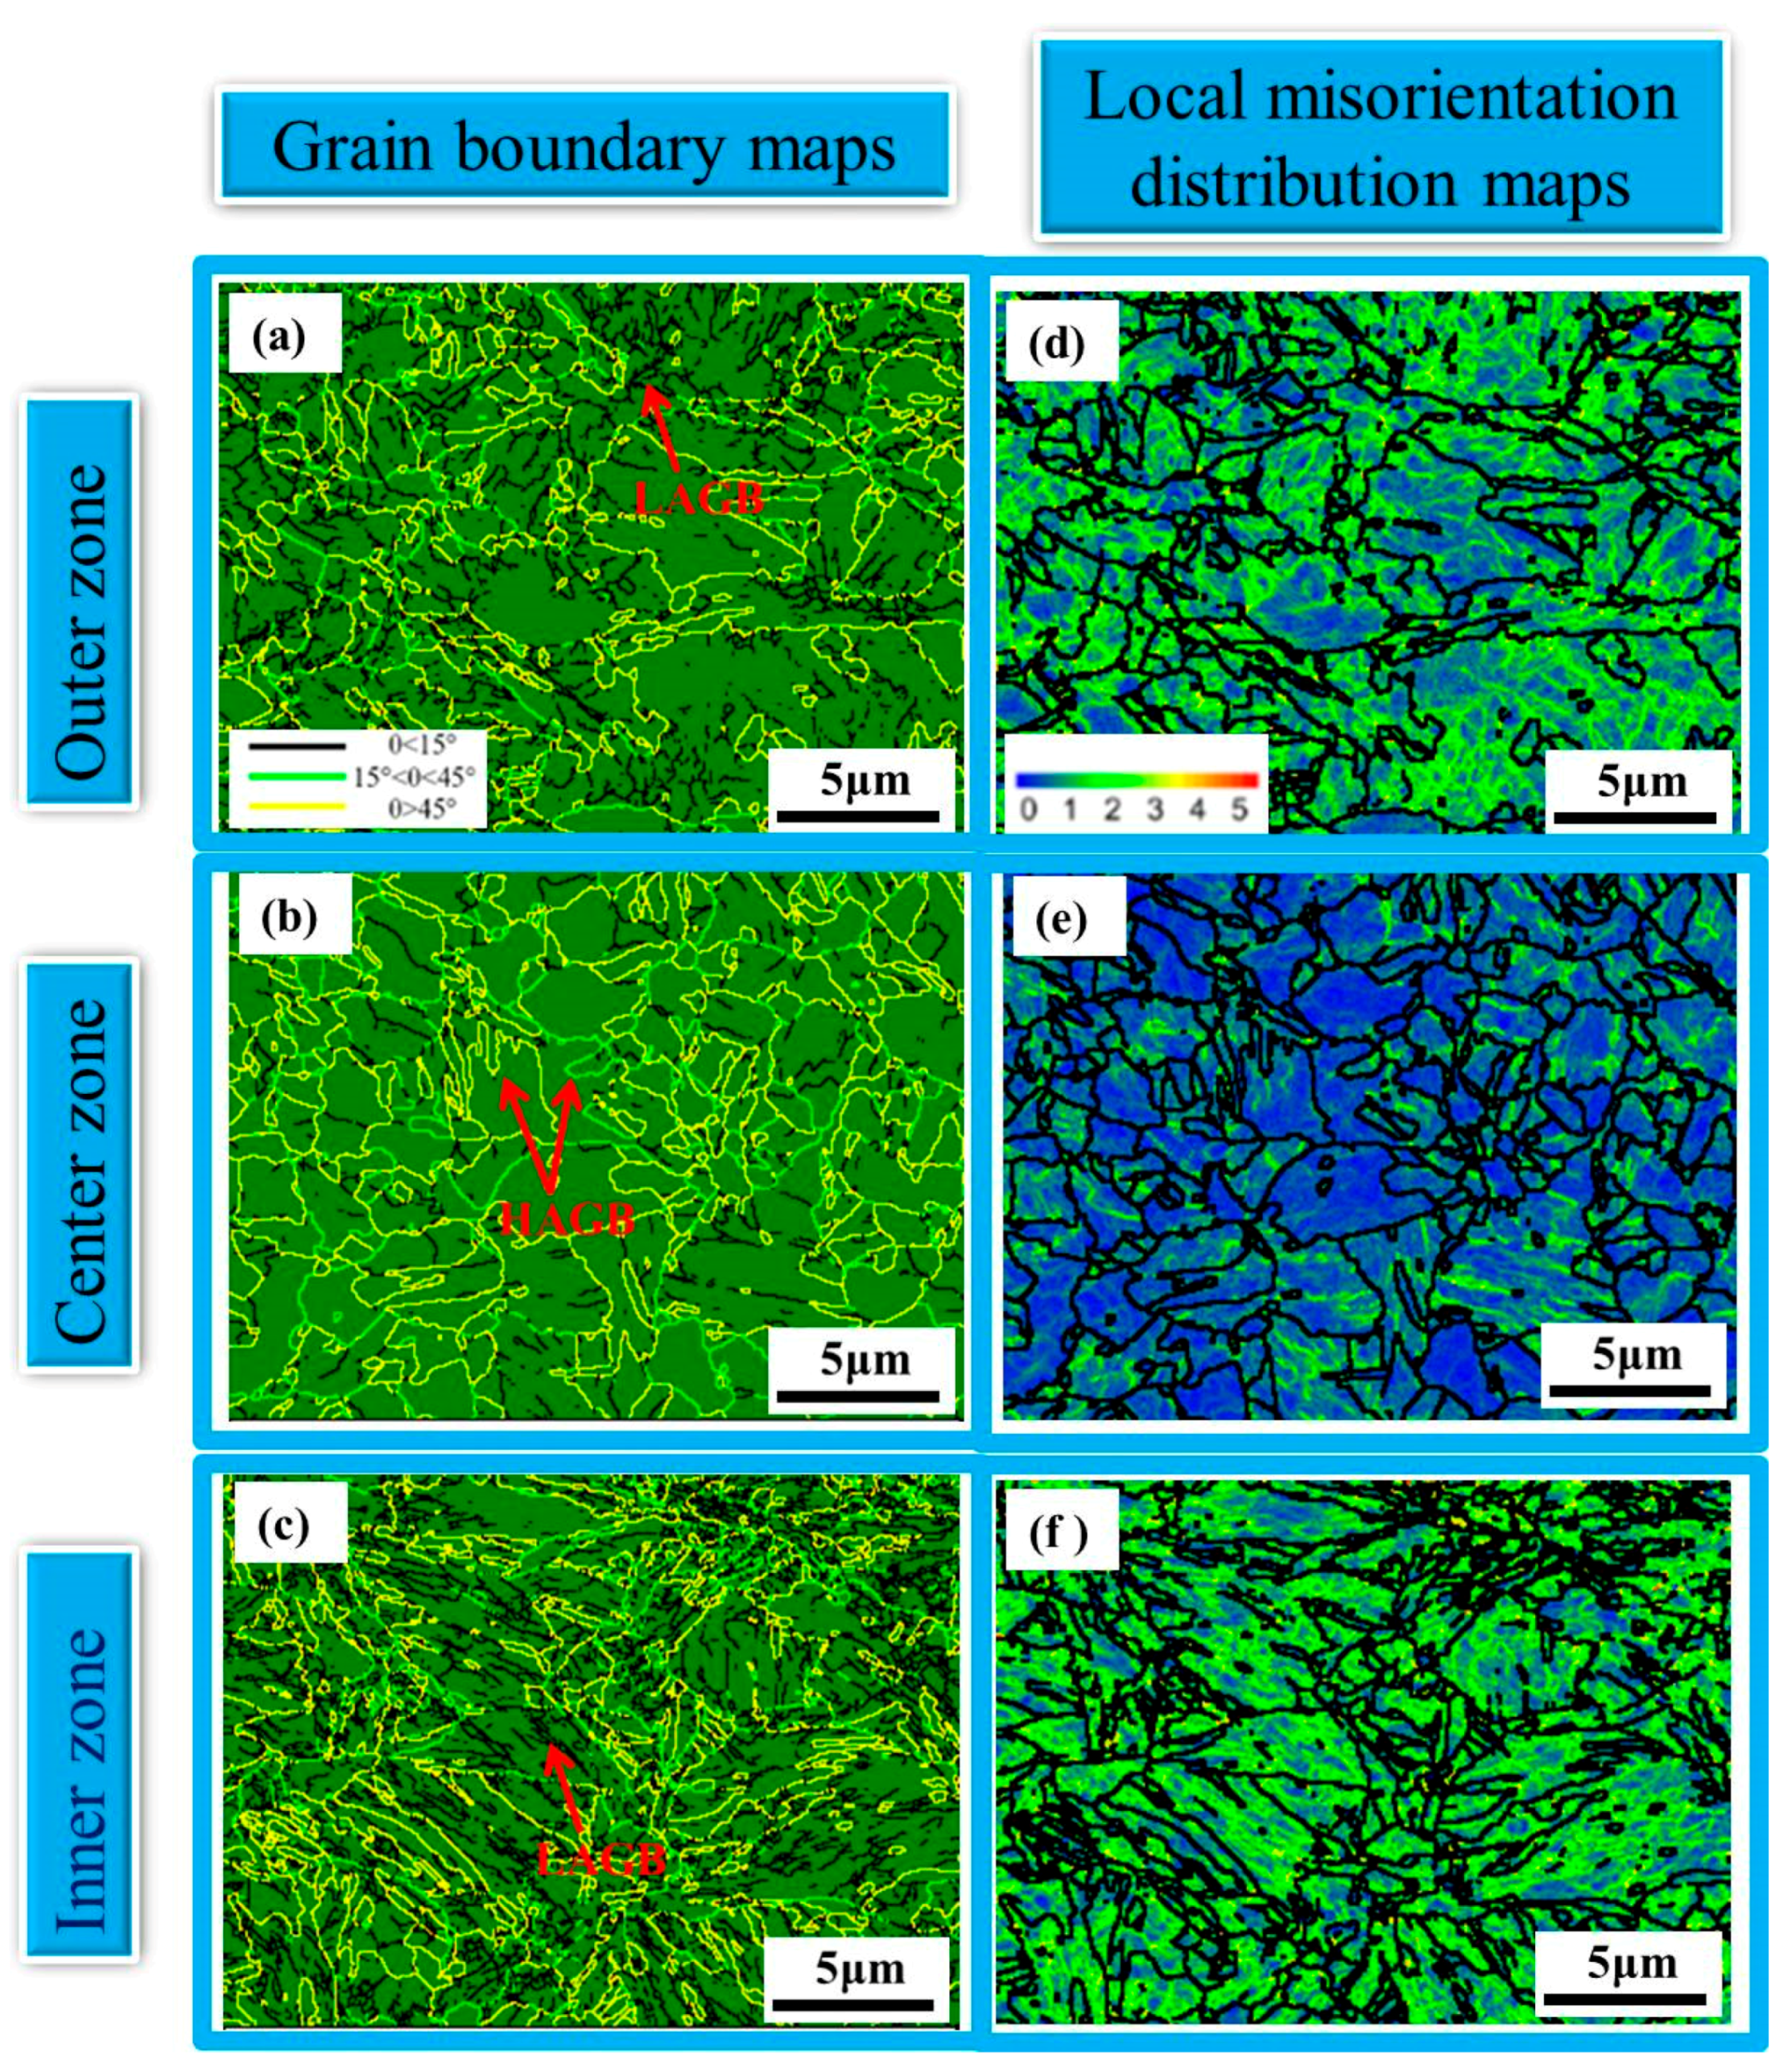
3.3.2. Deformation Microstructure of the QP Steel

EBSD maps of QP specimens strained at 74° and 128° showed similar results to those of the DP steel. However, the QP sample deformed at a 104° angle exhibited different characterisations in microstructure (as illustrated in Figure 6a–f). The low-angle grain boundary contents of the outer zone and inner zone were similar to those of the center zone. Moreover, the local misorientations of the outer zone, center zone, and inner zones were all around 1°. The results indicated that the strain heterogeneity was relatively low. The local misorientation data in Figure 7a showed that the LALM and HALM frequency differences of the three zones were also low. Frequencies differences in LALM and HALM also confirmed the low strain heterogeneity at a 104° bending angle.
Analogous to the DP steel sample, the difference in kernel average misorientation was also used to characterize strain heterogeneity. Figure 7b displays the difference in kernel average misorientation of QP specimens strained at different bending levels. Unlike DP steel, the Doc and DIc of QP steel obtained relatively low values at 104°. The lower values of Doc and DIc represented the lower degree of strain heterogeneity. Moreover, the low degree of strain heterogeneity corresponded to the lower tendency for springback. Therefore, the springback angle of QP steel was low when specimens deformed at a 104° bending angle, which also corresponded well with the results in Figure 3b.

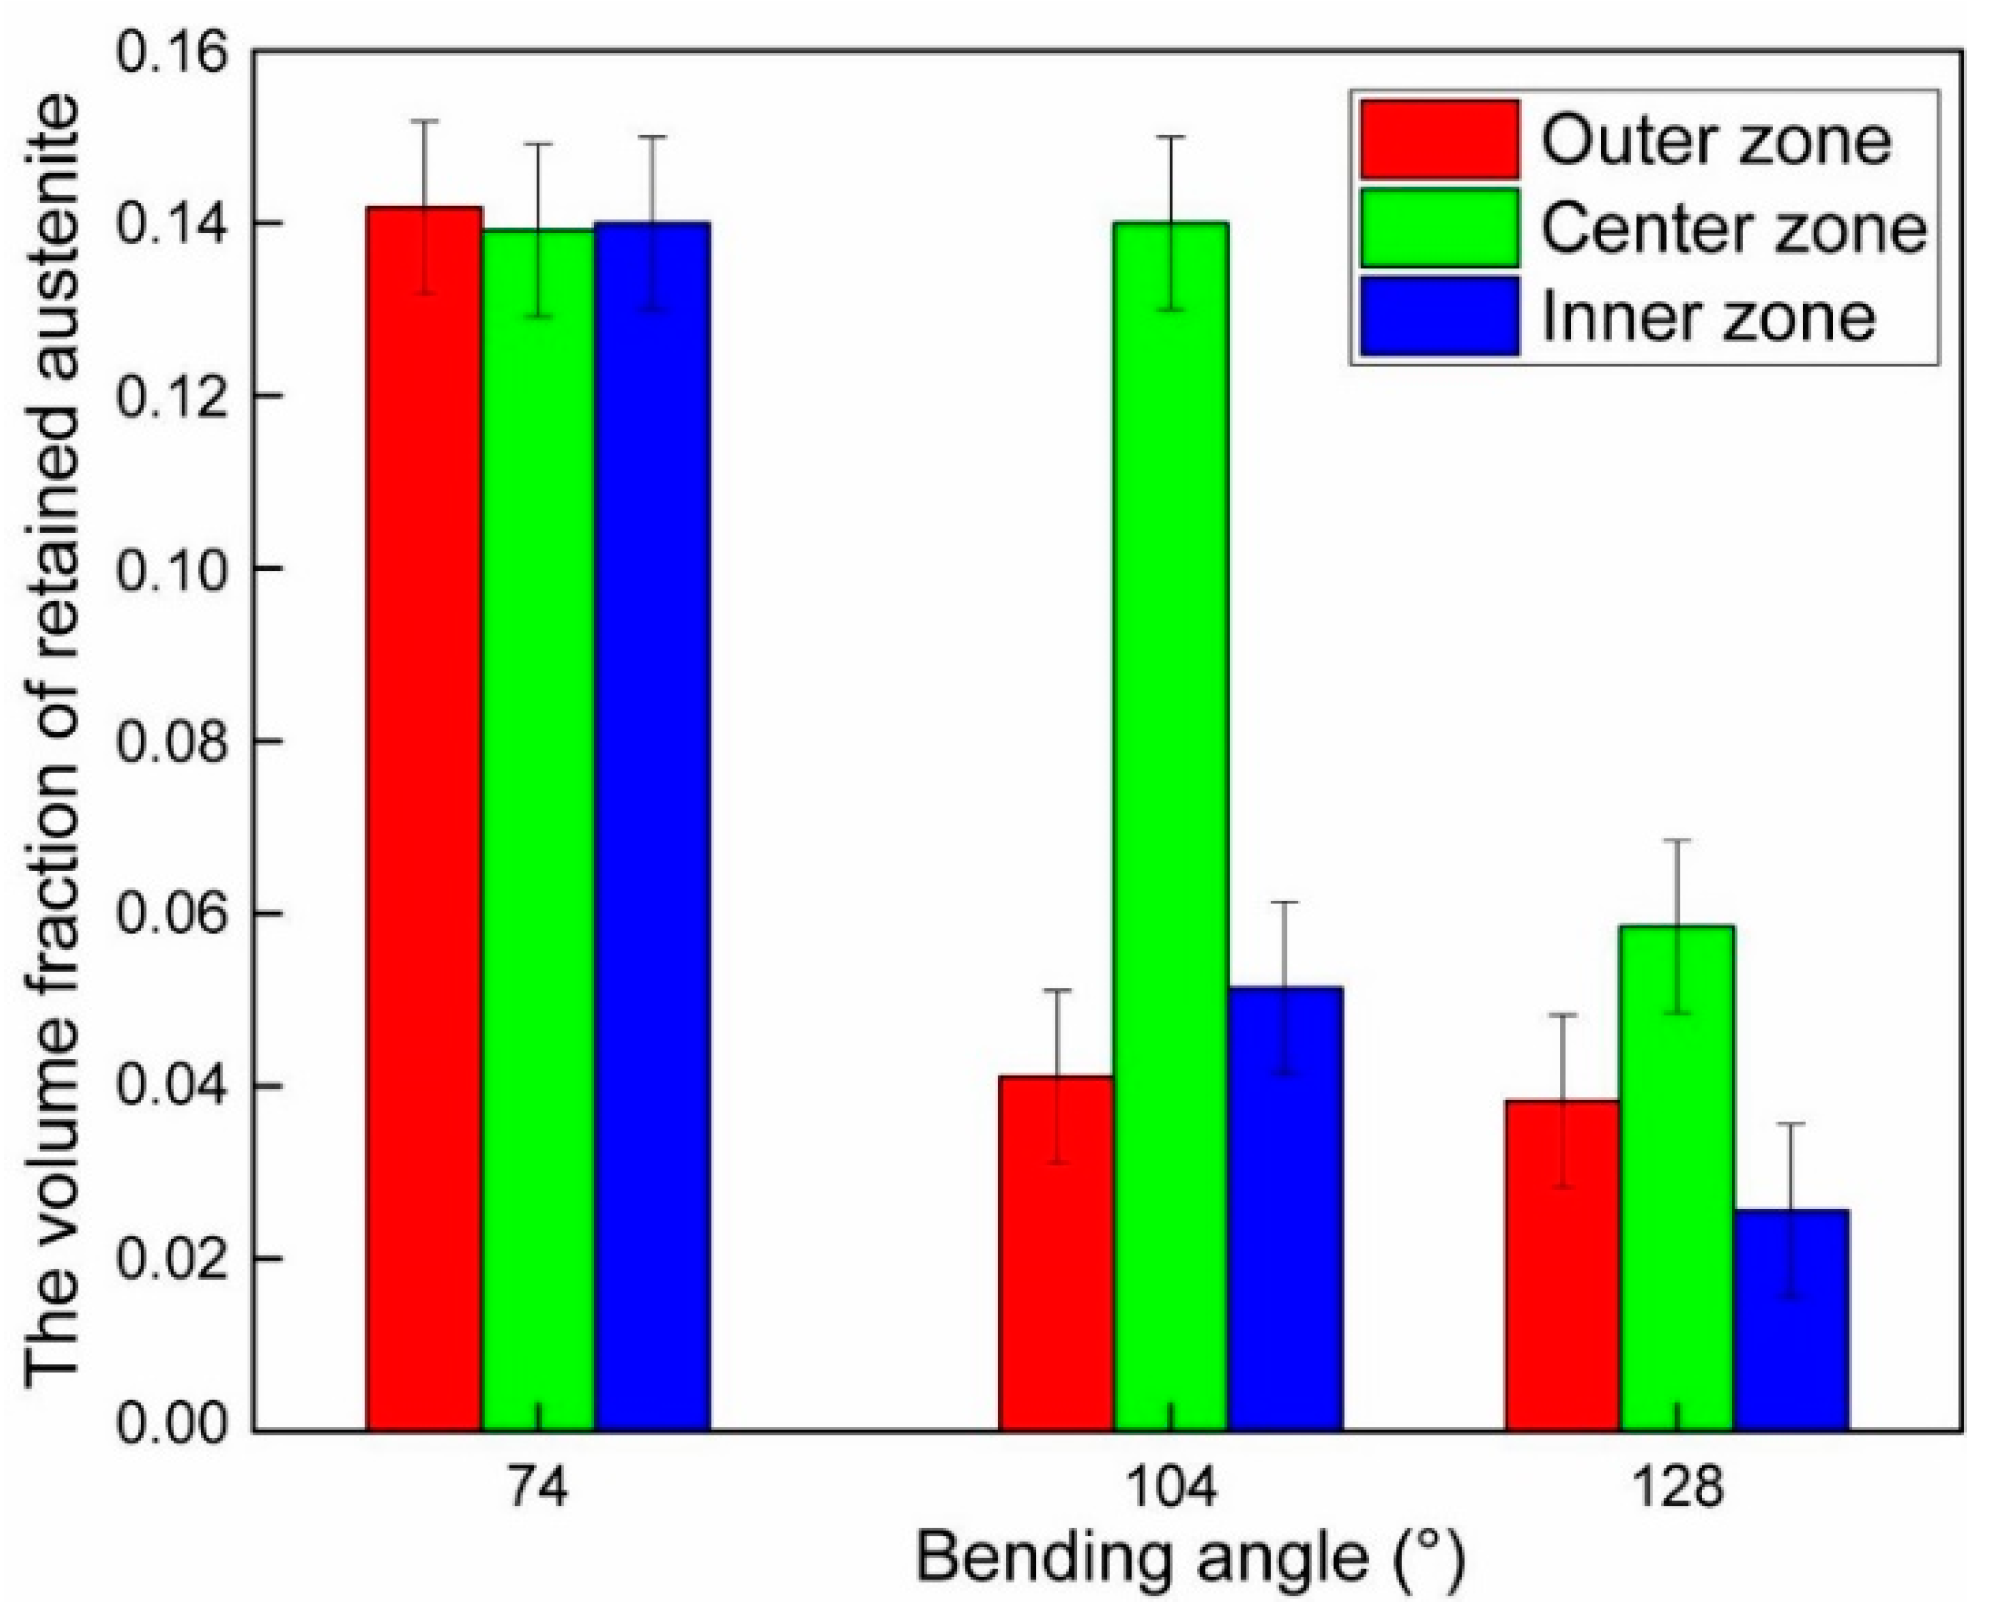
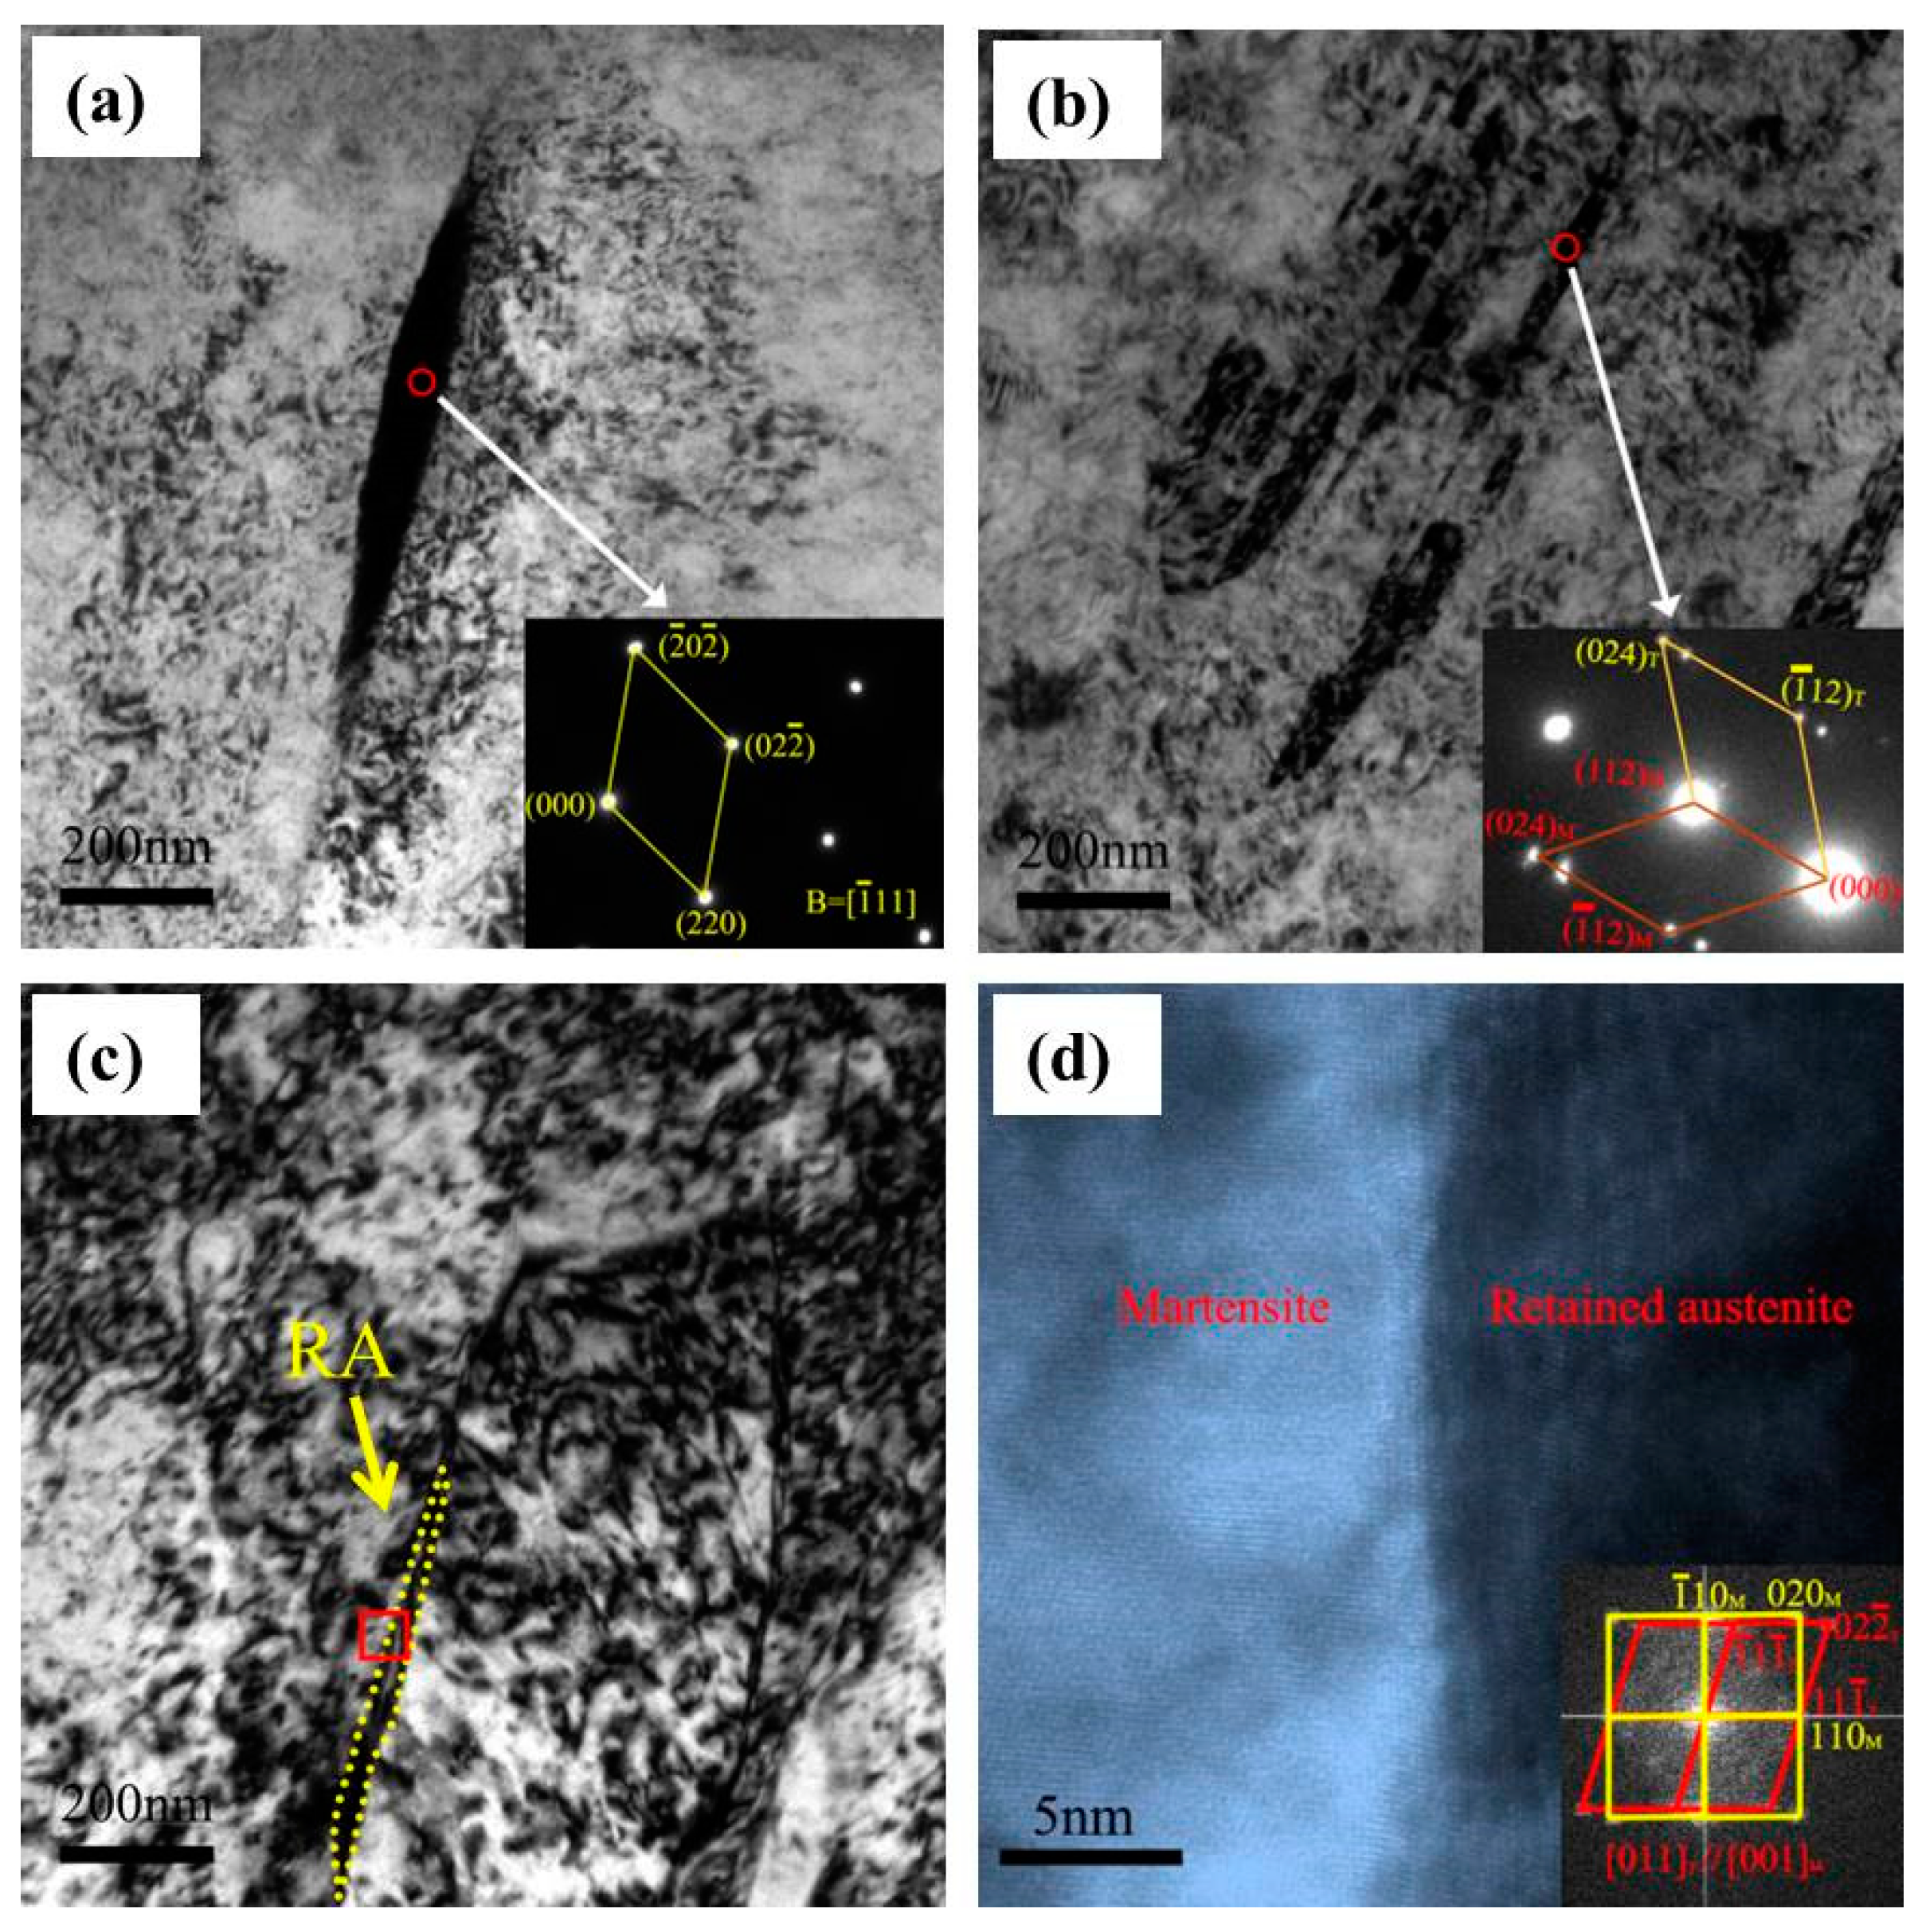
3.3.3. Transformation Characterization of Retained Austenite in the QP Steel

Figure 8 indicates the change in the retained austenite volume fractions at different bending angles. When the sample deformed at a 74° bending angle, the RA volume fractions in the outer zone, center zone, and inner zone were around 14%. Compared to the volume fraction of RA in specimens prior to bending (15.9%), only 1.9% retained austenite transformed when specimens strained at a 74° angle. It is a known fact that the RA transformation is affected by the surrounding phase [31,32]. In this research, the surrounding phase of retained austenite was only martensite due to the quenching and partitioning process. According to Song et al. [33], the retained austenite between martensite laths remained stable, while retained austenite within ferrite grains transformed preferentially during straining. Thus, the small transformation degree of retained austenite may be due to the protective effect of the surrounding martensite laths. As the sample was strained at a 104° bending angle, the retained austenite volume fraction of the outer zone and inner zone decreased significantly. The decrease in retained austenite indicated the deformation-induced martensitic transformation at higher strain. After the decrease in the outer zone and inner zone, the volume fraction of RA in the center zone decreased at a 128° bending angle. However, the RA volume fraction in the outer zone and the inner zone changed slightly. This indicated that a small degree of transformation occurred in the outer zone and the inner zone at this angle.
Figure 9 shows the retained austenite, twin martensite, and the orientation relationship between retained austenite and martensite. The film-like RA could be found between martensite laths (see Figure 9a). During deformation, the film-like RA can transform into twin martensite during deformation [33]. Nevertheless, twin martensite could not be seen at a 74° bending angle, as the lath martensite, having high strength, was not subjected to severe plastic deformation at this angle. With the sample was strained to 104°, twin martensite could be found within lath martensite (Figure 9b). Furthermore, the orientation relationship between retained austenite and martensite was a N-W relation: {1 1 1}γ//{1 1 0}M, <0 1 1>γ//<0 0 1>M, as seen in Figure 9c,d. The occurrence of twin martensite at a 104° bending angle corresponded to the decrease of RA volume fraction in Figure 8, indicating the deformation-induced martensitic transformation at higher strain.

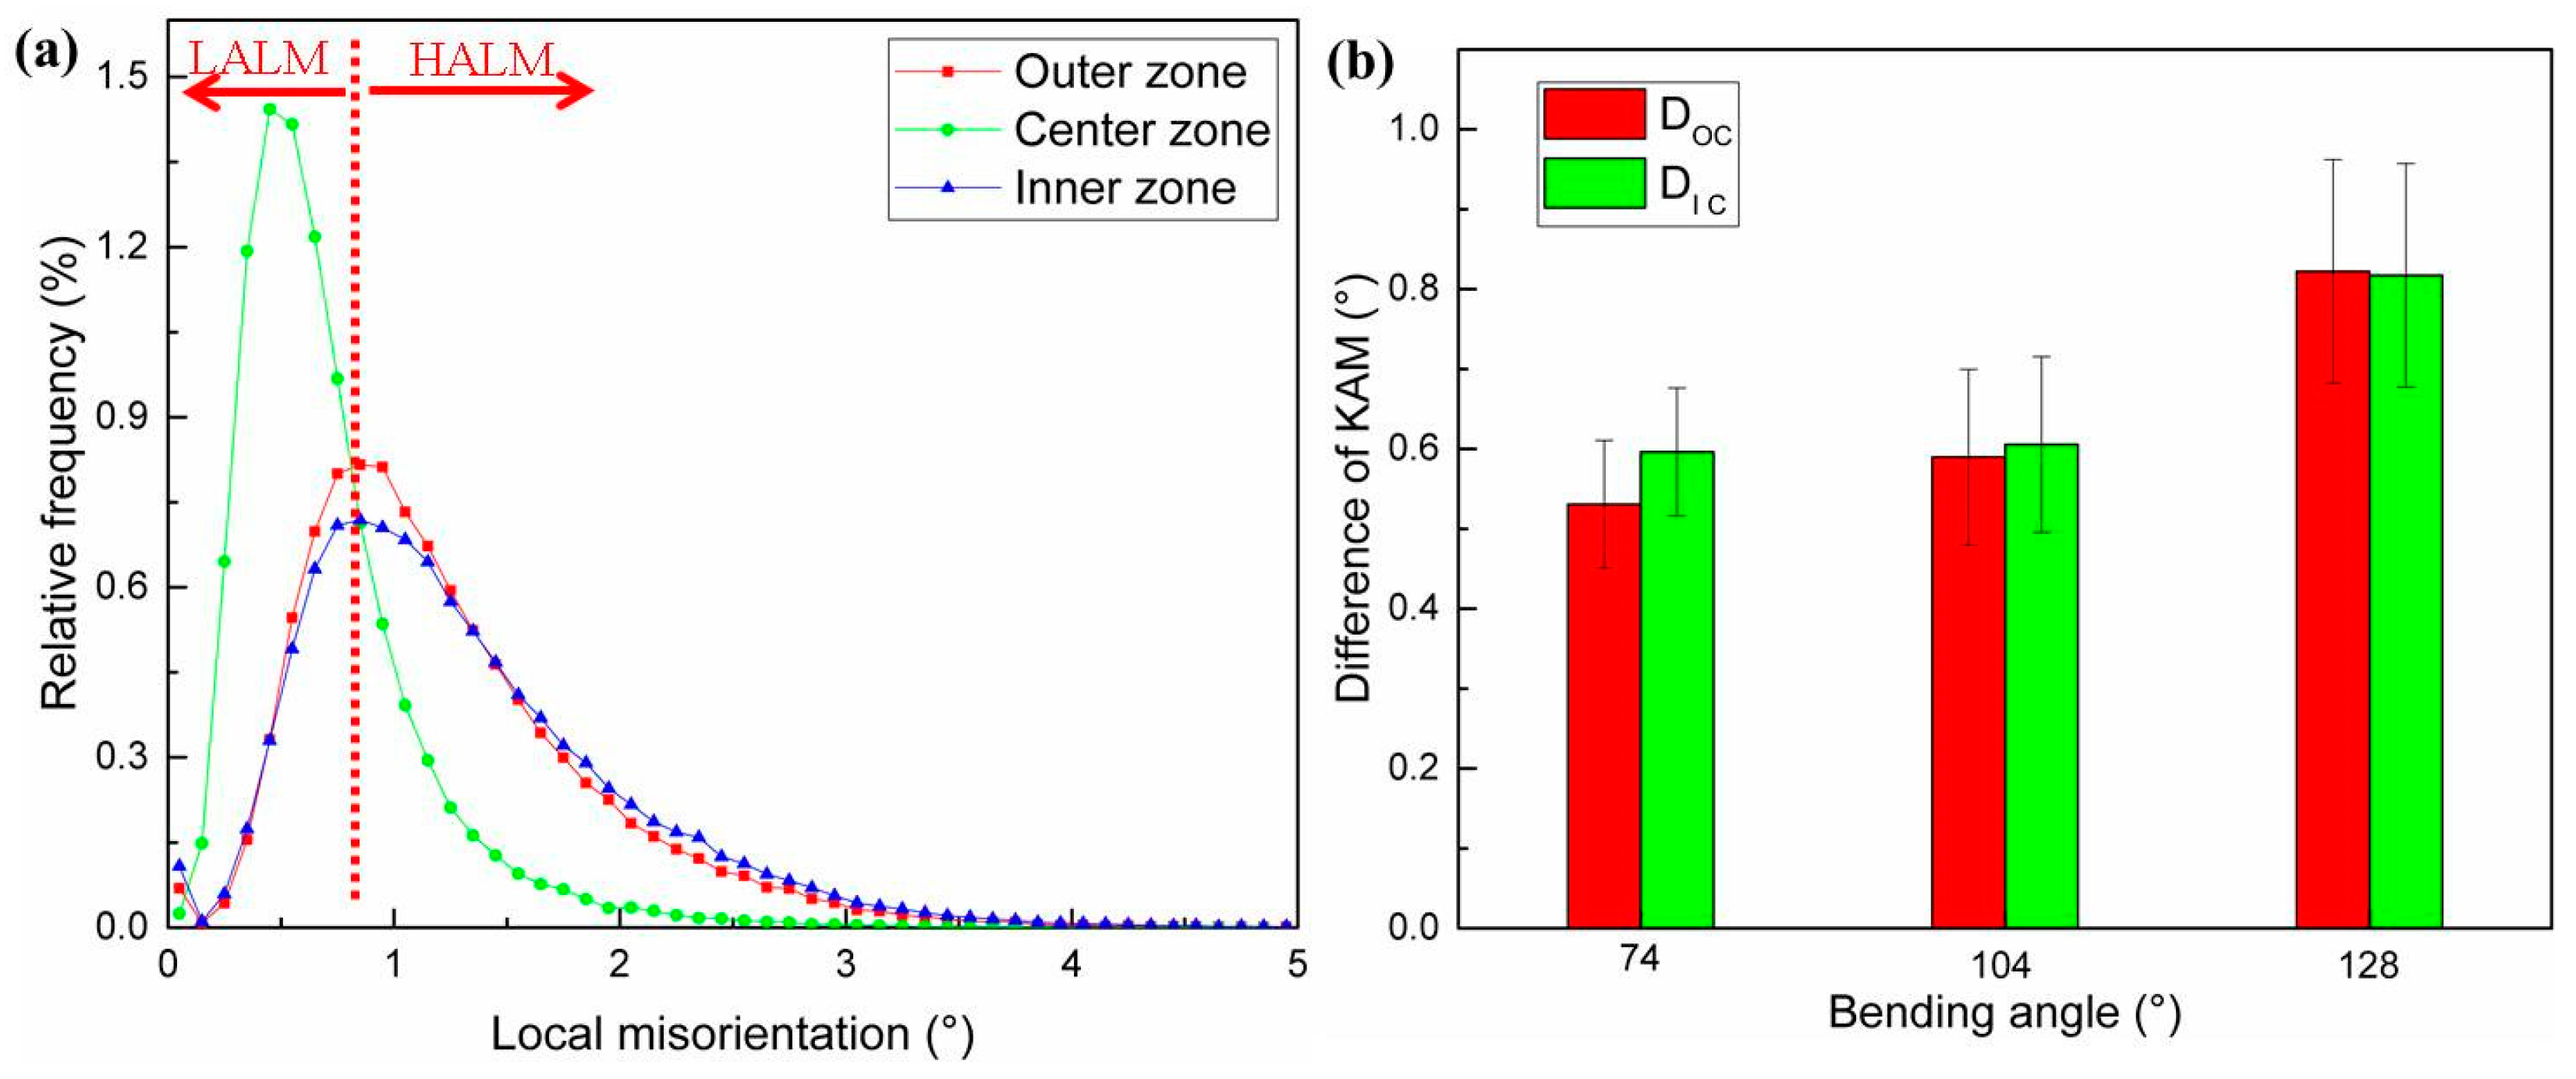
3.4. Strain Heterogeneity and Transformation of Retained Austenite in QP Steel

As mentioned above, springback is related to the degree of strain heterogeneity that is highly dependent on the stress distribution [34]. According to Yang et al. [13] and Mishra et al. [34], the stress distribution of specimens in the thickness direction is outlined schematically in Figure 10a. During the bending process, the stress values in the thickness direction changed from “zero” at the center plane, to maximum at the inner and outer surface (indicated by red arrows in Figure 10a). However, during the bending process of the specimens, the middle surface is moved to the inner zone due to the radial force [23,24,35]. After the movement of middle surface, the stress distribution along the thickness changed, as suggested by the blue arrows in Figure 10a. Thus, three zones, namely the outer zone, center zone, and inner zone, were divided based on the stress difference. Higher stress in the outer zone and inner zone resulted in the higher strain (Figure 10b). However, the strain in the center zone was low during the bending process. Therefore, strain heterogeneity occurred in the thickness direction during the bending process. According to Zajkani et al. [30], a higher degree of strain heterogeneity corresponds to higher tendency for springback. Thus, the change trends of springback angles in both DP steel and QP steel were the same as that of the strain heterogeneity degree.
According to the change of the retained austenite volume fractions in Section 3.3.3, the retained austenite transformation during bending process is displayed schematically in Figure 11. As illustrated in Figure 11a, strain heterogeneity occurred during the bending process. However, the RA remained stable as the deformation did not reach a certain critical degree [36,37]. With further deformation, the retained austenite in the outer zone and inner zone transformed into martensite (as indicated in Figure 9). Moreover, the outer zone and inner zone obtain high strength due to the transformation of martensite [38,39], while the center zone has relatively low strength. Thus, the center zone began to deform due to the relatively low strength (Figure 11b). The deformation of the center zone led to low strain heterogeneity, resulting in the lower tendency for springback. When specimens were strained at a larger angle, the retained austenite of the center zone transformed into martensite (Figure 11c). After the transformation, the strength of the center zone was almost the same as the strength of the outer zone and inner zone. Thus, the deformation occurred in the outer zone and inner zone again. High strain heterogeneity took place and the springback angle was high at this bending level.

4. Conclusions

In this paper, the effect of the strain heterogeneity and transformation of metastable austenite on springback behavior was investigated. The conclusions can be summarized as follows:
(1)
The increasing the bending angle from 74° increased the springback angle of DP steel. In contrast, the increasing the bending angle from 74° decreased the springback up to a certain angle and then it started to increase at higher bending angles. This direct comparison indicated that QP steel could possess lower springback at proper bending angles.
(2)
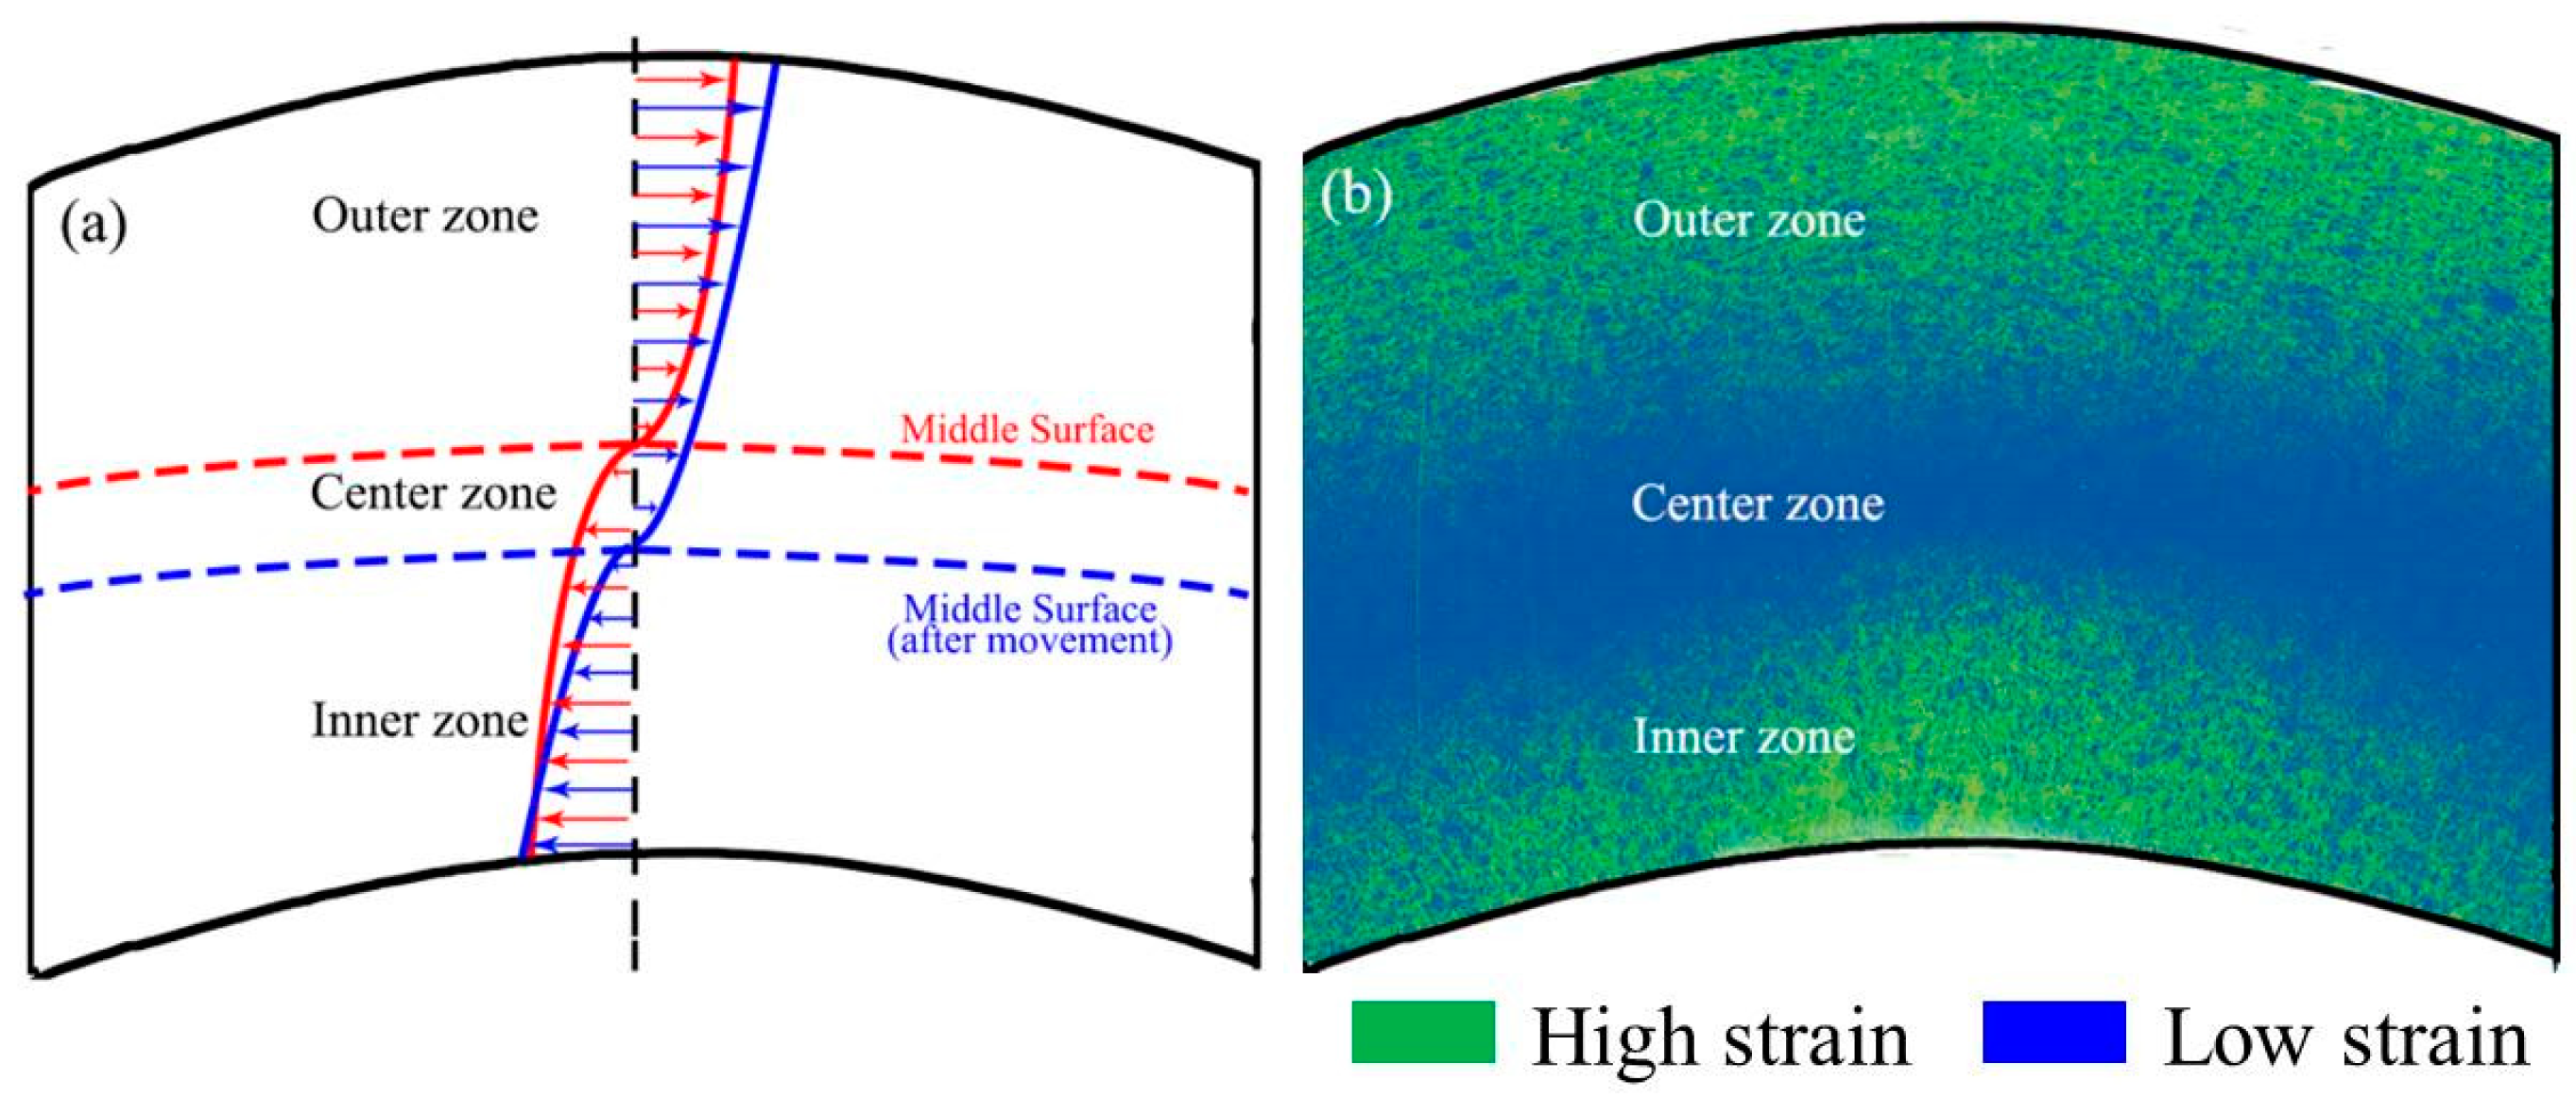
During the bending process, strain heterogeneity occurred in the thickness direction of the DP steel and the QP steel. The strain heterogeneity degree of DP steel increased following an increasing bending angle, while the degree of strain heterogeneity of QP steel decreased at the bending angle of 104°. This phenomenon fitted well with the low springback angle when QP steel was strained at the 104° bending angle.
(3)
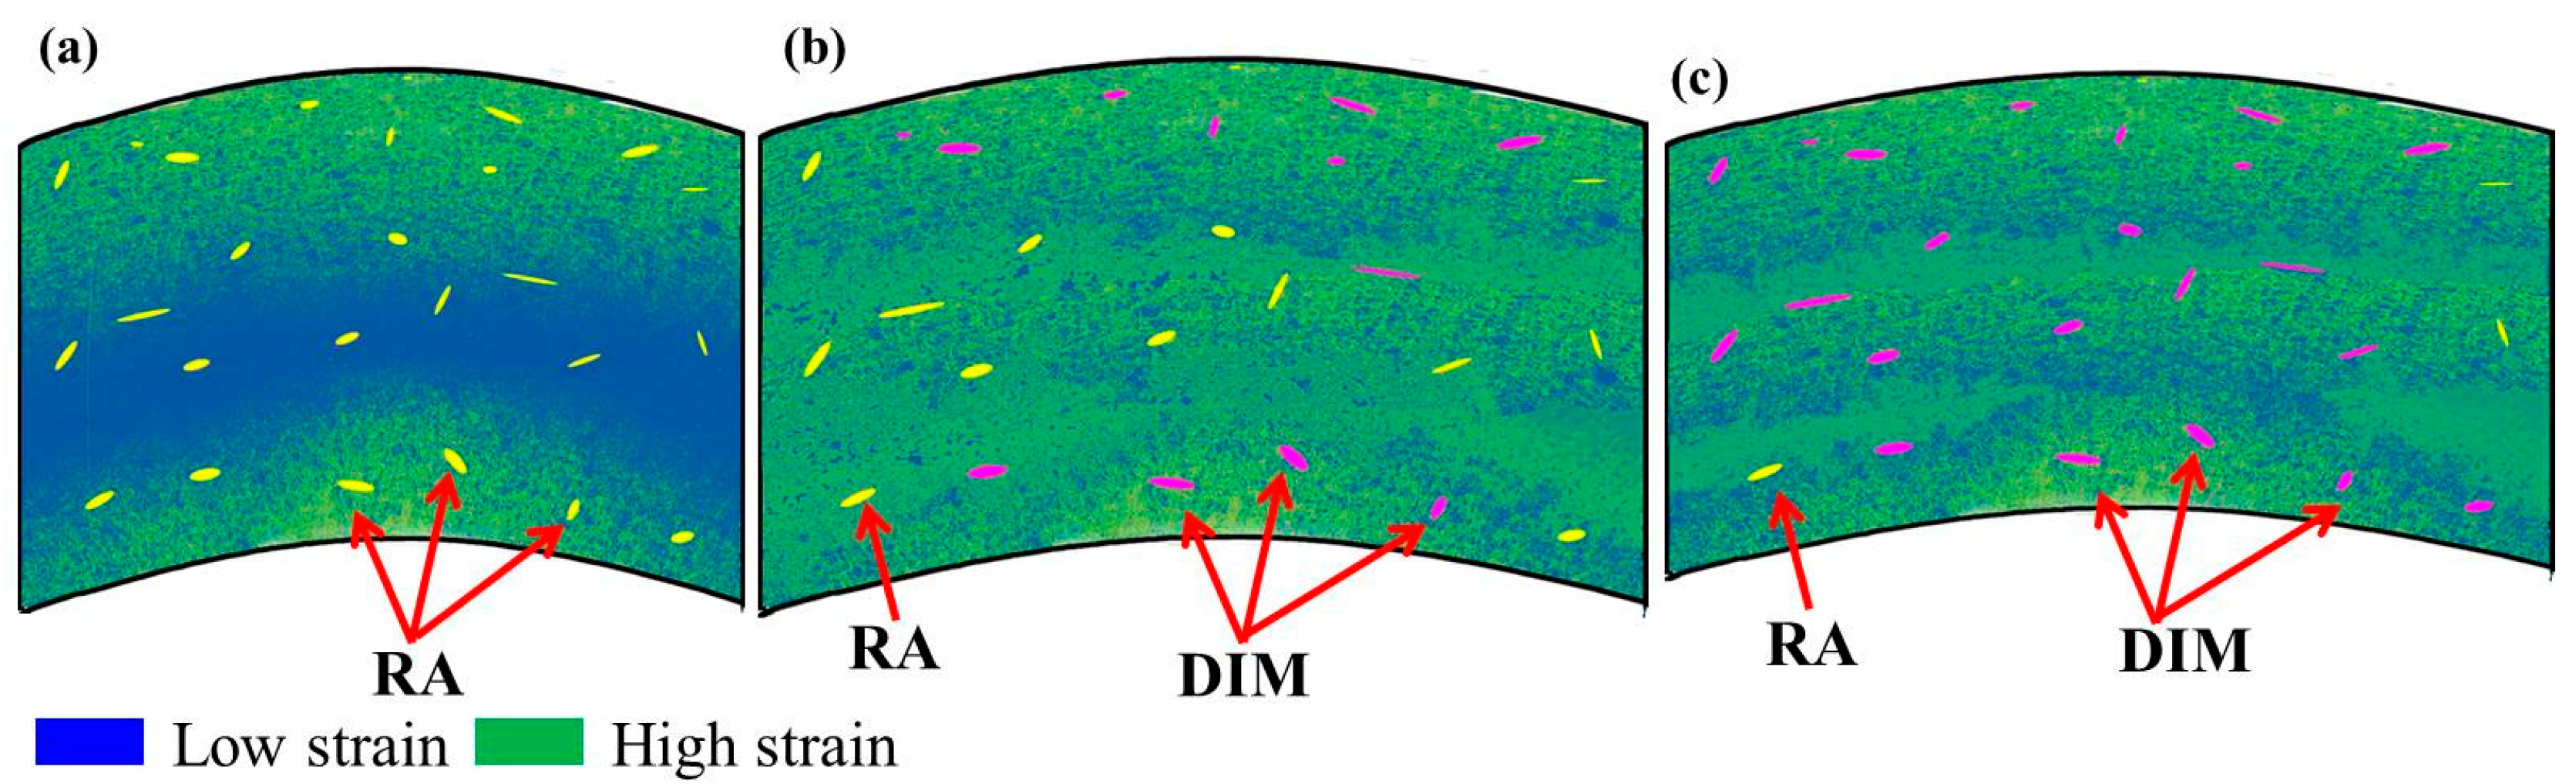
There was preferential transformation of retained austenite in the outer zone and the inner zone of QP steel during the deformation process. Due to the deformation-induced martensitic transformation at a 104° bending angle, the deformation was more homogeneous, and the springback angle decreased.

Author Contributions

Y.Y. and Z.M. designed the experiments. S.L. and H.J. analyzed the mechanical properties data. Y.Y., H.L. and J.L. performed the EBSD measurements and analyzed the data. All authors contributed to the interpretation of the results and the writing of the final version of the manuscript.

Funding

This research was funded by National Key Research and Development Program of China (grant number: 2016YFB0101605 and 2017YFB0304404) and Shandong Provincial Natural Science Foundation of China (grant number: ZR2018MEM007).

Acknowledgments

Hai-Tao Jiang acknowledges financial support from the National Key Research and Development Program of China (2016YFB0101605). Zhen-Li Mi acknowledges financial support from the National Key Research and Development Program of China (2017YFB0304404). Hui Li acknowledges financial support from the Shandong Provincial Natural Science Foundation of China (Grant ZR2018MEM007).

Conflicts of Interest

The authors declare no conflict of interest.

References

  1. Rehrl, J.; Mraczek, K.; Pichler, A.; Werner, E. Mechanical properties and fracture behavior of hydrogen charged AHSS/UHSS grades at high-and low strain rate tests. Mater. Sci. Eng. A 2014, 590, 360–367. [Google Scholar] [CrossRef]
  2. Gyasi, E.A.; Kah, P.; Wu, H.; Kesse, M.A. Modeling of an artificial intelligence system to predict structural integrity in robotic GMAW of UHSS fillet welded joints. Int. J. Adv. Manuf. Technol. 2017, 93, 1139–1155. [Google Scholar] [CrossRef]
  3. Mohrbacher, H. Property Optimization in As-Quenched Martensitic Steel by Molybdenum and Niobium Alloying. Metals 2018, 8, 234. [Google Scholar] [CrossRef]
  4. Speer, J.; Matlock, D.K.; De Cooman, B.C.; Schroth, J.G. Carbon partitioning into austenite after martensite transformation. Acta Mater. 2003, 51, 2611–2622. [Google Scholar] [CrossRef]
  5. Allain, S.Y.P.; Geandier, G.; Hell, J.C.; Soler, M.; Danoix, F.; Gouné, M. Effects of Q&P Processing Conditions on Austenite Carbon Enrichment Studied by In Situ High-Energy X-ray Diffraction Experiments. Metals 2017, 7, 232. [Google Scholar] [Green Version]
  6. Santofimia, M.J.; Zhao, L.; Petrov, R.; Sietsma, J. Characterization of the microstructure obtained by the quenching and partitioning process in a low-carbon steel. Mater. Characterization 2008, 59, 1758–1764. [Google Scholar] [CrossRef]
  7. Seo, K.Y.; Kim, J.H.; Lee, H.S.; Kim, J.H.; Kim, B.M. Effect of Constitutive Equations on Springback Prediction Accuracy in the TRIP1180 Cold Stamping. Metals 2017, 8, 18. [Google Scholar] [CrossRef]
  8. Zang, S.; Sun, L.; Niu, C. Measurements of Bauschinger effect and transient behavior of a quenched and partitioned advanced high strength steel. Mater. Sci. Eng. A 2013, 586, 31–37. [Google Scholar] [CrossRef]
  9. Geng, L.; Wagoner, R.H. Role of plastic anisotropy and its evolution on springback. Int. J. Mech. Sci. 2002, 44, 123–148. [Google Scholar] [CrossRef]
  10. Kim, H.; Kim, C.; Barlat, F.; Lee, M.G. Nonlinear elastic behaviors of low and high strength steels in unloading and reloading. Mater. Sci. Eng. A 2013, 562, 161–171. [Google Scholar] [CrossRef]
  11. Kim, H.; Kimchi, M.; Kardes, N.; Altan, T. Effects of variable elastic modulus on springback predictions in stamping advanced high-strength steels (AHSS). Steel Res. Int. 2011, 8, 628–633. [Google Scholar]
  12. Eggertsen, P.A.; Mattiasson, K. On constitutive modeling for springback analysis. Int. J. Mech. Sci. 2010, 52, 804–818. [Google Scholar] [CrossRef]
  13. Yang, X.; Choi, C.; Sever, N.K.; Altan, T. Prediction of springback in air-bending of Advanced High Strength steel (DP780) considering Young’s modulus variation and with a piecewise hardening function. Int. J. Mech. Sci. 2016, 105, 266–272. [Google Scholar] [CrossRef]
  14. Wang, Z.; Hu, Q.; Yan, J.; Chen, J. Springback prediction and compensation for the third generation of UHSS stamping based on a new kinematic hardening model and inertia relief approach. Int. J. Adv. Manuf. Technol. 2017, 90, 875–885. [Google Scholar] [CrossRef]
  15. Li, H.; Yang, H.; Song, F.F.; Zhan, M.; Li, G.J. Springback characterization and behaviors of high-strength Ti-3Al-2.5 V tube in cold rotary draw bending. J. Mater. Process. Technol. 2012, 212, 1973–1987. [Google Scholar] [CrossRef]
  16. Li, H.; Yang, H.; Zhan, M.; Kou, Y.L. Deformation behaviors of thin-walled tube in rotary draw bending under push assistant loading conditions. J. Mater. Process. Technol. 2010, 210, 143–158. [Google Scholar] [CrossRef]
  17. Zou, D.Q.; Li, S.H.; He, J.; Gu, B.; Li, Y.F. The Deformation Induced Martensitic Transformation and Mechanical Behavior of Quenching and Partitioning steels under Complex Loading Process. Mater. Sci. Eng. A 2018, 715, 243–256. [Google Scholar] [CrossRef]
  18. Doege, E.; Kulp, S.; Sunderkötter, C. Properties and application of TRIP-steel in sheet metal forming. Steel Res. Int. 2002, 73, 303–308. [Google Scholar] [CrossRef]
  19. VDA 238-100 Test Specification Draft: Plate Bending Test for Metallic Materials. 12/2010. Available online: https://www.vda.de/en/services/Publications/vda-238-100-plate-bending-test-for-metallic-materials.html (accessed on 20 June 2017).
  20. Zhao, H.S.; Li, W.; Zhu, X.; Lu, X.H.; Wang, L.; Zhou, S.; Jin, X.J. Analysis of the relationship between retained austenite locations and the deformation behavior of quenching and partitioning treated steels. Mater. Sci. Eng. A 2016, 649, 18–26. [Google Scholar] [CrossRef]
  21. Bayramin, B.; Şimşir, C.; Efe, M. Dynamic strain aging in DP steels at forming relevant strain rates and temperatures. Mater. Sci. Eng. A 2017, 704, 164–172. [Google Scholar] [CrossRef]
  22. Xu, Z.; Peng, L.; Bao, E. Size effect affected springback in micro/meso scale bending process: Experiments and numerical modeling. J. Mater. Process. Technol. 2018, 252, 407–420. [Google Scholar] [CrossRef]
  23. Gardiner, F.J. The springback of metals. Trans. ASME 1957, 79, 1–9. [Google Scholar]
  24. Wollter, K. Freies Biegen von Blechen. VDI-Forschungsh 1952, 435, 11–15. [Google Scholar]
  25. Gu, Y.; Xiang, Y.; Srolovitz, D.J. Relaxation of low-angle grain boundary structure by climb of the constituent dislocations. Scr. Mater. 2016, 114, 35–40. [Google Scholar] [CrossRef]
  26. Read, W.T.; Shockley, W. Dislocation models of crystal grain boundaries. Phys. Rev. 1950, 78, 275–280. [Google Scholar] [CrossRef]
  27. Betanda, Y.A.; Helbert, A.L.; Brisset, F.; Mathon, M.H.; Waeckerlé, T.; Baudin, T. Measurement of stored energy in Fe–48% Ni alloys strongly cold-rolled using three approaches: Neutron diffraction, Dillamore and KAM approaches. Mater. Sci. Eng. A 2014, 614, 193–198. [Google Scholar] [CrossRef]
  28. Kwon, E.P.; Fujieda, S.; Shinoda, K.; Suzuki, S. Characterization of transformed and deformed microstructures in transformation induced plasticity steels using electron backscattering diffraction. Mater. Sci. Eng. A 2011, 528, 5007–5017. [Google Scholar] [CrossRef]
  29. Kamaya, M. Assessment of local deformation using EBSD: Quantification of accuracy of measurement and definition of local gradient. Ultramicroscopy 2011, 111, 1189–1199. [Google Scholar] [CrossRef] [PubMed]
  30. Zajkani, A.; Hajbarati, H. Investigation of the variable elastic unloading modulus coupled with nonlinear kinematic hardening in springback measuring of advanced high-strength steel in U-shaped process. J. Manuf. Process. 2017, 25, 391–401. [Google Scholar] [CrossRef]
  31. Yang, Y.G.; Mi, Z.L.; Xu, M.; Xiu, Q.; Jiang, H.T. Impact of intercritical annealing temperature and strain state on mechanical stability of retained austenite in medium Mn steel. Mater. Sci. Eng. A 2018, 725, 389–397. [Google Scholar] [CrossRef]
  32. Timokhina, I.B.; Hodgson, P.D.; Pereloma, E.V. Effect of microstructure on the stability of retained austenite in transformation-induced-plasticity steels. Metall. Mater. Trans. A 2004, 35, 2331–2341. [Google Scholar]
  33. Song, C.; Yu, H.; Li, L.; Zhou, T.; Lu, J.; Liu, X. The stability of retained austenite at different locations during straining of I&Q&P steel. Mater. Sci. Eng. A 2016, 670, 326–334. [Google Scholar]
  34. Mishra, A.; Thuillier, S. Investigation of the rupture in tension and bending of DP980 steel sheet. Int. J. Mech. Sci. 2014, 84, 171–181. [Google Scholar] [CrossRef]
  35. Roumina, R.; Bruhis, M.; Masse, J.P.; Zurob, H.S.; Jain, M.; Bouaziz, O.; Embury, J.D. Bending properties of functionally graded 300M steels. Mater. Sci. Eng. A 2016, 653, 63–70. [Google Scholar] [CrossRef]
  36. Olson, G.B.; Cohen, M. A mechanism for the strain-induced nucleation of martensitic transformations. J. Less Common Met. 1972, 28, 107–118. [Google Scholar] [CrossRef]
  37. Stringfellow, R.G.; Parks, D.M.; Olson, G.B. A constitutive model for transformation plasticity accompanying strain-induced martensitic transformations in metastable austenitic steels. Acta Metall. Mater. 1992, 40, 1703–1716. [Google Scholar] [CrossRef]
  38. He, B.B.; Hu, B.; Yen, H.W.; Cheng, G.J.; Wang, Z.K.; Luo, H.W.; Huang, M.X. High dislocation density–induced large ductility in deformed and partitioned steels. Science 2017, 357, 1029–1032. [Google Scholar] [CrossRef] [PubMed]
  39. Kim, J.H.; Seo, E.J.; Kwon, M.H.; Kang, S.; De Cooman, B.C. Effect of Quenching Temperature on Stretch Flangeability of a Medium Mn Steel Processed by Quenching and Partitioning. Mater. Sci. Eng. A 2018. [Google Scholar] [CrossRef]
Figure 1. Diagrams describing the bending process and locations of electron backscattered diffraction (EBSD) and transmission electron microscopy (TEM) specimens. (a) Schematic diagram of the bending process; (b) Schematic diagram describing locations of EBSD and TEM specimens. The yellow rectangles represent the outer zone, center zone, and inner zone in the thickness direction; (c) Diagram of the bending samples.
Metals 08 00432 g001
Figure 2. Microstructure of DP and QP steel prior to deformation. (a,b) Distribution of ferrite (F) and martensite (M) in DP steel. (c,d) Distribution of martensite (M) and retained austenite (RA) in QP steel.
Metals 08 00432 g002
Figure 3. Bending springback properties of the DP and QP steel. (a) Stress-bending angle curves; (b) Springback angle of DP and QP steel strained at different bending angles.
Metals 08 00432 g003
Figure 4. EBSD analysis for outer zone (a,d), center zone (b,e), and inner zone (c,f) of the bending specimen at 74° angle: EBSD grain boundary maps (left), and EBSD local misorientation distribution maps (right).
Metals 08 00432 g004
Figure 5. Change in the local misorientation and the difference in kernel average misorientation (KAM). (a) Change in the local misorientation of bending specimen at 74° angle; (b) Difference in kernel average misorientation in specimens strained at different bending angles.
Metals 08 00432 g005
Figure 6. EBSD analysis for outer zone (a,d), center zone (b,e), and inner zone (c,f) of the bending specimen at 104° angle: EBSD grain boundary maps (left), and EBSD local misorientation distribution maps (right).
Metals 08 00432 g006
Figure 7. Change in local misorientation and difference in kernel average misorientation (KAM). (a) Change in local misorientation of bending specimen at 104° angle; (b) Difference in kernel average misorientation with specimens strained at different bending angles. LALM: low-angle local misorientation; HALM: high-angle local misorientation.
Metals 08 00432 g007
Figure 8. Change in the retained austenite volume fraction at different bending angles.
Metals 08 00432 g008
Figure 9. TEM images showing the retained austenite, twin martensite, and the orientation relationship between retained austenite and martensite. (a) Retained austenite and surrounding martensite; (b) twin martensite; and (c) the orientation relationship between retained austenite and martensite. (d) High-resolution TEM micrograph indicating N-W relation of the selected red rectangle region in (c).
Metals 08 00432 g009
Figure 10. Schematic diagram of stress and strain distribution during bending process. (a) Stress distribution; (b) Strain distribution.
Metals 08 00432 g010
Figure 11. Schematic diagram of retained austenite transformation during the bending process. (a) QP specimens strained at low bending angle; (b) QP specimens strained at medium bending angle; (c) QP specimens strained at high bending angle. ‘RA’ and ‘DIM’ represent ‘retained austenite’ and ‘deformation-induced martensite’, respectively.
Metals 08 00432 g011
Table 1. Main chemical compositions and mechanical properties of materials used in experiments. DP: dual phase, QP: quenching and partitioning.
SampleCMnSiPSNbFeYield StrengthTensile Strength
wt %MPa
DP0.151.830.250.010.0010.028Balance9611192
QP0.232.311.600.0180.0030.031Balance12091364

