Article

Springback Estimation in the Hydroforming Process of UNS A92024-T3 Aluminum Alloy by FEM Simulations

by
Cristina Churiaque
1,
Jose Maria Sánchez-Amaya
1,*,
Francisco Caamaño
2,
Juan Manuel Vazquez-Martinez
3 and
Javier Botana
1
1
Department of Materials Science and Metallurgical Engineering and Inorganic Chemistry, LABCYP, Faculty of Engineering, University of Cádiz, Av. Universidad de Cadiz 10, 11519 Puerto Real, Spain
2
Titania, Ensayos y Proyectos Industriales S.L., 11500 El Puerto de Santa María, Spain
3
Department of Mechanical Engineering & Industrial Design, Faculty of Engineering, University of Cádiz, Av. Universidad de Cadiz 10, 11519 Puerto Real, Spain
*
Author to whom correspondence should be addressed.
Metals 2018, 8(6), 404; https://doi.org/10.3390/met8060404
Submission received: 2 May 2018 / Revised: 21 May 2018 / Accepted: 27 May 2018 / Published: 1 June 2018
(This article belongs to the Special Issue Light Weight Alloys: Processing, Properties and Their Applications)

Abstract

:
The production of metal parts manufactured through the hydroforming process is strongly affected by the difficulty in predicting the elastic recovery (springback) of the material. In addition, the formation of wrinkles and crack growth should be avoided. Manual cold work is widely employed in industry to obtain the final shape of the manufactured parts. Therefore, an accurate springback estimation is of high interest to reduce the overall time of manufacturing and also to decrease the manual rectification stage. A working procedure based on finite element simulations (FEM) was developed to estimate the elastic recovery and predict the final morphology of UNS A92024-T3 aluminum alloy pieces after forming. Experimental results of real hydroformed parts were compared with the results obtained in simulations performed with PAM-STAMP software. The influence of different experimental parameters on the forming processes was also analyzed, such as the material properties, the rolling direction of sheet metal, or the hardening criteria employed to characterize the plastic region of the alloy. Results obtained in the present work show an excellent agreement between real and simulated tests, the maximum morphology deviations being less than the thickness of parts (2.5 mm). FEM simulations have become a suitable and mature tool that allows the prediction of the pieces springback, a precise material characterization being required to obtain reliable results.

Graphical Abstract

1. Introduction

The continuous growth of the aerospace industry, especially due to an important increase in the demand of new aircraft, involves some challenges that companies in the sector may face to be more competitive. Among other investments, efforts should be focused towards the improvements of the engineering design, in order to achieve a better development of aerospace products. At the same time, the development of manufacturing processes should be as simple, straightforward, and robust as possible, also maintaining profit margins and creating a consolidated working base for the future. Another key to improve operational performance are the investment in new services and the transformation of manufacturing programs to make them more effective.
Hydroforming in fluid cell presses is a known widespread process applied in different industrial sectors, since it allows one to obtain pieces with different morphologies from flat metal sheets. This process has the main advantage of being relatively quick, being also carried out at room temperature. These two factors make it a relatively cheap and convenient process. However, it also presents several inherent technical disadvantages, such as the development of defects (cracks or wrinkles) in areas with high plastic deformation, and the elastic recovery (springback) after the application of pressure. The elastic recovery must be estimated and taken into account, as the final shape of the formed part should be as close as possible to the design part [1]. Therefore, in order to manufacture parts with curved shapes, the dies used must have a more pronounced morphology than the design part, with the aim of compensating the springback. In many cases, the dies geometry is estimated taking into account the intuition and practical experience of the operators, or by means of trial–error tests, which constitute significant losses of time and material, decreasing the overall production rate.
As stated before, the hydroforming process involves the generation of residual stresses, high elastic recovery, and the possibility of defects formation, such as wrinkles and cracks. The uncertainty associated with the low precision in the springback estimation usually generates critical variations between machined and design parts, which leads to subsequent manual adjustment of the geometry of the workpiece/part. Most of the studies working on this topic are focused on flange forming [2,3,4]. One of the emerging methodologies to reduce the possible defects caused in the manufacture of parts by this process is the use of Finite Element Method (FEM) simulations. Making use of these tools, most researches perform a comparison between experimental and simulation studies of the springback effect on flange bending. For example, Lei Chen et al. [5] focused their research on straight jogged flange forming, studying the influence of different parameters on the process, such as: sheet thickness, radius of curvature, flanging height, press-time cycle of press, as well as the influence on the results when using different rubber materials in the press (Shore A70 rubber and Shore A80 polyurethane). The influence of the lubricant and the flexible rubber in the hydroforming process of aluminum components was studied in by Paunoui et al. [6]. These authors claimed that a flexible rubber assures uniform pressure toward the blank, and additionally, that the lubricant influences the process of deformation.
A numerical simulation parametric study of rubber-pad forming process was developed in [7]. This research was focused on the analysis of forming parameters, such as the hardness and type of rubber, or the blank thickness, on the elastic recovery. An interesting result obtained is that the springback angle increases as the initial aluminum blank thickness increases, using the same hardness of the flexible punch with polyurethane and natural rubber. Another remarkable finding is that the use of polyurethane rubber as soft punch is recommended to minimize the springback of aluminum sheet when compared to the natural rubber. Besides, the employment of polyurethane rubber, with less hardness value, may delay the occurrence of damage.
In [8], an analysis of the reduction of time and costs was performed in the sheet metal forming process, making use of FEM simulations. In particular, simulations were carried out to minimize the deviations of the stamping and to anticipate the detection of problems associated with the effects of the springback. This methodology facilitates the perception and monitoring of the piece at different stages of the forming process.
Most recently, advanced simulations of the metal forming process analyze the influence of the die on the elastic deformation [9,10]. Thus, an engineering methodology for the structural assessment of the stamping tooling and the die-face designs during the sheet metal forming processes were presented in [10]. This study compares the simulation results of the metal forming process considering the die as Rigid Solid (common approach in FEM models) with those obtained considering it as Deformable Solid. The deformable solid model was successfully developed, presenting better springback estimation in the forming process of a high strength steel of moderate thickness [10].
On the other hand, an enhancement of dimple formability in sheet metals by two-step forming was proposed in [11] to reduce stamping flaws in curved parts. It presents several FEM simulation models in 2D and 3D, exposing the differences found between the results of the one-step and two-step metallic forming. According to the FEM model, the following outputs were compared in [11]: sheet metal formability and deviations from the objective geometry, thickness distribution and damage percentage, and comparison of strains. The two-step forming process was confirmed to provide better formability, reducing flaws and cracks.
As mentioned in [12], an adequate material characterization is crucial to obtain a reasonable fitting between simulation and experimental data. This implies that the material sheet involved in the forming process should be mechanically tested in order to minimize the comparative errors between numerical results obtained from the FEM simulations (according to the plasticity criteria and selected hardening laws), and the experimental results obtained from the real manufacturing test. Key for the success of simulations of forming processes is the constitutive model used for the description of the plastic behavior. The global plastic deformation model requires the estimation of two factors: the anisotropic behavior and the work-hardening law. Both issues can be estimated independently in the optimization procedure; in a first stage, the material parameters related to the anisotropic behavior can be measured, while in a second stage, the best suitable isotropic work-hardening law can be identified. Given the high importance of understanding both factors, it is considered necessary to revise in the next sections the most common available plasticity criteria and hardening laws.

1.1. Anisotropic Plasticity Criteria
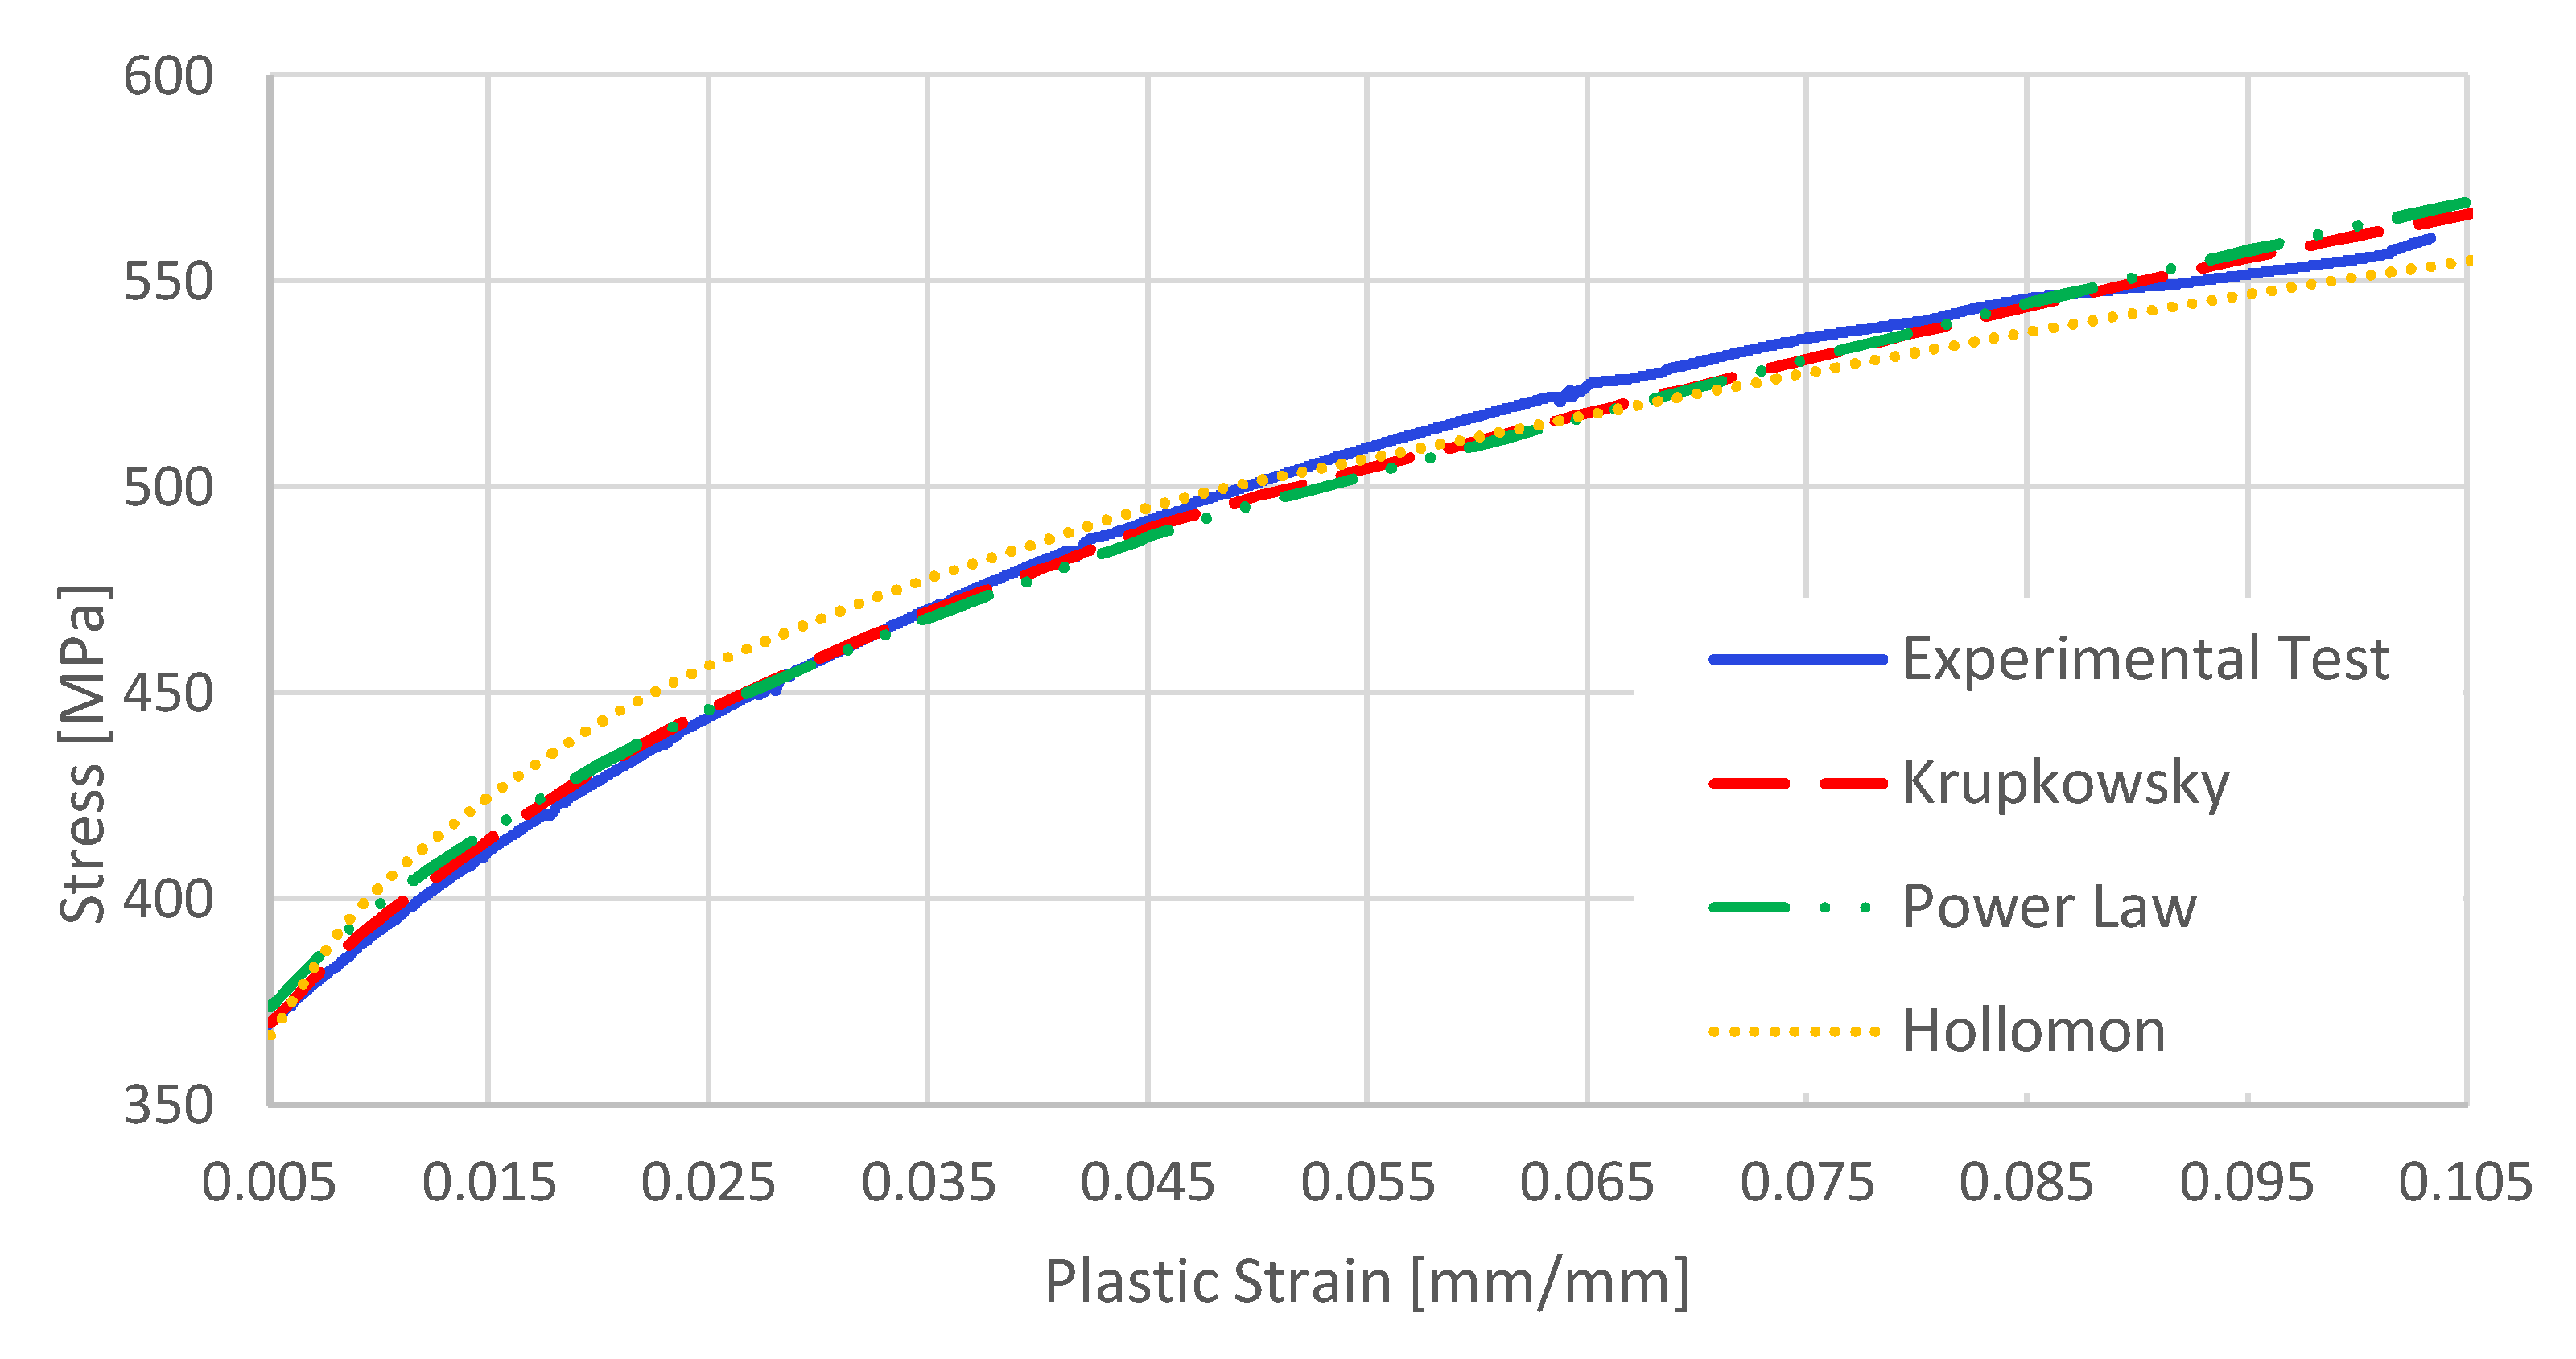
Hill’s (1948) quadratic yield criterion is one of the most widely used anisotropic yield criterion. The Hill’s 48 yield function is also easy to formulate, and therefore, has been widely used to investigate the effect of anisotropy on springback, especially in sheet metal forming [13]. The material parameters of the Hill’s 48 yield function are mainly obtained from Lankford values at angles of 0°, 45°, and 90° to the rolling direction. The Lankford coefficients needed depend on the type of anisotropy characterized. A type of orthotropic anisotropy (employed in the present study) considers anisotropy in three directions, and accordingly, three values are needed: r0, r45, and r90. Lankford’s coefficient along the α direction can be estimated as with Equation (1):
r α = ε w ( α ) ε t ( α )
where ε w ( width   strain ) and ε t ( thickness   strain ) . are measured on the specimens in tensile tests.
If Hill’s coefficients are known, but not the Lankford’s coefficients, it is possible to define them and to transform them into Lankford’s coefficients using the following equations. The anisotropic parameters F, G, H, and N can be formulated in terms of the r-values (r0, r45, r90) as follows in Equations (2)–(5) [14]:
F = r 0 r 90 ( 1 + r 90 )
G = 1 ( 1 + r 0 )
H = r 0 ( 1 + r 0 )
N = ( r 0 + r 90 ) ( 1 + 2 r 45 ) 2 r 90 ( 1 + r 0 )

1.2. Hardening Law

During cold work hardening, mechanical deformation brings the material into plastic domain and the material behaves nonlinearly. This behavior exhibits a nonlinear relationship between stress σ and strain ε. In cold forming processes, such as hydroforming the material is subjected to biaxial deformation conditions, and therefore higher strain values than the ones provided by uniaxial tensile test (in which constriction cannot be reached) are needed [15]. Therefore, it is necessary to extrapolate the plastic stress–strain curve to higher values of deformation by different hardening model equations, such as the Krupkowsky Law, Hollomon’s Law, or Power-Law. In any case, a common approach to identify the material’s work-hardening parameters, is to assume isotropic behavior. The Krupkowsky law follows Equation (6):
σ = K · ( ε 0 + ε p ) n ,
In which K is the work hardening coefficient, and n, the work hardening exponent. σ, ɛ, and ε 0 are the equivalent stress, equivalent strain, and the offset (elastic) strain, respectively [16,17]. Alternatively, the Power-Law can also be employed to model the plastic region, as indicated in Equation (7), in which σ, ε p , and n are the equivalent stress, the equivalent plastic strain, and the work hardening exponent, respectively.
σ = a + b · ε p n ,
Another common mathematical description of the work hardening phenomenon for an isotropic material is the Hollomon’s stress–strain equation [18], shown in Equation (8).
σ = K · ε n ,
where K and n are two material constants commonly referred to as strength coefficient and strain hardening exponent respectively.
It is worth mentioning that a comparison of models is provided in [15], where the Krupkowsky law is seen to be preferable to the classical Hollomon law because it better fits to the experimental results and leads to a finite σ/ɛp slope at initial yielding.

1.3. Objective

The main objective of this study was to predict the springback of UNS A92024-T3 aluminum alloy parts with double curvature, manufactured by the hydroforming process with fluid cell press. For this purpose, an experimental procedure based on finite element simulations was developed. In order to obtain reliable results, the influence of different process parameters was determined, as the mechanical properties of the material being formed, the rolling direction of the blank (to take into account the anisotropy), and the hardening model for deformation of the elastoplastic material. After estimating the correct values of these parameters, they were used as input for the FEM model. Finally, results of the simulation stage were compared with experimental tests of the hydroforming process. This methodology may allow precise estimation of the final geometry of the parts and the possible appearance of wrinkles and cracks.

2. Materials and Methods

In this work, flat sheets of UNS A92024-T3 aluminum alloy, composition detailed in Table 1, were hydroformed to generate double curvature probes. The size of the parts is: 215.601 mm × 226.677 mm, with a thickness of 2.5 mm. Two different parts (pieces) were formed, encoded as Part 1 and Part 2, changing only the curvature of the employed dies. The design of Part 1 is depicted in Figure 1. The formed elements acquire double curvature, presenting a maximum difference in height between the corners of the sheet (lower level) and the central area of the piece (maximum level) of 14.94 mm in Part 1 and 10.71 mm in Part 2, as shown in Figure 2. Note that the hydroforming process was performed without drilling the holes marked in Figure 1.

2.1. Material Properties and Experimental Characterization Tests

According to our preliminary experience and to the previous results reported by other authors [12], an adequate material characterization is crucial in order to accurately estimate the actual springback of the hydroformed pieces and therefore, to obtain reliable simulations. In order to evaluate the influence of the mechanical properties of the material being forming, different Material Properties, encoded as MP1 to MP6, have been taken as input of the simulation model. MP1 and MP2 were materials parameters obtained from experimental tensile tests, while MP3 to MP6 were materials parameters taken from minimum requirements of aerospace standards. Table 2 summarizes the source employed to obtain these Material Characterization parameters.
In order to obtain material parameters MP1 and MP2, standard uniaxial tensile tests, according to ISO 6892-1:2016 [21], were performed on the samples, using a SHIMADZU MTS universal testing machine, with a maximum Load Capacity of 100 kN. The results obtained from the tensile test, as elastic limit, tensile strength, % elongation, Poisson’s coefficient and Young’s Modulus, were incorporated as input data in the simulation software. MP1 data were obtained from the average values of 3 experimental tensile tests performed on UNS A92024-T3511 samples with the same thickness as the hydroformed sheet (2.5 mm). MP2 data were obtained from a set of 15 standard uniaxial tensile tests performed to 2.5 mm thick samples of UNS A92024-T3 extracted from the same material batch used in the real hydroforming tests. In order to obtain precise materials parameters in MP2, different rolling directions were considered. Thus, 5 specimens with 0° rolling direction, 5 specimens with 45° rolling direction and 5 remaining specimens at 90° were tested. Biaxial strain gauges were installed on specimens to obtain the biaxial yield stress and biaxial anisotropic plasticity coefficients which were derived from the developed curve. The mechanical properties and material constants determined for MP2 are summarized in Table 3.
The third material properties considered, encoded as MP3, correspond to the minimum material properties values requested by the aerospace specification SAE-AMS-QQ-A-250/5 [19]. This standard is applied to UNS A92024-T3 sheets with thicknesses ranging from 1.25 mm and 6.5 mm, reporting the following minimum values for the Ultimate Tensile Strength (UTS), Yield Strength (YS), and Strain to Rupture (Elongation %): UTS min = 63 ksi (434 MPa); YS min = 42 ksi (290 MPa); Elongation = 15%. Similarly, MP4 to MP6 contain the reference values of material properties indicated in SAE-AMS-QQ-A-200/3 [20], providing the specific material requirements for aluminum alloy 2024 bar, rod, shapes, tube, and wire produced by extrusion. In this standard, the minimum values of UTS, YS and Elongation %, for 2024-T3 with lower thickness than 6.3 mm, are: UTS min = 57 ksi (393 MPa); YS min = 42 ksi (290 MPa); Elongation = 12%. These minimum values were adopted for MP4. MP5 and MP6 have the same material parameters as MP4, with a unique difference imposed of a higher Elongation value. Thus, in MP5, the Elongation was fixed at 20%; while in MP6, the Elongation was 30%. These latter three MPs allowed the analysis of the influence of the ductility.

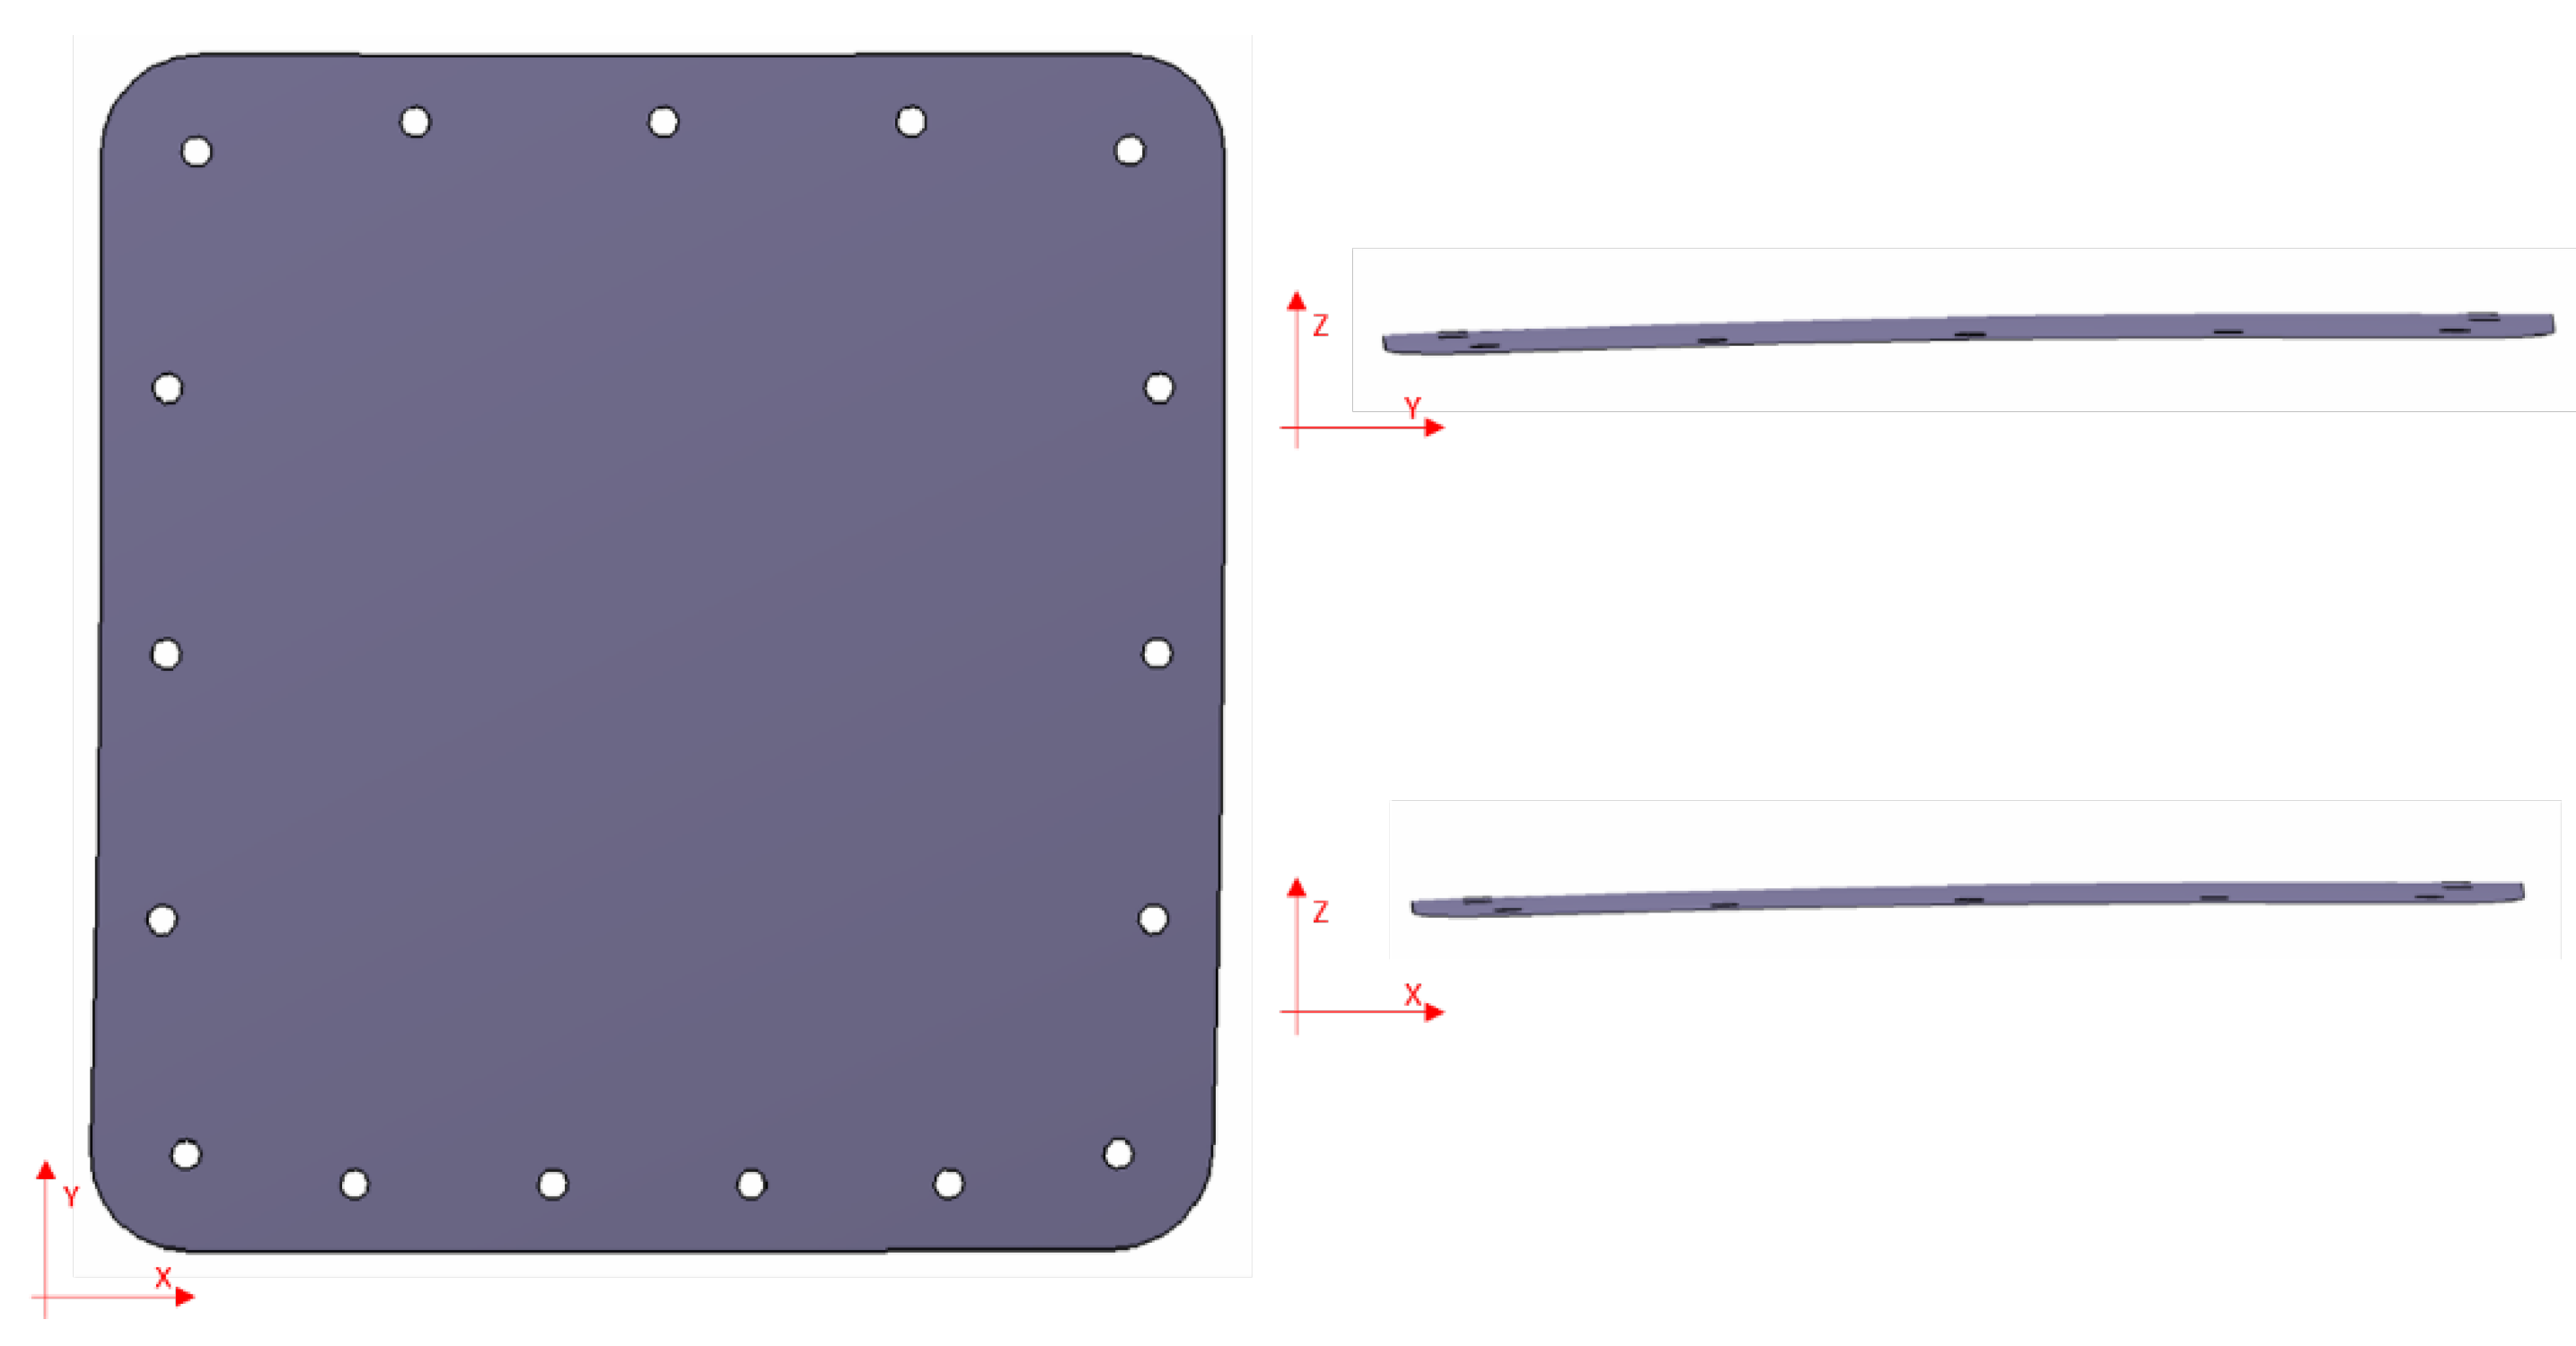
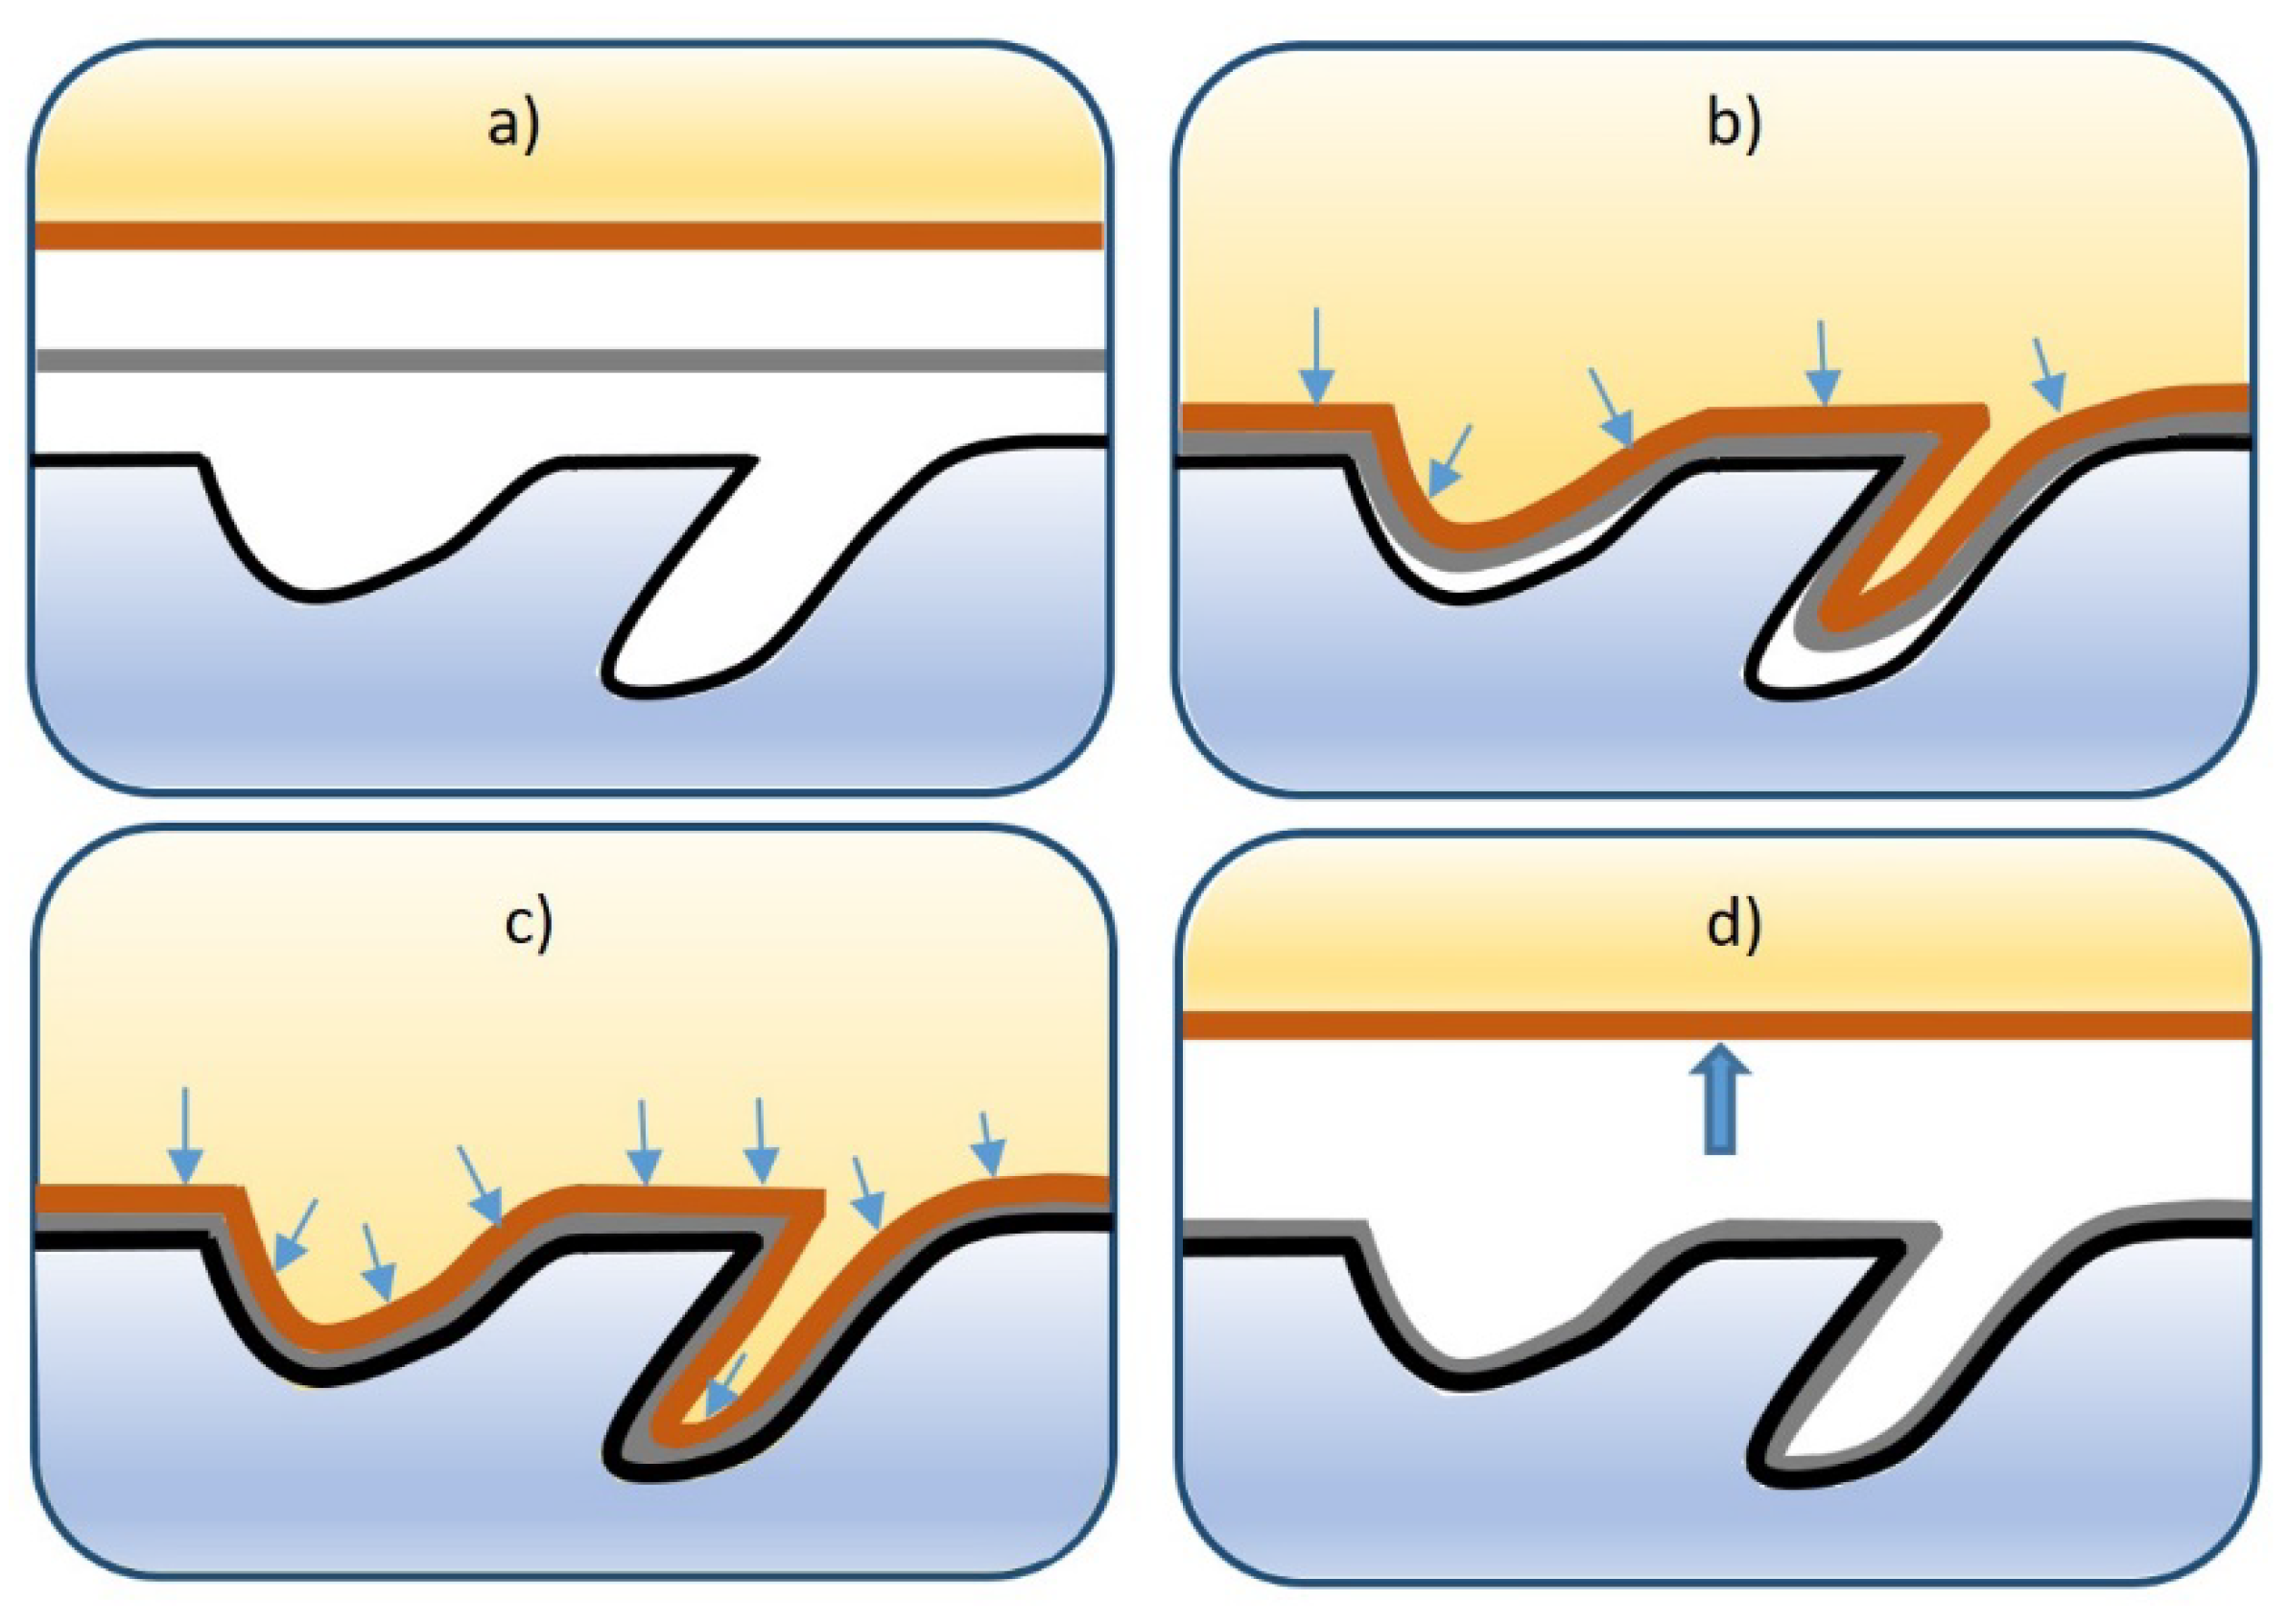
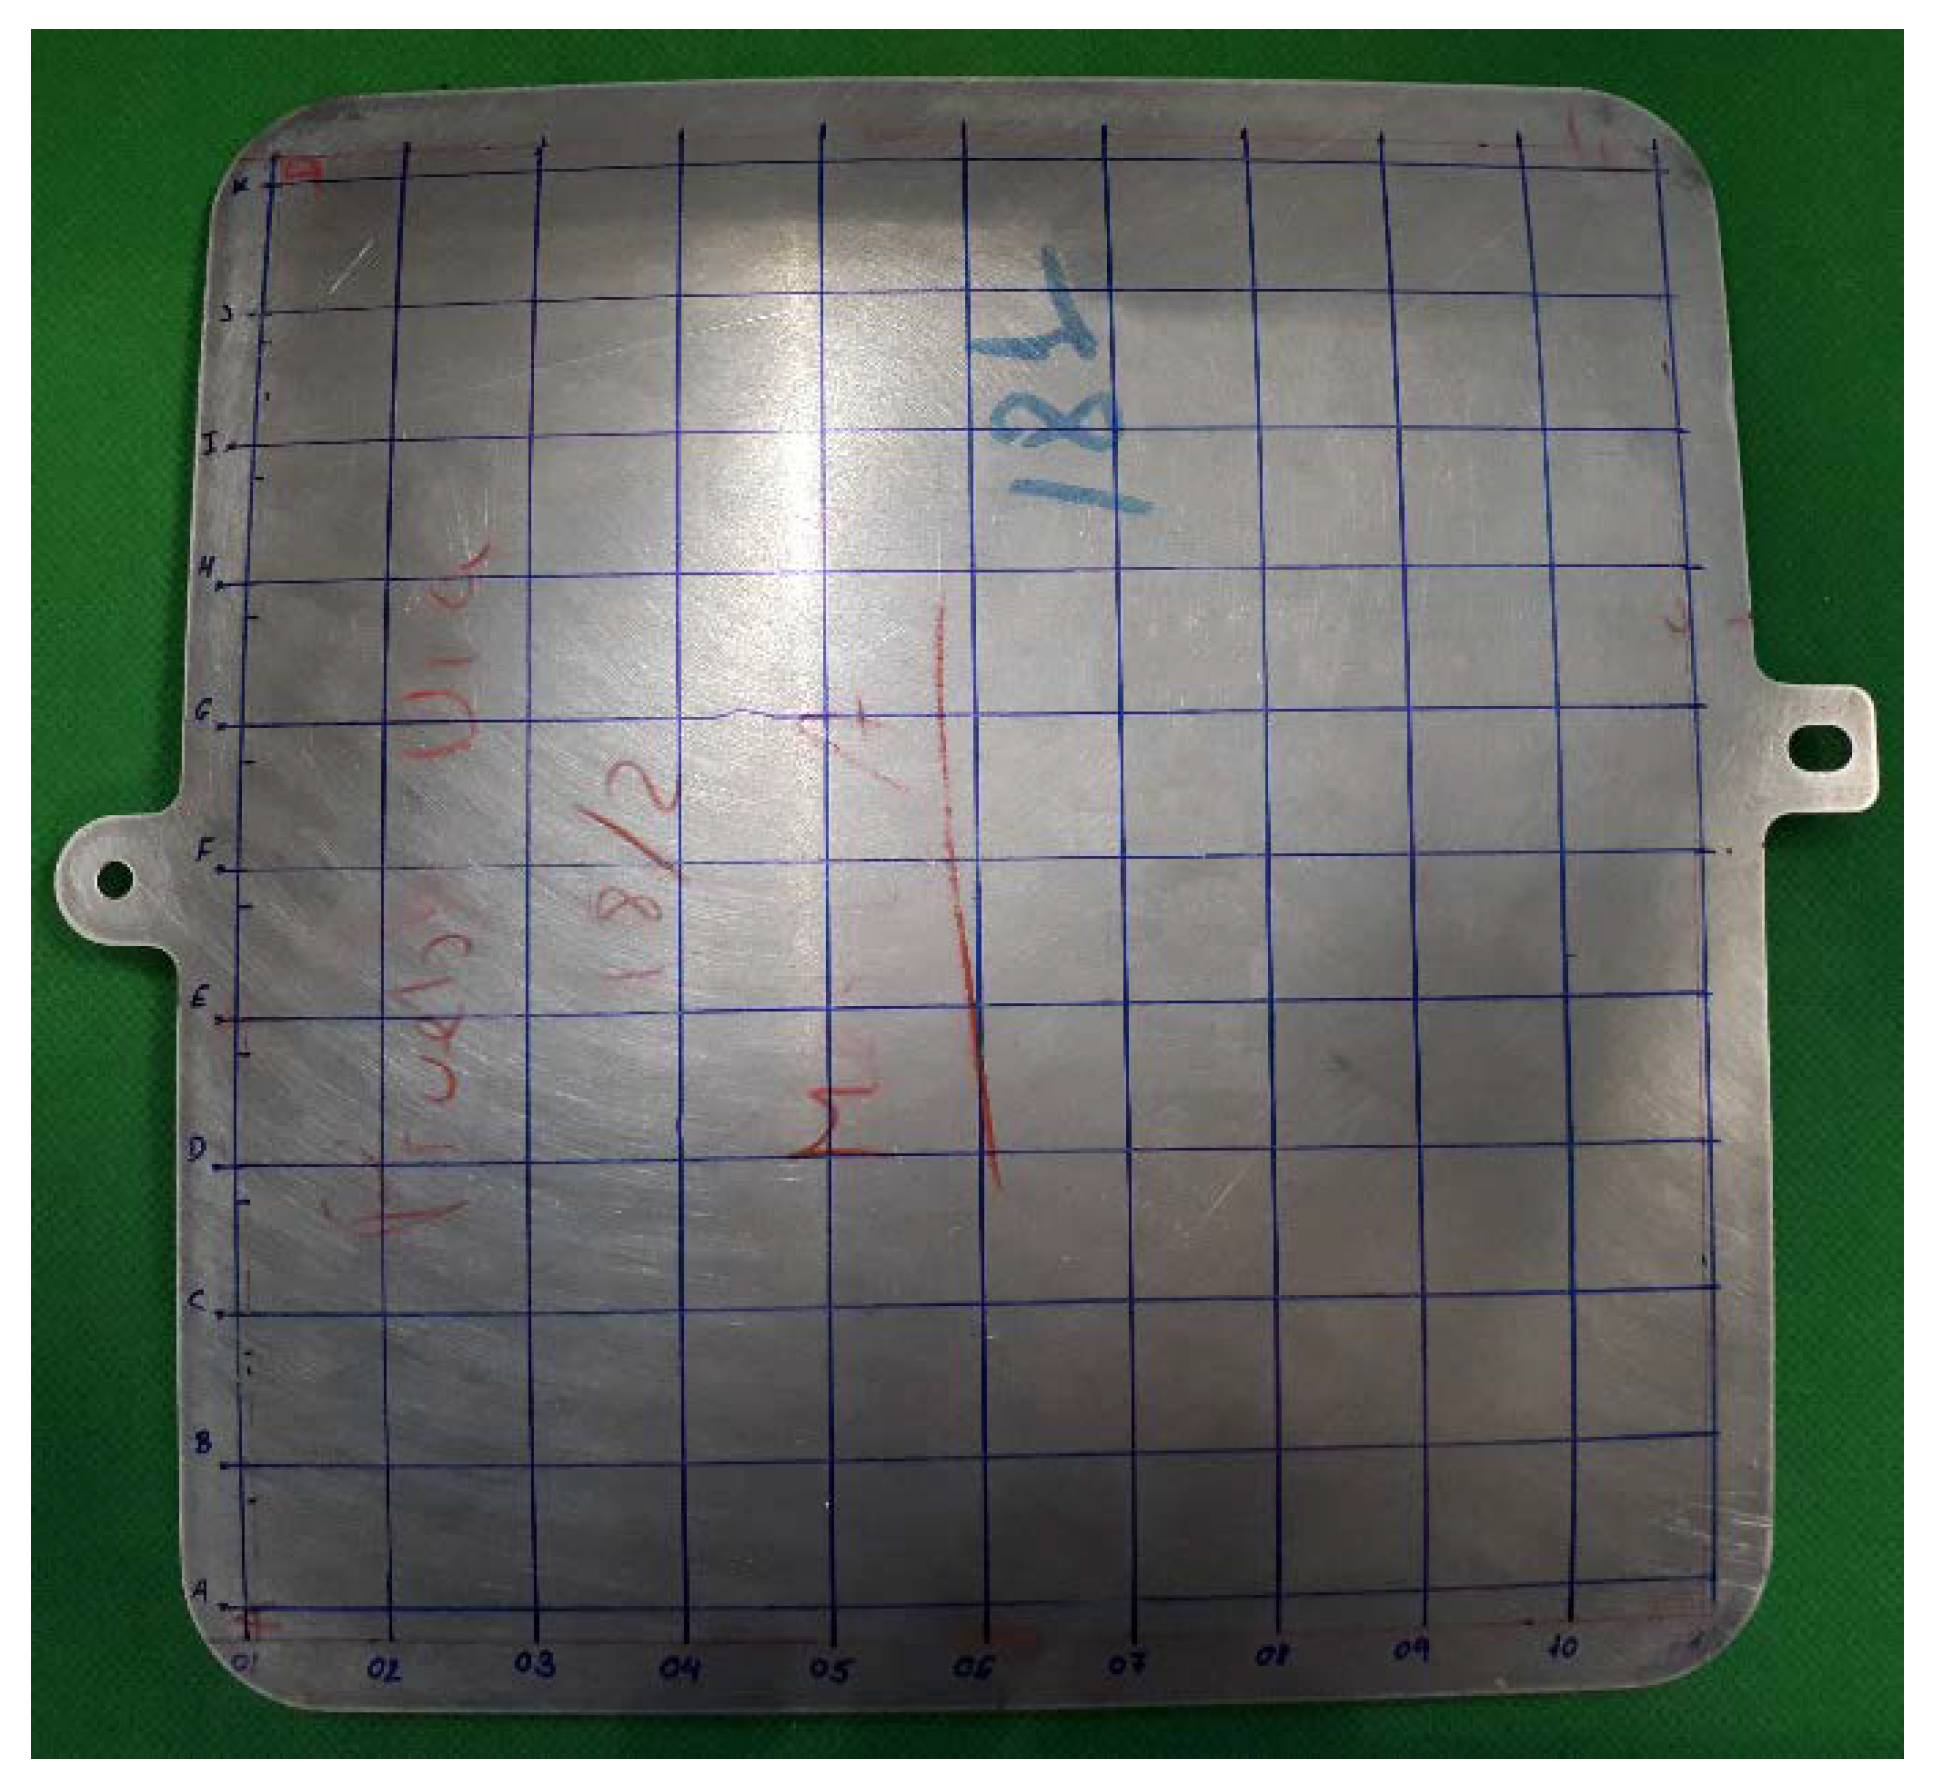
2.2. Experimental Hydroforming and Geometry Measurement
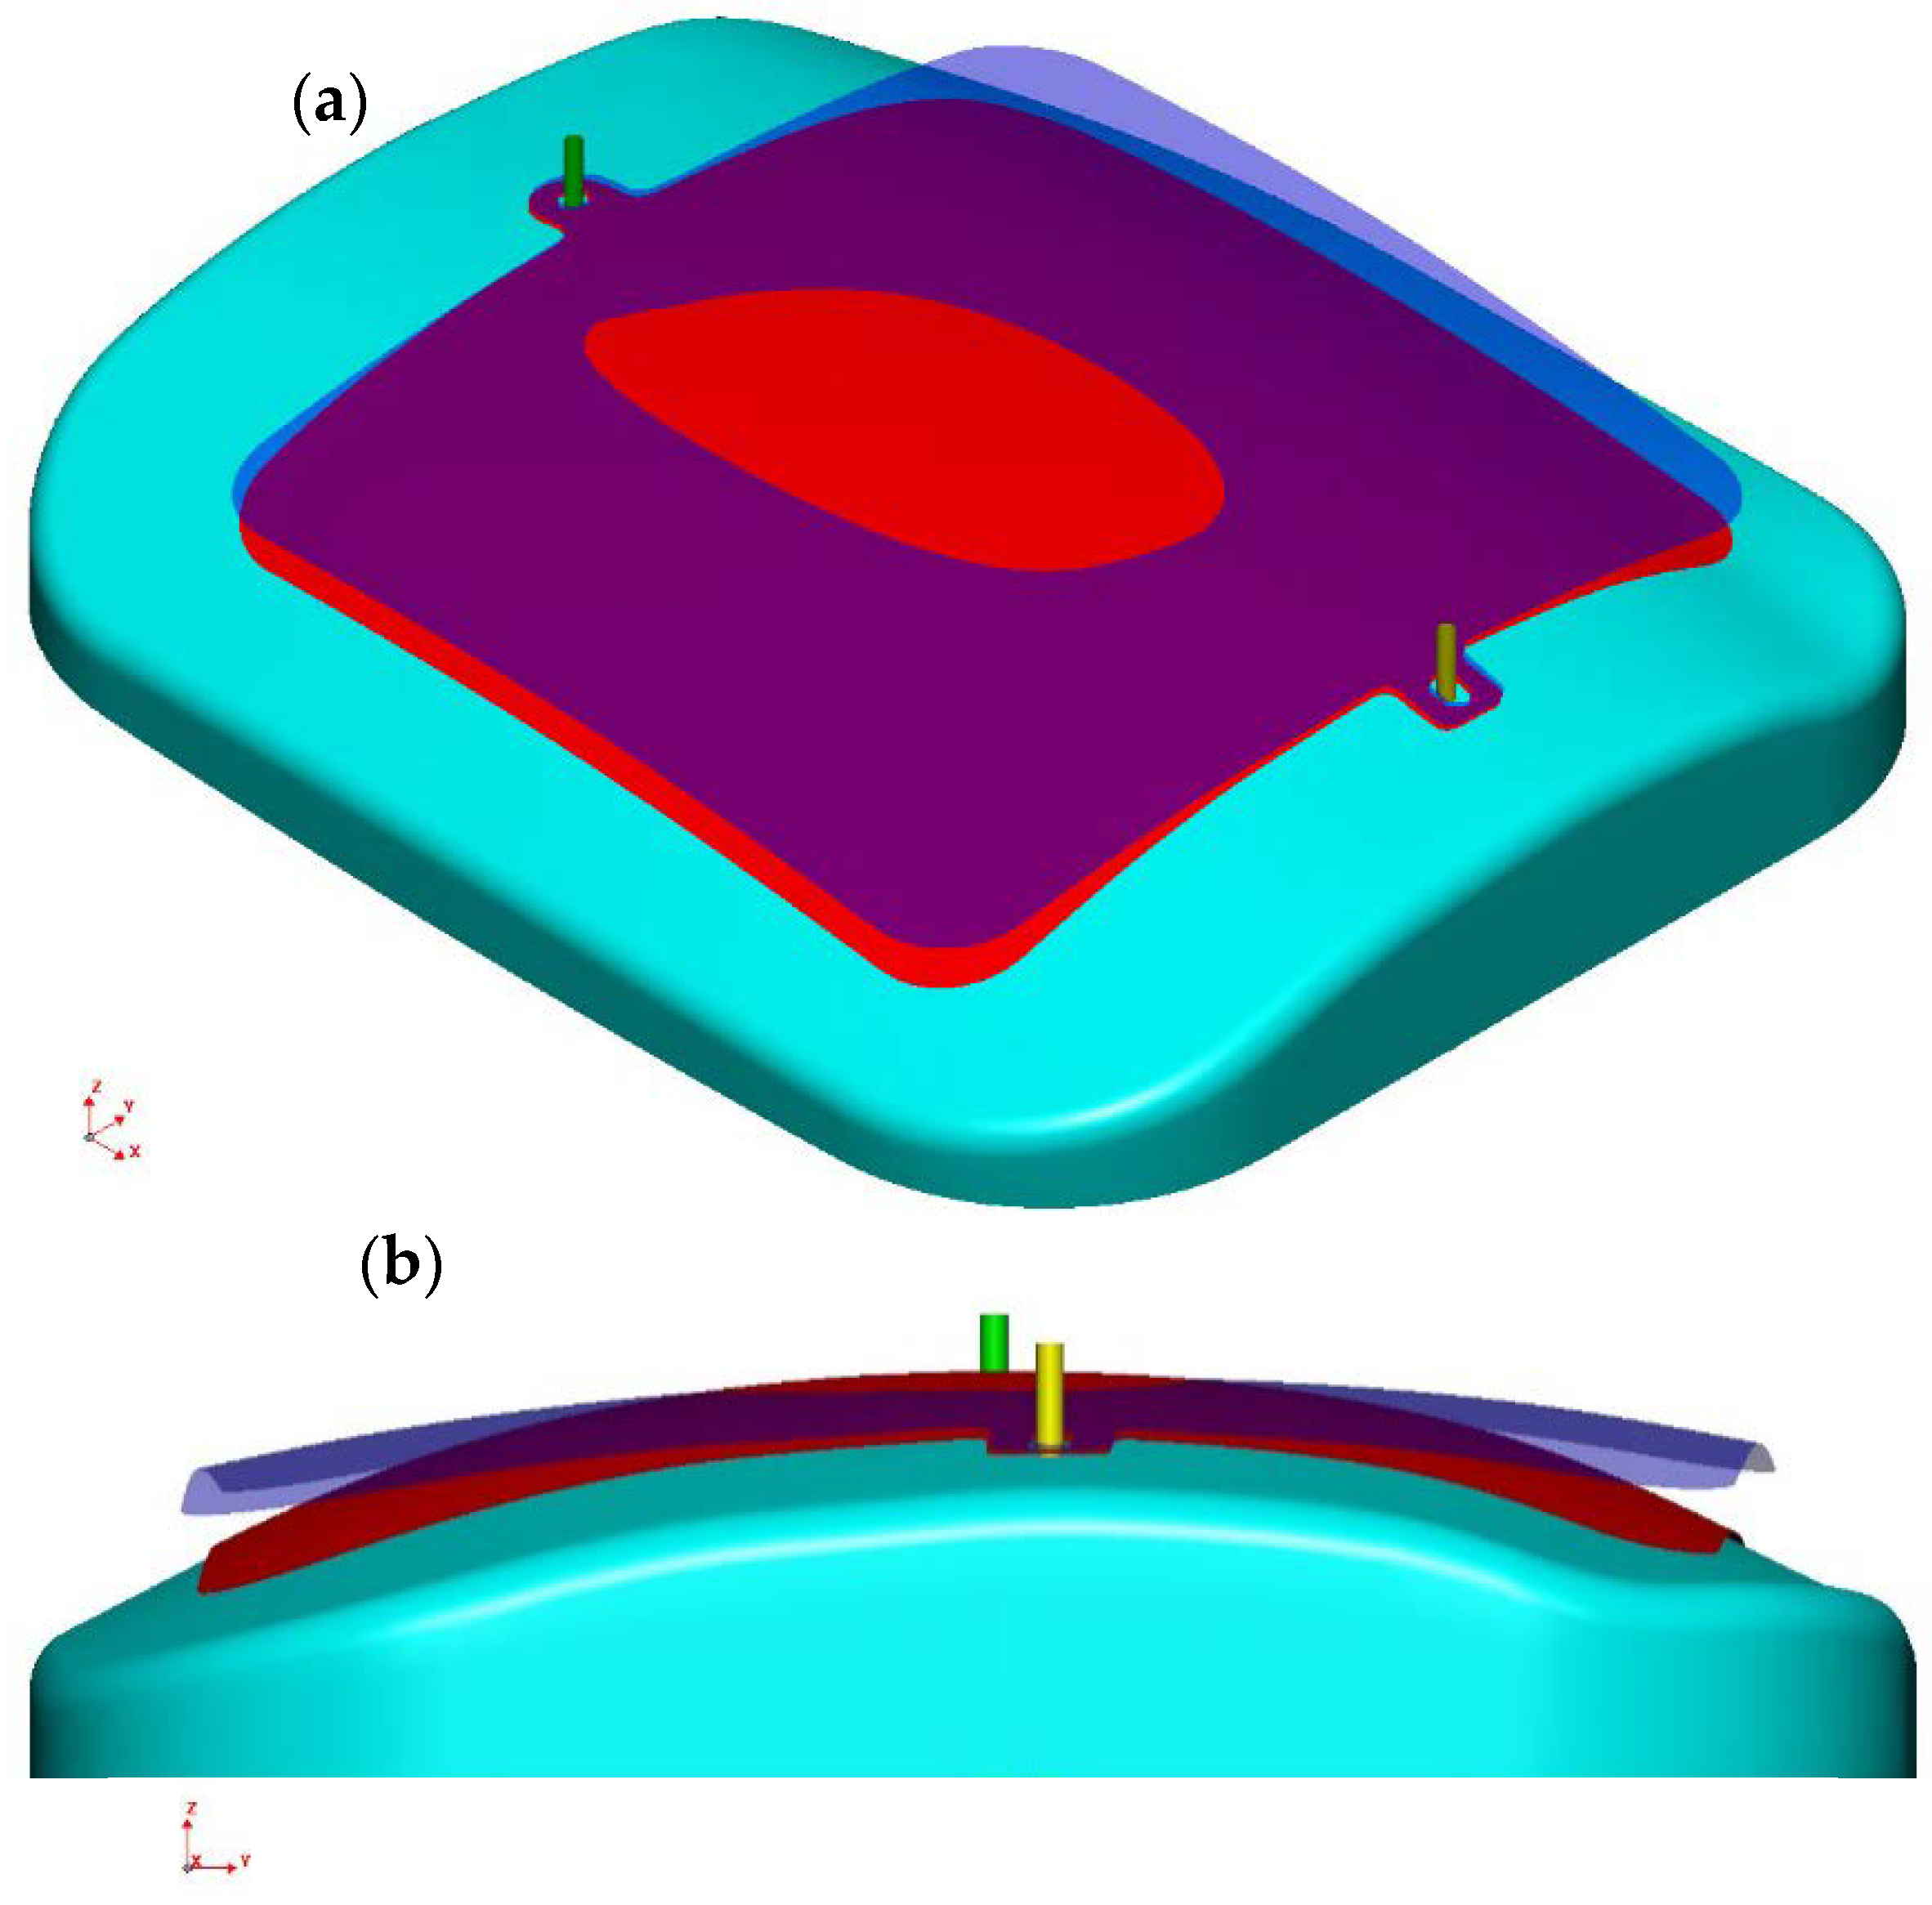
The fluid cell press forming process is based on the filling of a fluid cell by oil, producing the expansion of an elastic element called a diaphragm. Fluid pressure produces the sheets deformation adopting the geometry of a specific matrix, as shown in Figure 3. In the present study, the experimental hydroforming process was executed using a Flexform Fluid Cell Presses of Quintus Technologies, Type QFC, with rectangular forming trays, and a maximum draw depth of 300 mm. The working pressure was 80 MPa. Polyurethane rubber plates with hardness of 90 Shore A were used in experimental tests.
The dimensional evaluation of the geometry generated in the hydroformed elements was carried out using a Helios electronic comparator set, positioning the specimen on a reference flatness surface. The electronic comparator set employed (Helios Messtechnik GmbH & Co., Dörzbach, Germany) has a capacity of 0–12 mm, a resolution of 0.0001 mm, and a measurement uncertainty of 0.0004 mm. To perform the measurement, a grid of 20 mm × 20 mm squares was designed on the shaped pieces, measuring the height of the nodes of the mesh, as illustrated in Figure 4.
The coordinate values obtained in the measurement were used to generate a point cloud using CATIA V5-6R2013 software. Subsequently, a surface containing all the points of the measurement corresponding to the morphology of the real hydroformed piece was generated. This geometry was imported into the simulation software to make a comparison with the pieces obtained in a computational way and assess the reliability of the FEM model.

2.3. Simulation

An FEM model was developed under the PAM-STAMP 2G simulation package. The different components taking part in the forming process (base, die, metal flat sheet, fixation elements, rubber, etc.) were defined in this software before running the FEM simulations. The load (80 MPa) was applied using a fluid cell forming process. The die geometry was imported from CAD files. The meshes of the involved tools in the forming process are automatically generated, the blank mesh being defined inside the window attributes “Blank editor”, where the size and type of elements can be established in PAM-STAMP. The blank mesh is mainly formed by elements of 4 nodes, excepting the areas close to the pin locator holes and the part outline, where elements have 3 nodes. These elements allow the adjustment of the blank mesh to the geometry of the design parts. These pin locators were the fixing elements of the blank during the whole forming process. The total number of elements related to the deformable blank was 13,143, and the average characteristic length (average size of elements) was 1931 mm. The boundary conditions, materials characteristics, and properties, and the 2 processes steps (Stamping and Springback) were also subsequently defined. The boundary conditions in the forming stage are restricted by locator pins. The translation and rotation movement of the blank at locator pins was locked in X, Y, and Z. The boundary conditions set in the springback stage were isostatic locking points. An implicit advanced simulation was carried out at the springback stage. Standard contact was used for advanced implicit springback, available for the tool-blank contact pair. Standard contact is based on a penalty method and it supports friction. The main output of the simulations was the sheet geometry after the hydroforming process. The simulations also allowed us to estimate the elastic recovery (springback) and the prevention of defects formation, such as wrinkles or cracks. In a final step, the geometries obtained in real hydroforming tests were compared with those predicted by the simulations, allowing the estimation of the deviation degree between the FEM estimated and real parts, as presented in one example in Figure 5.

3. Results and Discussion

Numerical simulations of the hydroforming process were carried out with different material parameters for the UNS A92024-T3 alloy. As example of the process, Figure 6 shows the results of hydroformed Part 1 in isometric view (a) and YZ view (b), before (red blank) and after (blue blank) springback. The influence of some variables, such as the mechanical properties, the rolling direction of the blank, or the hardening model, on the process springback was investigated.

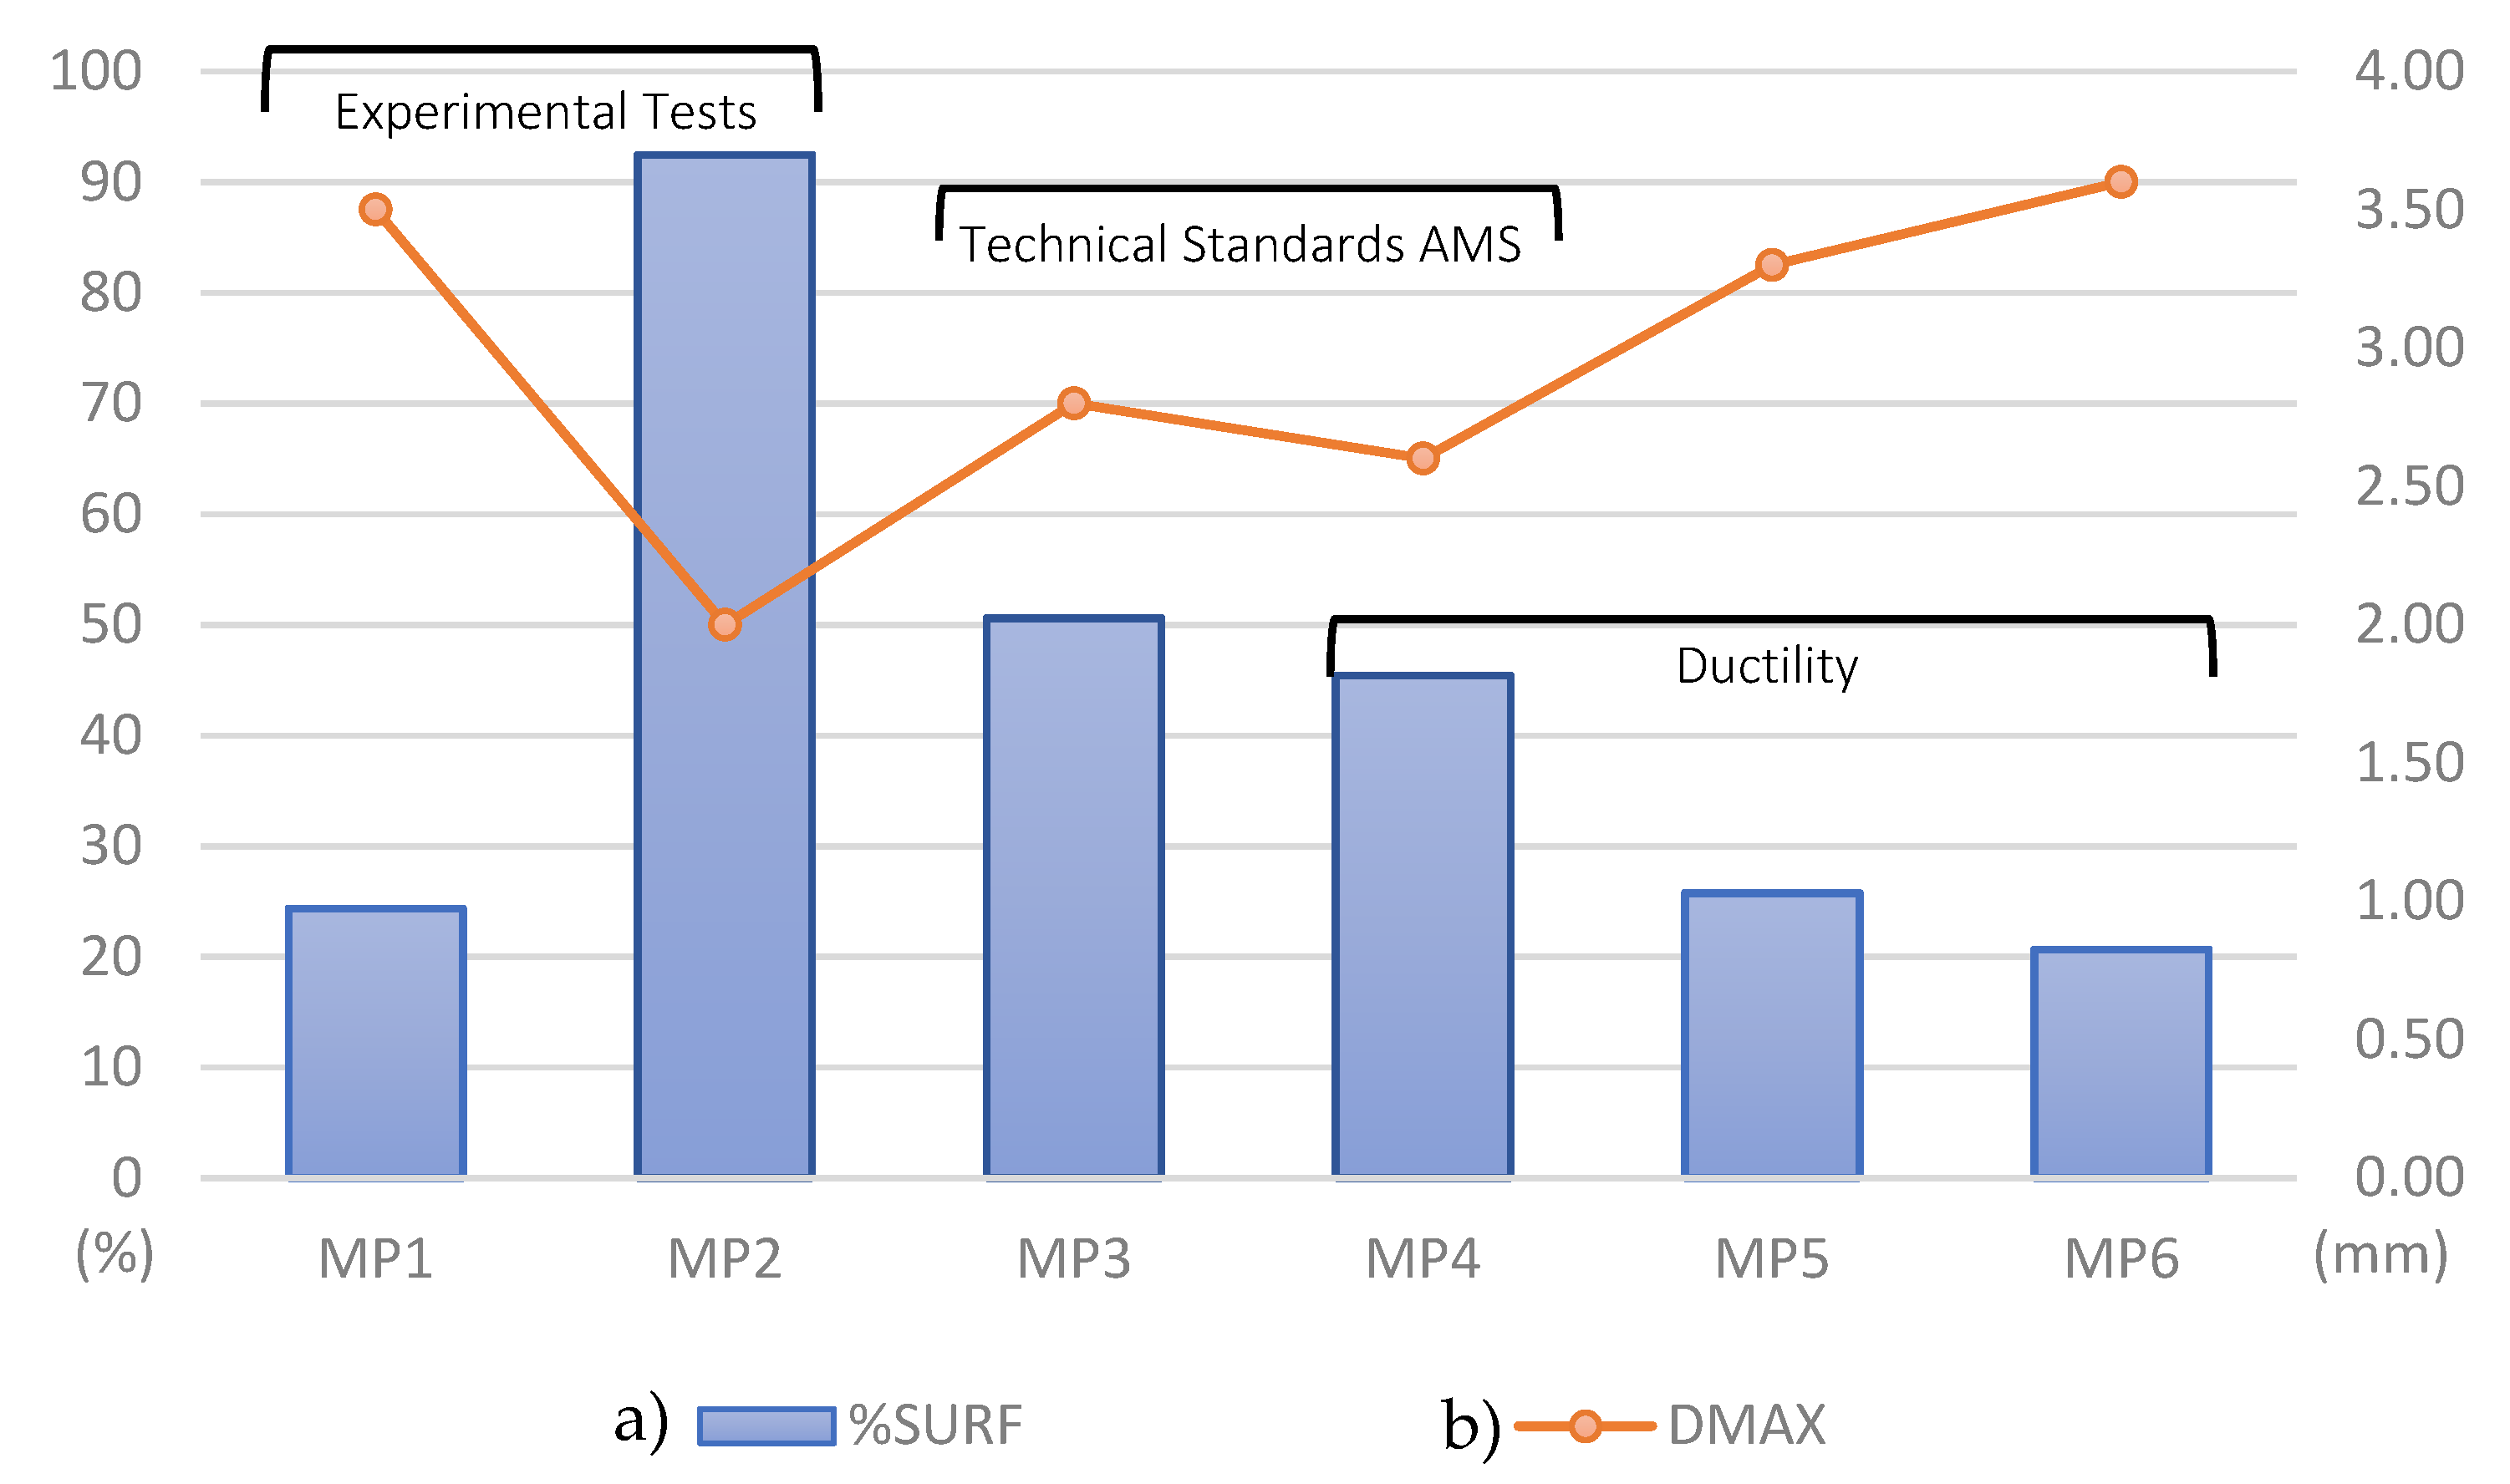
3.1. Influence of Material Properties

The influence of the Material Properties MP1 to MP6 detailed in Section 2.1 was studied with the objective of reproducing the real hydroforming process, and subsequently, being able to estimate the final geometry by means of the FEM simulations. The sources used to obtain the different MPs are reported in Table 2. The first three rows of Table 4 include the values of the main mechanical properties estimated: UTS, YS and elongation. Different FEM simulations of hydroforming process of Part 1 (Piece 1) were solved taking into account these input parameters values. The geometry predicted by these simulations was later compared with the real geometry obtained in the plant for the Part 1. This actual real geometry was obtained from the CATIA point cloud measured with the electronic comparator set. As example of these comparisons, Figure 7 depicts the distance between the real geometry of Part1 and the predicted geometry of the simulations considering material properties MP1 to MP6. The best fitting was found in the case of MP2. As a summary of the comparison between the real and predicted geometries by simulations, two parameters were considered: Maximum distance between the simulated and real Part, (encoded as DMAX, measured in millimeters), and Percentage of surface with distance between simulated and real Part lower than 0.5 mm (in %, indicated as %SURF). These proposed parameters allow an adequate comparison between the real measured geometry and the geometries estimated by simulations. The fitting is much better (meaning better simulations) as DMAX (linear graph) is minimized and %SURF (Bar Chart) is maximized. These parameters results are depicted in the last two rows of Table 4. For better visualization, these results have been included in Figure 8.
Figure 8 shows that MP2 is the material parameter data set that better reproduces the morphology of the real hydroformed Part 1. In fact, when MP2 is employed as input parameters, the simulation provides a geometry quite close to the real measured one, giving the highest %SURF and the lowest DMAX values. Thus, the simulation run with MP2 as input parameters generated a surface with lower deviation than 0.5 mm in a 92.5% of the real piece. In addition, the maximum distance measured between the simulated and real part was 2 mm. When comparing MP1 and MP2 results (tested materials), it is also interesting to note that MP2, with higher Elongation value and lower UTS and YS values, provided a simulation with lower springback, and therefore, with higher curvature than MP1. This behavior is related to the fact that the MP1 was obtained from a cold hardened sheet (related to the bending process of T3511 treatment), in comparison with MP2, a sheet not previously subjected to cold work hardening. As a consequence, MP1 provides higher springback and therefore, lower curvature than MP2. The better approximation obtained with MP2 was expected, provided that these values were obtained from a complete experimental tensile tests program performed with samples of the same material being formed, allowing also the estimation of the anisotropy values (only available for MP2).
Although it is clear that MP1 (batch subjected to cold-rolling + bending) has higher anisotropy than MP2 (only subjected to previous cold-rolling), the hardening process (related to the last bending step of MP1) is thought to have a much higher influence on the springback results than the anisotropy. In fact, mechanical values, included in Table 4, show that MP1 presents higher UTS and YS, and lower elongation ductility than MP2. Therefore, although MP2 presents lower anisotropy than MP1, it seems that the hardening effect has a higher influence on results than the anisotropy. This assumption is dealt with in continuation (results of MP4–MP6) and in Section 3.2 (influence of rolling direction). In any case, it should be clarified that the influence of the anisotropy on the springback results was not explicitly investigated in this work, being a very interesting issue to address in future research.
MP2 was also compared with material properties of requirements SAE-AMS-QQ-A-250/5 (MP3) and SAE-AMS-QQ-A-200/3 (MP4). The fittings provided by MP3 and MP4 were acceptable, although they were worse than that obtained with MP2 even though, both MP3 and MP4 gave better results than MP1. These results are related to the relatively low values of elongation, UTS, and YS of both MP3 and MP4. These properties were observed to lead to simulations with moderated springback values. In order to evaluate the influence of the sheet ductility on the hydroforming process, MP5 and MP6 were considered as input parameters, having the same properties of MP4, excepting the elongation values (12% for MP4, 20% for MP5, and 30% for MP6). The progressive fluence increase (higher plastic deformation) imposed from MP4 to MP6, leads to lower springback values, and therefore to higher curvature, in agreement with [12,22].
The overall results obtained in this section demonstrate the big influence of the material parameters on the reliability of the hydroforming simulations. An appropriate material characterization test program is seen to be essential to estimate the correct parameters values of the material being hydroformed, which is required to obtain reliable springback estimations. In general, hardened materials (with low ductility and high UTS and YS values) lead to high springback recovery values, and therefore, to low curvature hydroformed pieces [23].

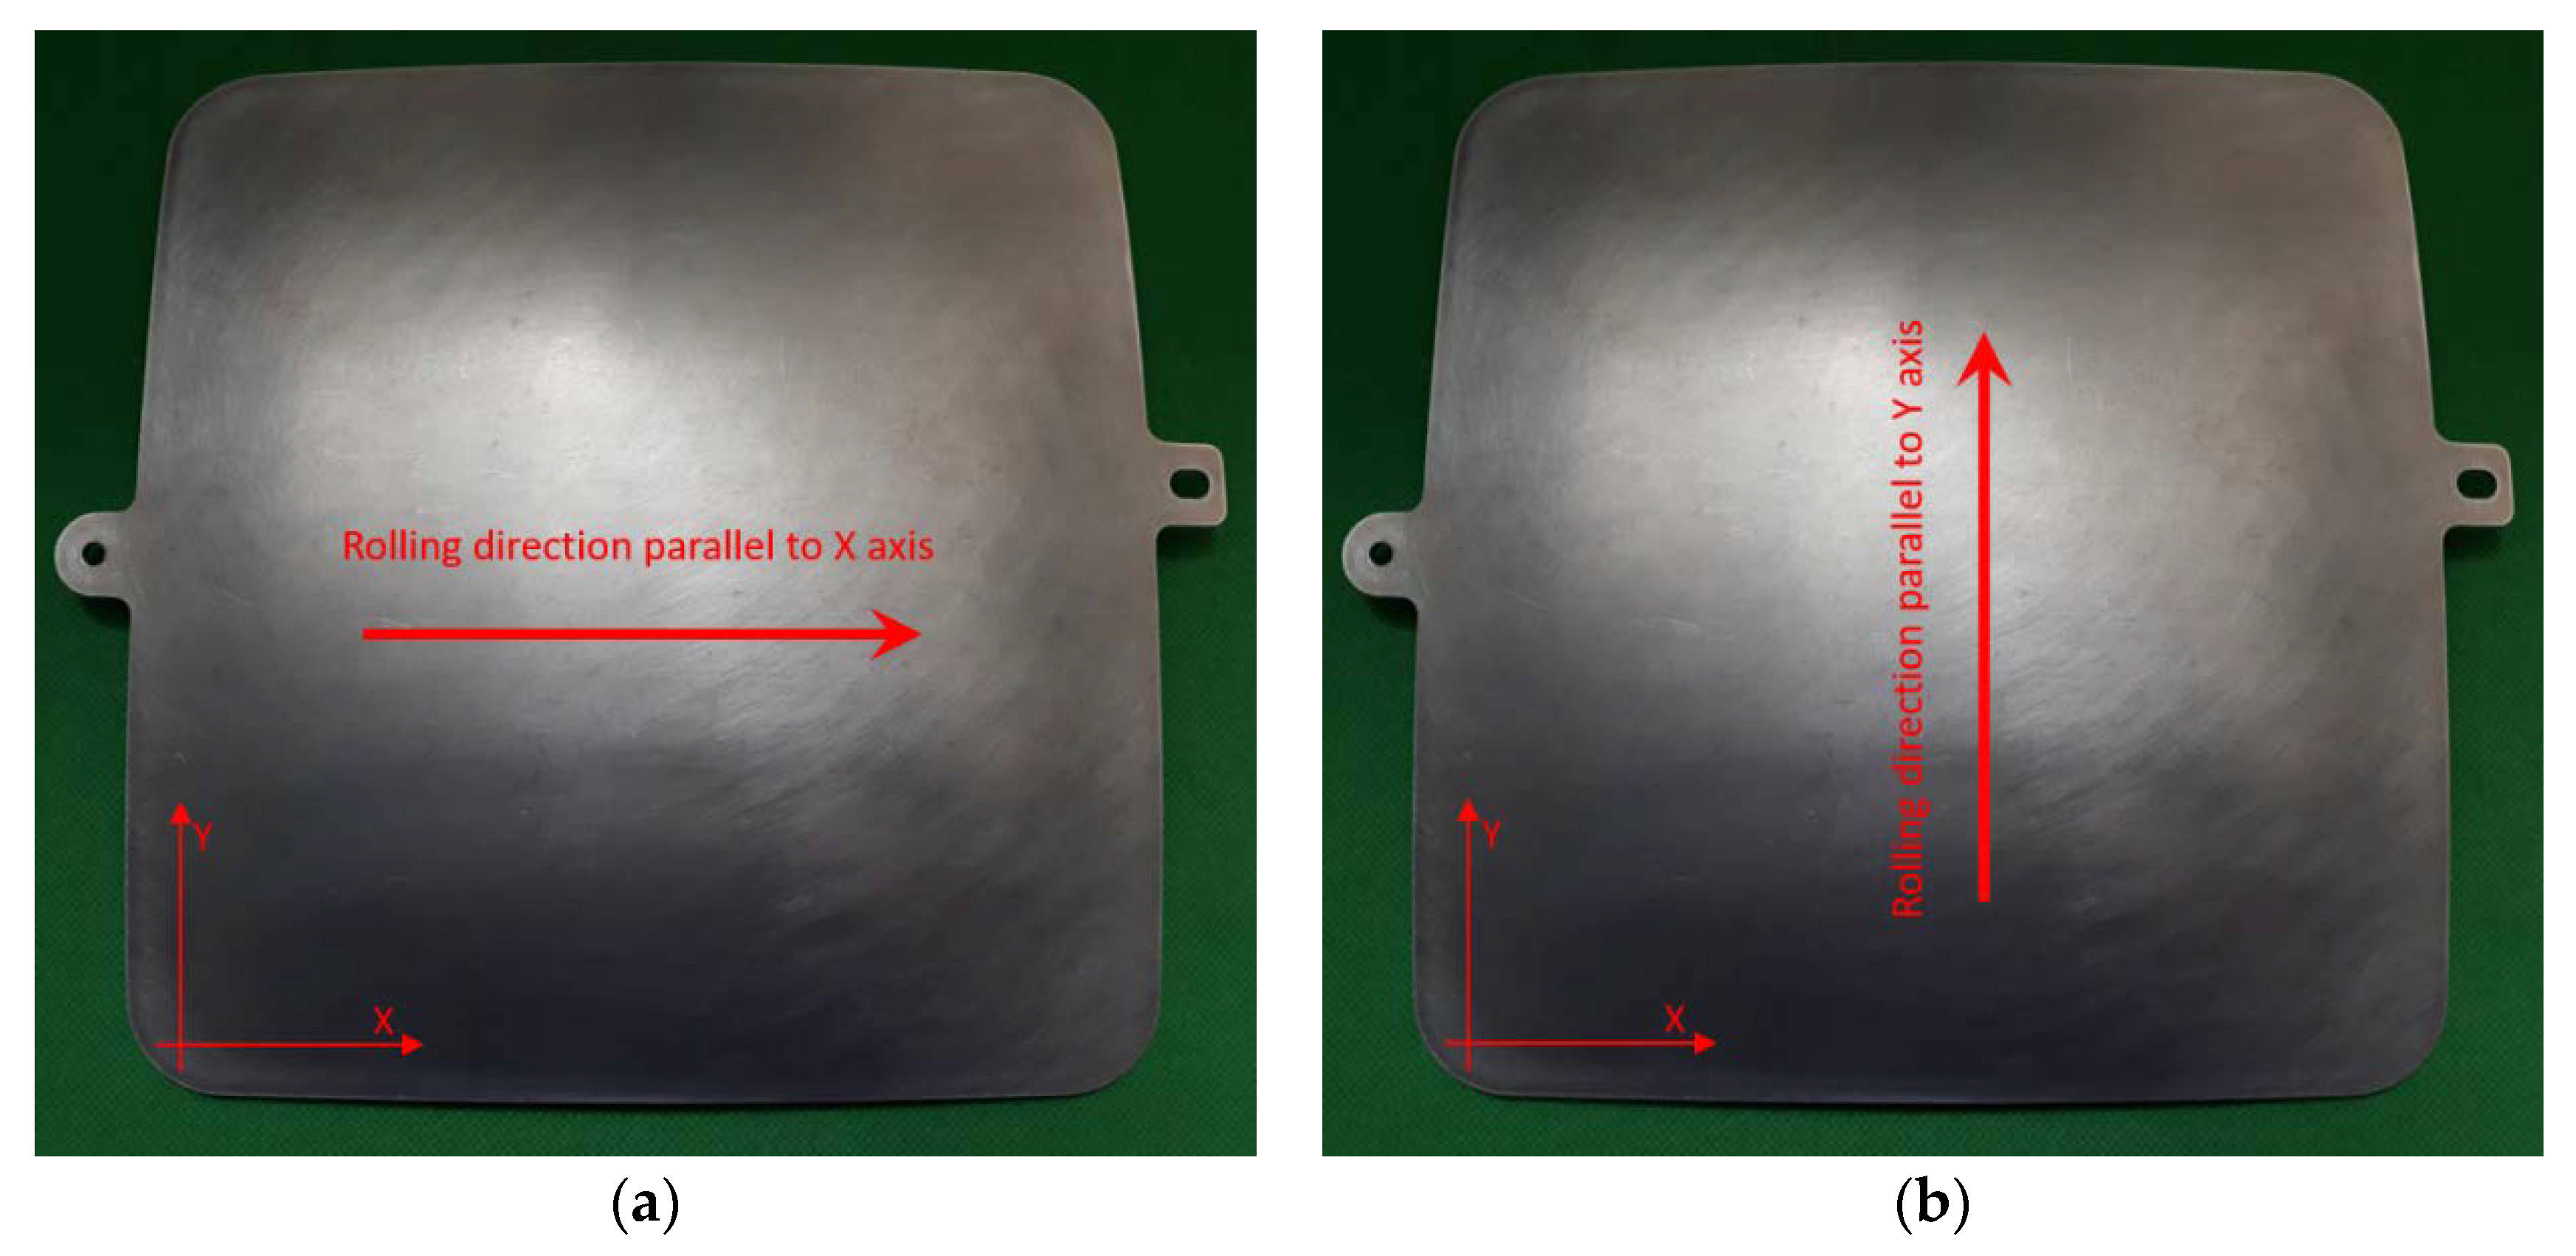
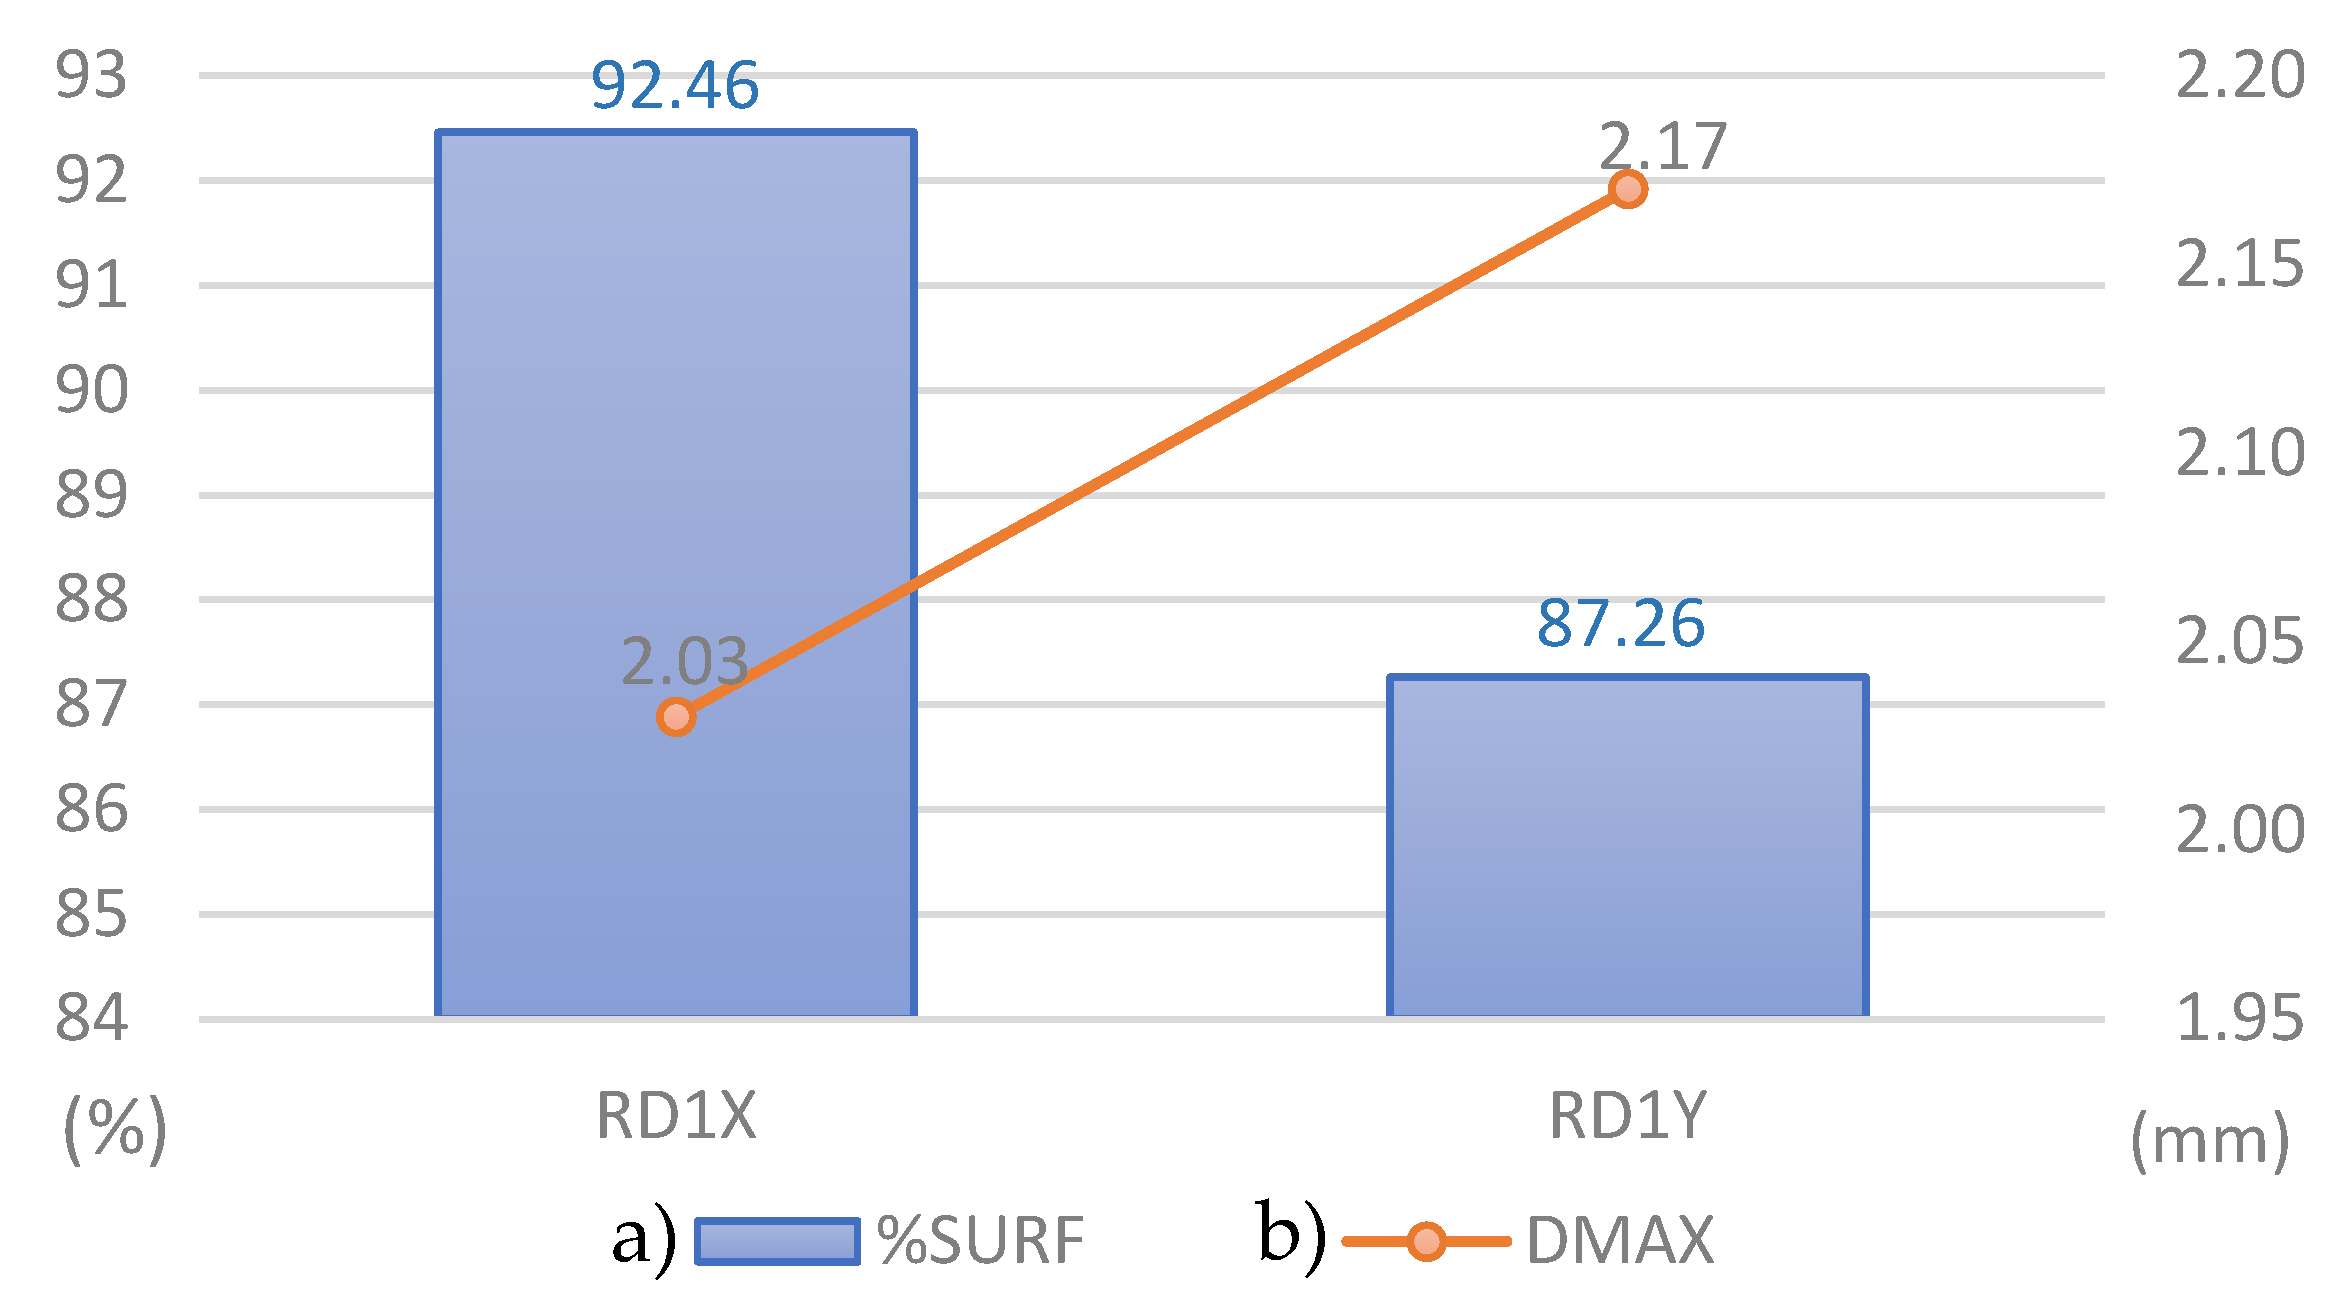
3.2. Influence of the Rolling Direction

A new set of hydroforming simulations was carried out to evaluate the influence of the rolling direction. For this study, only the material characterization MP2 was considered, comparing the results achieved when the rolling direction was parallel to the X-axis (as indicated in Figure 9a) with those results obtained when the rolling direction was parallel to the Y-axis (Figure 9b). Note that in all the simulations reported in the previous section, the rolling direction was always parallel to the X-axis.
The geometry of the real hydroformed Part 1 was compared with the geometry obtained from simulations with rolling direction parallel to the X-axis (RD1X) and with rolling direction parallel to the Y-axis (RD1Y). The distances between Part 1 and geometries obtained with those simulations are summarized in Figure 10, in which the results of both previously employed parameters (%SURF and DMAX) are depicted.
It is clearly observed in Figure 8 that the geometry in RD1Y has a greater deviation than in RD1X. It is experimentally observed that the formed sheet presents greater recovery when positioned with RD1Y (Figure 9b), adopting therefore, less overall curvature. This difference is associated with the asymmetric behavior of the sheet being formed. Nevertheless, the differences found when varying the rolling direction were relatively low when compared with the influence of the material parameters. Therefore, it can be concluded in this section that the rolling direction is a variable with relatively low influence on the simulations results of the studied piece. This finding is of high importance at a manufacturing industrial level, as in the real hydroforming process performed in the plant, it is not usual to consider the rolling direction before cutting and mechanizing the hydroforming blank. In summary, although the rolling direction does change the results of the springback, and consequently, the results of the final geometry, it is not a critical factor.

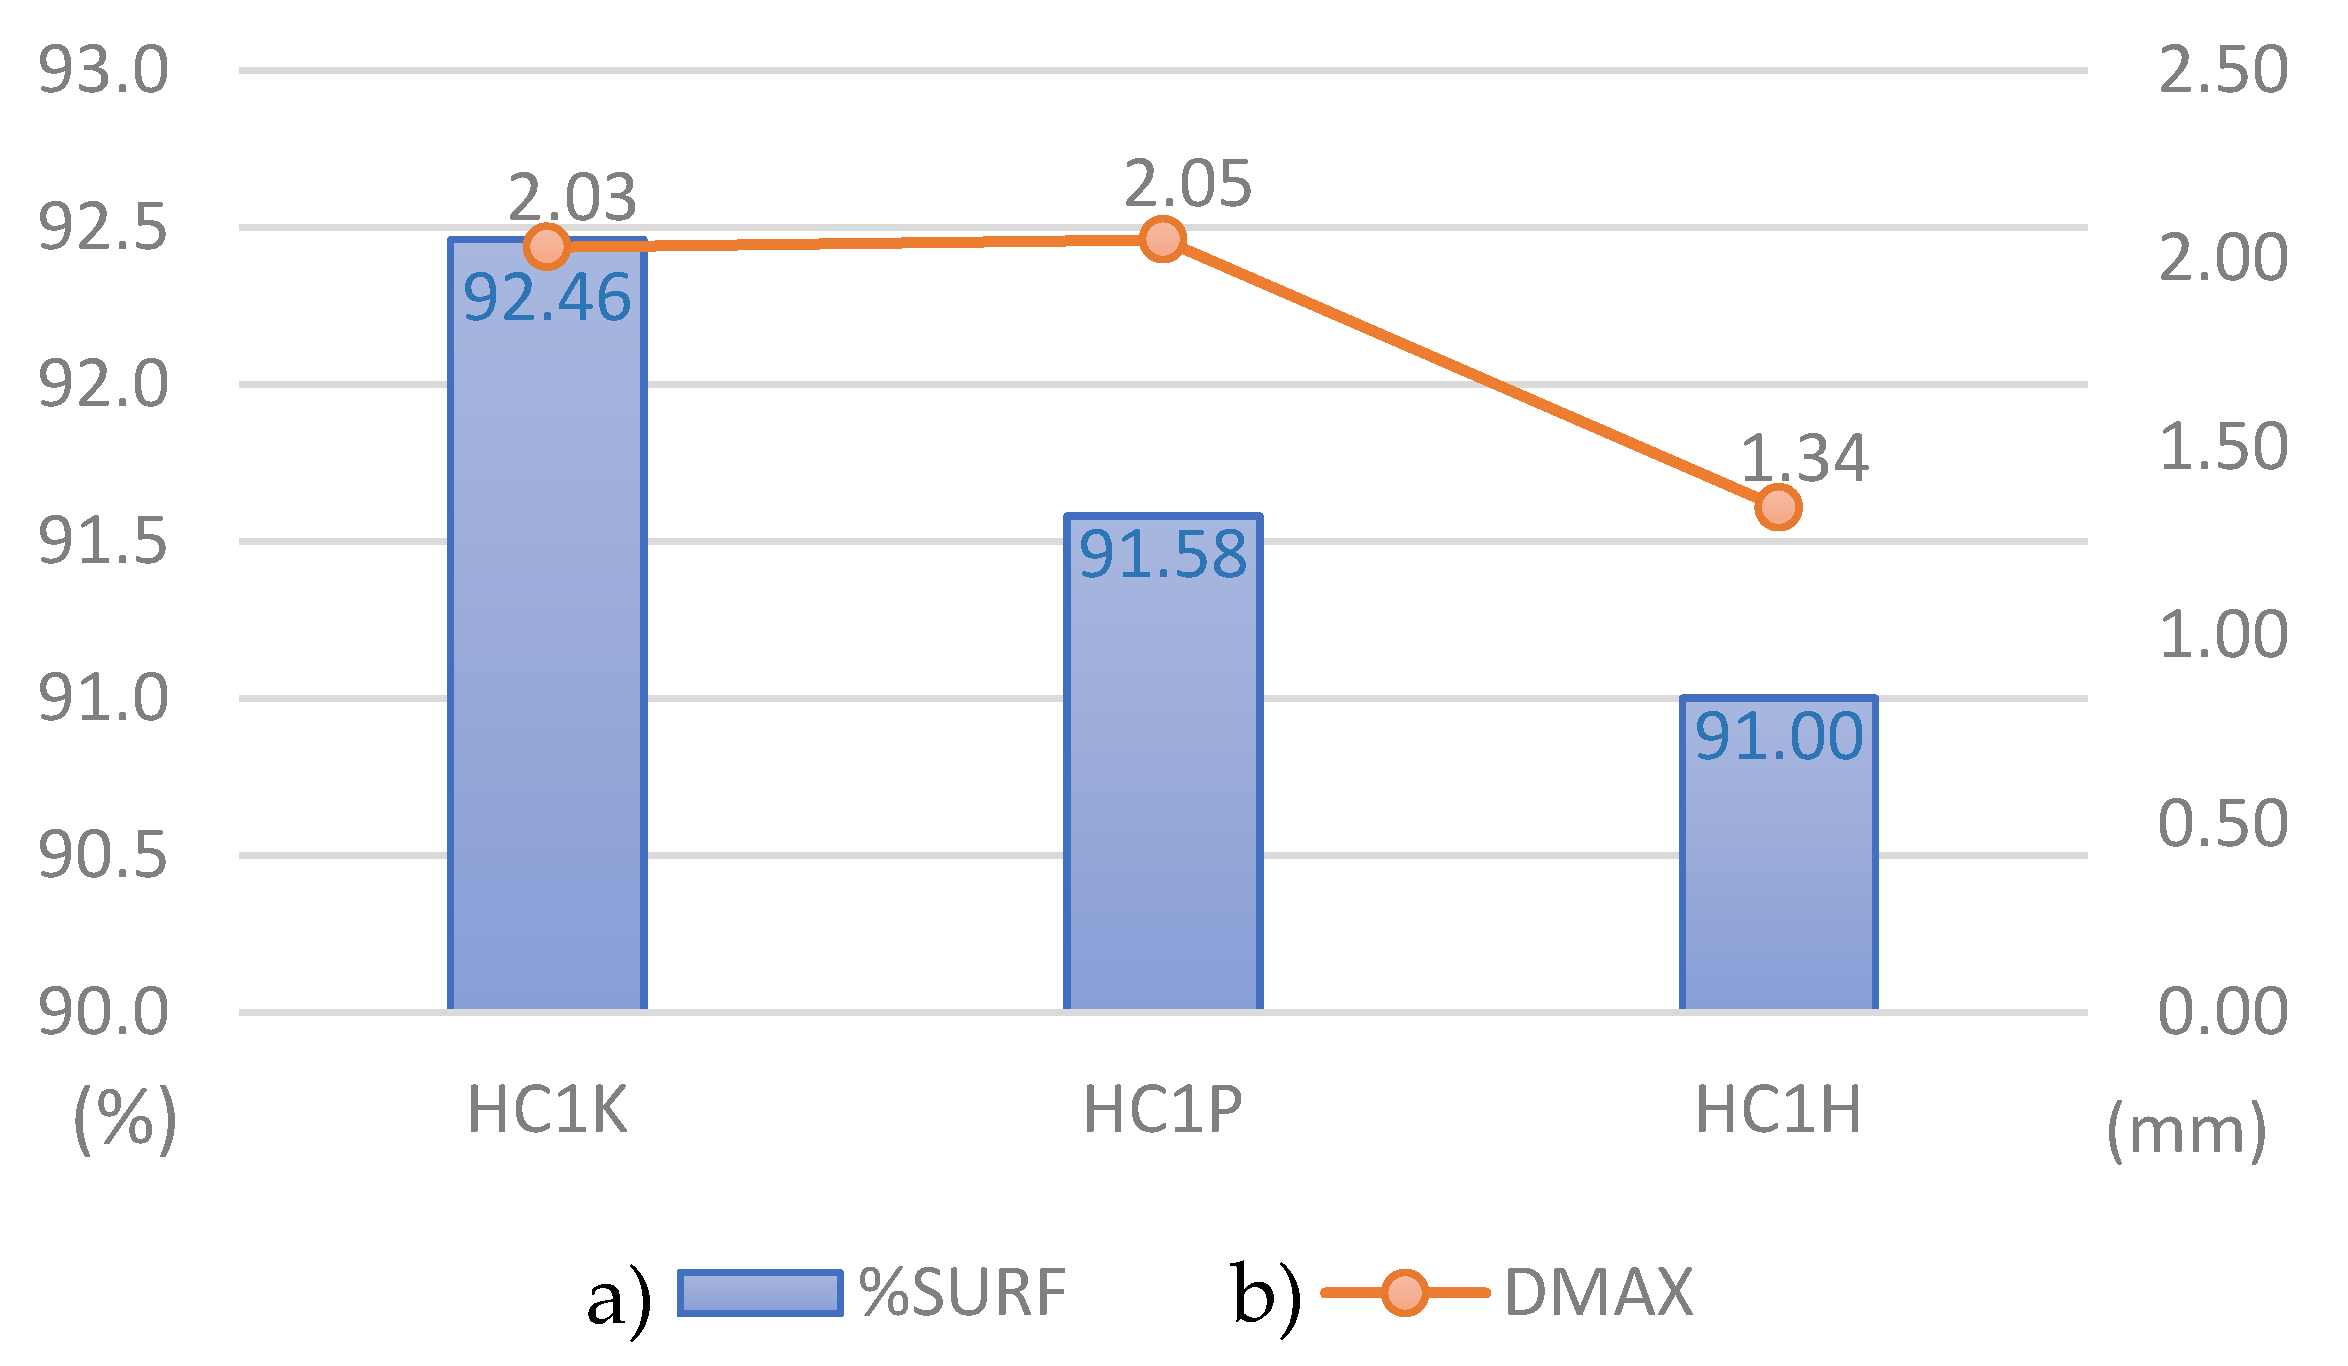
3.3. Influence of the Hardening Model

Many published studies have investigated the influence of constitutive equations on simulated springback prediction [5,14,22]. For example, Ki-Young Seo et al. [14] performed a springback evaluation of TRIP1180 steel sheet. The constitutive equations Hill’s 48 and Yld2000-2d were used to describe its yield behavior. Moreover, isotropic and kinematic hardening models based on the Yoshida-Uemori model were adopted to express hardening behavior. In this case, the material constants of TRIP1180 for the constitutive equations were obtained from uniaxial tension, tension—compression, loading—unloading, and hydraulic bulging tests.
The influence of the hardening model on the precision of the hydroforming simulation results is analyzed in this section. The morphology obtained from the real hydroforming experiment of Piece 1 was compared with the geometries predicted by the simulations when applying three different hardening criteria: Krupkowsky, Power Law and Hollomon (according to Equations (6)–(8), respectively). An Excel VBA (Visual Basic for Applications) tool was created to obtain the coefficients of each hardening law. The procedure consisted of fitting the three hardening curves to the plastic region of the true stress–strain curves, considering MP2 as the materials properties. These fittings, plotted in Figure 11, allowed the estimation of the coefficients of the three hardening curves (Krupkowsky, Power Law, and Hollomon).
The real hydroformed geometry of Piece 1 was compared with those obtained by simulations employing Krupkowsky (HC1K), Power Law (HC1P) and Hollomon (HC1H) as hardening criteria. Figure 12 summarizes the results of the already-mentioned parameters %SURF and DMAX. The figure reveals the relatively high correlation values obtained in the three cases, as all %SURF values were always higher than 90% and DMAX lower than the sheet thickness (2.5 mm). This means that the three criteria allow a more than reasonable fitting of the simulated curves to the true stress–strain curves. HC1K results (simulations with Krupkowsky coefficients) present the highest %SURF, being HC1H (Hollomon Law) the one providing the lowest DMAX. Considering %SURF as the prevalent parameter, it can be concluded that Krupkowsky criterion provides more adjusted results in the simulations of the sheet metal hydroforming process of this material. Therefore, according to these results, the most precise hydroforming simulations for the UNS A92024-T3 alloy were obtained when employing the Krupkowsky coefficients as hardening criteria.

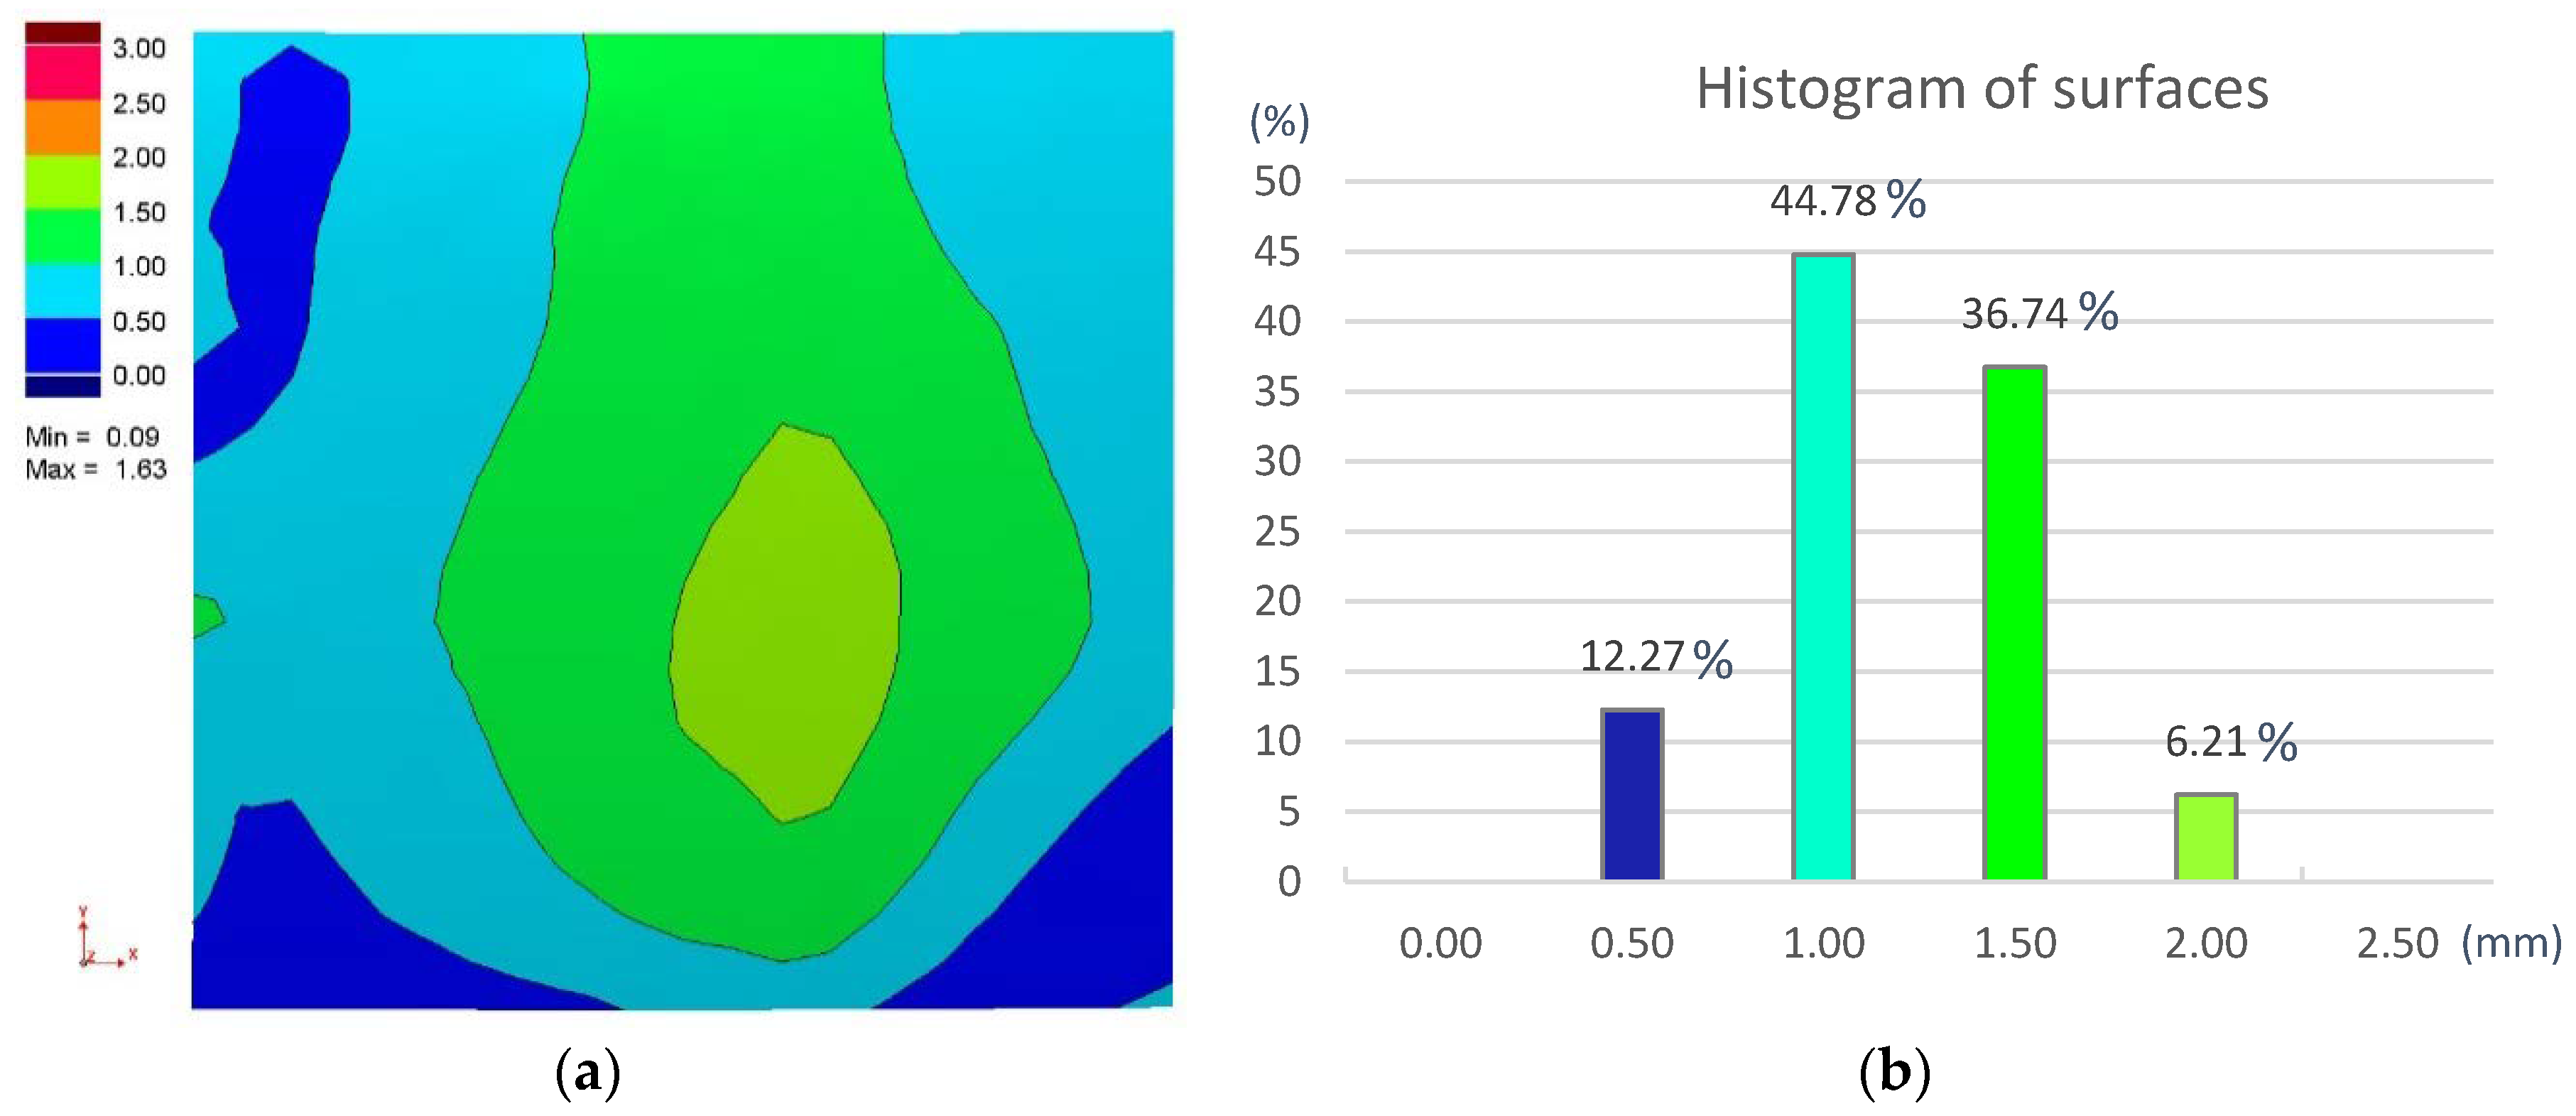
3.4. Validation of the Model

From the above-mentioned results comparing the simulations and the real hydroforming process of Piece 1, it was determined that the better fittings were obtained with the material properties MP2, with the rolling direction RD1X, and with Krupkowsky Law (HCK) as hardening criteria. In order to validate all the above mentioned experimental and simulation parameters, a second hydroforming experiment was performed to provide the Piece 2, similar to Piece 1, but with lower curvature. This Piece 2 was formed with a new Die2 tool. A new hydroforming simulation with this Die2 and the previously optimized parameters (MP2, RD1X, and HCK) was launched. The predicted morphology was compared with the measured geometry of Piece 2. The results of this comparison are plotted in Figure 13. An excellent geometric adjustment was found, the values of %SURF and DMAX being 93.79% and 1.63 mm, respectively. The fitting of Piece 2 is therefore even better than the one of Piece 1 (Figure 10), as %SURF is higher and DMAX is lower than in Piece 1.
The results of this second hydroforming experiments allowed us to confirm that the developed simulation process provides a reliable springback estimation, and therefore, an accurate geometry approximation.
The overall results obtained in this investigation demonstrate the high influence of some experimental variables of the hydroforming process on the springback results. Among these variables, the material properties of the blank are observed to play an essential role, as different batches of sheets (MP1 and MP2) lead to different springback values. Therefore, an appropriate methodology to estimate the hydroforming springback is highly advisable, such as the FEM procedure developed in the present work. These tools can clearly benefit the manufacturing industry of sheet metal production, as they can make the hydroforming a much more robust, accurate, predictable, efficient, and productive process.

4. Conclusions

In the present paper, a working procedure based on finite element simulations was developed to predict the elastic recovery (springback) of double curvature UNS A92024-T3 pieces after the hydroforming process, estimating therefore the final geometry of the parts. Experimental results of real formed parts were compared with the results obtained in simulations. The influence of different parameters was analyzed, such as the material properties, the rolling direction and the hardening criteria.
The material parameters showed a high effect on the results of the hydroforming simulations. Thus, an appropriate material characterization is observed to be required to obtain reliable springback estimations. It is highly recommended to use material properties obtained from the same batches than the material being hydroformed. In general, hardened materials lead to high springback recovery values, and therefore, to low curvature hydroformed pieces. The rolling direction is observed to induce little change on the springback, being considered a low influencing parameter. Krupkowsky, Power Law, and Hollomon hardening models of the material being hydroformed were observed to lead to similar reliable results, all of them providing a good fitting to the experimental stress strain curves. Krupkowsky criterion seems to provide slightly more adjusted results.
It is highly recommended to follow a systematic simulation procedure to optimize the results of the hydroforming process, as it allows a better fitting between simulated and real results. The developed FEM strategy was validated taking into account the real geometry of two different hydroformed pieces.

Author Contributions

The present paper is part of the MSc Thesis defended by C.C. C.C. optimized and performed the FEM simulations, analyzed the overall data, and wrote the paper; J.M.S.-A. supervised the whole work, analyzed and discussed the data, and revised the paper. F.C. performed at Titania facilities the tensile tests required to obtain MP1 and MP2. J.M.V.-M. performed the geometry measurements of the hydroformed parts; and J.B. discussed the data and revised the paper.

Acknowledgments

The authors would like to thank Antonio Aragón and María Cruz Jimena, of Airbus D&S (CBC), for providing the 2024-T3 material, sharing their hydroforming process expertise, and performing the experimental hydroforming tests at the CBC oil hydraulic press equipment. Authors would like also thank the student Alberto Baro for his help in fitting the hardening curves with the Excel VBA tool.

Conflicts of Interest

The authors declare no conflict of interest.

References

  1. Sala, G. A numerical and experimental approach to optimise sheet stamping technologies: Part II—Aluminium alloys rubber-forming. Mater. Des. 2000, 22, 299–315. [Google Scholar] [CrossRef]
  2. Chen, L.; Chen, H.; Guo, W.; Chen, G.; Wang, Q. Experimental and simulation studies of springback in rubber forming using aluminium sheet straight flanging process. Mater. Des. 2014, 54, 354–360. [Google Scholar] [CrossRef]
  3. Sinke, J. Spring back of Curved Flanges of Rubber Formed Aluminium parts. Key Eng. Mater. 2013, 554–557, 1851–1855. [Google Scholar] [CrossRef]
  4. Asnafi, N. On stretch and shrink flanging of sheet aluminium by fluid forming. Mater. Process. Technol. 1999, 96, 198–214. [Google Scholar] [CrossRef]
  5. Chen, L.; Chen, H.; Wang, Q.; Li, Z. Studies on wrinkling and control method in rubber forming using aluminium sheet shrink flanging process. Mater. Des. 2015, 65, 505–510. [Google Scholar] [CrossRef]
  6. Paunoiu, V.; Teodor, V.; Susac, F. Researches regarding the hydroforming process of aluminum components. Mod. Technol. Ind. Eng. 2015, 95, 1–6. [Google Scholar] [CrossRef]
  7. Belhassen, L.; Koubaa, S.; Wali, M.; Dammak, F. Numerical prediction of springback and ductile damage in rubber-pad forming process of aluminum sheet metal. Int. J. Mech. Sci. 2016, 117, 218–226. [Google Scholar] [CrossRef]
  8. Gomes, T.; Silva, F.J.G.; Campilho, R.D.G.S. Reducing the simulation cost on dual-phase steel stamping process. Procedia Manuf. 2017, 11, 474–481. [Google Scholar] [CrossRef]
  9. Neto, D.M.; Coër, J.; Oliveira, M.C.; Alves, J.L.; Manach, P.Y.; Menezes, L.F. Numerical analysis on the elastic deformation of the tools in sheet metal forming processes. Int. J. Solids Struct. 2016, 100–101, 270–285. [Google Scholar] [CrossRef]
  10. Firat, M. Computer aided analysis and design of sheet metal forming processes: Part III: Stamping die-face design. Mater. Des. 2007, 28, 1311–1320. [Google Scholar] [CrossRef]
  11. Kim, M.; Bang, S.; Lee, H.; Kim, N.; Kim, D. Enhancement of dimple formability in sheet metals by 2-step forming. Mater. Des. 2014, 54, 121–129. [Google Scholar] [CrossRef]
  12. Banabic, D. Phenomenological Constitutive Models Parameters Optimization. In Advanced Methods in Material Forming; Springer: Berlin/Heidelberg, Germany, 2007; p. 39. [Google Scholar]
  13. Hill, R. A theory of the yielding and plastic flow of anisotropic metals. Proc. R. Soc. Lond. Ser. A Math. Phys. Sci. 1948, A193, 281–297. [Google Scholar] [CrossRef]
  14. Seo, K.-Y.; Kim, J.-H.; Lee, H.-S.; Kimm, J.H.; Kim, B.-M. Effect of Constitutive Equations on Springback Prediction Accuracy in the TRIP1180 Cold Stamping. Metals 2017, 8, 18. [Google Scholar] [CrossRef]
  15. Atluri, S.N.; Yagawa, G.; Cruse, T.A. Computational Mechanics ’95: Vol. 1 and Vol. 2. Theory and Applications. In Proceedings of the International Conference on Computational Engineering Science, Atlanta, GA, USA, 10–14 April 1988; Springer: Berlin/Heidelberg, Germany, 1995; p. 1326, ISBN 978-3-642-79656-2. [Google Scholar]
  16. Abe, T.; Tsuta, T. Pergamon, Amsterdam-Oxford-New York-Tokyo. In Proceedings of the Asi-PAcific Symposium on Advances in Engineering Plasticity and Its Applications (AEPA’96), Hiroshima, Japan, 21–24 August 1996; p. 686. [Google Scholar]
  17. Zhao, B.; Zhang, S.; Lu, X.; Dong, Q. Cyclic tangential loading of a power-law hardening elastic–plastic spherical contact in pre-sliding stage. Int. J. Mech. Sci. 2017, 128–129, 652–658. [Google Scholar] [CrossRef]
  18. Elgindi, M.B.; Wei, D.; Liu, Y.; Kamran, K.; Xu, H. Buckling and deformation of Hollomon’s power-law tubes. Thin-Walled Struct. 2014, 74, 213–221. [Google Scholar] [CrossRef]
  19. AMS. Aluminium Alloy 2024, Plate and Sheet: SAE-AMS-QQ-A-250/4B (2015); Aerospace Material Specification, SAE International; AMS: Warrendale, PA, USA, 2015. [Google Scholar]
  20. AMS. Aluminum Alloy 2024, Bar, Rod, Shapes, Tube, and Wire, Extruded: SAE-AMS-QQ-A-200-3 (2007); Aerospace Material Specification, SAE International; AMS: Warrendale, PA, USA, 2015. [Google Scholar]
  21. ISO. Metallic Materials. Tensile Testing. Part 1: Method of Test at Room Temperature; International Standard ISO-6892-1:2016; International Organization for Standard: Geneva, Switzerland, 2016. [Google Scholar]
  22. Asnafi, N. On springback of double-curved autobody panels. Int. J. Mech. Sci. 2001, 43, 5–37. [Google Scholar] [CrossRef]
  23. Bruni, C.; Celeghini, M.; Geiger, M.; Gabrielli, F. A study of techniques in the evaluation of springback and residual stress in hydroforming. Int. J. Adv. Manuf. Technol. 2007, 33, 929–939. [Google Scholar] [CrossRef]
Figure 1. Design of UNS A92024-T3 aluminum alloy hydroformed Part 1.
Metals 08 00404 g001
Figure 2. (a) Three dimensional surface chart of Part 1 morphology, in mm; (b) Three dimensional surface chart of Part 2 morphology, in mm.
Metals 08 00404 g002aMetals 08 00404 g002b
Figure 3. Schematic steps of Flexform process: (a) Initial pressure application; (b) Sheet partially hydroformed; (c) Sheet completely hydroformed; (d) Elevation of rubber.
Metals 08 00404 g003
Figure 4. Real hydroformed Piece 1, with a marked surface grid, required to measure the height of different nodes.
Metals 08 00404 g004
Figure 5. Example of surface superposition of simulated (green mesh) and real hydroformed piece (blue mesh), employed to measure the distance (deviation) between nodes of the grid.
Metals 08 00404 g005
Figure 6. (a) Isometric view and (b) YZ view, of hydroformed Part 1, before springback (red blank) and after springback (blue blank).
Metals 08 00404 g006
Figure 7. Distance between the real hydroformed piece (Part 1) and simulations employing the six different material properties (MP1 to MP6) summarized in Table 4.
Metals 08 00404 g007
Figure 8. Results of simulations performed with different mechanical properties of the material: (a) Bar Chart with Surface % with distance between Real and Simulation Parts < 0.5 mm (%SURF); (b) Linear Graph with maximum distance between Real and Simulation Piece (DMAX).
Metals 08 00404 g008
Figure 9. (a) Rolling direction of the simulations and real hydroformed sheet encoded as Part 1 (parallel to the X-axis); (b) rolling direction considered for the simulation of the hydroformed sheet (parallel to the Y-axis).
Metals 08 00404 g009
Figure 10. Comparison between the real hydroformed Part 1 with simulations considering rolling direction parallel to X (RD1X) and rolling direction parallel to Y (RD1Y): (a) Bar Chart with Surface % with distance between Real and Simulation Parts < 0.5 mm; (b) Linear Graph with maximum distance between Real and Simulation Piece.
Metals 08 00404 g010
Figure 11. Hardening curves of the material UNS A92024-T3 aluminum alloy according to Krupkowsky, Power Law, and Hollomon criteria.
Metals 08 00404 g011
Figure 12. Results of simulations performed with different hardening criteria: Krupkowsky (HC1K), Power Law (HC1P) and Hollomon (HC1H). (a) Bar Chart with % Surface with distance between Real and Simulation Parts < 0.5 mm; (b) Linear Graph with maximum distance between Real Piece and Simulation Piece.
Metals 08 00404 g012
Figure 13. Simulation of Piece 2: (a) Distance between Real Part and Simulated Part with Die2, material characterization MP2, rolling direction parallel to the X-axis and hardening law according to Krupkowsky. (b) Histogram bar chart depicting the surface percentage with lower deviations than 0.5, 1.0, 1.5, and 2.0 mm, measured between the real and simulated blank.
Metals 08 00404 g013
Table 1. Chemical composition (wt %) of the UNS A92024-T3 aluminum alloy.
MaterialSiFeCuMnMgCrZnTiOtherAl
EachTotal
UNS A92024-T30.0380.0914.460.621.410.0050.0830.031<0.05<0.15Bal.
Table 2. Material Properties employed in hydroforming simulations of UNS A92024-T3.
Material PropertiesSourceDescription of Material Properties (MPs)
MP1Experimental testsTensile tests performed on UNS A92024-T3511 with the same thickness as the hydroformed sheet (2.5 mm)
MP2Experimental tests15 tensile tests performed on UNS A92024-T3 samples extracted from the same material batch used in the hydroforming process (2.5 mm)
MP3Standards dataMinimum MPs values requested by the aerospace standard SAE-AMS-QQ-A-250/5 [19]
MP4Standards dataMinimum MPs values requested by the aerospace standard SAE-AMS-QQ-A-200/3 [20]
MP5Standards dataMPs based on SAE-AMS-QQ-A-200/3 [21], with higher elongation value (20%)
MP6Standards dataMPs based on SAE-AMS-QQ-A-200/3 [21], with higher elongation value (30%)
Table 3. Material properties MP2 of tested material: UNS A92024-T3.
Test DirectionYoung’s Modulus (MPa)Yield Strength (MPa)Ultimate Tensile Stress (MPa)Elongation (%)R-Value
Rolling direction (0°)72,80933249119.980.49
Diagonal direction (45°)74,71129445825.250.59
Transverse direction (90°)71,80333748120.860.50
Table 4. Summary of Material Properties (MPs) and results of forming simulations with different MPs.
Summary of Mechanical Properties and FEM ResultsMP1MP2MP3MP4MP5MP6
Ultimate Tensile Strength, UTS (MPa)535477421393393393
Yield Strength, YS (MPa)396321276290290290
Elongation (%)112215122030
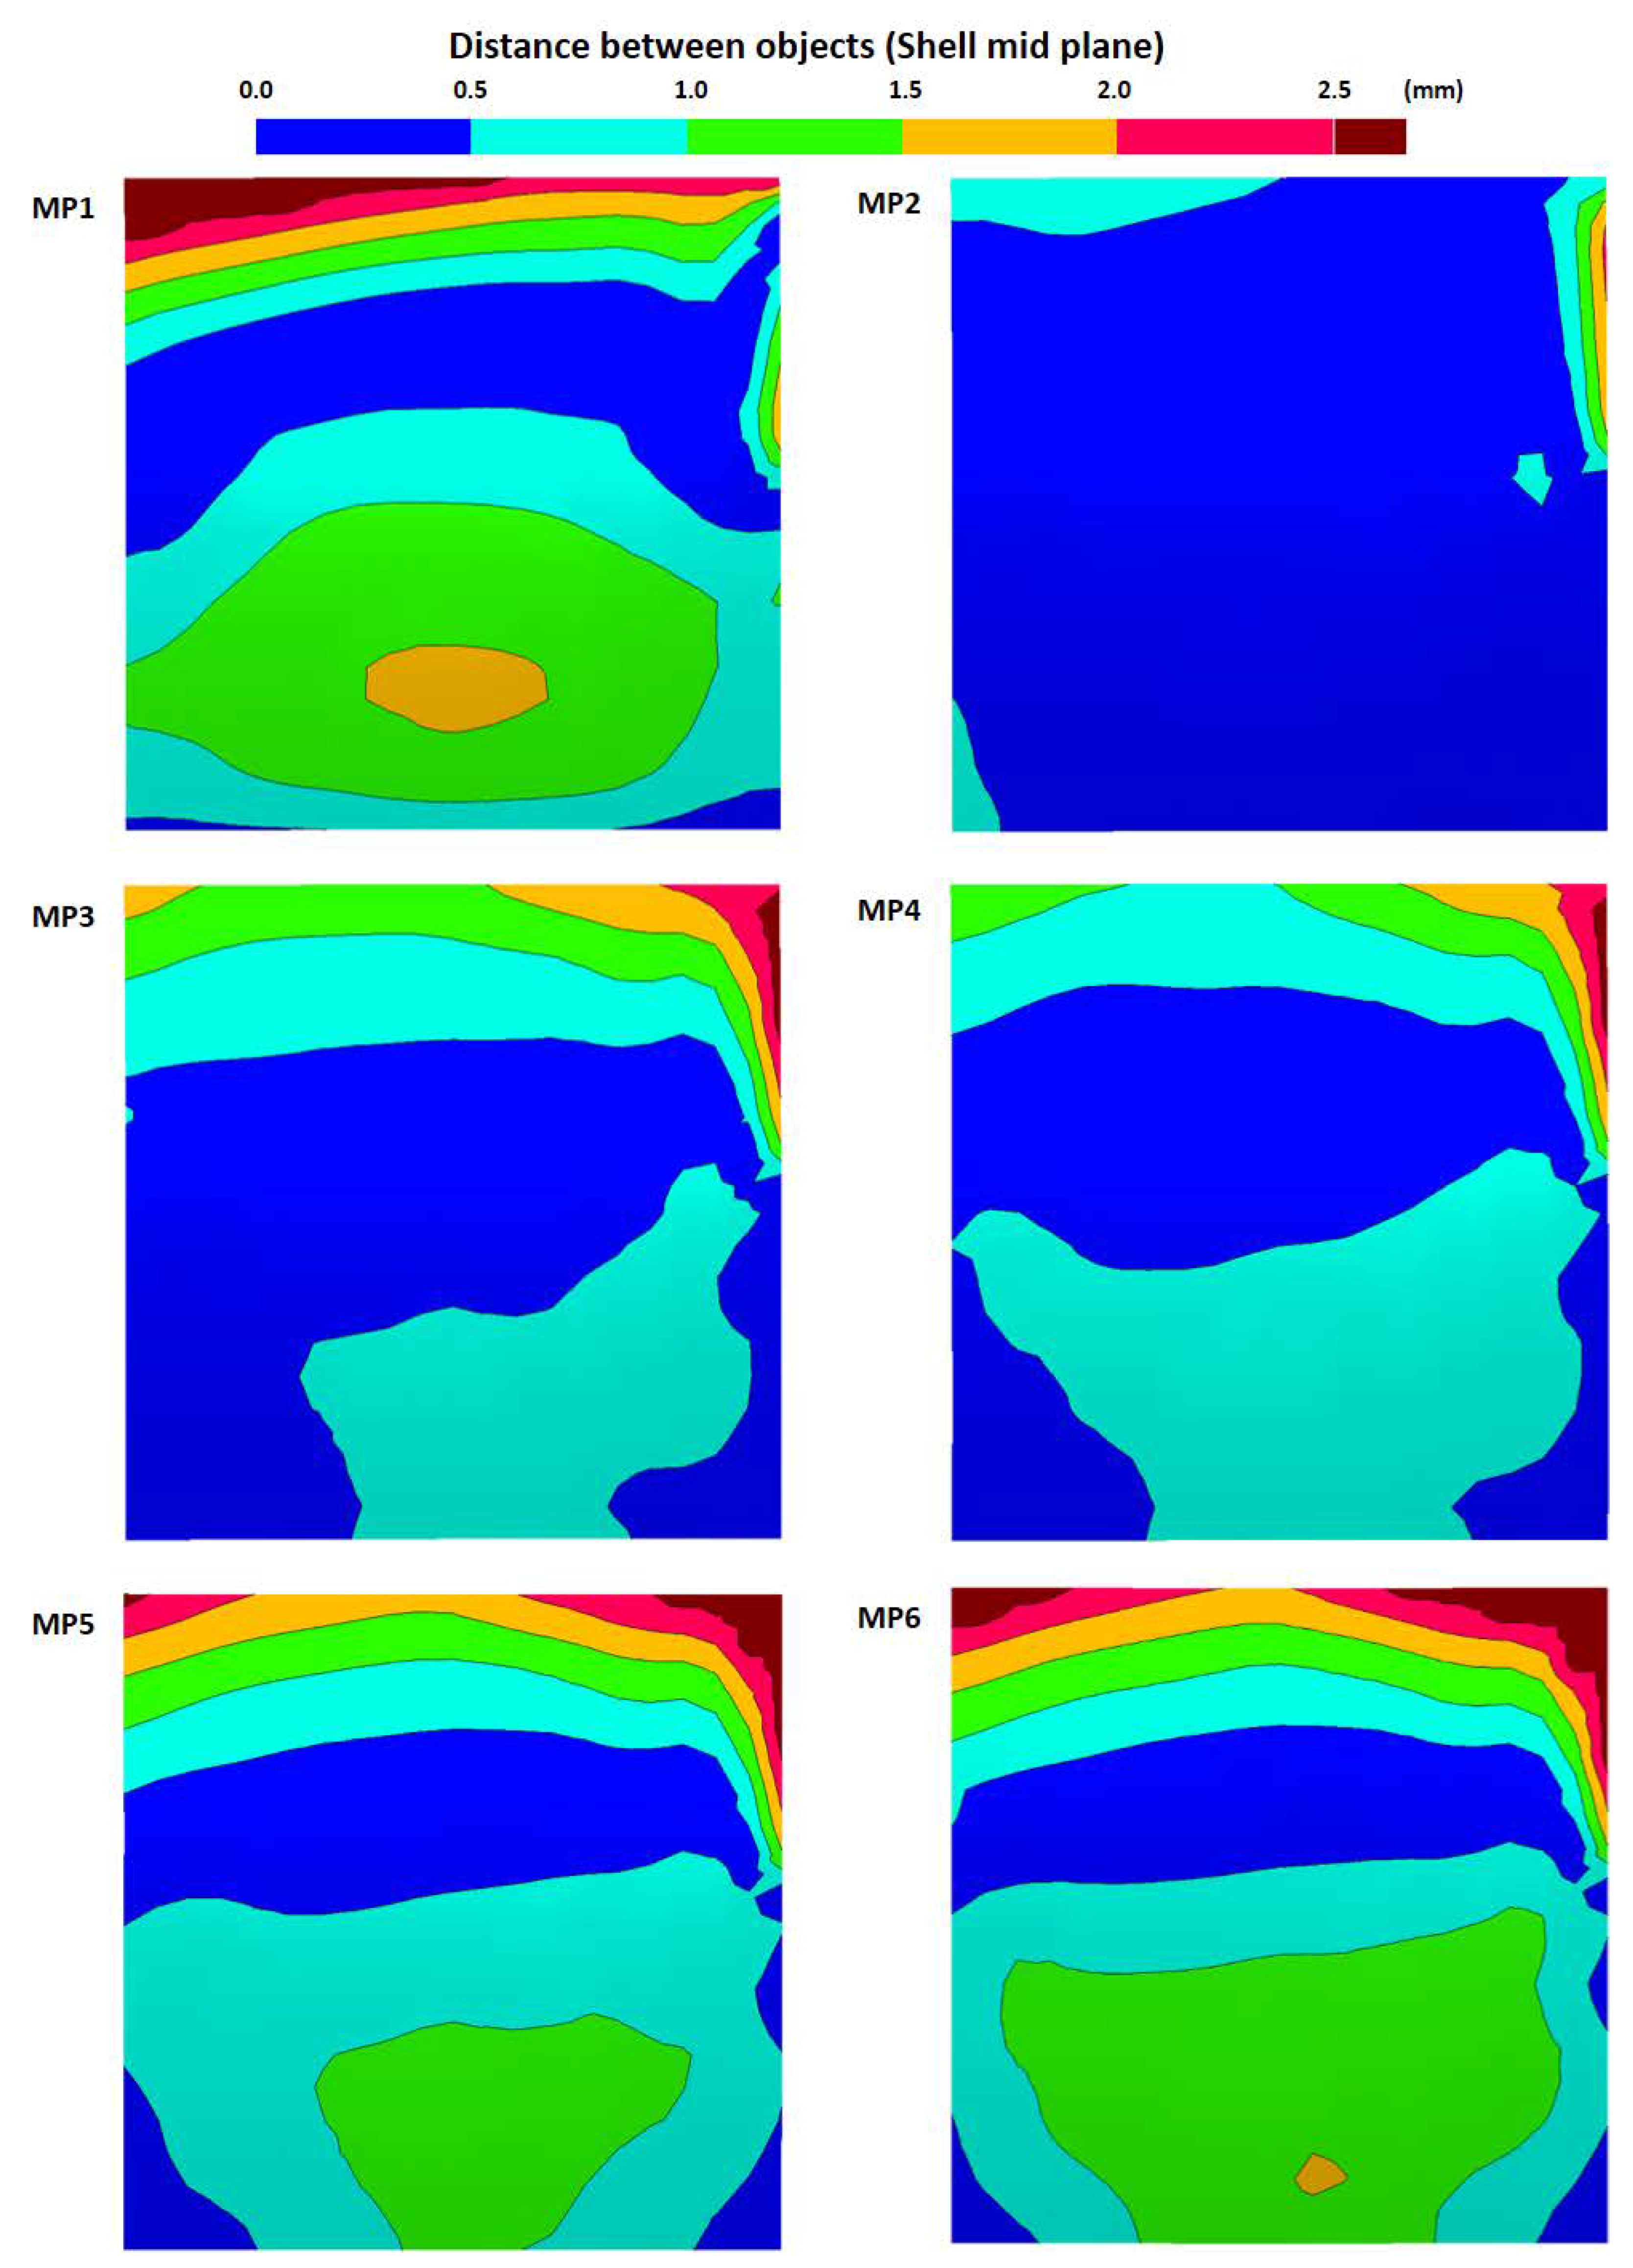
Maximum distance between simulated and real Part (mm)3.52.02.82.63.33.6
Surface with distance between simulated and real Part < 0.5 mm (%)24.492.550.645.425.820.7

