Effect of the Martensitic Transformation on the Stamping Force and Cycle Time of Hot Stamping Parts


1
Metallurgy Research Centre IK4 AZTERLAN, Aliendalde Auzunea 6, 48200 Durango, Spain
2
Department of Mechanical Engineering, University of the Basque Country (UPV/EHU), Plaza Ingeniero Torres Quevedo 1, 48013 Bilbao, Spain
*
Author to whom correspondence should be addressed.
Metals 2018, 8(6), 385; https://doi.org/10.3390/met8060385
Submission received: 26 April 2018
/
Revised: 22 May 2018
/
Accepted: 24 May 2018
/
Published: 26 May 2018
(This article belongs to the Special Issue Microstructure and Mechanical Properties of Structural Metals and Alloys)
Abstract
:Stamping dies perform two functions in the hot stamping process of body-in-white components. Firstly, they form the steel sheet into the desired shape and, secondly, they quench the steel at a cooling rate that leads to hardening by means of the austenite-γ to martensite transformation. This microstructural change implies a volume expansion that should lead to a force peak in the press, which has yet to be detected in industrial practice. In this study, a set of hot stamping laboratory tests were performed on instrumented Al–Si-coated 22MnB5 steel flat formats to analyze the effect of the stamping pressure on the detection of the expected peak. Plotting the sheet temperature and pressure curves against time allowed us to identify and understand the conditions in which the force peak can be detected. These conditions occurred most favorably when the stamping pressure is below 5 MPa. It is thus possible to determine the exact moment at which the complete hardening transformation occurs by monitoring the local pressing force of the tool in areas where the pressure exerted on the metal format is below 5 MPa. This information can be applied to optimize the time needed to open the dies in terms of the complete martensitic transformation.
1. Introduction
The basis of hot stamping technology is a combination of the forming and subsequent quenching of steel sheet formats in a single die stroke as described by Reference [1,2,3]. The cooling sequence during hot stamping is a major technological factor since it drives the final mechanical properties of the parts. The cooling of the steel sheet during hot stamping consists of four consecutive steps. First, the austenitized steel sheet is transferred from the furnace to the press (radiation + convection); second, the die approaches the sheet format until first contact is achieved (radiation + convection + conduction); third, sheet forming is carried out in the press stroke that starts from the first die–sheet contact to the bottom dead center position (BDC) (conduction + convection); and, finally, the press is kept in the stroke’s BDC until the steel sheet undergoes a martensitic transformation (conduction).
The last step takes most of the takt time since it is intended to ensure that quenching is completed during the stamping procedure [4]. During the quenching stage, heat is conducted from the stamped part towards the forming tool across the contact surface between both elements. Both the bulk and contact thermal conductivities and tool cooling systems are of the utmost importance for this step. An improvement in any of the aforementioned four steps leads to higher production rates in the press and inclines the production bottleneck upstream towards the austenitizing furnace. R&D efforts have sought to exploit this process by exploring high conductivity steels [5], applying conformal cooling strategies [6], and studying the interfacial heat transfer coefficient (IHTC) between the sheet and the die [7,8,9,10,11]. The relationship between the IHTC and the nominal contact pressure during the quenching stage has awakened interest in the field due to the force and position control capabilities of the stamping presses. Pressing force is one of the few process variables than can be monitored and controlled straight away in an industrial hot stamping line.
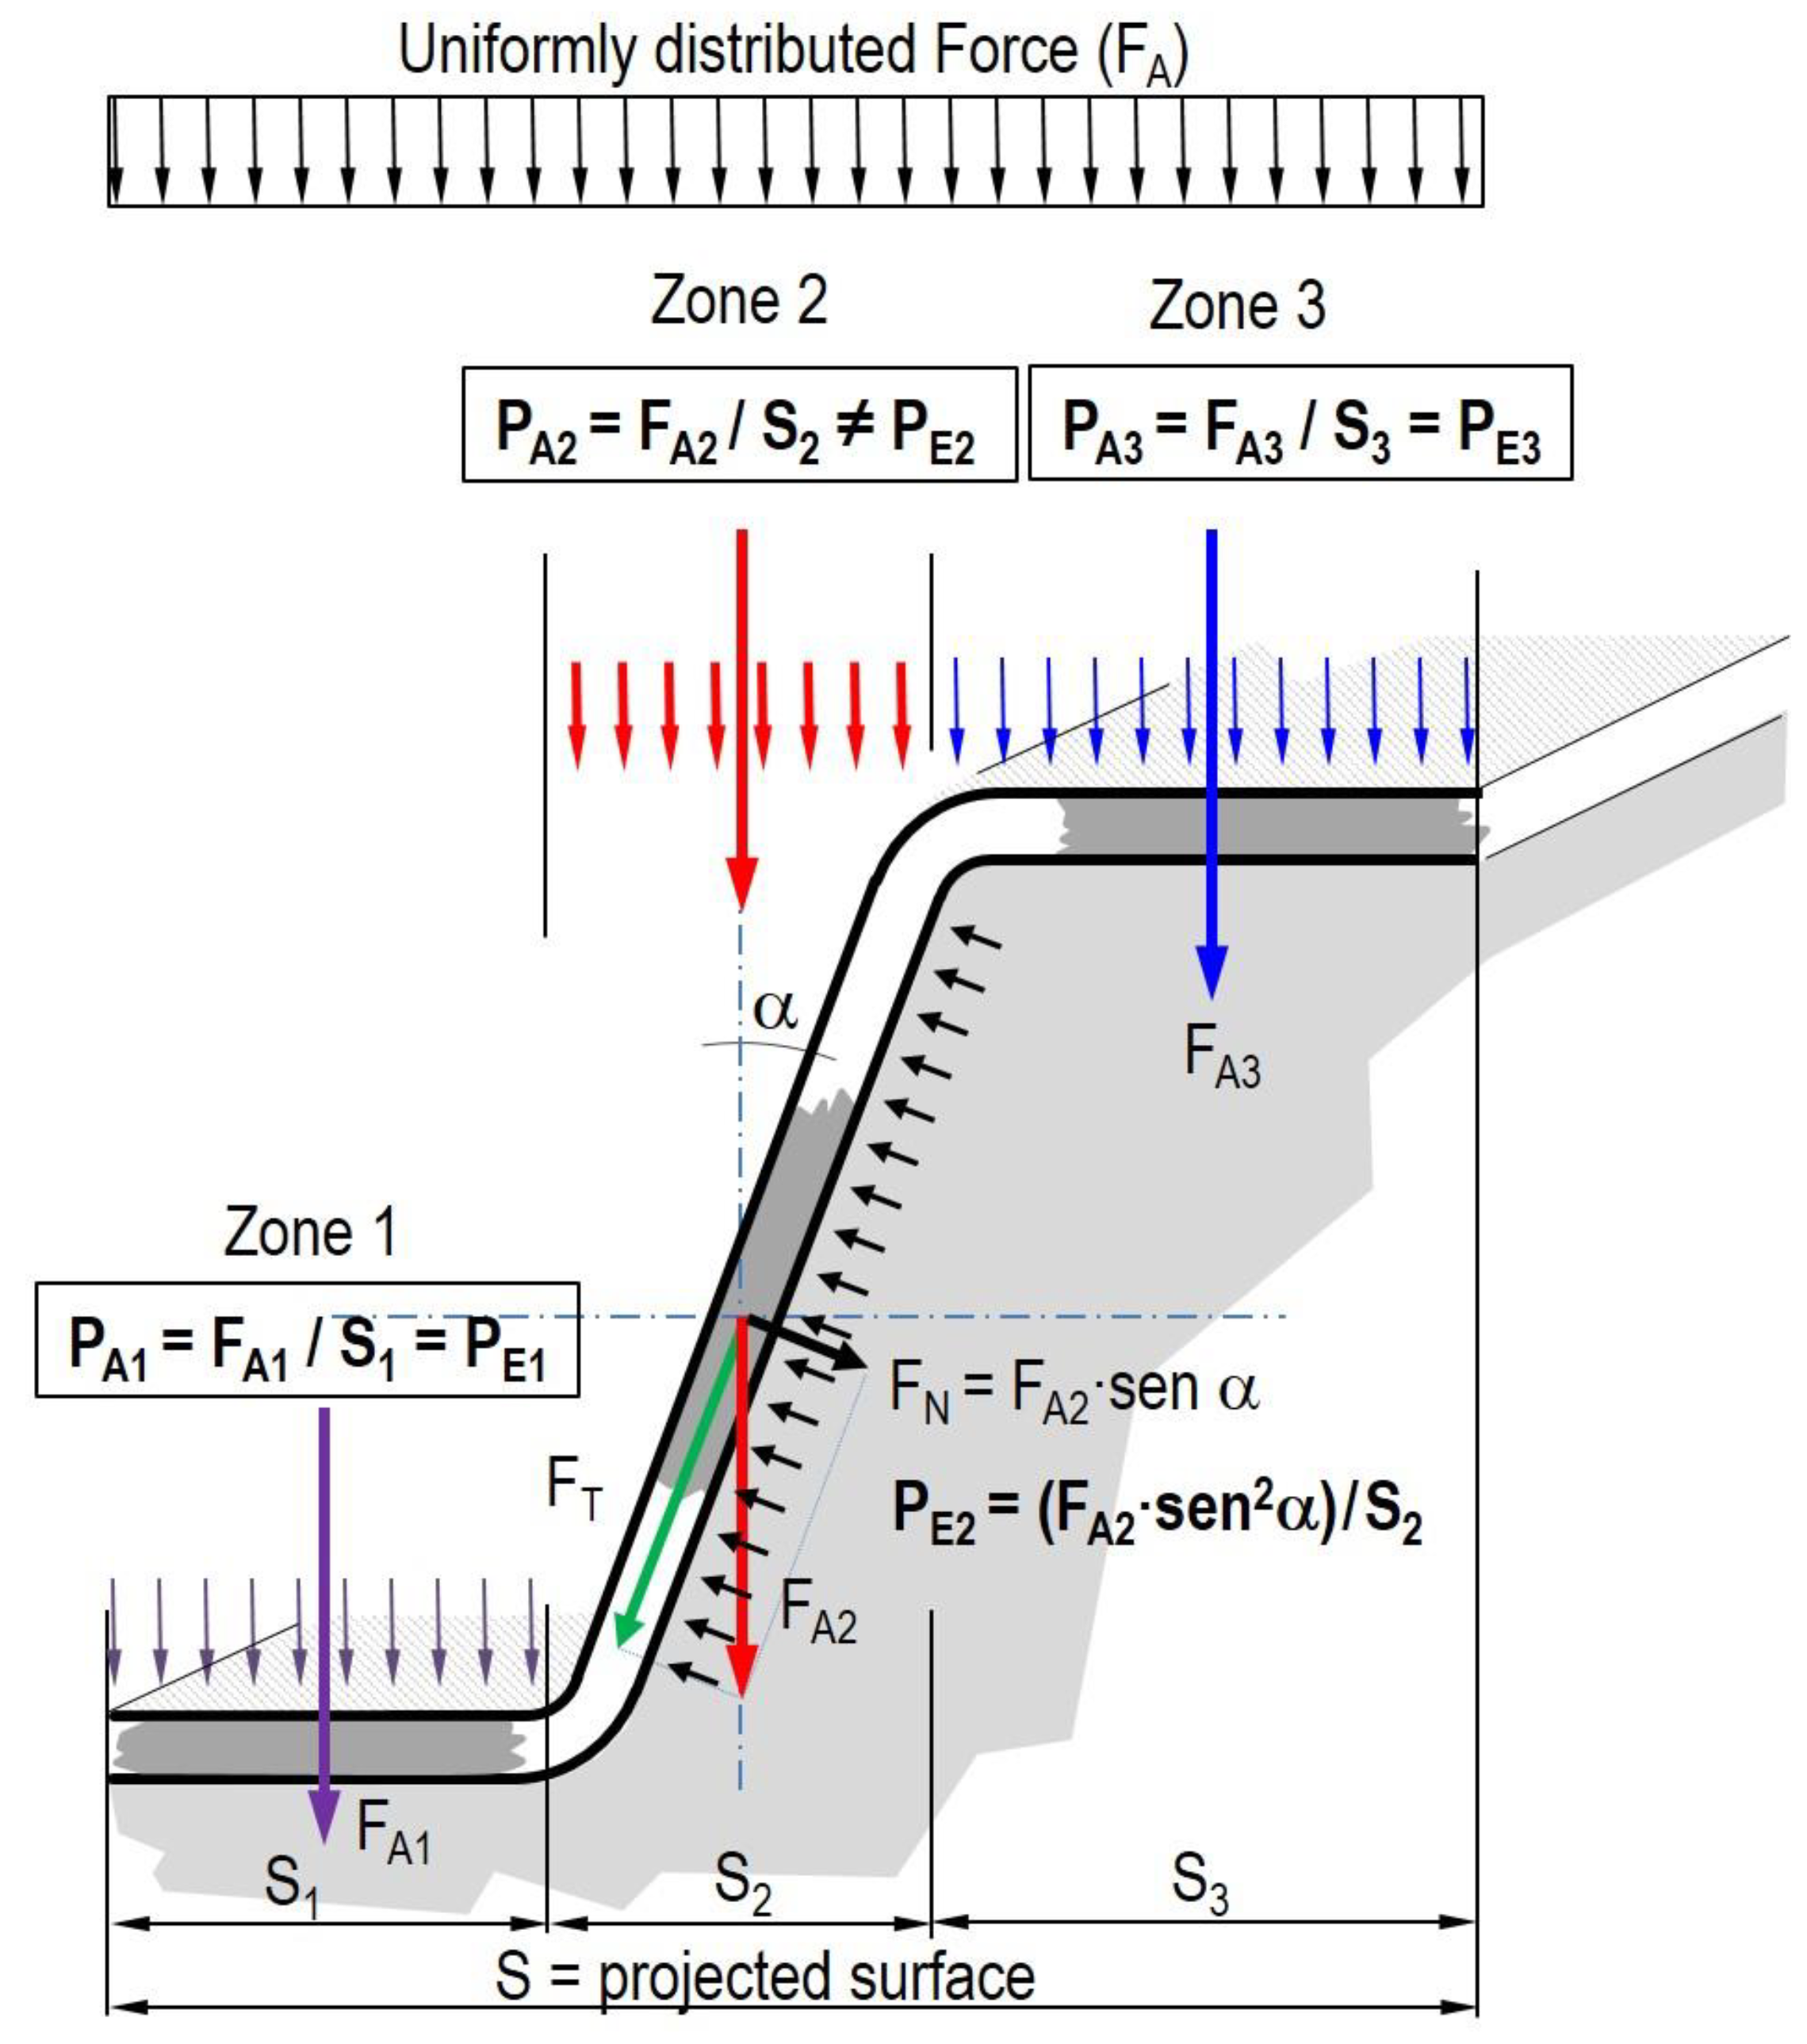
Nevertheless, this force is not distributed uniformly on the part’s surface during the quenching step. In a first approach, the actual local pressure on each tool-sheet contact point is affected by the angle between the part surface and the moving direction of the press (Figure 1). This leads to IHTC differences along the stamped part that increase the cooling rate variability already caused by the tool’s shape, contact sequence, and cooling channel performance. As a result, the martensitic transformation is not performed in unison but sequentially, where areas with the lowest IHTCs are the last to transform. The total quenching time that the press must be kept in the BDC for a total martensitic transformation to be achieved must thus account for the lowest local pressure sites, as they drive the lowest IHTC values.
The quenching of these sites implies a volume expansion related to the austenite-to-martensite transformation. Provided the press position is fixed in the BDC and the sheet fills the clearance between the upper and lower tools, this expansion should theoretically lead to a local pressure peak [12,13]. However, this phenomenon has seldom been reported in the literature by authors seeking to experimentally reproduce hot stamping conditions [8]. The thermography is actually used in the hot stamping industry to detect cooling issues in the part and/or tool normally caused by cooling channel clogging, leakage, water supply shortage, etc. [11], and in other applications [14]. This technique is useful to understand the process without contact with the material. This work explores the simultaneous evolution of the actual pressure and sheet temperature in a range of nominal stamping pressures from 12.5 to 2.5 MPa to identify the conditions under which the martensite expansion can be properly measured. The detection of the force caused by quenching expansion has direct applications in terms of defining the minimum achievable takt time for a given set of pressing setups and tool designs.
The interest in controlling this cycle time is evidenced by the modeling efforts presented in the literature [15,16]. Previous approaches to this issue have been based both on numerical modelling of the process or hardness/microstructure surveys after a part has been extracted from the press [17], and searching for online dwell time optimization methods. Monitoring of the martensitic expansion force on the other hand, leads to a real-time monitoring of the quenching completion, the simultaneousness of which takes into consideration the process of obtaining measurements and decision making.
2. Materials and Methods
The sheet steel material employed for our experimental work was the Al–Si pre-coated quenchable 22MnB5 steel, commonly known under the commercial name USIBOR 1500P® (ArcelorMittal, Luxembourg City, Luxembourg), whose chemical composition is given in Table 1.
The dimensions of the samples were 80 × 90 mm, with a thickness of 3 mm. In each sample, a 1 mm diameter hole was machined by electrical discharge machining, right in the middle of the thickness, to a 30 mm depth (Figure 2a). Inside the hole, an AISI 316L sheathed type K thermocouple of 1 mm diameter was fixed (Figure 2b).
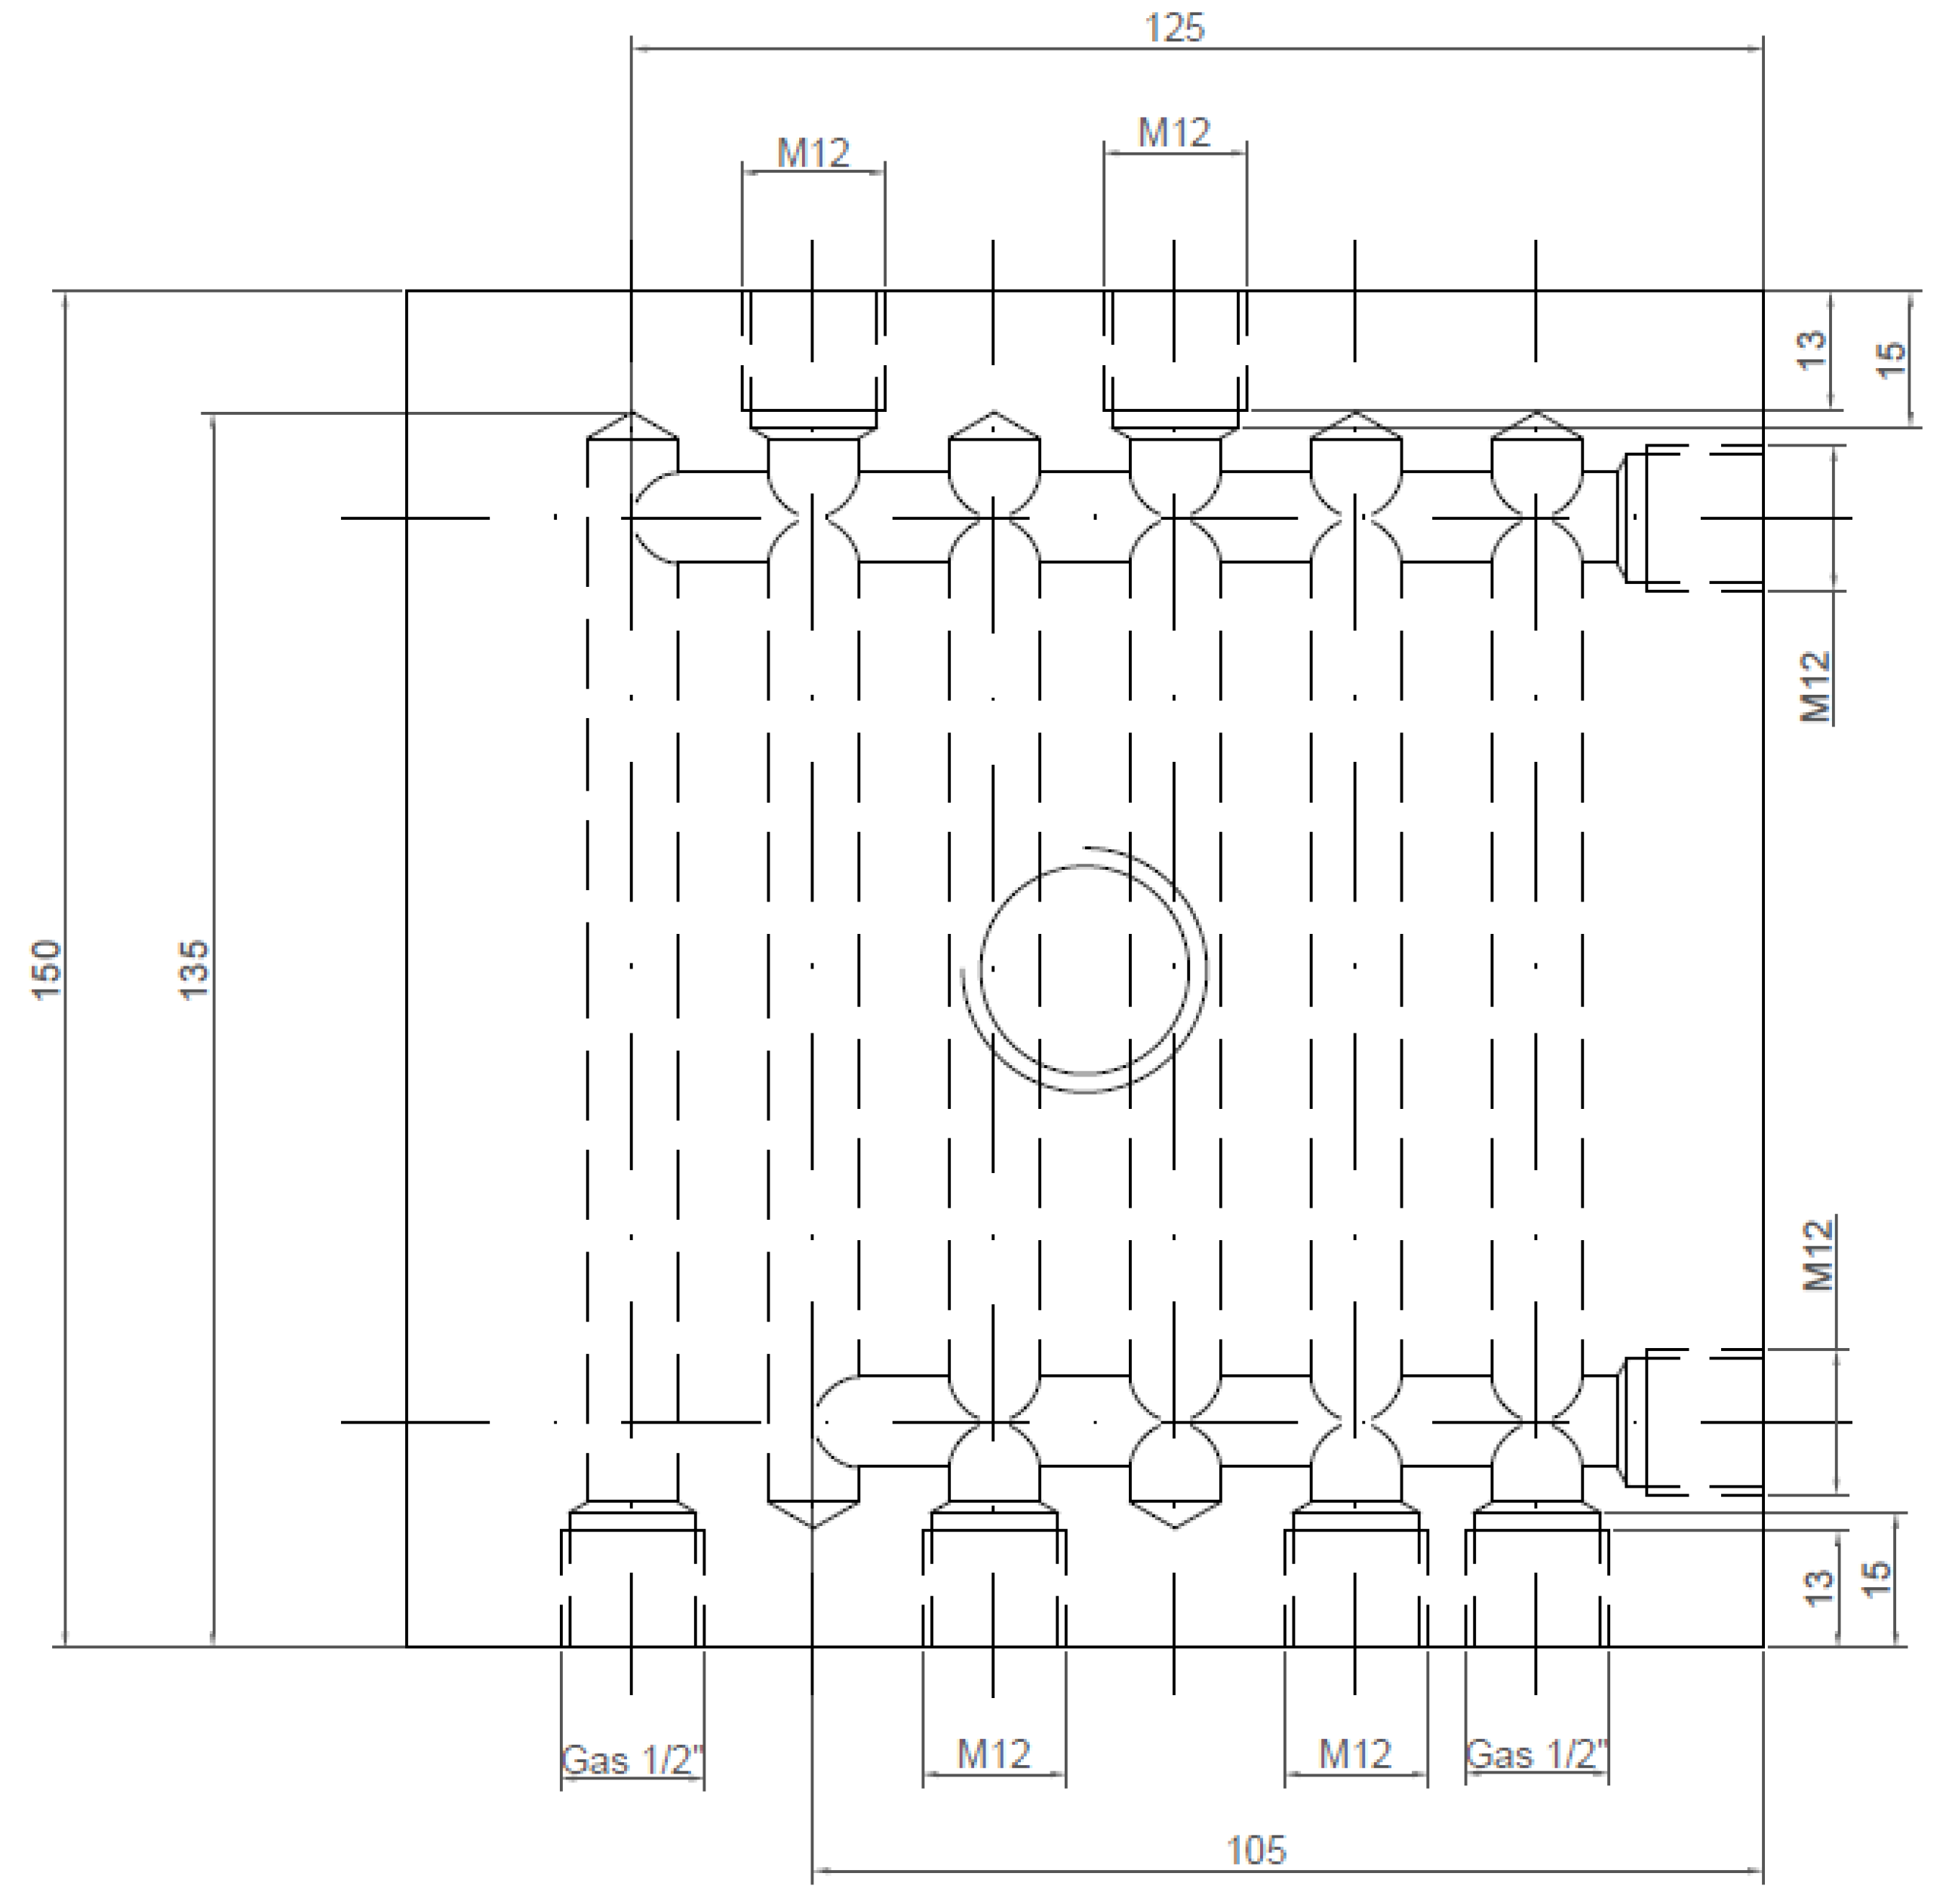
A flat tool with an active surface of 150 × 150 mm was used. The tool was manufactured in ductile iron grade GJS-700-2 with a hardness of 275 HB. The tool design is shown in Figure 3 and Figure 4. The cooling channels in both halves of the tool were fabricated with a nominal diameter of 10 mm. The cooling water for the tests was taken from the line at a temperature of 12.5 °C and flow rate of 20 L/min.
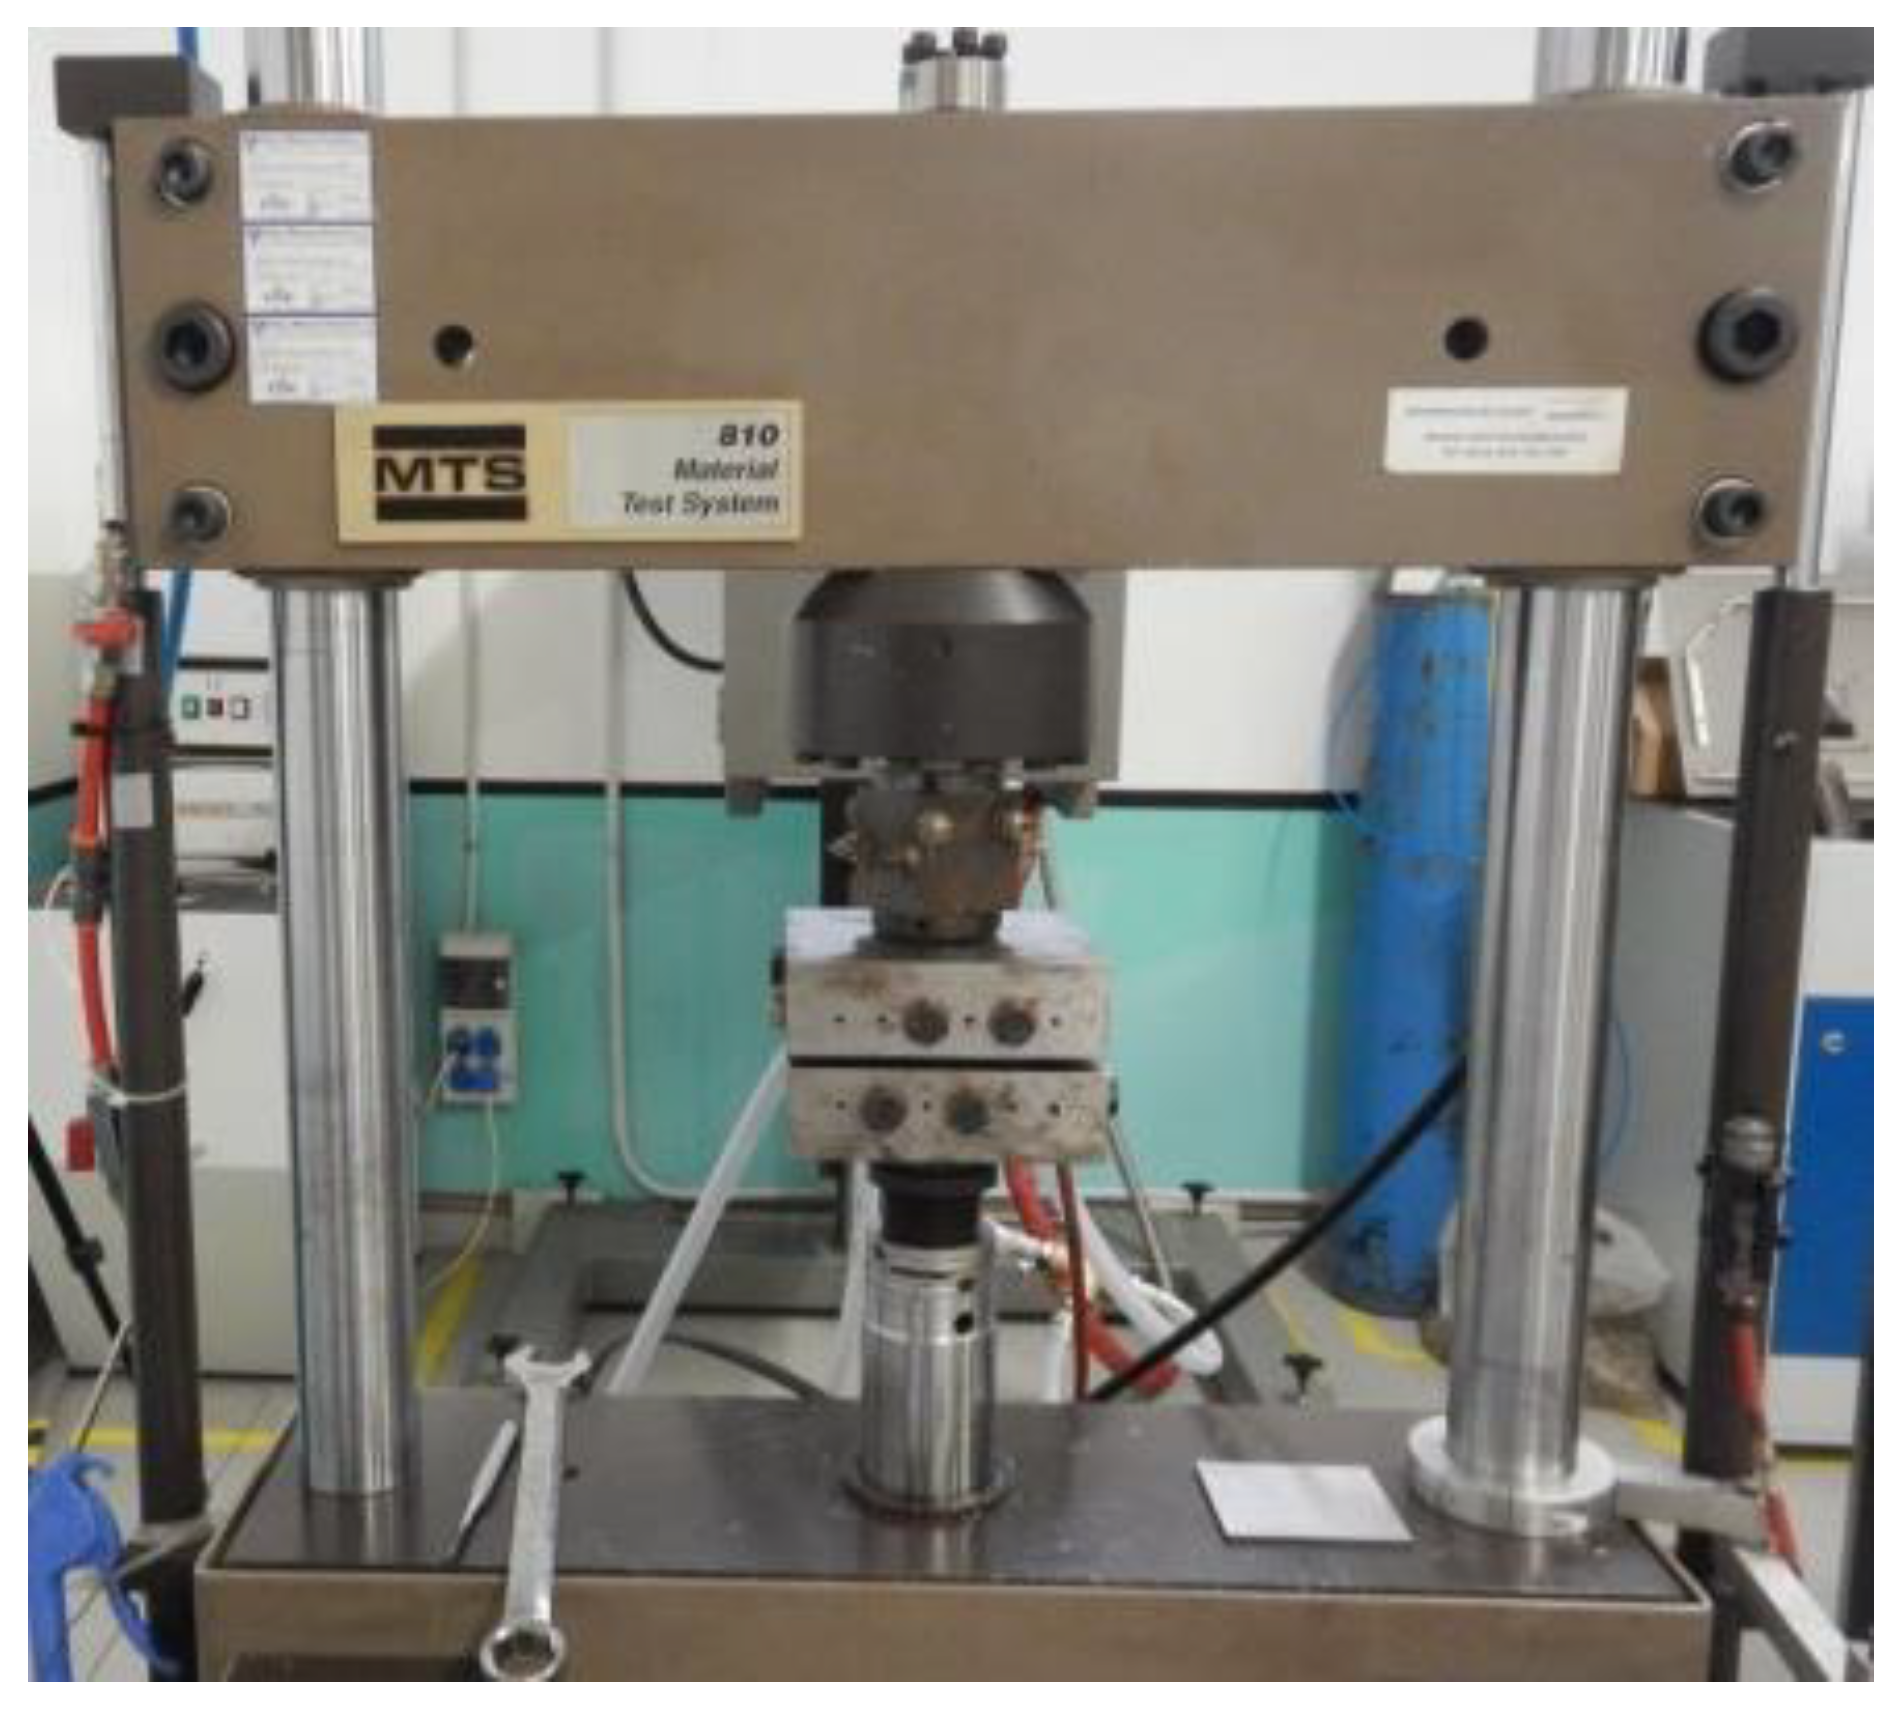
The tests were carried out on a MTS 810 hydraulic press (Material Testing Systems, Eden Prairie, MN, USA) that was programed in a closed-loop pressure control until the working pressure was achieved, and then immediately shifted to a blockage position for 10 s before the load was released.
Before carrying out the tests, the pressure homogeneity of the setup was verified by employing a Pressurex-Micro® (Sensor Products Inc., Madison, NJ, USA) SPF-ER indication film. This film reveals a contact pressure map between the two surfaces by employing the interaction between the two foils of the film that leads to different degrees of magenta coloring depending on the pressure in each contact spot, see Reference [18]. Subsequently, using the Topaq® imaging system (Sensor Products Inc., Madison, NJ, USA), the magenta color map was translated to a high resolution, full-color representation of the pressure distribution. A 0.5 mm thickness Pressurex® (Sensor Products Inc., Madison, NJ, USA) film was employed in this study.
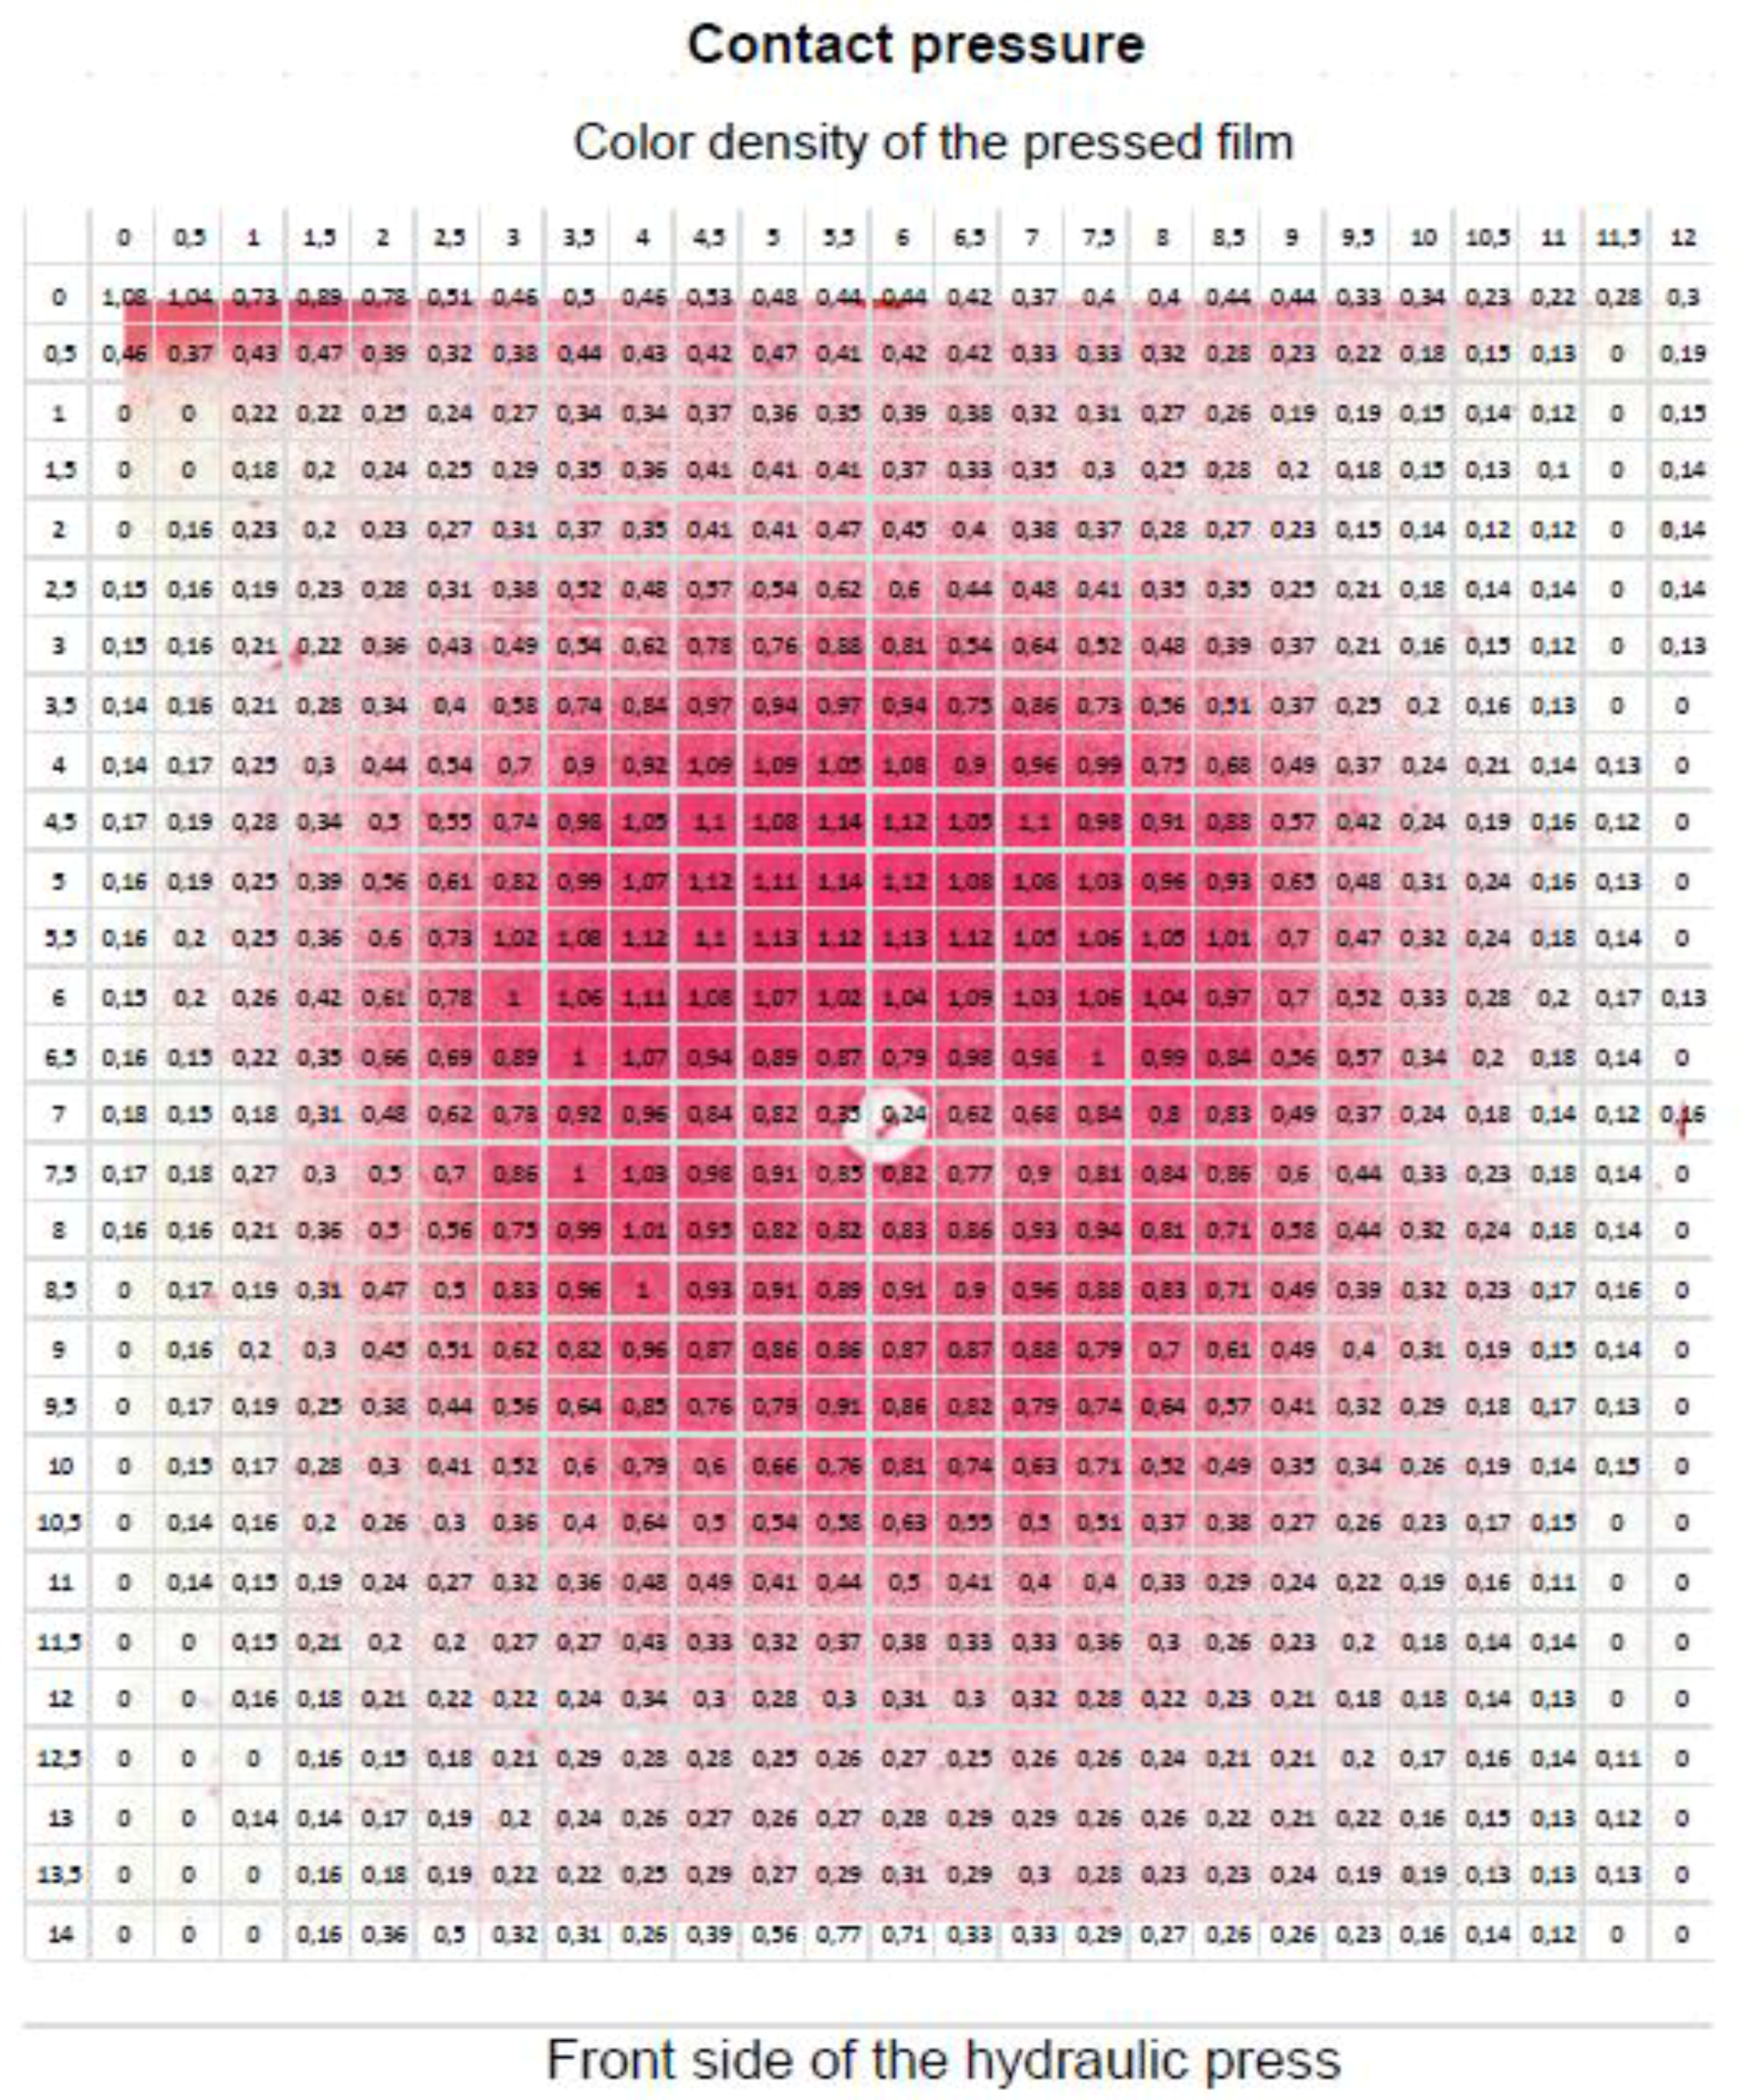
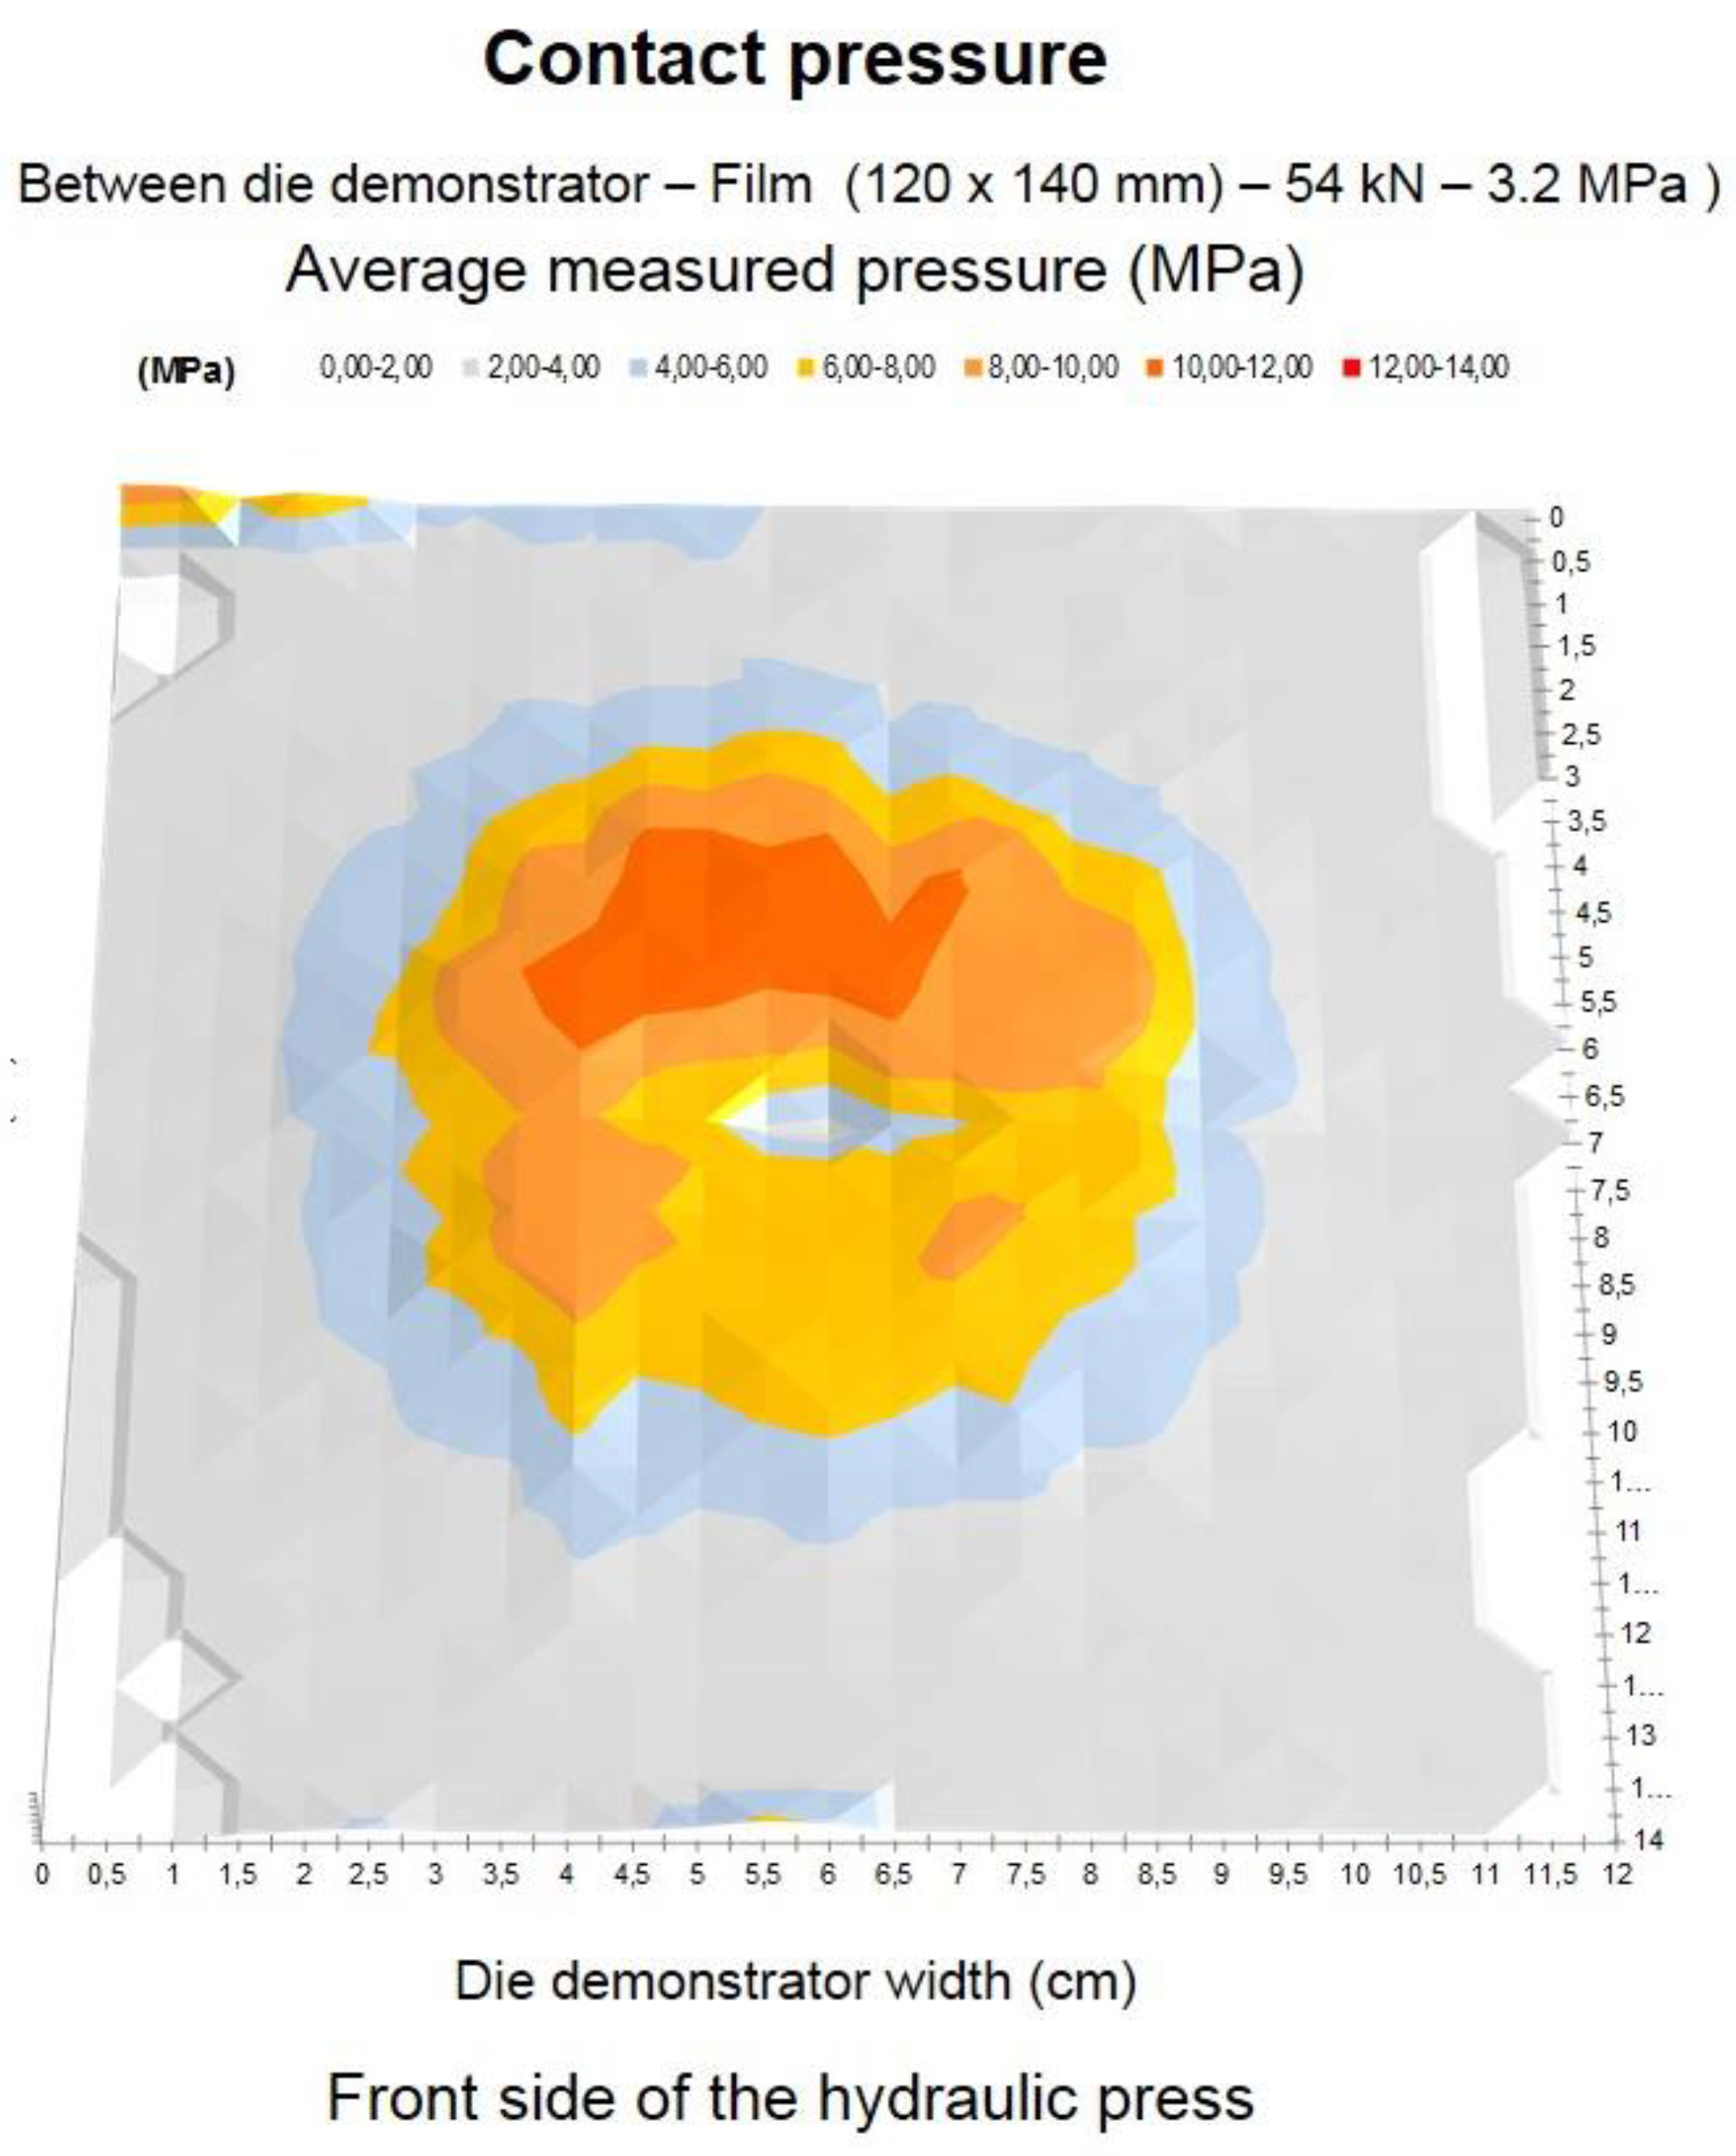
Initially, the alignment of the tool and the press was verified using the pressure sensing films. The film was placed directly on the bottom of the tool and several loads were checked. Figure 5 shows the magenta-colored profile for 54 kN. Once the indication film was marked with the Topaq® image system (Sensor Products Inc., Madison, NJ, USA) and measurements of the color density were performed, the pressure was calculated and plotted in a 3D image (Figure 6). This way it was verified that the assembly was set to contact primarily in the center of the tool, where the samples were placed during test.
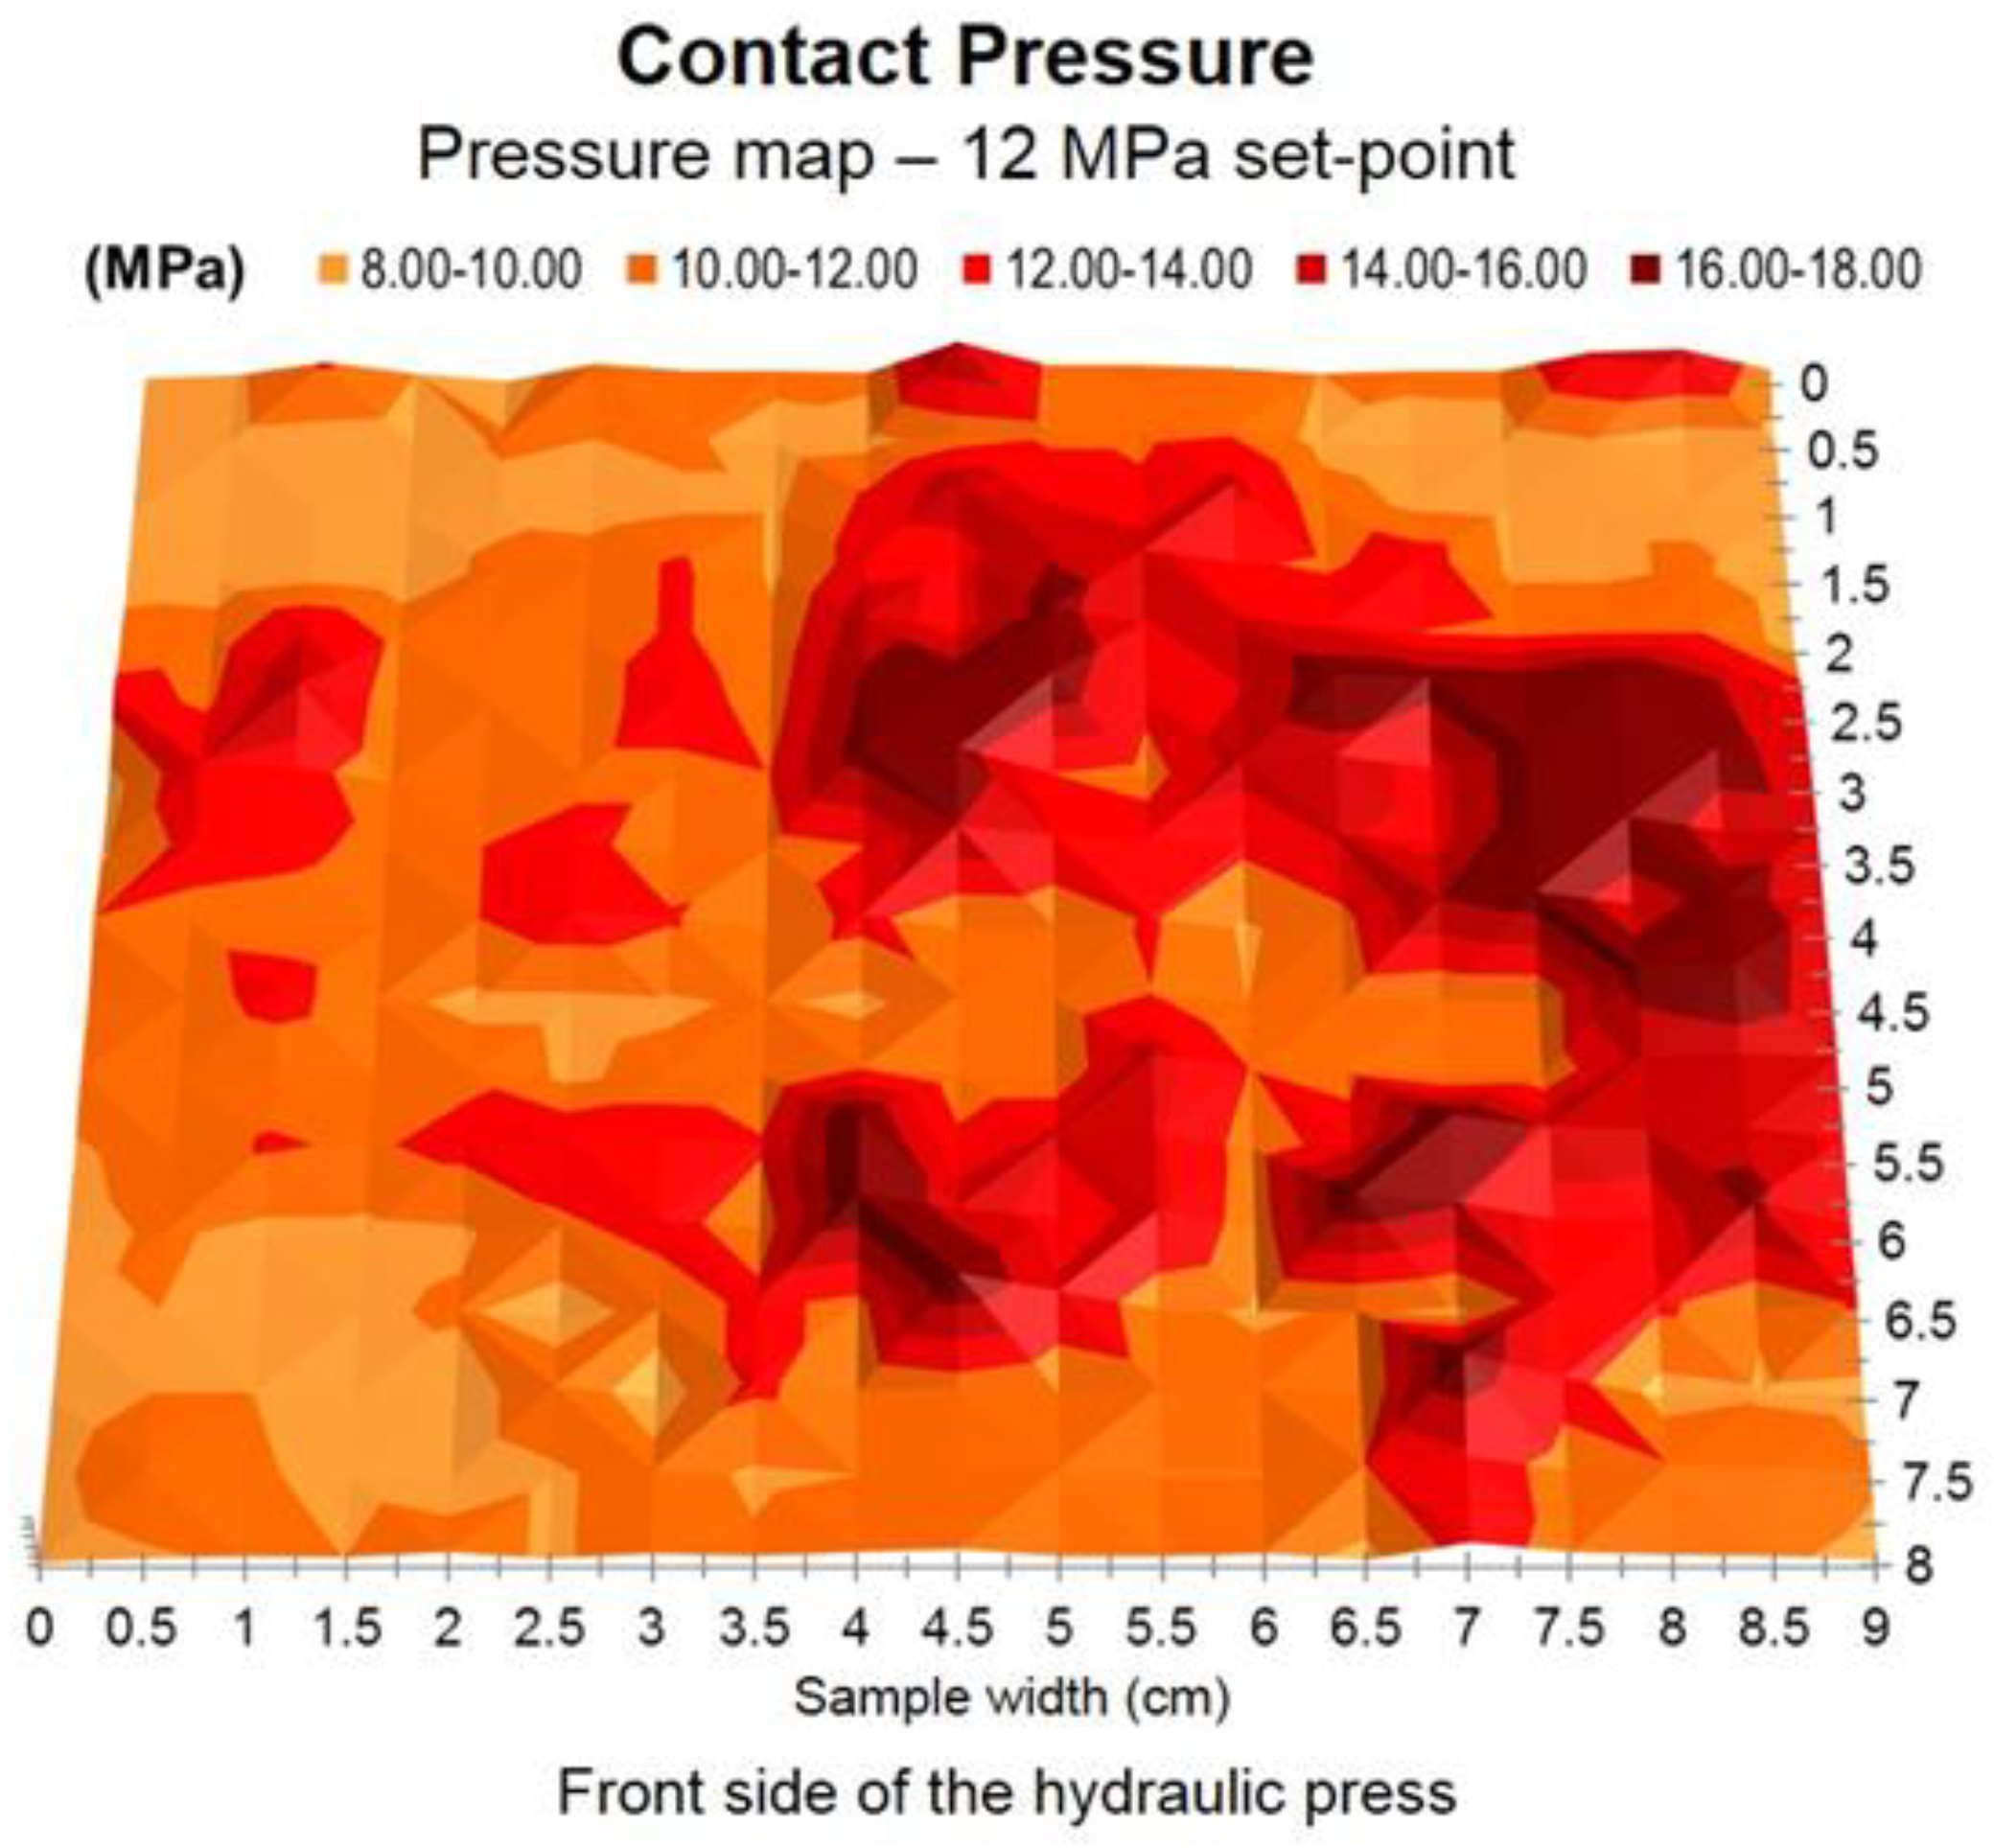
The same test was repeated using USIBOR 1500P® (ArcelorMittal, Luxembourg City, Luxembourg) sheet blanks of 80 × 90 mm by placing the film between the sheet and both the upper and lower tools. Figure 7 shows the result for an applied pressure force of 85 kN (11.8 MPa pressure). It is relevant that, despite the test being performed in a flat configuration, there are significant pressure gradients in the samples. A nominal pressure of 12 MPa turns out to be translated in a pressure map of 12 ± 4 MPa. The pressure force distribution analyses indicate that the press applied higher pressure on the right side than on the front, back, and left side. So, it is clear that despite industrial process parameters being taken on average pressures values, the actual pressure distributions are randomly distributed around the nominal value.
The austenitizing of the samples for the press hardening was performed without a protective atmosphere in an electric resistance furnace (LAC LH 39/13) whose dimensions were 0.31 m × 0.31 m × 0.31 m (width × length × height). Samples were heated one by one. Each sample was heated for approximately 300 s to an austenitizing temperature of 900 °C and they were extracted from the furnace and placed inside the tooling in less than 4 s. The austenitizing temperature and time were selected in order to reproduce industrial hot stamping conditions. The temperature setpoint of 900 °C was selected to ensure full austenitization of the 22MnB5 while avoiding grain growth. Furthermore, the 300 s heating time not only ensured austenitization but also Al–Si coating enrichment in Fe, avoiding liquid aluminum dropping (eutectic Al–Si melting point is at 577 °C in the absence of Fe).
Press hardening tests were then conducted at the corresponding pressure set-points (2.5, 5, 7.5, 10, and 12.5 MPa).
After the pressing tests, and with the aim of ensuring that press hardening was carried out correctly during the tests, all samples were metallurgically analyzed by means of metallographic inspections and hardness measurements. Three HP (High Pressure), T (Thermocouple), and LP (Low Pressure) zones in the sample were checked for each specimen, as shown in Figure 8. The hardness variations observed in the three zones were insignificant.
The hardness was measured in a cross section of the Low Pressure zone of each sample via Vickers hardness control measurements, in accordance with EN ISO 6507-1: 2006, on the core (half thickness) and periphery (0.3 mm from the surface) of the cross section of the metallographic specimens. The microstructures were analyzed using a Leica MEF4 optical microscope (Leica Microsystems, Wetzlar, Germany) and etching of the metallographic samples was carried out with Nital 4.
3. Results
The recorded pressure–temperature–time curves are presented below, starting from the maximum employed pressure. Figure 9 shows the 12.5 MPa set-point curves. For this case, the pressure graph is smooth without any overshot. The hardening was successful, as shown by the microstructure in Figure 10 and corroborated by the HV10 hardness measurements in Table 2.
Thus, most of the martensitic transformation in the sample must have occurred while the press was still in closed-loop pressure control. Some parts of the sheet may have been undergoing residual martensitic transformation, as indicated by the thermocouple records, which reached the martensite start (Ms) temperature about a second after the pressure signal arrived to the set-point.
As the pressure set-point was reduced to 10 MPa, martensitic expansion was detected as an overshot in the pressure curve (Figure 11). The start of the overshot was 0.1 s after the target pressure was reached, and the pressure ramp-up lasted 2 s. In agreement with the observations in Figure 9, the Ms in the thermocouple location was reached about a second later than the overshot, indicating that the hardening did not proceed in a synchronized manner, but occurred over a period of seconds.
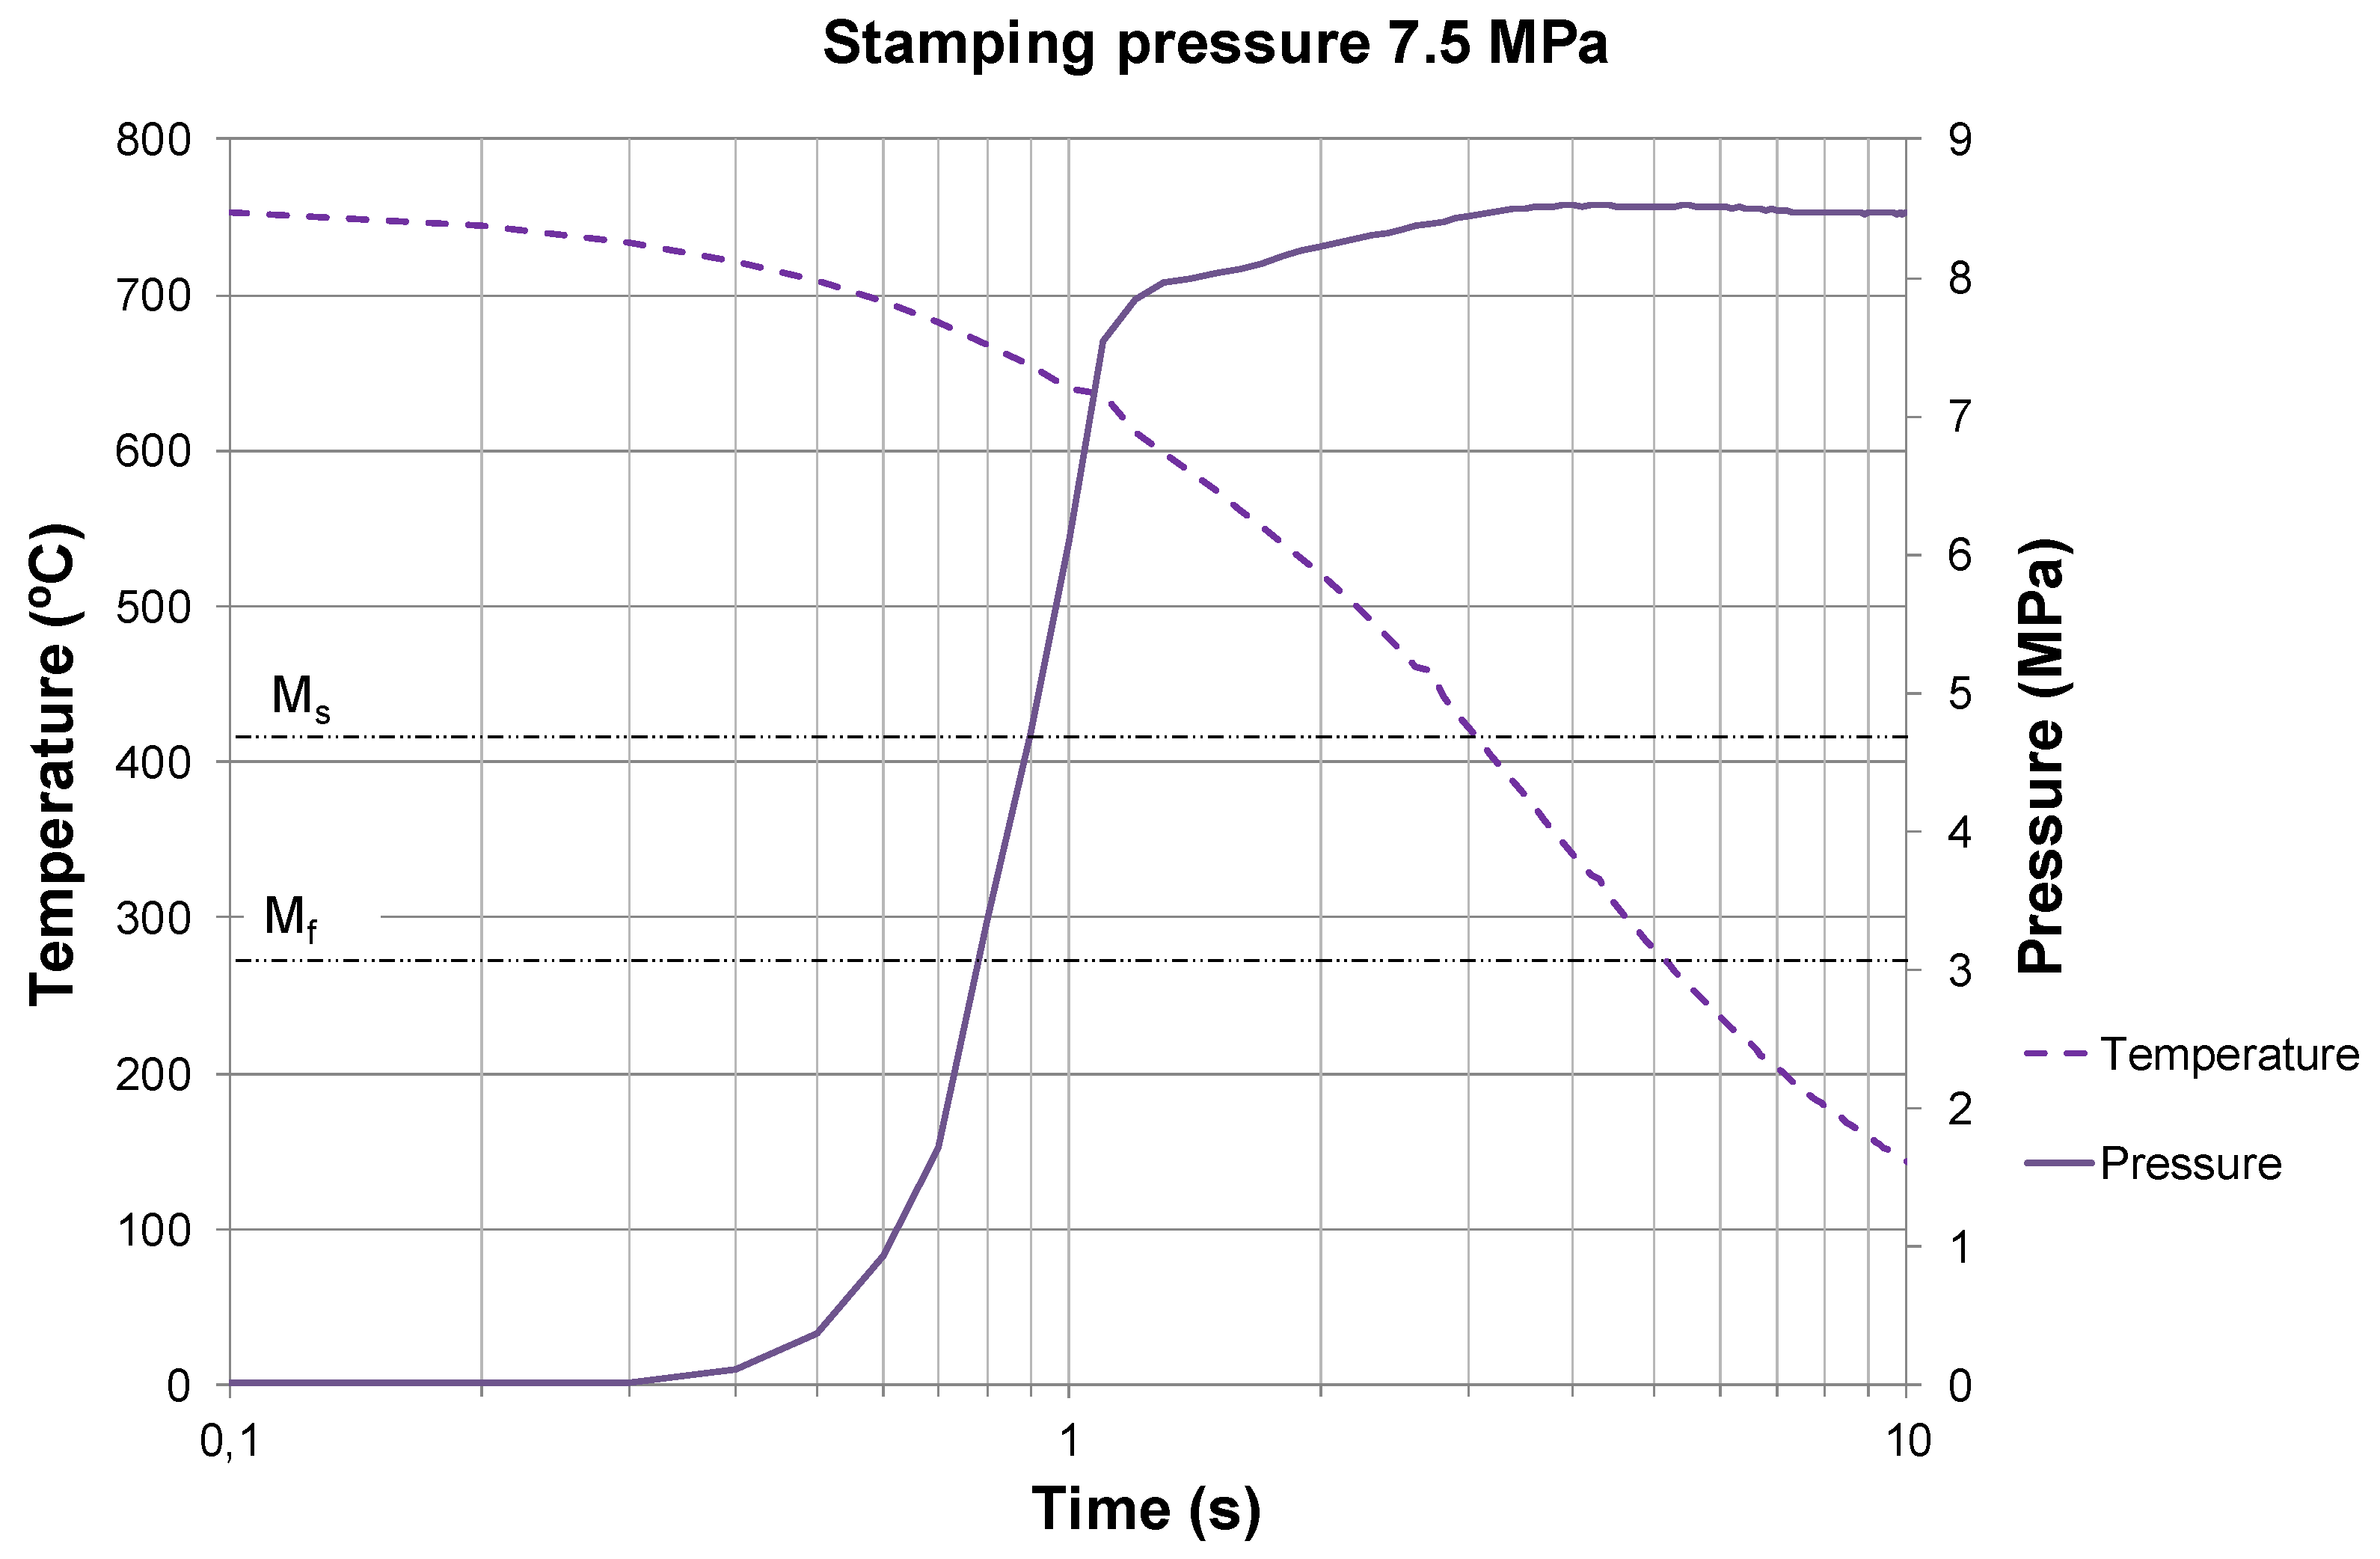
Overshot becomes easier to identify as the pressure set-point decreases. The lower the pressure, the later the start of the overshot and the longer its duration. For a 7.5 MPa stamping pressure, the start of the martensitic expansion signal was delayed by 0.2 s after the pressure set-point was reached, which lasted 2.2 s (Figure 12).
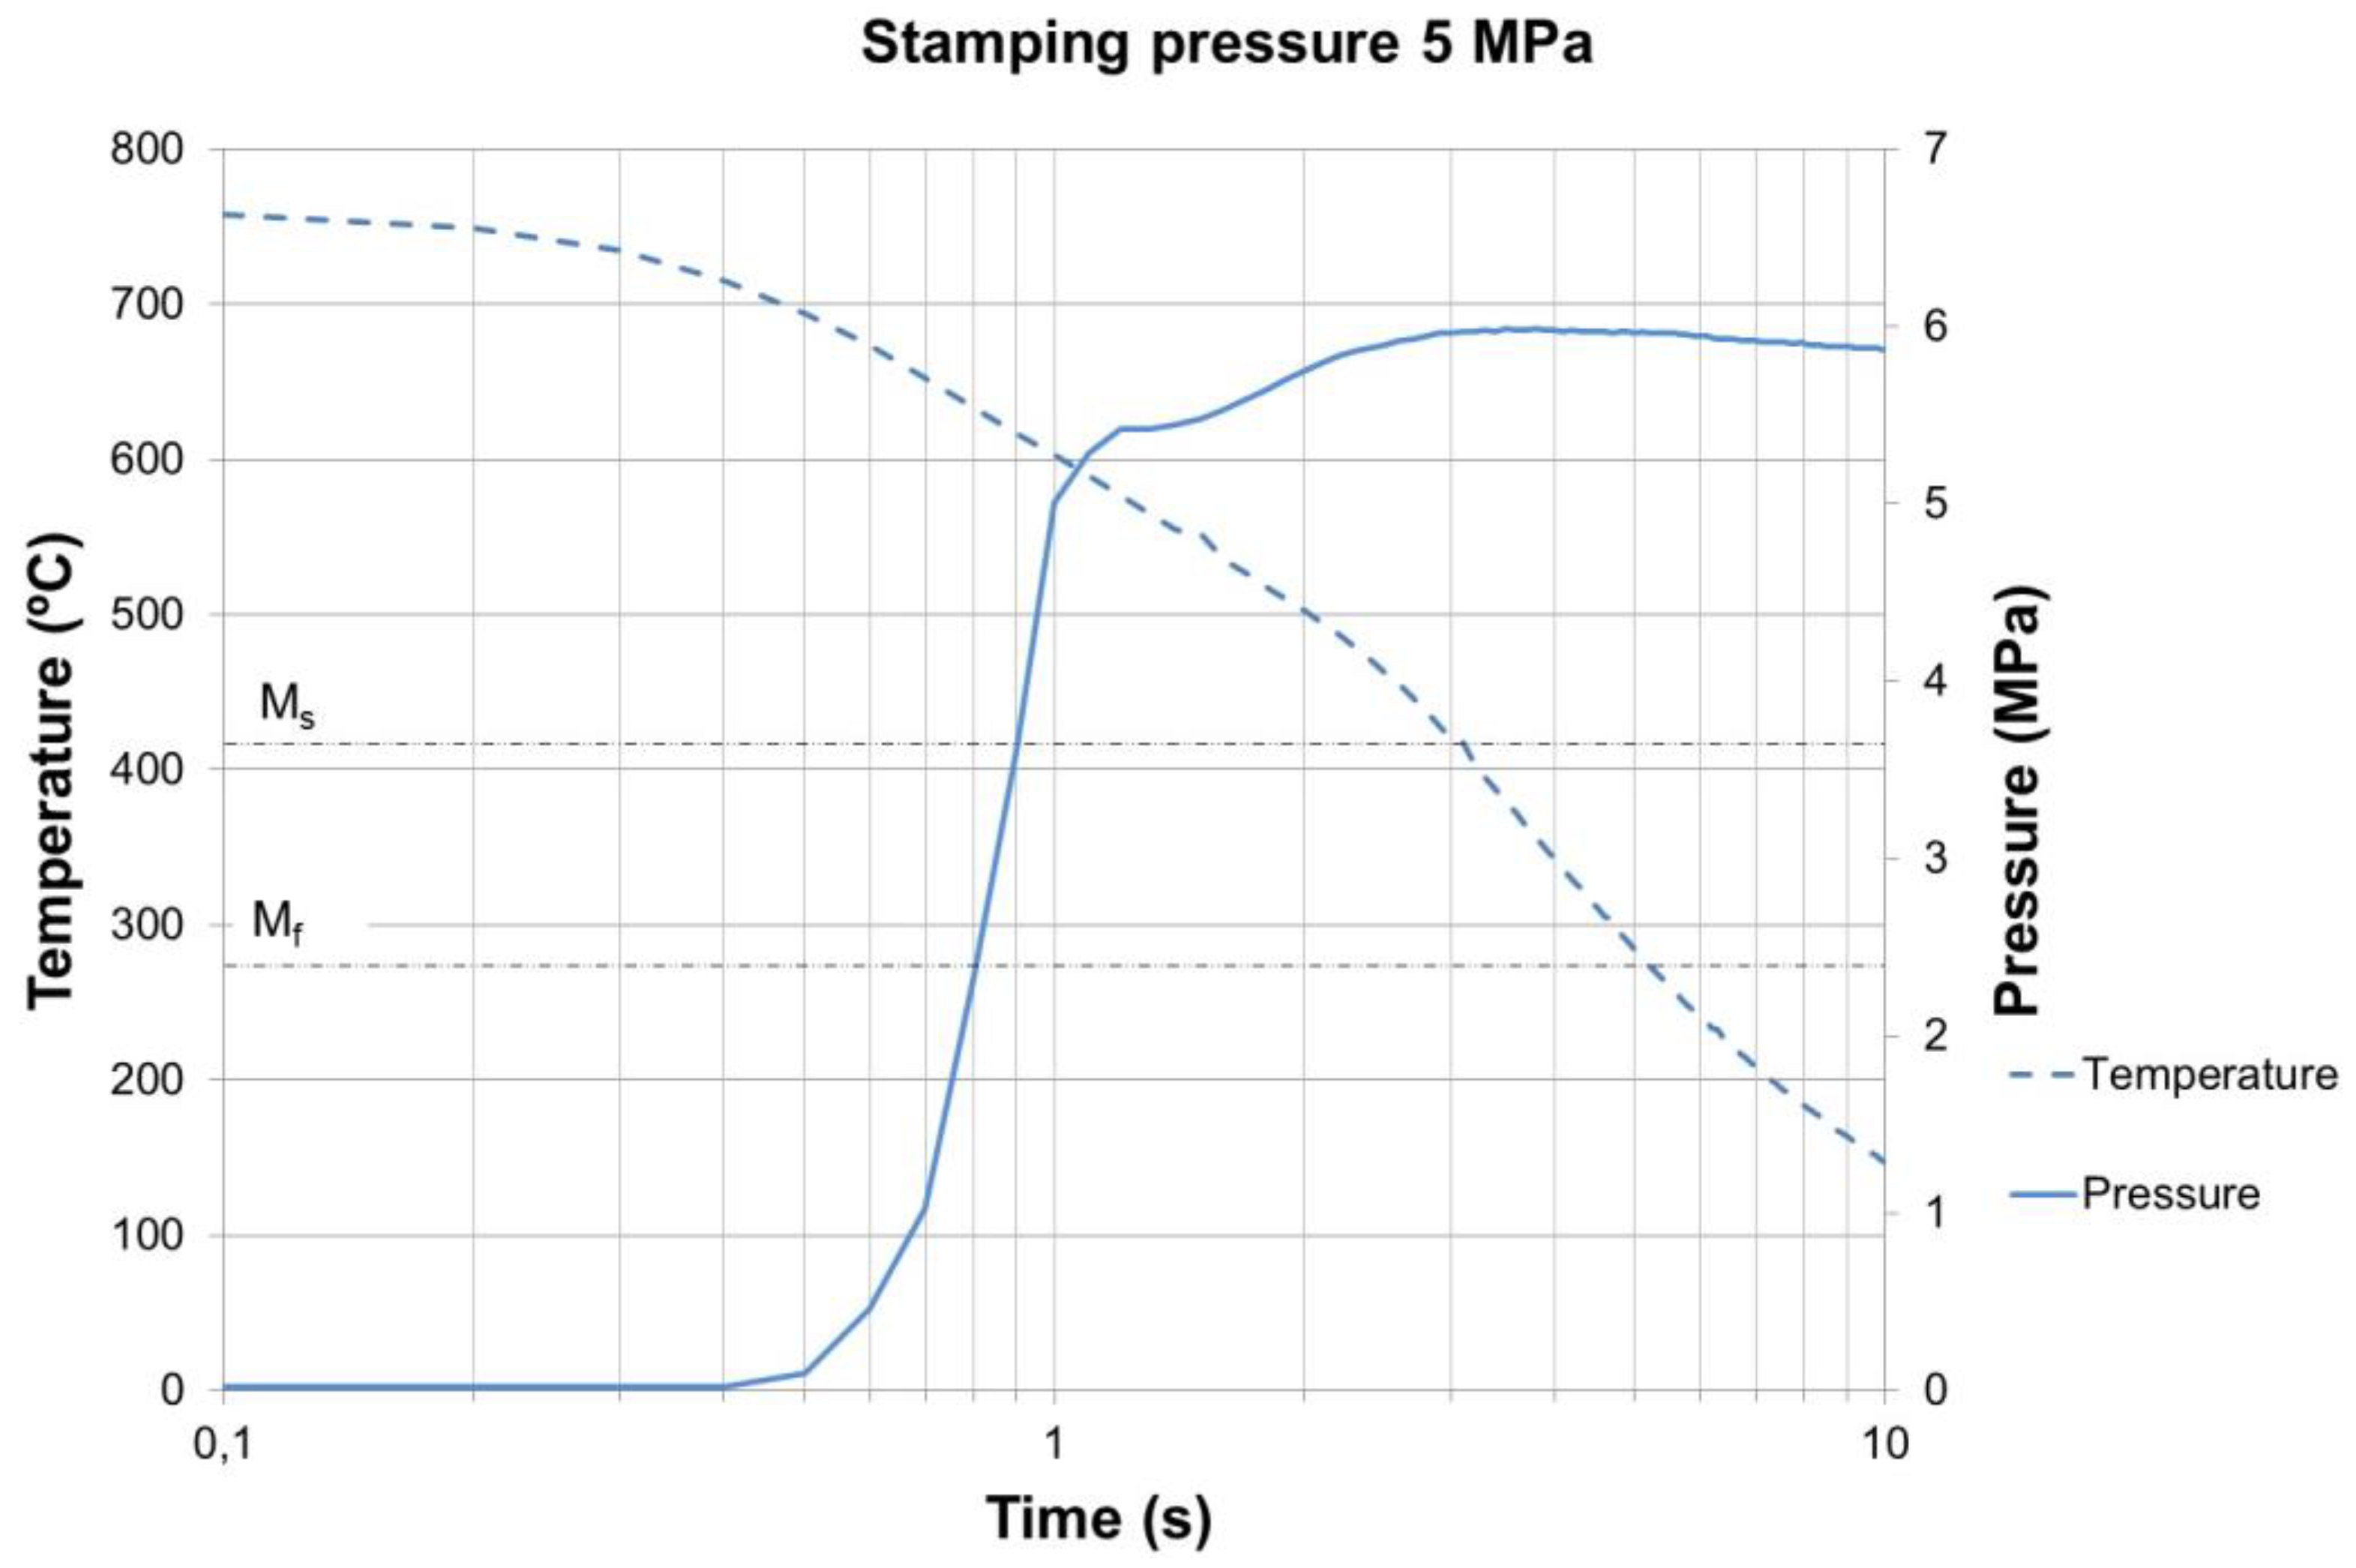
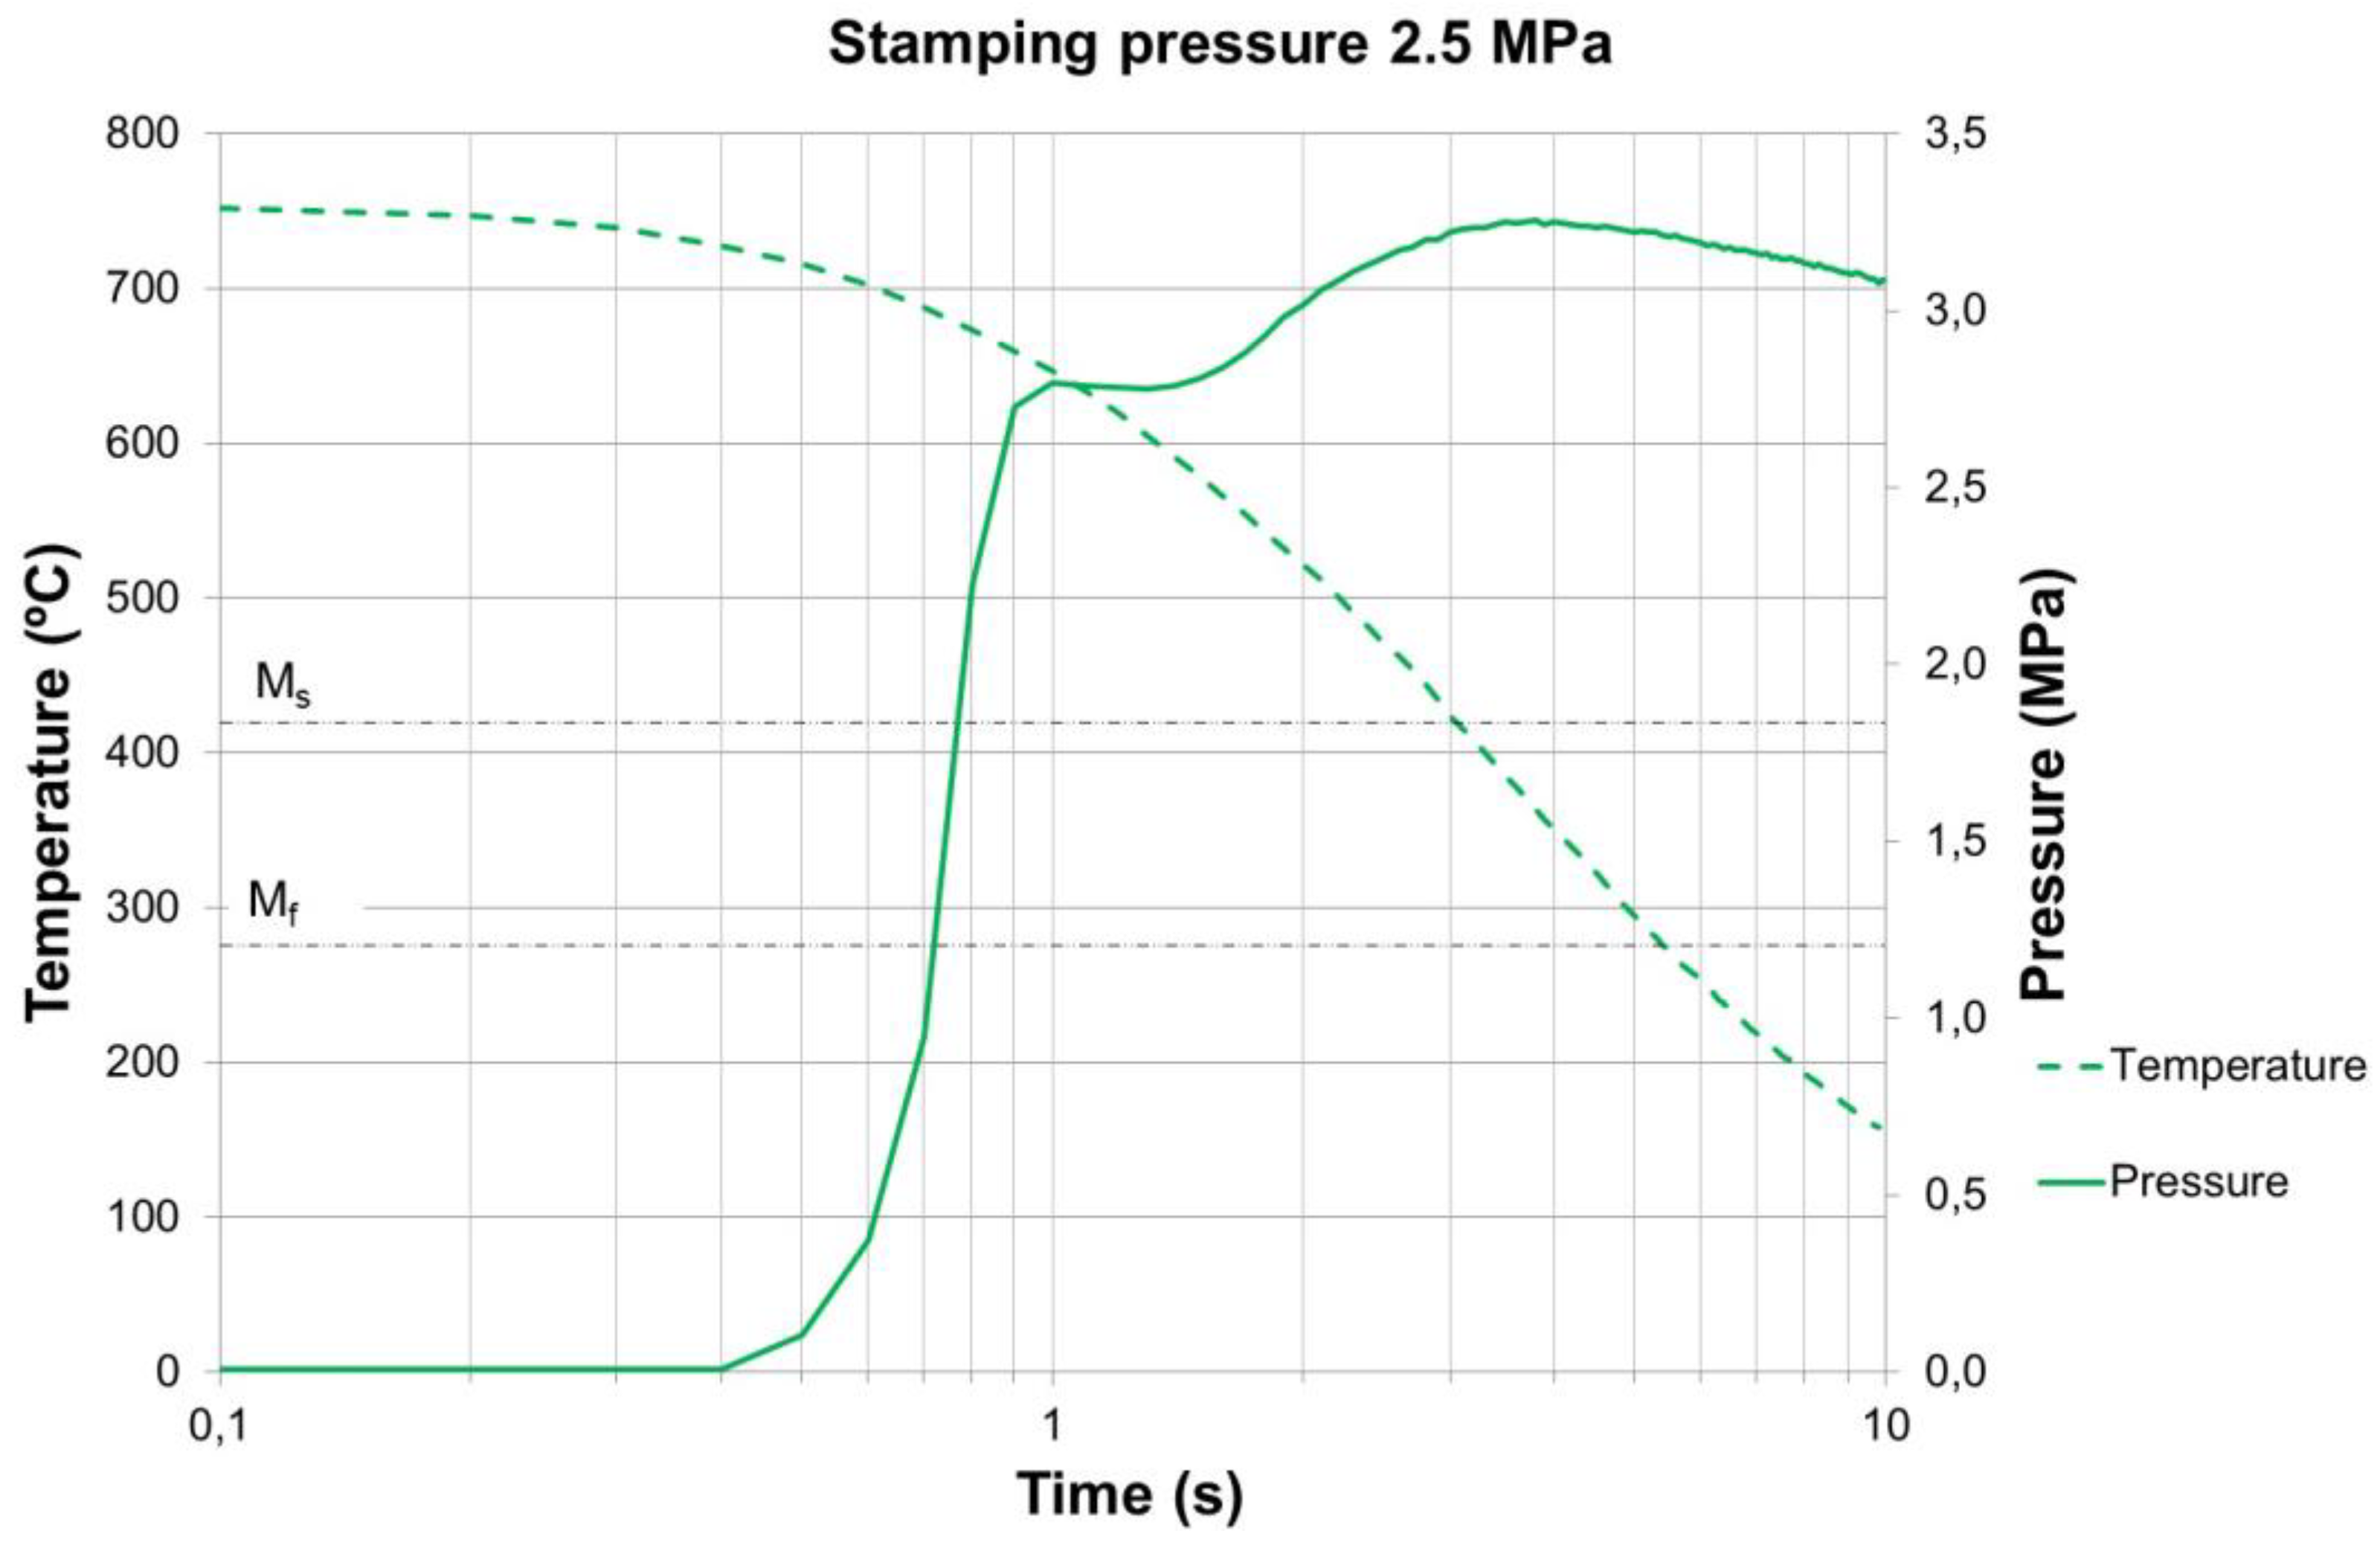
For the two lowest pressure set-points on the testing schedule, 5 and 2.5 MPa, thermal shrinkage of the sample was detected as a relaxation of the exerted pressure (Figure 13 and Figure 14). In these two cases, there is an initial peak of stress, followed by a reduction of the pressure that is attributed to the thermal expansion coefficient. In terms of the delay of the onset of the overshot, the measured values are 0.3 s and 0.4 s, while the duration of the expansion is 2.5 s and 2.9 s, for 5 MPa and 2.5 MPa, respectively. In these two cases, the Ms in the thermocouple position is reached during the overshot ramp.
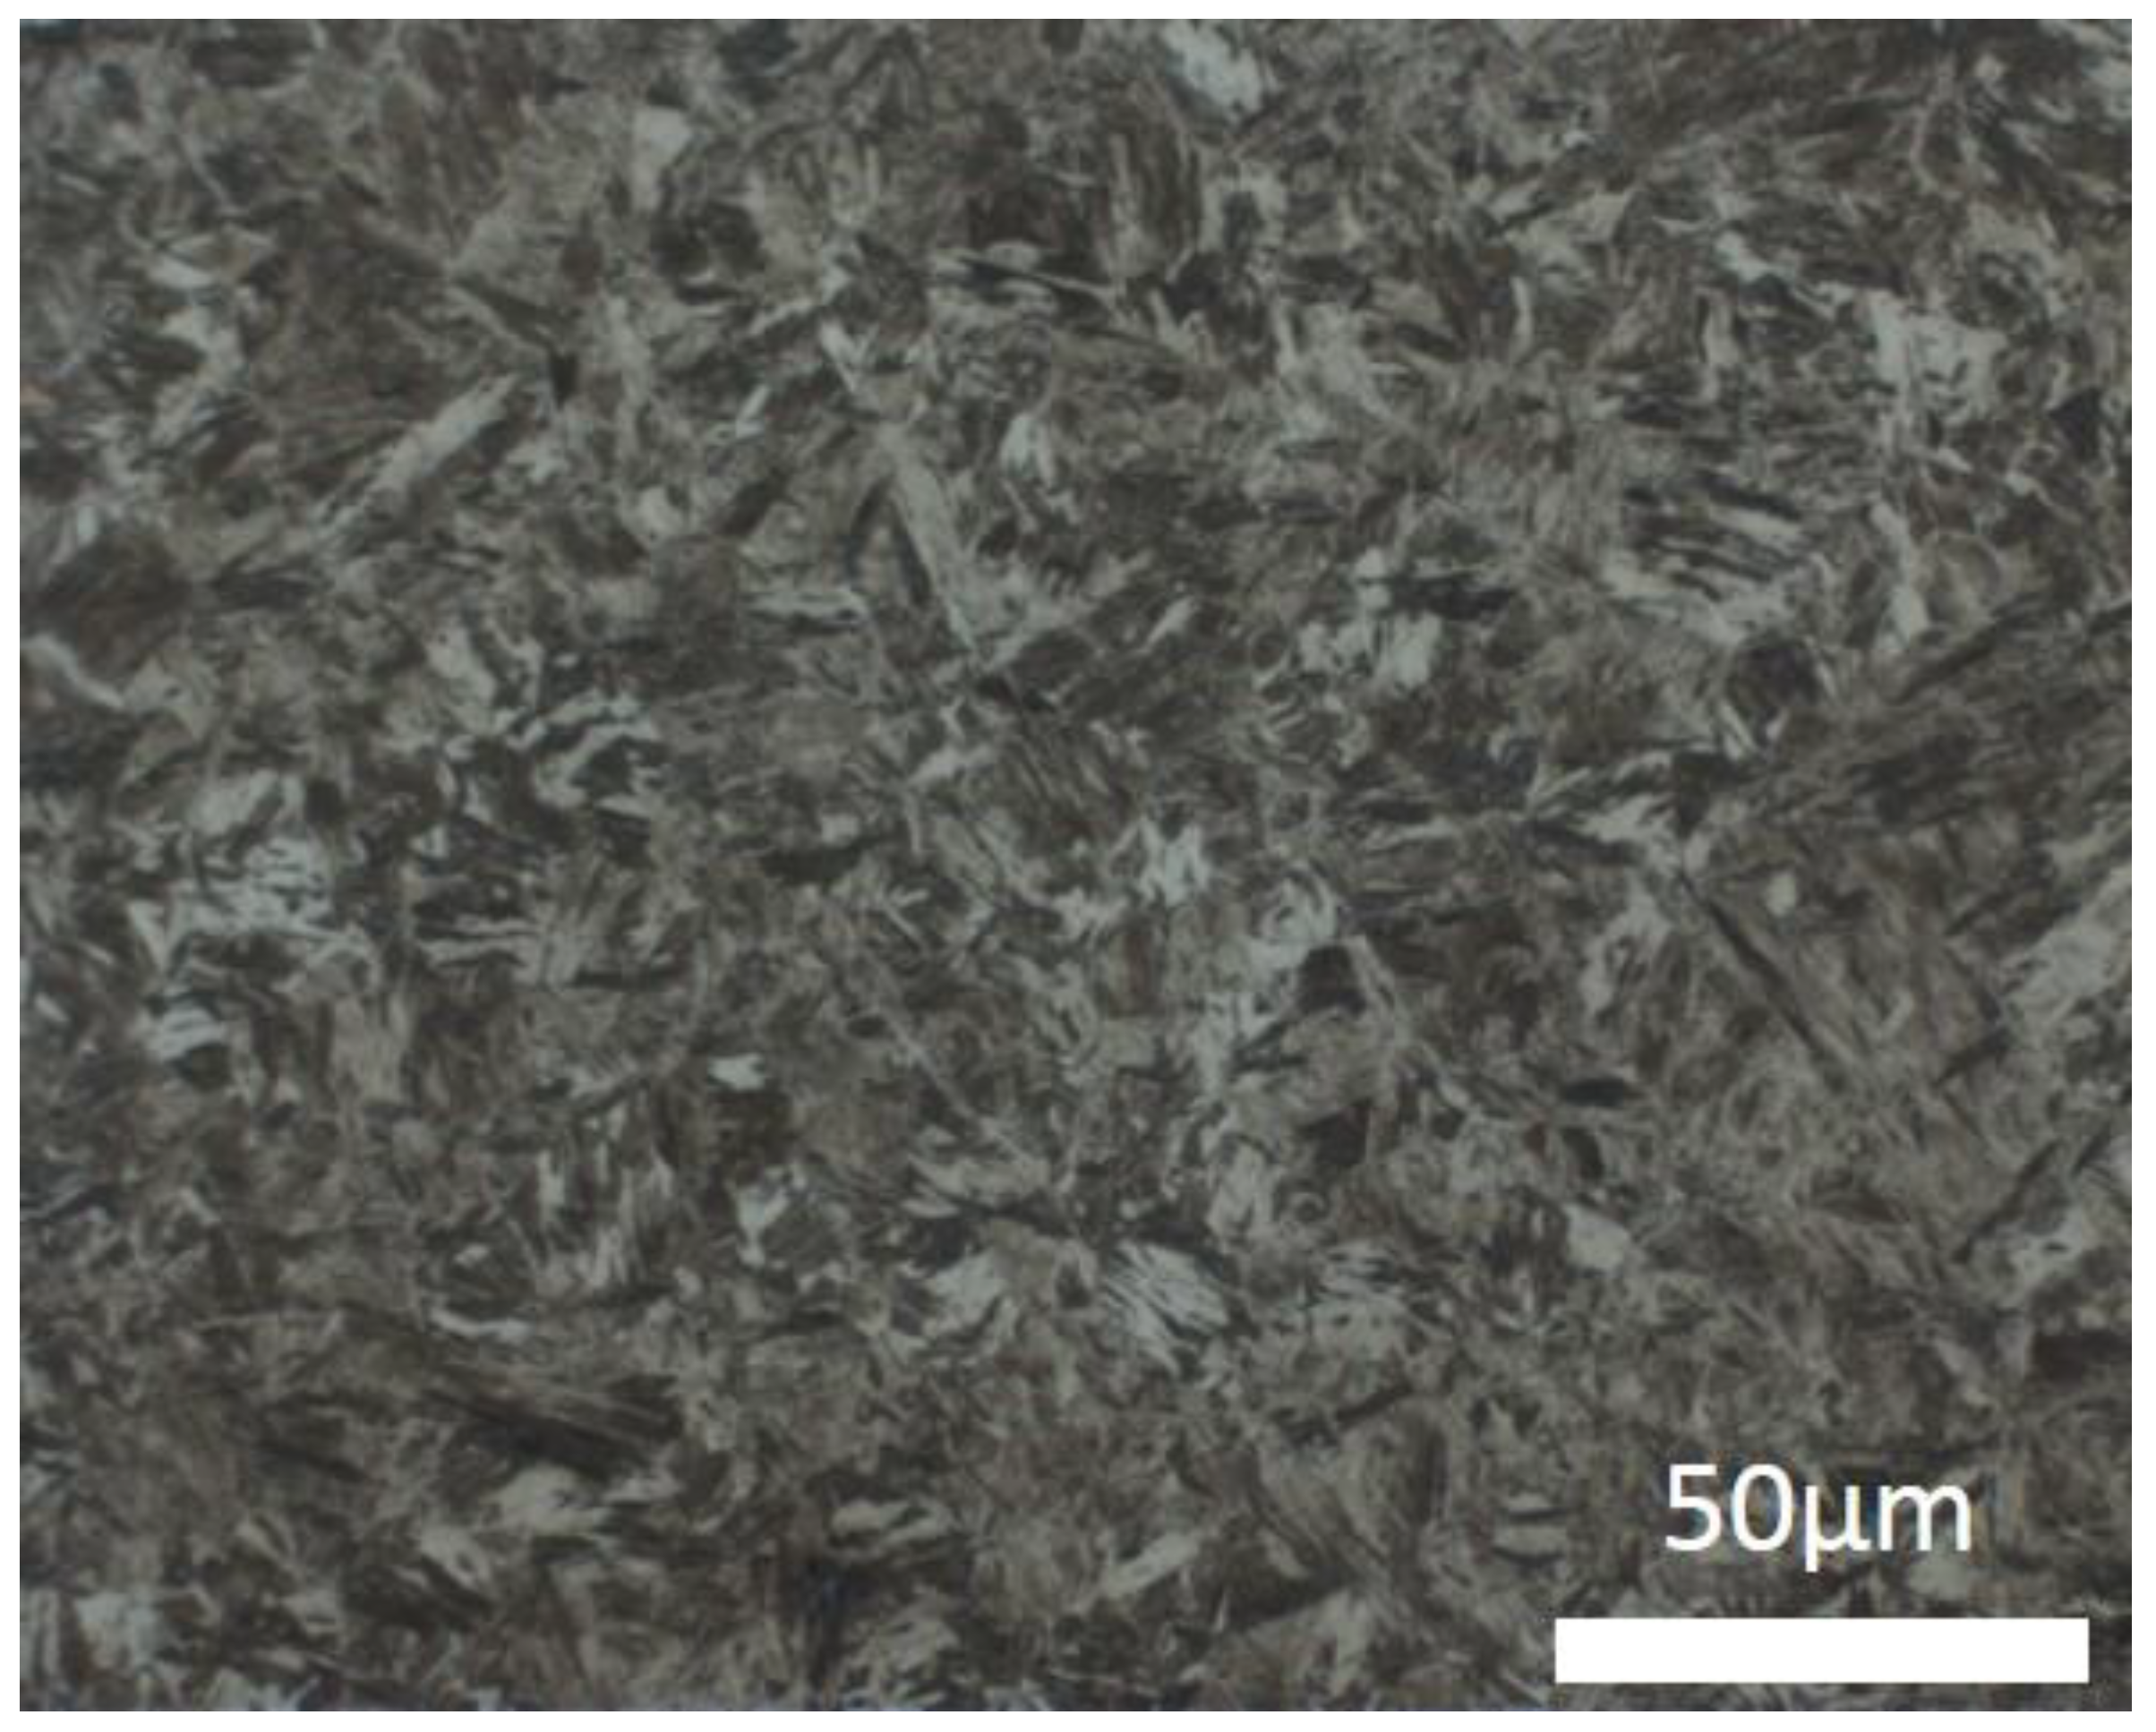
Figure 15 shows microstructural confirmation of the correct quenching of the samples even for the case of the lowest working pressure. This result is backed-up by the hardness measurements shown earlier in Table 2.
According to the foregoing records, the lower the working pressure, the better the resolution of the martensitic expansion that can be obtained in terms of pressure overshot, as the hardening is carried out at a slower pace along the sample.
4. Discussion
The results reported above show a phenomenon that allows us to detect when the martensitic transformation was complete during hot stamping, and under certain conditions:
- Force monitoring must exist on the lowest quenching pressure site of the stamped part.
- The press force set-point must be achieved before quenching starts.
- The site of the stamped part must have a flat sheet-to-tool contact surface.
- It must be possible to program the press stroke so that it maintains its BDC during quenching.
Provided these conditions are met, the martensitic expansion of the quenched steel can be measured in terms of a force increase and stabilization. This feature can be potentially applied to industrial hot stamping processes as a means of reducing the quenching time. Press opening can be commanded immediately after the quenching finishes, thus reducing the over-holding times that are employed to account for any uncertainties in the precise instant that full-part quenching is achieved.
It is understandable that this behavior has not been observed during industrial production. All in all, industrial presses monitor average forces and manufacture complex part shapes, because of this the final quenching expansion cannot be resolved. Regarding laboratory hot stamping tests, some authors have supplied pressure (or force) and/or temperature versus time curves for the hot stamping of both flat and shaped samples.
The same overshot was observed in Reference [8], but corresponded to an omega-shaped sample, meaning that there was no way to distinguish any expansion effect on the flanges, which is the most conflictive point for quenching hot stamped parts.
Regarding the lack of martensitic expansion reporting, also shown by Reference [7], two alternatives related to the press programming are proposed as an explanation. On the one hand, if the pressure ramp-up is too slow, the martensitic transformation can happen while the press is in load control and the proportional integral derivative program is in a position that compensates for any expansion, thus hiding any overshot. On the other hand, if closed-loop pressure control is set and the control reaction time is very quick, the quenching might be carried-out unnoticed and smooth force variations would only be registered.
5. Conclusions
It is worth pointing out that despite the low pressures that have been used in this work, martensitic transformation has been achieved over a very narrow timeline, which points to potential future work. Considering all the industrial effort involved in reducing cycle times and costs, the next research steps should be focused on developing tool-design strategies and taking advantage of the achieved results by takt-time reduction.
This work shows that it is possible to develop a system/device that is capable of monitoring quenching in real time during hot stamping. If force is monitored in the slowest cooling spots of the part, detection of the martensitic expansion makes it possible to control the production equipment and optimize the process.
Author Contributions
All the four authors conceived, designed, performed the press hardening experiments and interpreted the results together; M.M. and G.A. prepared the experimental setup (tool, cooling system, press programming, sample instrumentation and data acquisition devices); M.M., G.A. and A.G. analyzed the data; A.G. performed the pressure homogeneity distribution measurements and M.M., G.A. and C.A. wrote the paper.
Funding
The authors gratefully acknowledge the funding provided by the Department of Research and Universities of the Basque Government under Grant No. IT947-16 and the University of the Basque Country UPV/EHU under Program No. UFI 11/29.
Conflicts of Interest
The authors declare no conflict of interest.
References
- Karbasian, H.; Tekkaya, A.E. A review on hot stamping. J. Mater. Process. Technol. 2010, 210, 2103–2118. [Google Scholar] [CrossRef]
- Neugebauer, R.; Schieck, F.; Polster, S.; Mosel, A.; Rautenstrauch, A.; Schönherr, J.; Pierschel, N. Press hardening—An innovative and challenging technology. Arch. Civil Mech. Eng. 2012, 12, 113–118. [Google Scholar] [CrossRef]
- Mori, K.; Bariani, P.F.; Behrens, B.-A.; Brosius, A.; Bruschi, S.; Maeno, T.; Merklein, M.; Yanagimoto, J. Hot stamping of ultra-high strength steel parts. CIRP Ann. Manuf. Technol. 2017, 66, 755–777. [Google Scholar] [CrossRef]
- Palm, C.; Vollmer, R.; Aspacher, J.; Gharbi, M. Increasing performance of hot stamping systems. Procedia Eng. 2017, 207, 765–770. [Google Scholar] [CrossRef]
- Ghiotti, A.; Bruschi, S.; Medea, F.; Hamasaiid, A. Tribological behavior of high thermal conductivity steels for hot stamping tools. Tribol. Int. 2016, 97, 412–422. [Google Scholar] [CrossRef]
- He, B.; Ying, L.; Li, X.; Hu, P. Optimal design of longitudinal conformal cooling channels in hot stamping tools. Appl. Therm. Eng. 2016, 106, 1176–1189. [Google Scholar] [CrossRef]
- Caron, E.J.F.R.; Daun, K.J.; Wells, M.A. Experimental heat transfer coefficient measurements during hot forming die quenching of boron steel at high temperatures. Int. J. Heat Mass Transf. 2014, 71, 396–404. [Google Scholar] [CrossRef]
- Abdulhay, B.; Bourouga, B.; Dessain, C. Thermal contact resistance estimation: Influence of the pressure contact and the coating layer during a hot forming process. Int. J. Mater. Form. 2012, 5, 183–197. [Google Scholar] [CrossRef]
- Mendiguren, J.; Ortubay, R.; Saenz de Argandoña, E.; Galdos, L. Experimental characterization of the heat transfer coefficient under different close loop controlled pressures and die temperatures. Appl. Therm. Eng. 2016, 99, 813–824. [Google Scholar] [CrossRef]
- Salomonsson, P.; Oldenburg, M.; Akerström, P.; Bergman, G. Experimental and numerical evaluation of the heat transfer coefficient in press hardening. Steel Res. Int. 2009, 80, 841–845. [Google Scholar] [CrossRef]
- Gorriño, A.; Angulo, C.; Muro, M.; Izaga, J. Investigation of thermal and mechanical properties of quenchable high-strength steels in hot stamping. Metall. Mater. Trans. B 2016, 47, 1527–1531. [Google Scholar] [CrossRef]
- Naderi, M.; Saeed-Akbari, A.; Bleck, W. The effects of non-isothermal deformation on martensitic transformation in 22MnB5 steel. Mater. Sci. Eng. A 2008, 487, 445–455. [Google Scholar] [CrossRef]
- Chang, Y.; Tang, X.; Zhao, K.; Hu, P.; Wu, Y. Investigation of the factors influencing the interfacial heat transfer coefficient in hot stamping. J. Mater. Process. Technol. 2016, 228, 25–33. [Google Scholar] [CrossRef]
- Ancona, F.; Palumbo, D.; De Finis, R.; Demelio, G.P.; Galietti, U. Automatic procedure for evaluating the Paris Law of martensitic and austenitic stainless steels by means of thermal methods. Eng. Fract. Mech. 2016, 163, 206–219. [Google Scholar] [CrossRef]
- Wang, L.; Zhu, B.; Wang, Y.; An, X.; Wang, Q.; Zhang, Y. An online dwell time optimization method based on parts performance for hot stamping. Procedia Eng. 2017, 207, 759–764. [Google Scholar] [CrossRef]
- Muvunzi, R.; Dimitrov, D.M.; Matope, S.; Harms, T.M. Development of a model for predicting cycle time in hot stamping. Procedia Manuf. 2018, 21, 84–91. [Google Scholar] [CrossRef]
- Gu, Z.; Lu, M.; Lu, G.; Li, X.; Xu, H. Effect of contact pressure during quenching on microstructure and mechanical properties of hot-stamping parts. J. Iron. Steel Res. Int. 2015, 22, 1138–1143. [Google Scholar] [CrossRef]
- Rider, C. Pressure Distribution Image Analysis Process. U.S. Patent 2002/0129658 A1, 19 September 2002. [Google Scholar]
Figure 1.
Schematic pressure distribution on flanges and flat areas in a hot stamped profile. “A” subscripts stand for “Apparent” and “E” subscripts stand for “Effective”.
Figure 1.
Schematic pressure distribution on flanges and flat areas in a hot stamped profile. “A” subscripts stand for “Apparent” and “E” subscripts stand for “Effective”.
Figure 2.
(a) Test sample sketch; (b) samples with the K thermocouple inserted.
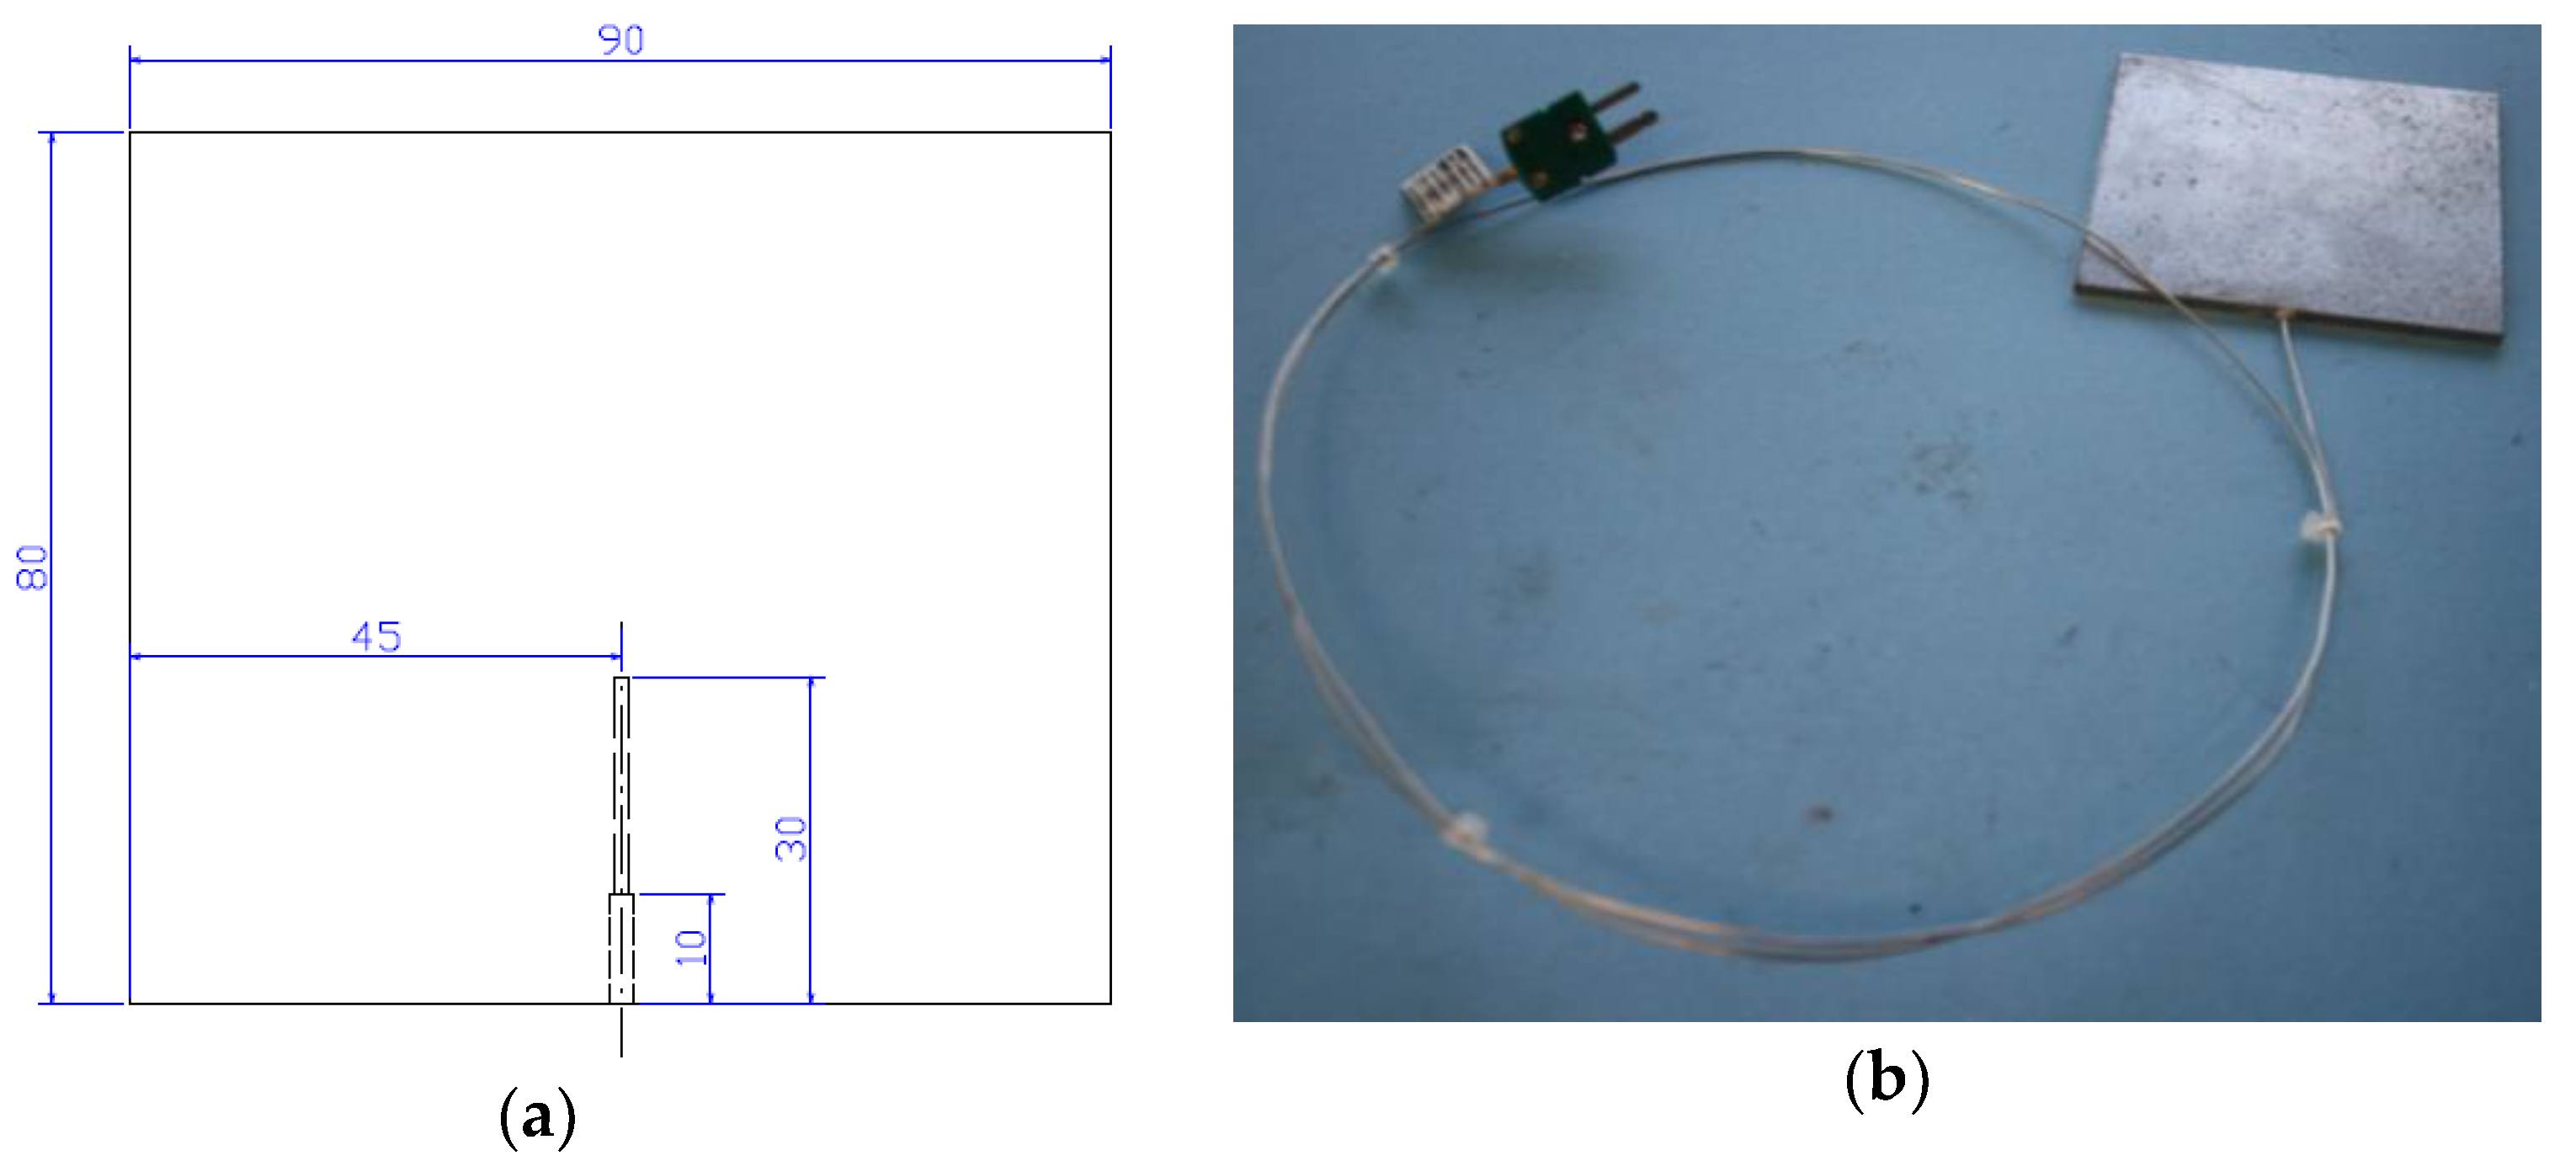
Figure 3.
Die demonstrator sketch with the cooling system.
Figure 4.
The die demonstrator placed on the hydraulic press.

Figure 5.
The force press track over the 120 × 140 mm film.
Figure 6.
Pressure distribution in a 3D image.
Figure 7.
Distribution of the applied pressure over a 80 × 90 mm USIBOR 1500P® steel sheet blank (ArcelorMittal, Luxembourg City, Luxembourg).
Figure 7.
Distribution of the applied pressure over a 80 × 90 mm USIBOR 1500P® steel sheet blank (ArcelorMittal, Luxembourg City, Luxembourg).
Figure 8.
Identification of the zones subjected to metallurgical testing, T (Thermocouple), HP (High Pressure), and LP (Low Pressure).
Figure 8.
Identification of the zones subjected to metallurgical testing, T (Thermocouple), HP (High Pressure), and LP (Low Pressure).
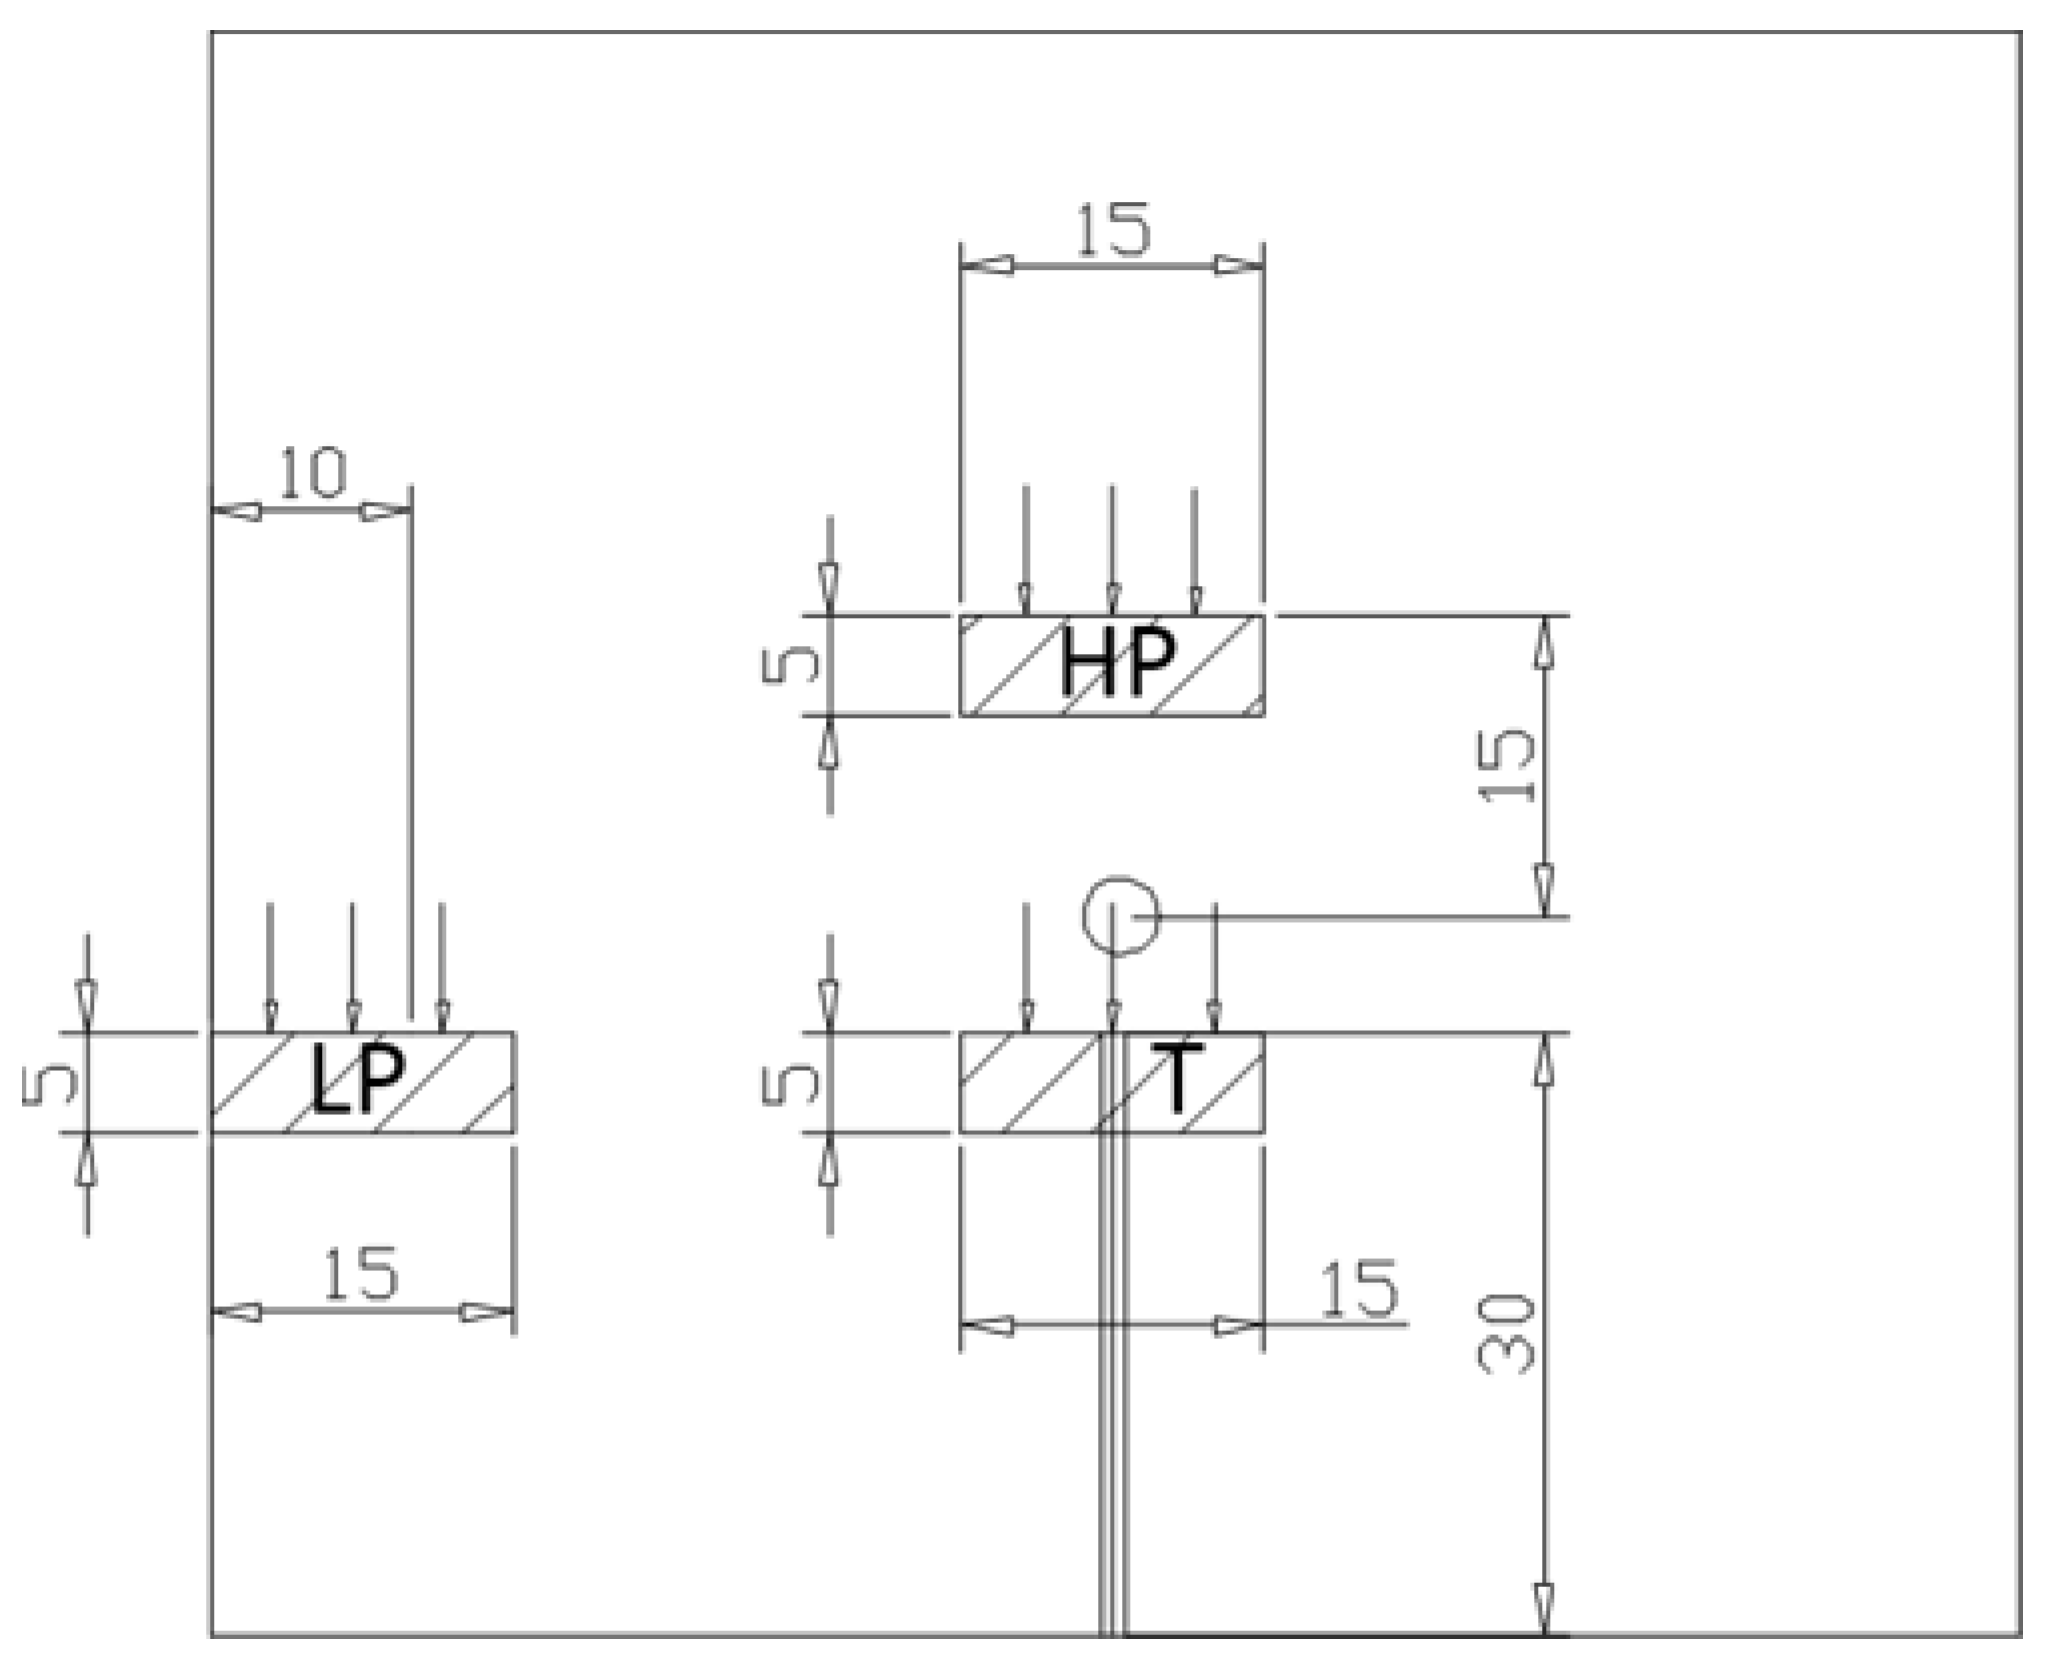
Figure 9.
Temperature–pressure–time plot for a pressure set-point of 12.5 MPa.
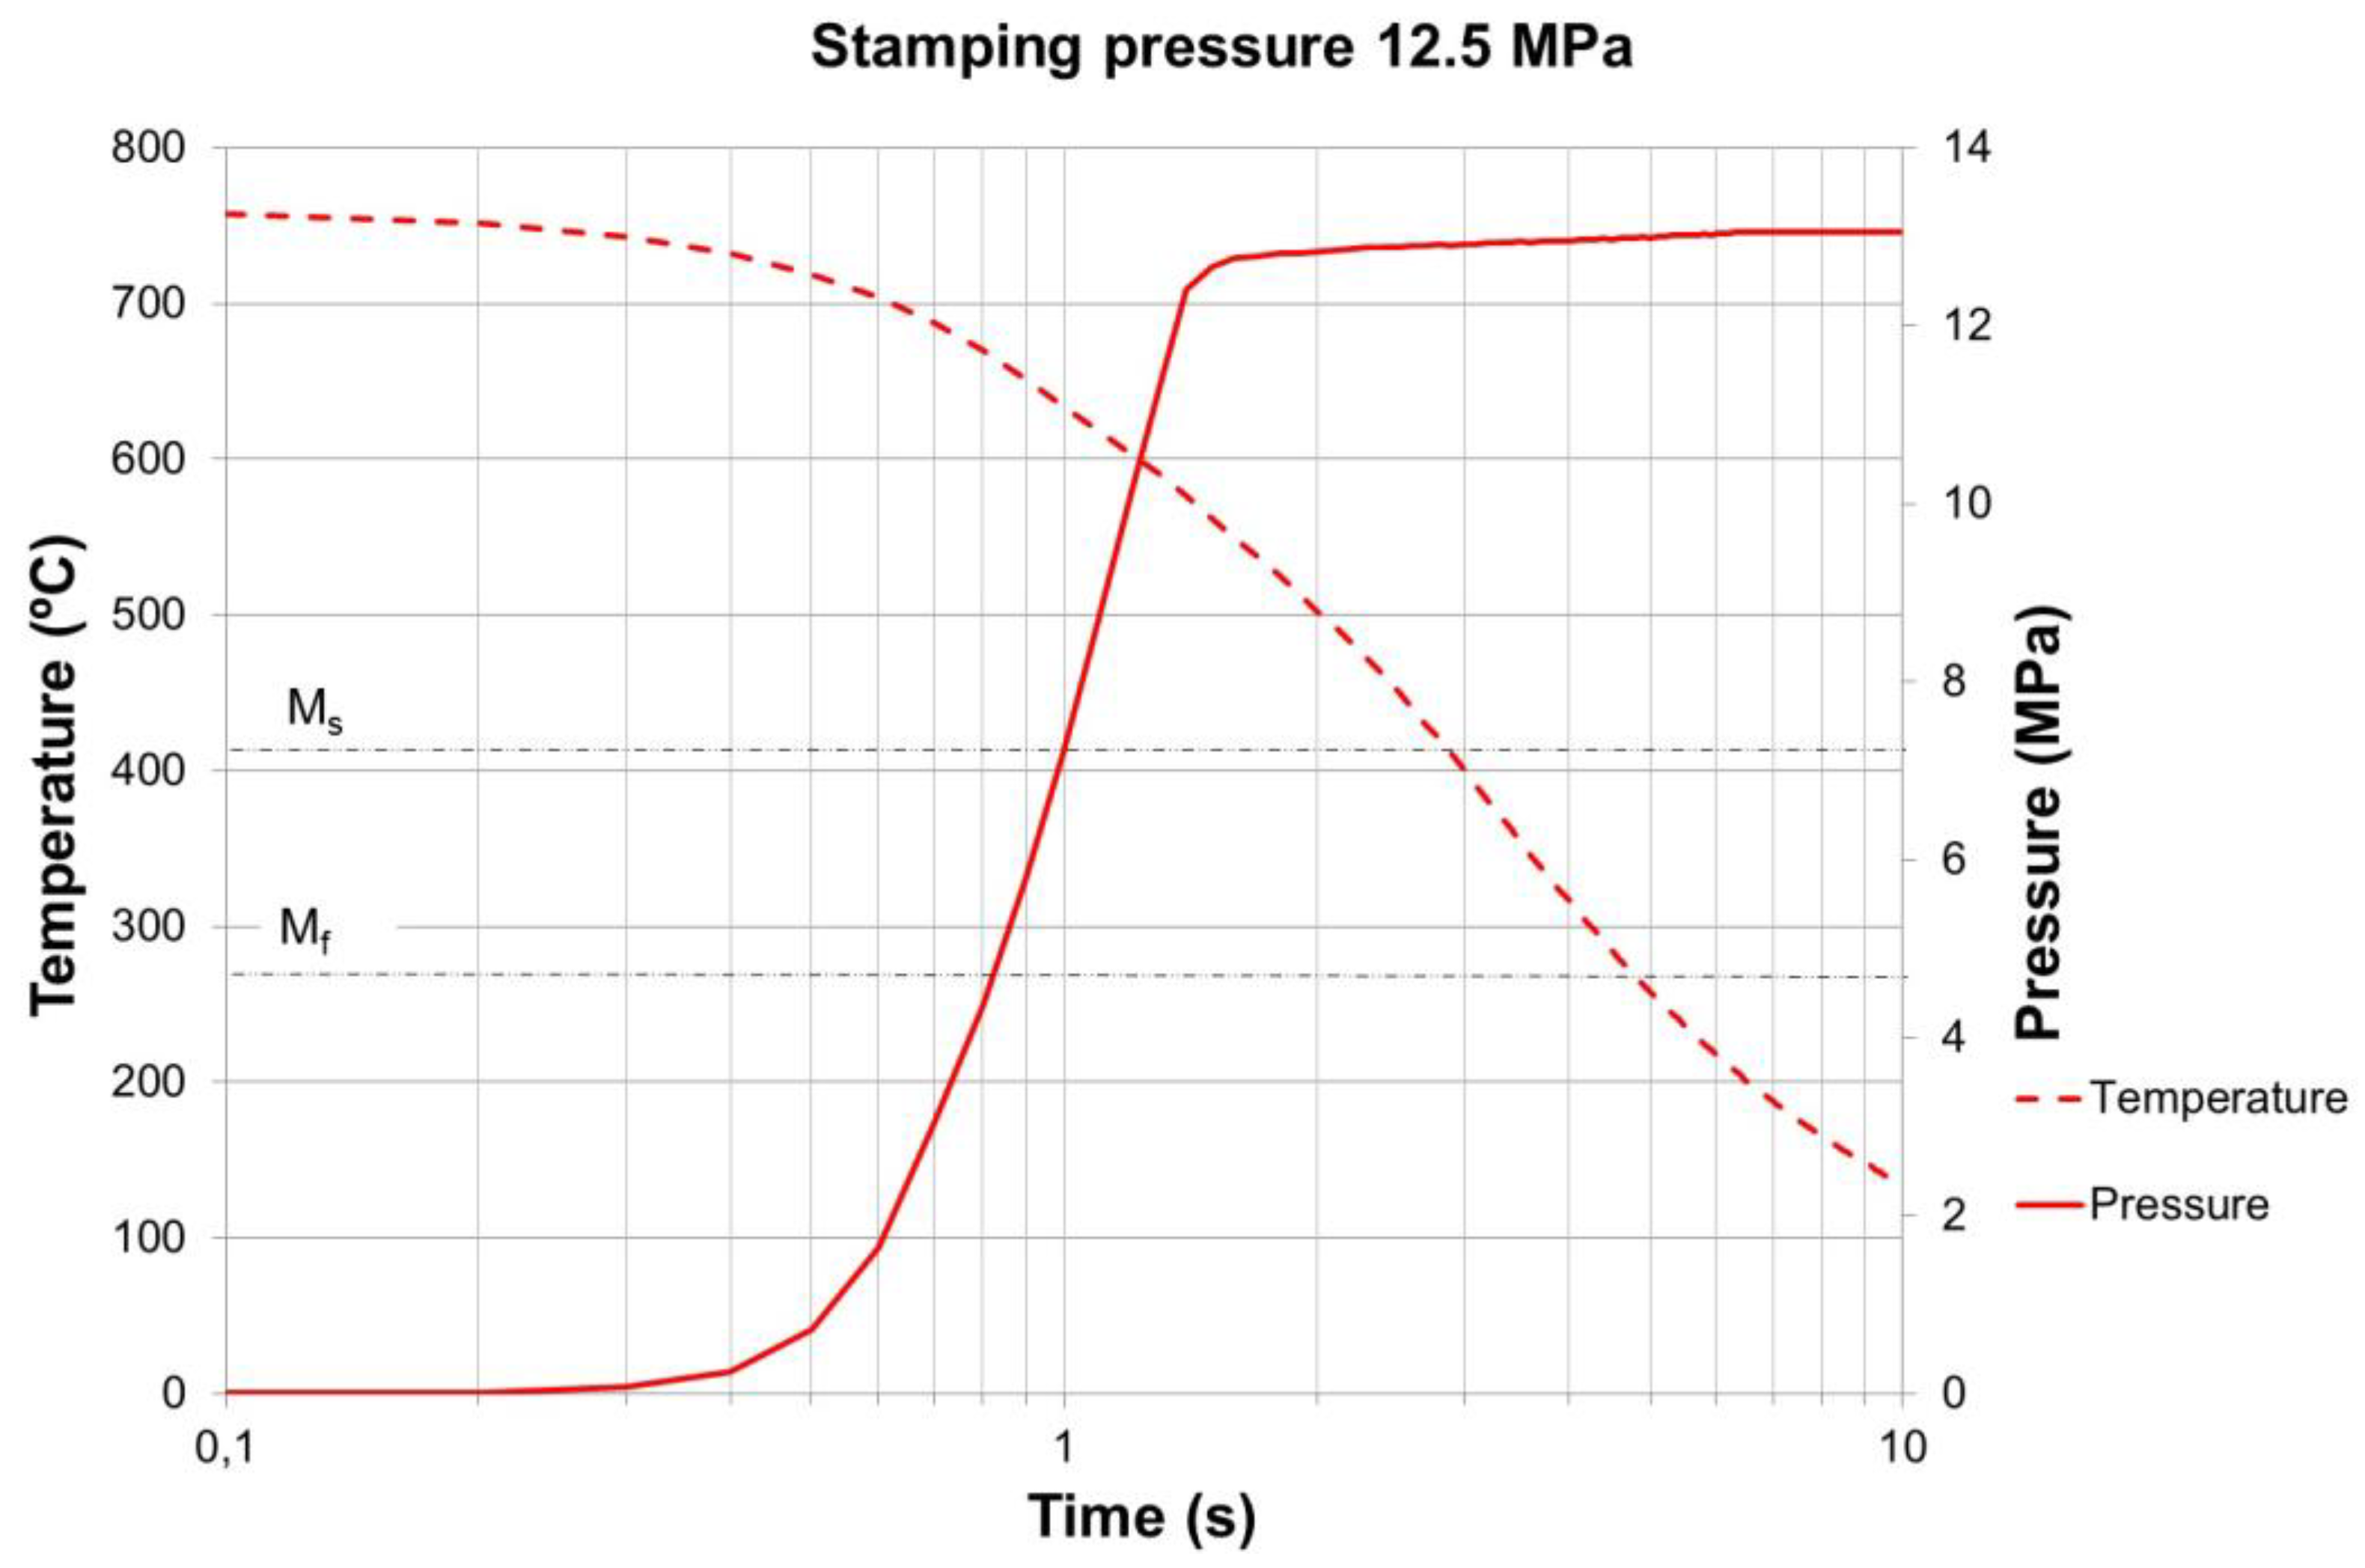
Figure 10.
Martensitic microstructure of the material stamped at the 12.5 MPa set-point and analyzed in LP zone.
Figure 10.
Martensitic microstructure of the material stamped at the 12.5 MPa set-point and analyzed in LP zone.
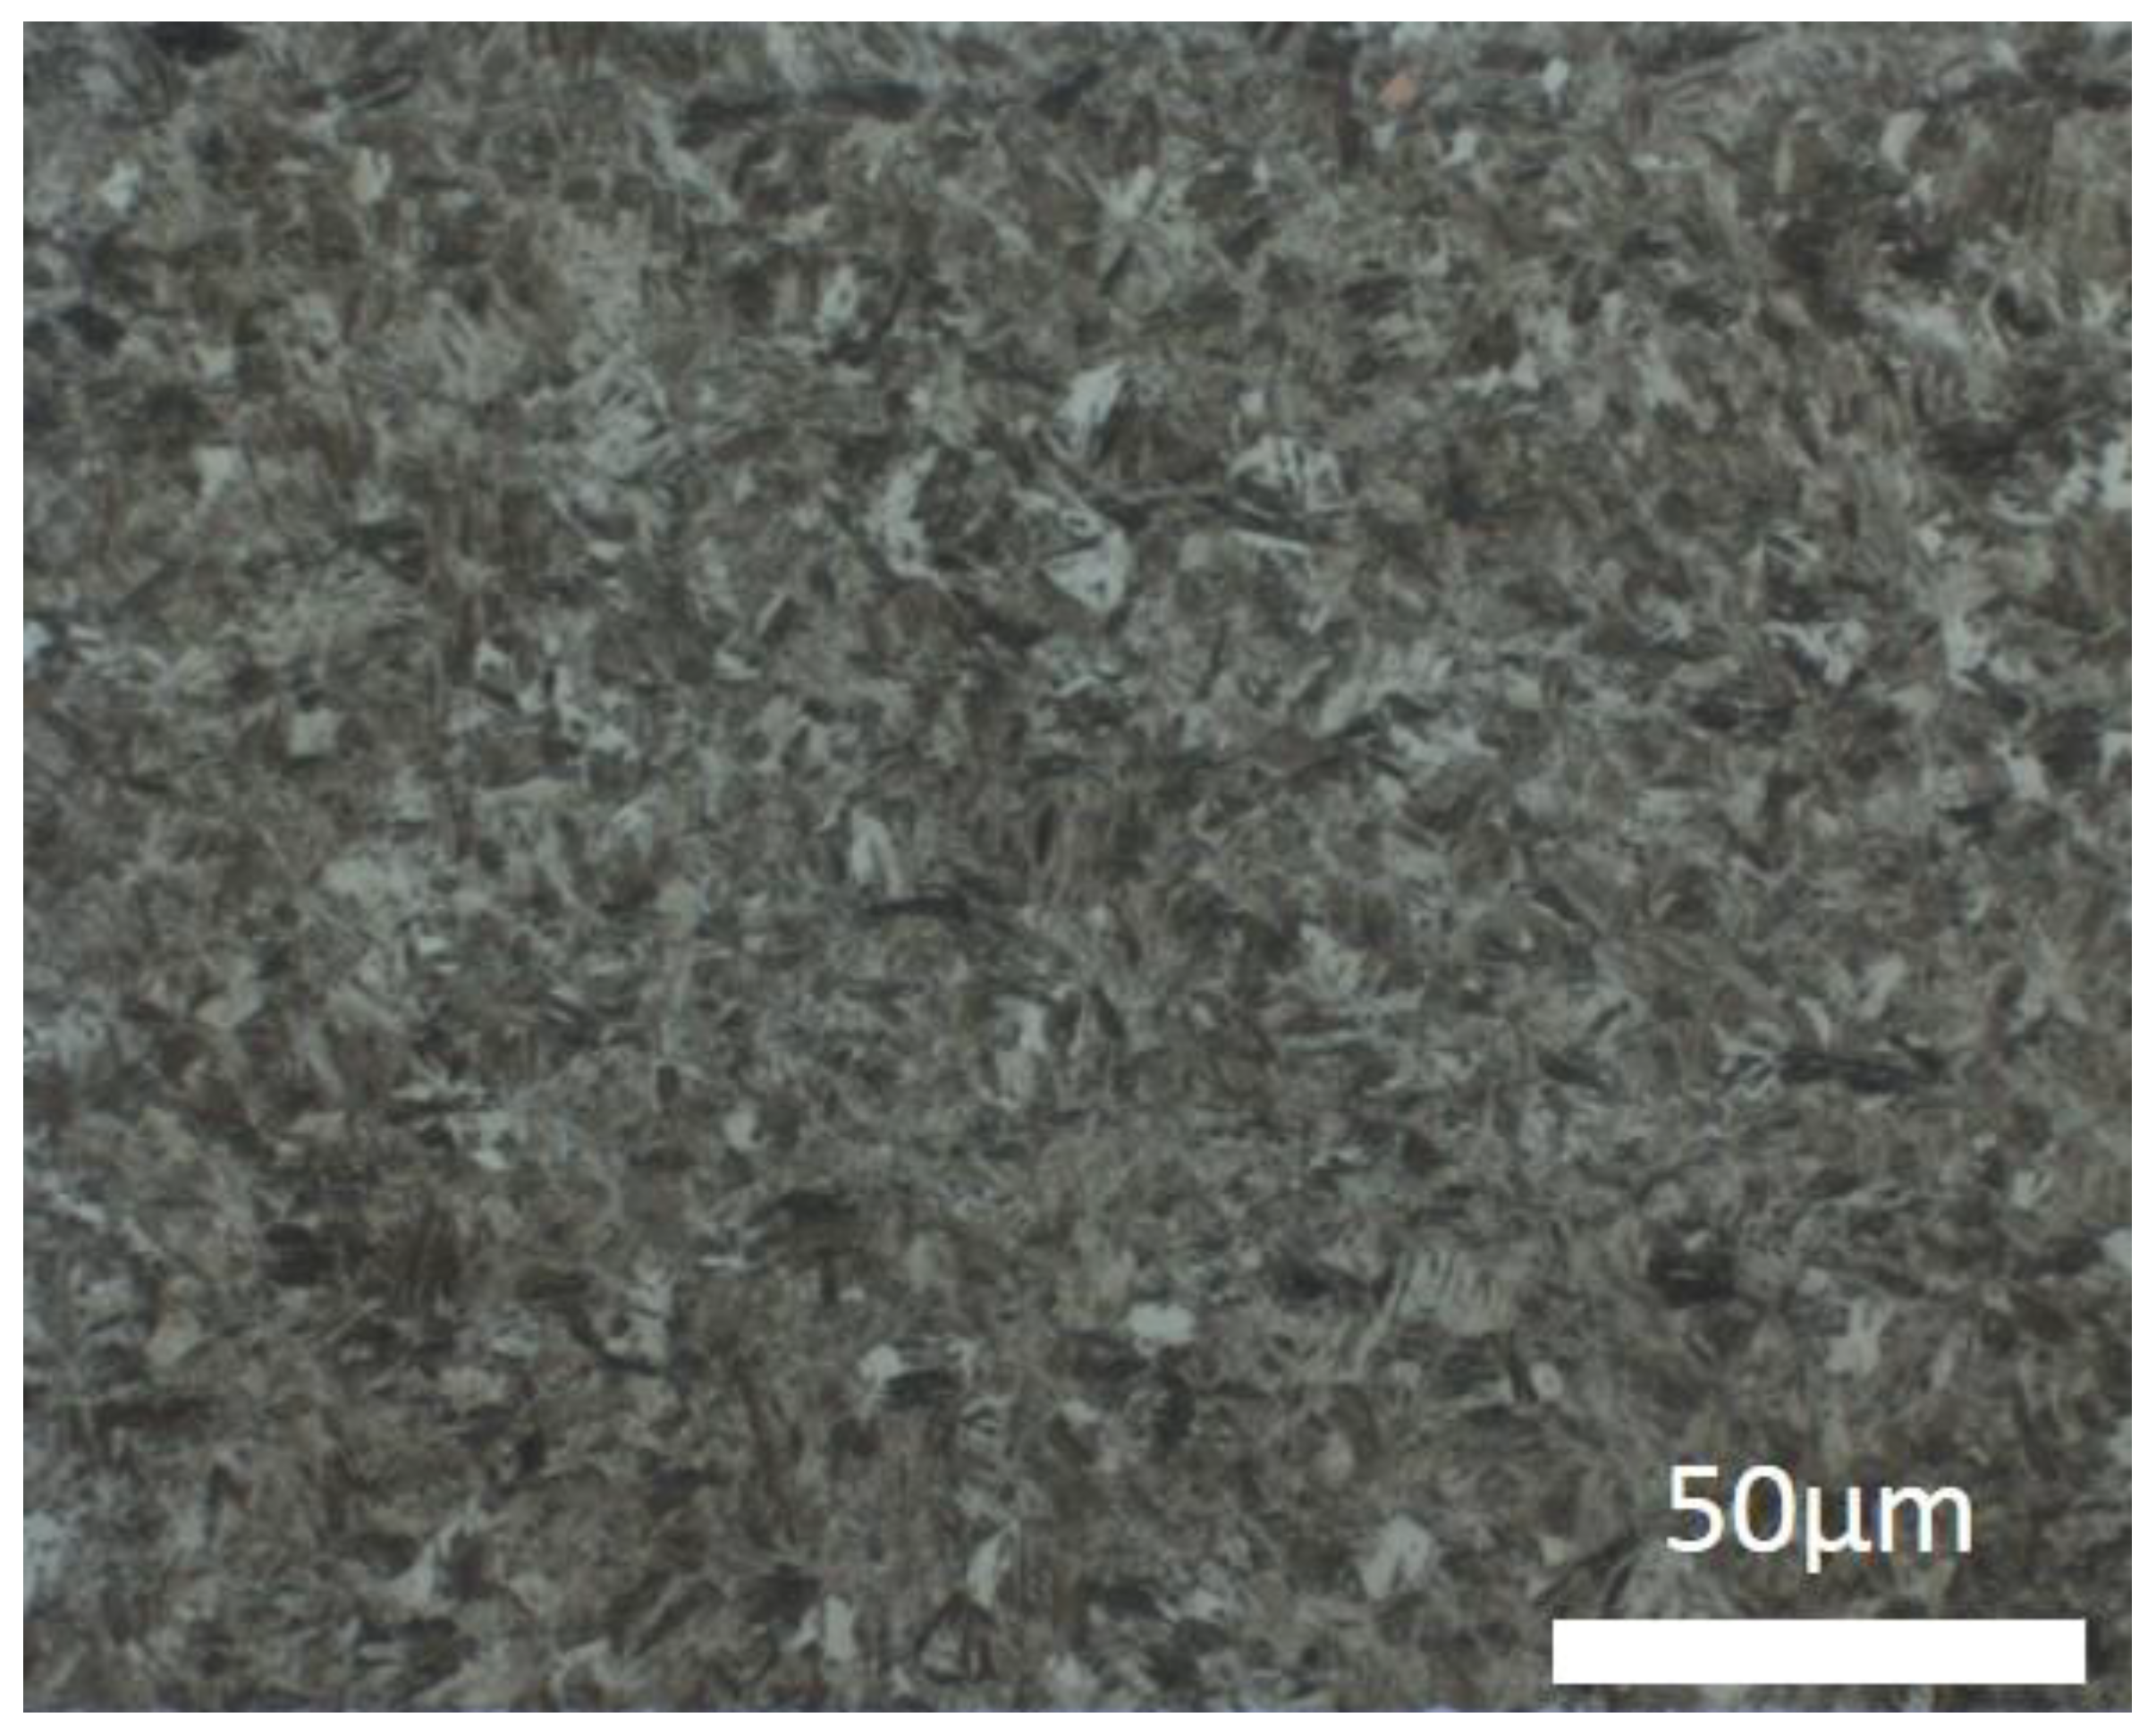
Figure 11.
Temperature–pressure–time plot for a pressure set-point of 10 MPa.
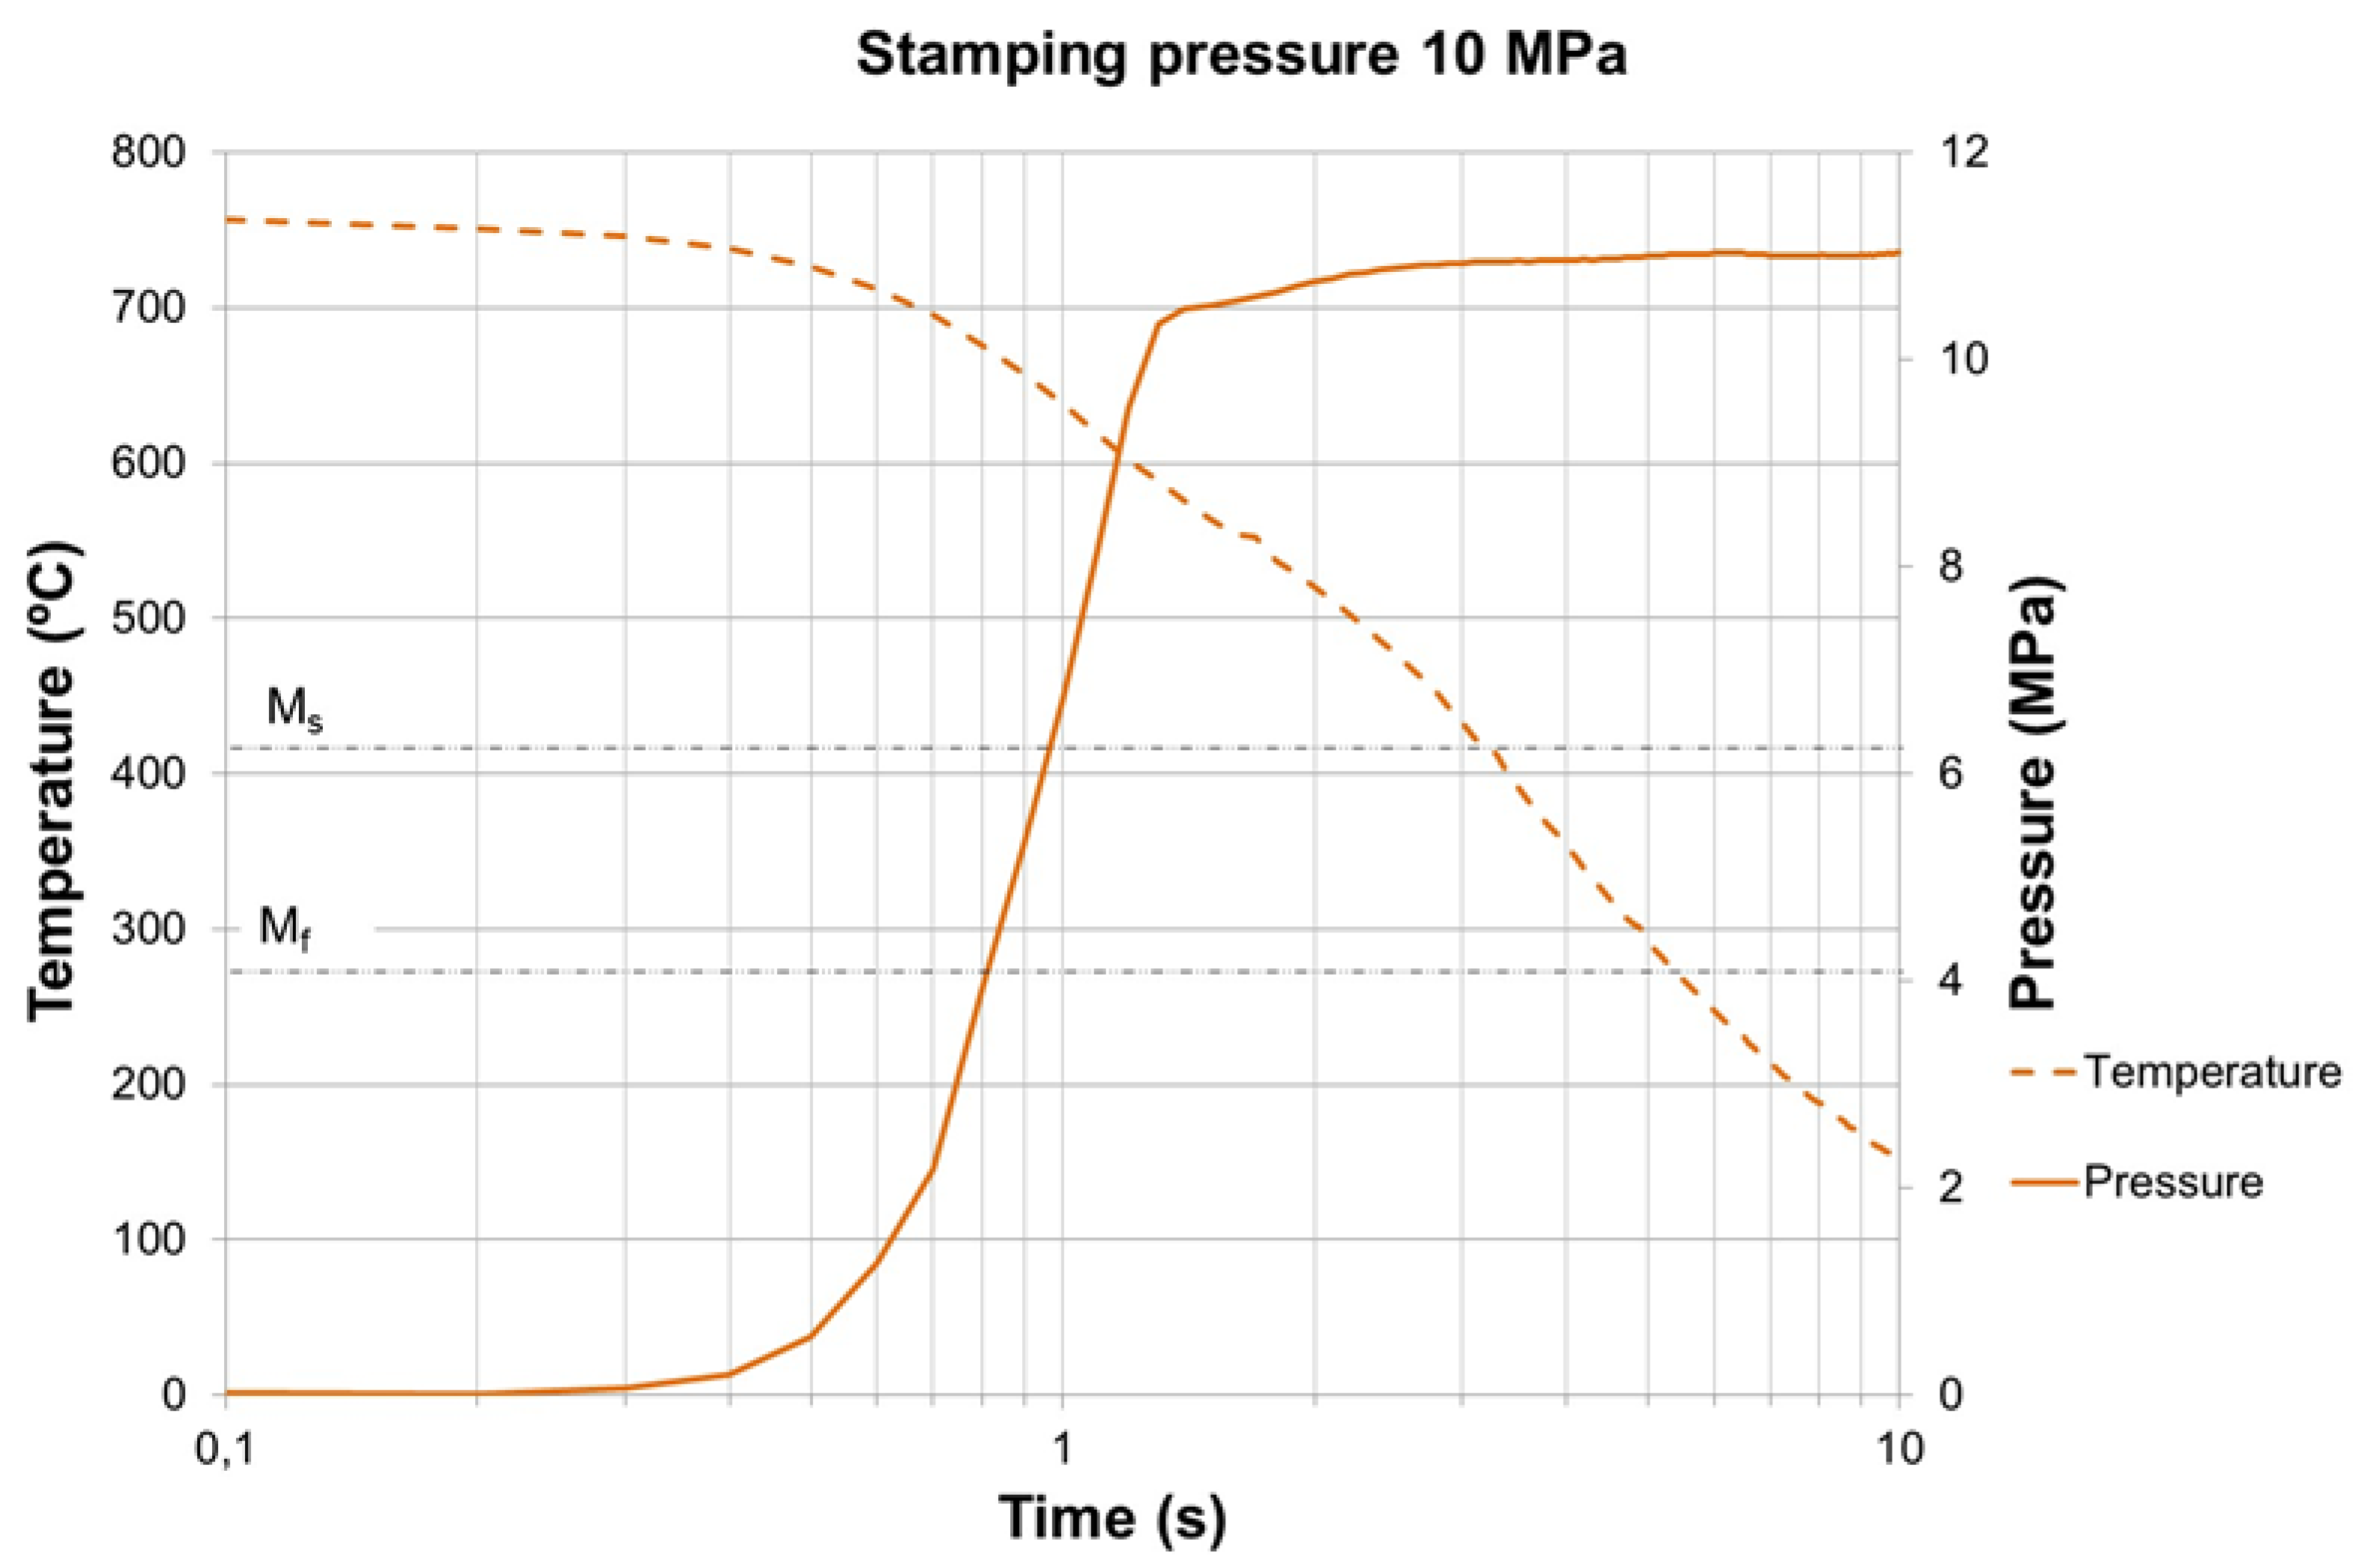
Figure 12.
Temperature–pressure–time plot for a pressure set-point of 7.5 MPa.
Figure 13.
Temperature–pressure–time plot for a pressure set-point of 5 MPa.
Figure 14.
Temperature–pressure–time plot for a pressure set-point of 2.5 MPa.
Figure 15.
Martensitic microstructure of the material stamped at 2.5 MPa set-point and analyzed in LP zone.
Figure 15.
Martensitic microstructure of the material stamped at 2.5 MPa set-point and analyzed in LP zone.

Table 1.
Chemical composition of USIBOR 1500P® (in wt % with balanced Fe).
| C | Si | Mn | P | S | Al | B | N2 | Ti | Cr | Ni |
|---|---|---|---|---|---|---|---|---|---|---|
| 0.22 | 0.27 | 1.23 | 0.014 | 0.003 | 0.041 | 0.003 | 0.006 | 0.036 | 0.21 | 0.05 |
Table 2.
Vickers hardness measurement sampling for each pressure set-point. Average of five values and confidence interval of 95% of the mean.
Table 2.
Vickers hardness measurement sampling for each pressure set-point. Average of five values and confidence interval of 95% of the mean.
| Pressure Set-Point (MPa) | HV10 Hardness |
|---|---|
| 12.5 | 487 ± 7 |
| 10.0 | 477 ± 18 |
| 7.5 | 478 ± 9 |
| 5.0 | 488 ± 10 |
| 2.5 | 481 ± 10 |
© 2018 by the authors. Licensee MDPI, Basel, Switzerland. This article is an open access article distributed under the terms and conditions of the Creative Commons Attribution (CC BY) license (http://creativecommons.org/licenses/by/4.0/).
Share and Cite
MDPI and ACS Style
Muro, M.; Artola, G.; Gorriño, A.; Angulo, C. Effect of the Martensitic Transformation on the Stamping Force and Cycle Time of Hot Stamping Parts. Metals 2018, 8, 385. https://doi.org/10.3390/met8060385
AMA Style
Muro M, Artola G, Gorriño A, Angulo C. Effect of the Martensitic Transformation on the Stamping Force and Cycle Time of Hot Stamping Parts. Metals. 2018; 8(6):385. https://doi.org/10.3390/met8060385
Chicago/Turabian StyleMuro, Maider, Garikoitz Artola, Anton Gorriño, and Carlos Angulo. 2018. "Effect of the Martensitic Transformation on the Stamping Force and Cycle Time of Hot Stamping Parts" Metals 8, no. 6: 385. https://doi.org/10.3390/met8060385
Note that from the first issue of 2016, this journal uses article numbers instead of page numbers. See further details here.