Article

A Comparative Study on the Effect of Welding Parameters of Austenitic Stainless Steels Using Artificial Neural Network and Taguchi Approaches with ANOVA Analysis

1
Department of Mechanical and Metal Technologies, Technical Sciences, Gaziantep University, Gaziantep 27310, Turkey
2
Department of Mechanical Engineering, Engineering Faculty, Gaziantep University, Gaziantep 27310, Turkey
3
Izmir Vocational School, Dokuz Eylul University, Izmir 35380, Turkey
4
Department of Mechanical Engineering, Wichita State University, 1845 Fairmount, Wichita, KS 67260, USA
*
Author to whom correspondence should be addressed.
Metals 2018, 8(5), 326; https://doi.org/10.3390/met8050326
Submission received: 27 March 2018 / Revised: 2 May 2018 / Accepted: 4 May 2018 / Published: 8 May 2018

Abstract

:
In order to investigate the structure of welds, austenitic stainless steel (SS) studs with a diameter of 6 mm were welded to austenitic SS plates with a thickness of 5 mm using an arc stud welding (ASW) method. The effects of the welding current, welding time, and tip volume of the stud on the microstructure and ultimate tensile strength (UTS) of the welded samples were investigated in detail. The formation of δ-ferrites was detected in the weld zone because of the higher heat generated during the welding process. Higher welding current and time adversely affected the stud and significantly reduced the UTS of the samples. The UTS of the joints was also estimated using artificial neural network (ANN) and Taguchi approaches. The mathematical formulations for these two approaches were given in explicit form. Experimental results showed that the neural network results are more consistent with experimental results than those of the Taguchi method. Overall, it can be concluded that in order to achieve good welding joints and high strength values, ASW parameters should be investigated properly to determine the optimum conditions for each metal.

1. Introduction

Welding is a major fabrication method and widely used to join materials through a fusion process. Metallic materials are mainly considered in welding due to their excellent features and properties [1,2,3]. Numerous metallic materials can be joined using various welding techniques, including friction stir welding, friction stir spot welding, ultrasonic welding, gas tungsten arc welding, laser welding, gas metal arc welding, and arc stud welding (ASW). All of these methods have different advantages and disadvantages in terms of cost, appropriateness, labor, training, efficiency, time, temperature, and simplicity [4,5,6,7,8,9]. The process parameters of welding are a crucial factor affecting the welding quality.
The effects of friction stir welding parameters on the microstructure and mechanical properties of AISI 316L austenitic stainless steel (SS) joints were investigated by Kumar et al. who used different tool rotational speeds. The authors suggested that a higher tool rotational speed results in plasticization of the material, and a lower tool rotational speed induces low plastic flow of the material. The optimum properties were obtained at a tool rotational speed of 600 rev/min [10]. The influence of welding parameters, such as welding current, base metal geometry, and welding time, on the weld characteristics in the electric ASW process was discussed. It was reported that a higher welding current considerably increased the hardness and penetration depth of welding zones in the metal substrates [11]. Chi et al. used a new sensor to measure the effects of stud plunge depth and reported that the proposed sensor had a precise stud plunge depth, which is a very important parameter in the ASW process [12]. The welding current, welding time, and tip volume of the stud are the most important factors affecting joint quality and strength. The high tip volume stud increases the formation of flash, and a high welding current deforms the stud. Sufficient melting does not occur if a low welding current and welding time are selected. In order to obtain quality, high-strength, and sound joints, these parameters can be appropriately selected. It is well known that welding parameters significantly affect the heat input, which affects the joint strength. The interactions and effects on heat input of these factors should be considered in detail. The weldability of 2024-T3 aluminum alloy studs to an extruded AZ80-F magnesium plate 3 mm thick was investigated using the ASW method The authors noted that the optimal discharge voltage for the study was 300 V. Grain refinements of 1 µm thick were observed near the joint interface of the AZ80-F magnesium and the Mg17Al12 and Al3Mg2 intermetallics [13]. The influences of keyhole gas tungsten arc welding parameters on the fusion zone profile of AISI 316L stainless steel were analyzed. It was reported that the increase in welding current caused a rise of weld depth and width. However, at a lower welding current, a completely penetrating keyhole could not be obtained in the weld pool [14]. Ye et al. demonstrated the effects of welding parameters on the mechanical properties, weld appearance, and interface of dissimilar aluminum/steel double-sided butt welding-brazing. They determined that the optimum parameters are 13 V for the metal inert gas (MIG) voltage, 70 A for tungsten inert gas (TIG) current, 13.5 for the MIG/TIG ratio, and 2 cm/s for welding speed [15]. A high MIG voltage causes the formation of intermetallic compound with a thicker layer, and the layer turns out to be thinner with a higher welding speed. Indeed, the joining of dissimilar metals is recognized as a challenging process because of the major differences in physical, chemical, mechanical, and metallurgical properties of the materials.
Recently, the ASW process has been extensively utilized for sheet metals in various industries, such as automotive, ship, aircraft, electric, electronic, and construction. Different types of ASW methods (e.g., capacitor discharge stud welding, short-cycle drawn ASW, and drawn ASW with shielding) are used to weld metallic sheet materials, depending on the type of production, the amount of applied load, and the type of materials and properties. The characteristics of ASW are influenced by stud diameter, welding current, welding time, and tip volume of the stud. In other words, several parameters are influential in achieving optimal mechanical properties and defect-free high-quality joints. To the best of our knowledge, a comprehensive study related to 316 austenite stainless steel studs welded to 304 stainless steel plates by the arc stud welding method has not been carried out in the literature. Therefore, this current study investigated in detail the weldability of AISI 316 SS studs to 304 SS plates using the ASW process as well as influences of the welding current, welding time, and tip volume of the stud on the microstructure and tensile behaviors of the joints. Also, a detailed statistical study was executed using an artificial neural network (ANN) approach and a Taguchi approach with analysis of variance (ANOVA) analysis.

2. Materials and Methods

In this study, austenitic stainless steel studs with a diameter of 6 mm and length of 45 mm, and 304 austenitic stainless steel plates with a thickness of 5 mm and width of 50 mm were purchased locally and used without further treatment or modification.
A Soyer-BMK-16i type ASW machine (Heinz Soyer Bolzenschwei&technik GmbH, Munich, Germany) was used in this study. Argon gas with a constant flow rate of 5 liters per minute was chosen as a shield gas to protect the weld zone from oxidation and tarnishing.
Table 1 and Table 2 provide the compositions and mechanical properties of the stud and base metal materials, respectively, utilized in this study. The welding operation was carried out using different welding currents and times. Table 3 provides the maximum and minimum values of the welding parameters employed.
Lift and plunge values were adjusted as 3 and 2 mm in all tests, respectively. The tip volume of the stud (TVS) (V: mm3) was calculated using Equation (1):
V = 1 3 π ( ( sin ( 180 2 d 2 ) · ( h cos ( 180 2 d 2 ) ) ) 2 ) · h
where h is plunge, and d is the tip angle of the stud.
Lift is the distance between the stud tip and the surface of the workpiece when the stud is pulled away by the solenoid coil in the stud gun. Plunge is the length of the stud metal that appears at the end of the gas shroud ring. Plunge and tip angle significantly affect the tip volume of stud, but lift does not affect it. The increasing plunge value (h) increases the tip volume of the stud. However, the increasing tip angle (d) value decreases the tip volume of the stud. In other words, if the “d” value reaches zero, then the maximum value of the tip volume of the stud is obtained. Following the welding process, the prepared specimens were sectioned by cutting them from the middle of the stud metal using a wire electrical discharge machine (EDM) (Carmar accuracy Co., Ltd., Taichung, Taiwan), and then they were ground and polished for surface microstructural studies. After the grinding and polishing process, the specimens were also etched using a modified Keller’s reagent (10 mL HNO3, 1.5 mL HCl, 1.0 mL HF, and 87.5 mL distilled water) in order to obtain clear images. An optical microscope (Nikon MA 100, Nikon, Tokyo‎, Japan) was used to examine the microstructures. In order to evaluate the weld quality, tensile tests were conducted on the samples using a universal tensile test machine and performed according to the ISO 14555 standard. Three tensile tests were carried out, and the average of results was reported.

3. Results

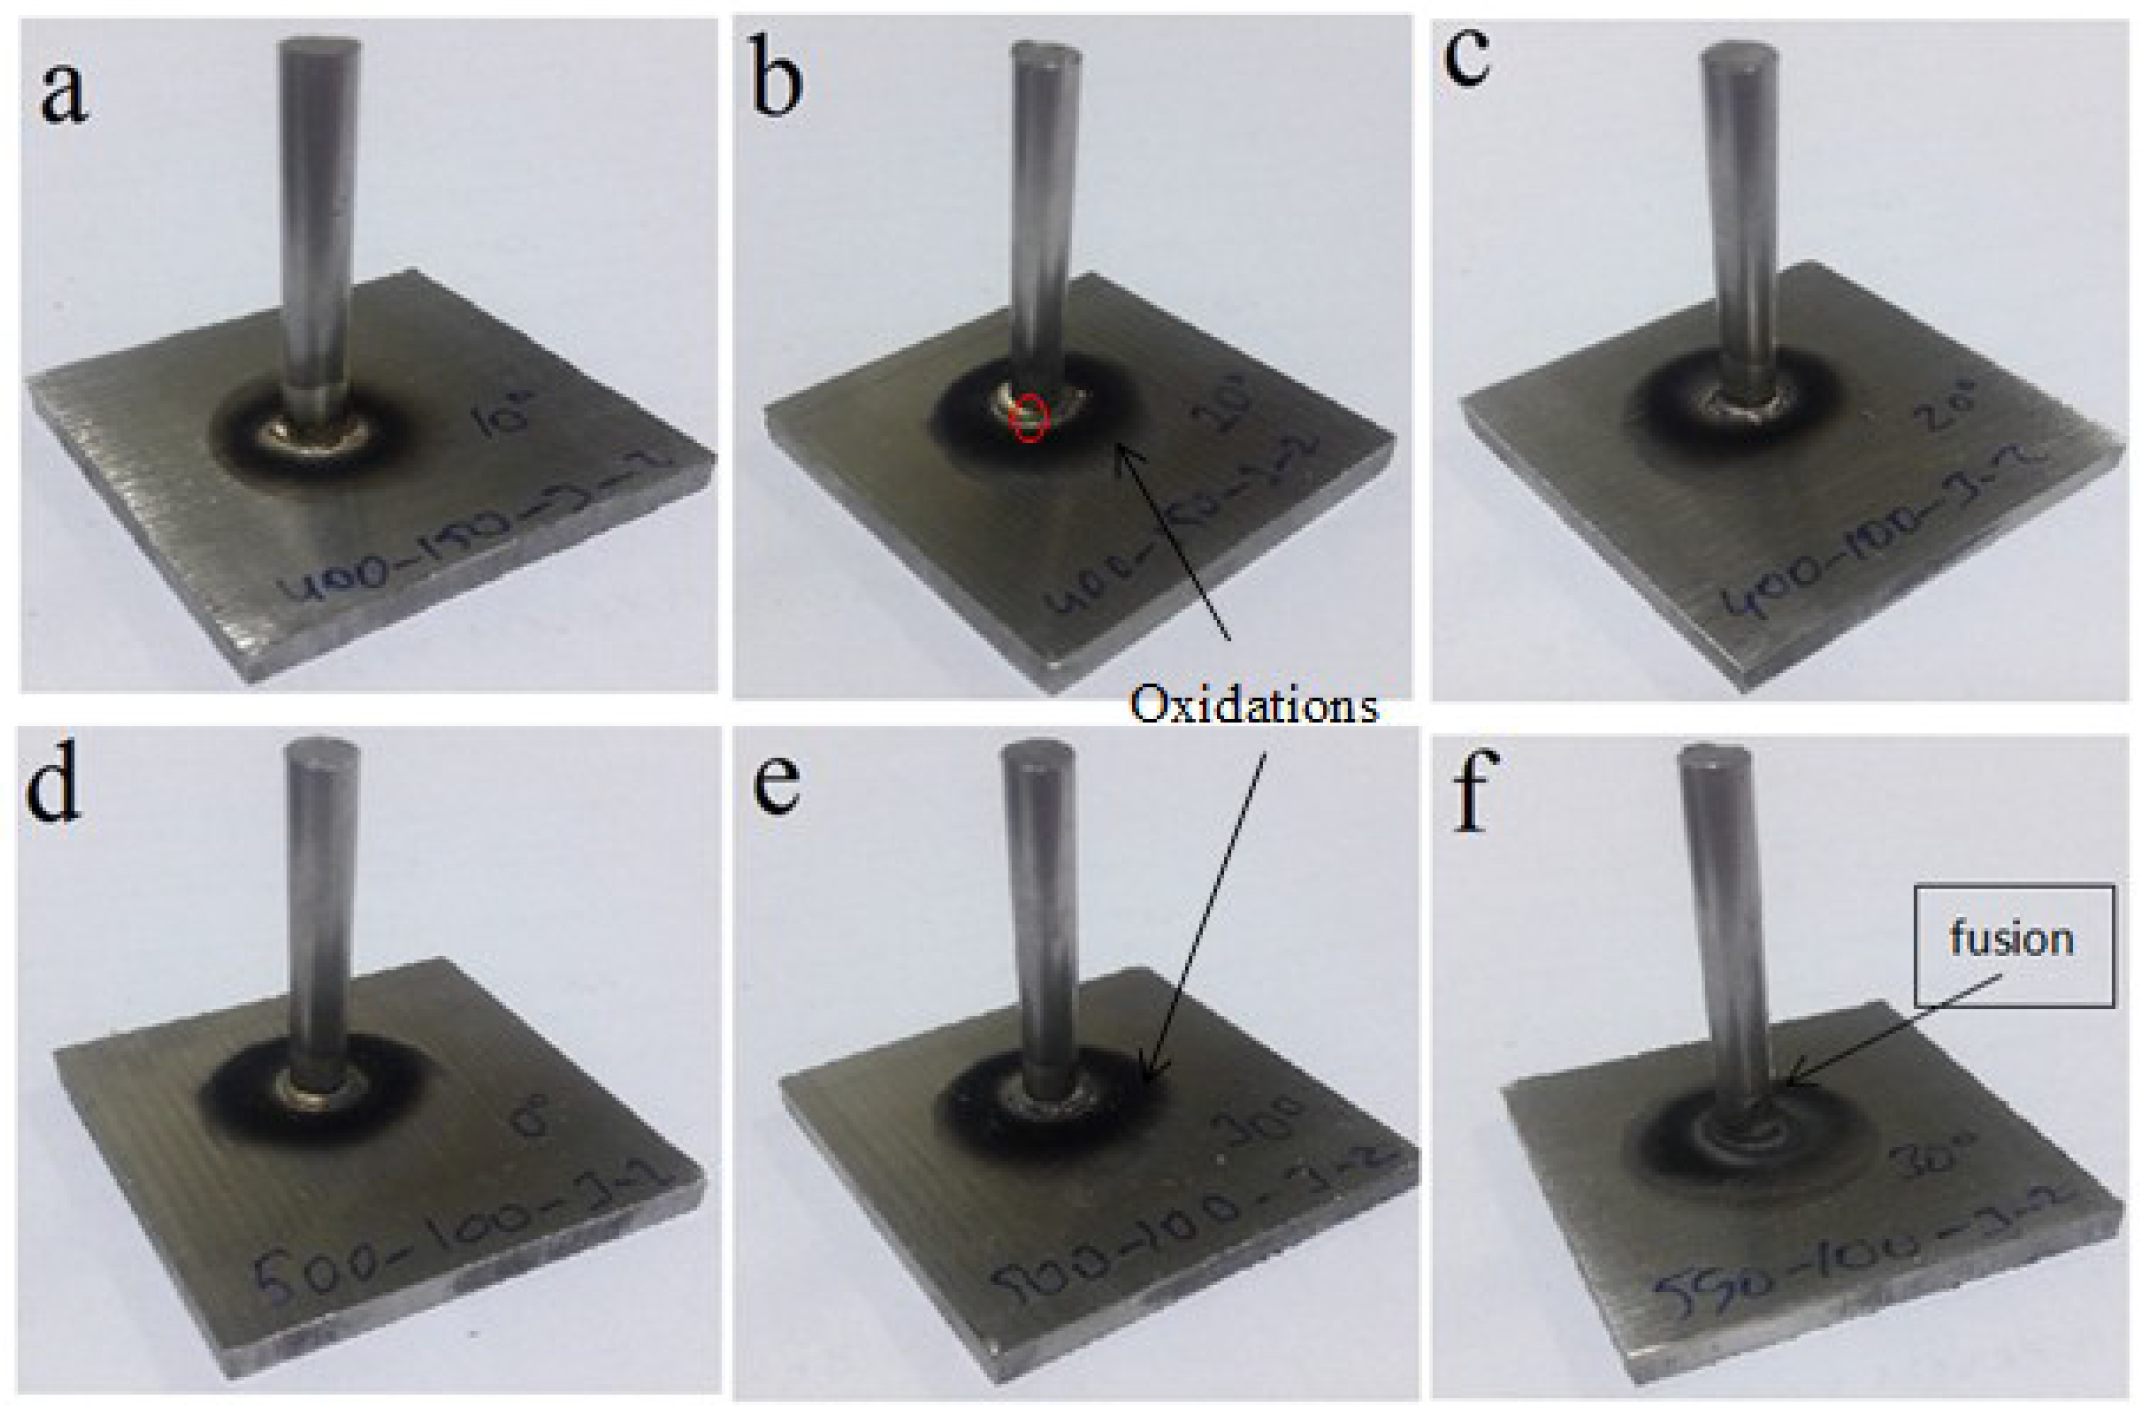
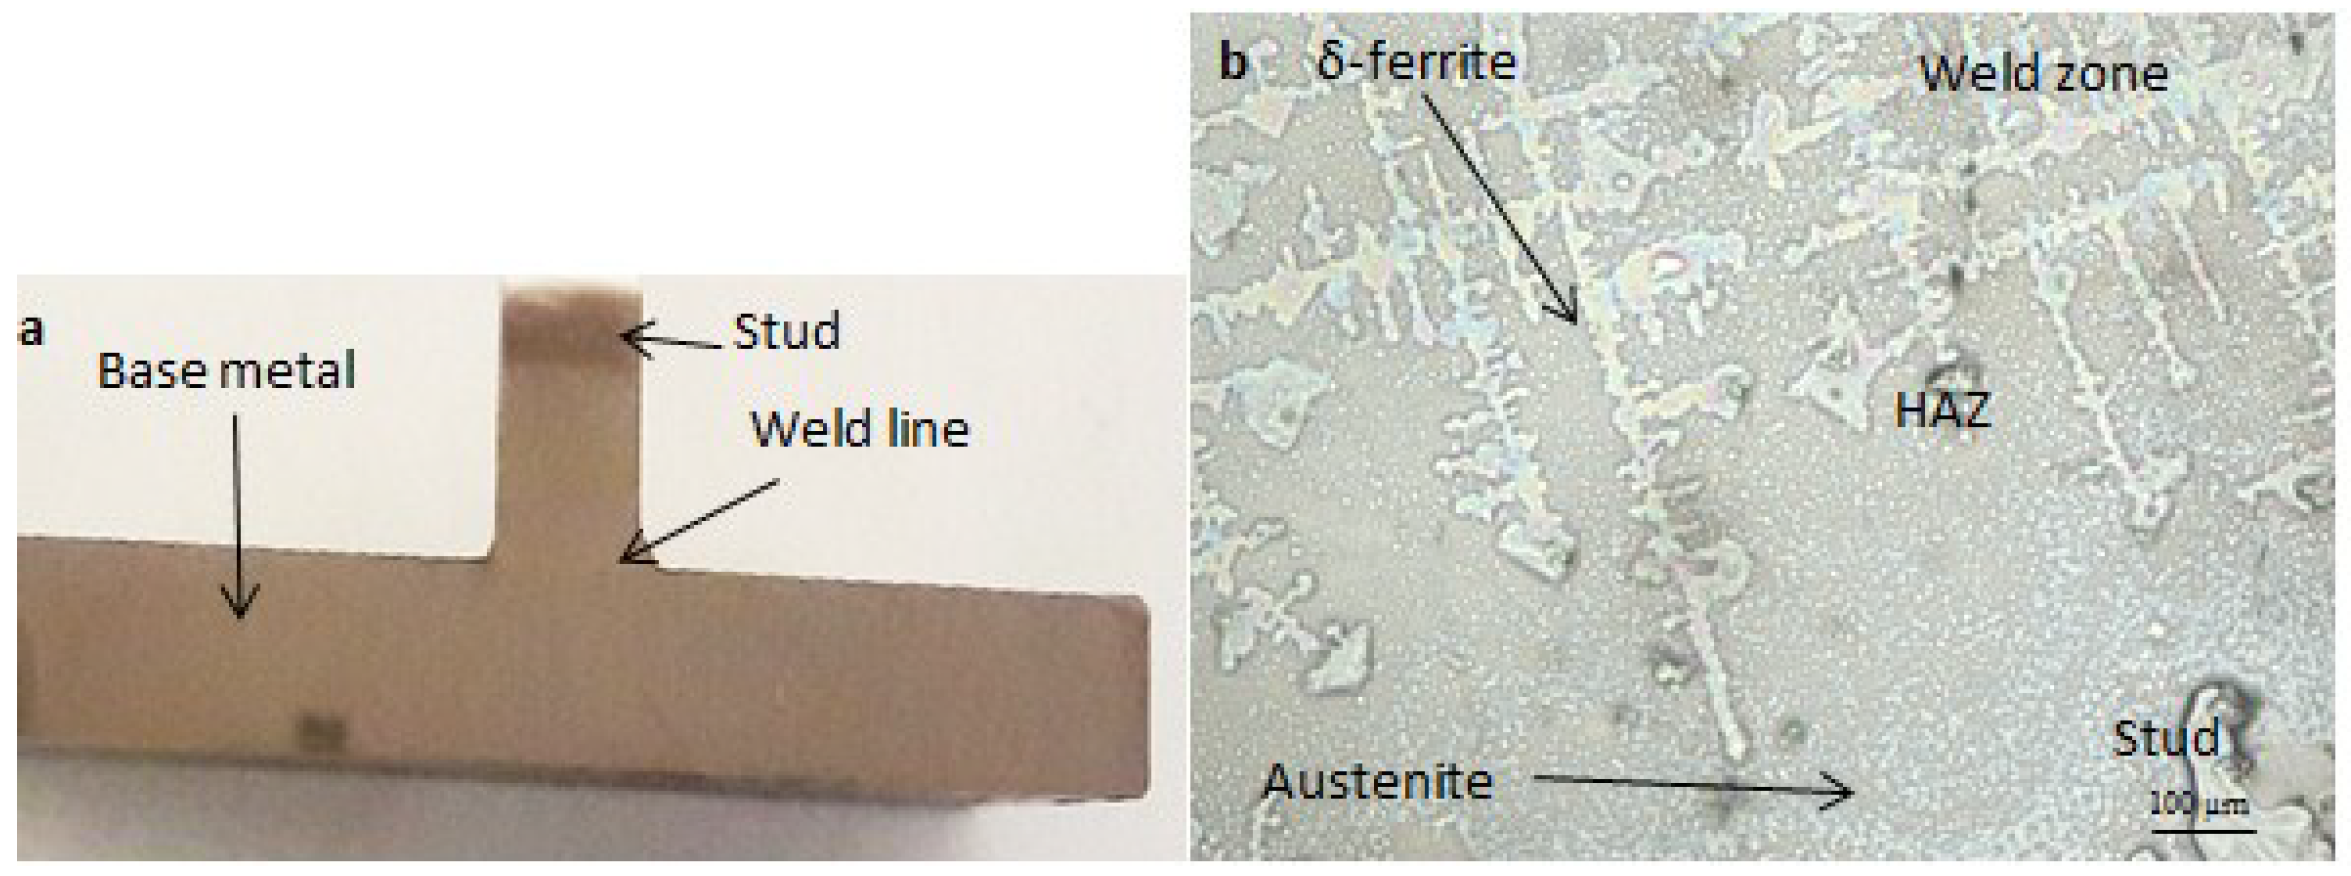
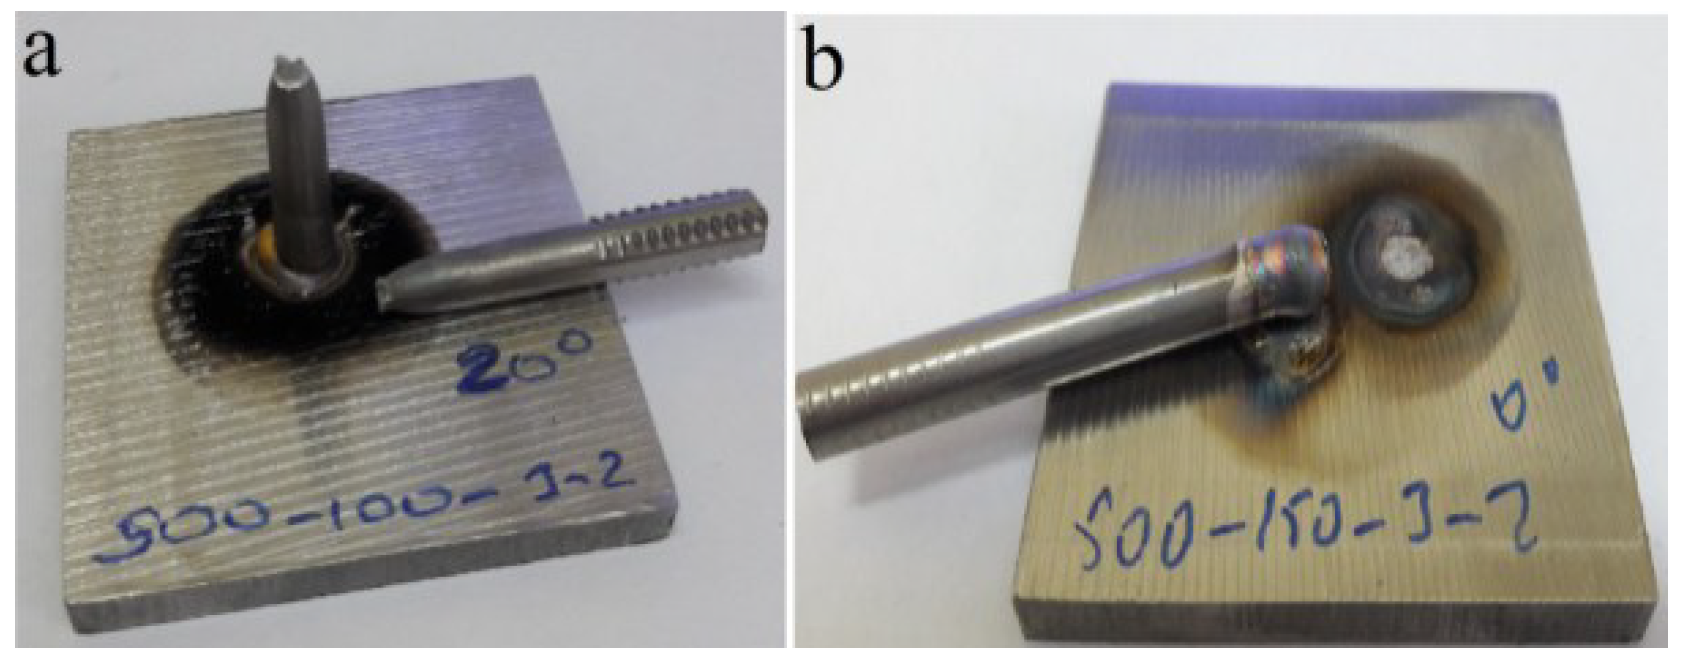
3.1. Macro-Micro Structures of Welds

Figure 1 shows macroscopic views of some welded specimens at different welding parameters. Visual inspection with the naked eye did not reveal many macroscopic defects and other flaws on the prepared weld samples. Because of the high welding current, the welding zone of the sample (Figure 1f) is higher than the other samples, as is clearly shown by excessive fusion of the stud.
Figure 2 exhibits the cross-sectional image and microstructure of the specimen 400-0.15-3-2 shown previously in Figure 1b.
The cross-sectional image and the microstructure shown in Figure 2 belong to the specimen with the maximum tensile strength. Noticeable defects were not observed on the cross-section images of this sample (Figure 2a). In this welding experiment, three distinct regions were clearly observed: base metal, heat-affected zone (HAZ), and welding zone, also known as the weld metal and fusion zone, as indicated in Figure 2b. The width of the HAZ is relatively narrow compared to zones of the other welding processes conducted on the specimens. A dendritic structure was also detected along the HAZ towards the center of the weld, which may indicate some structural changes on the surface.

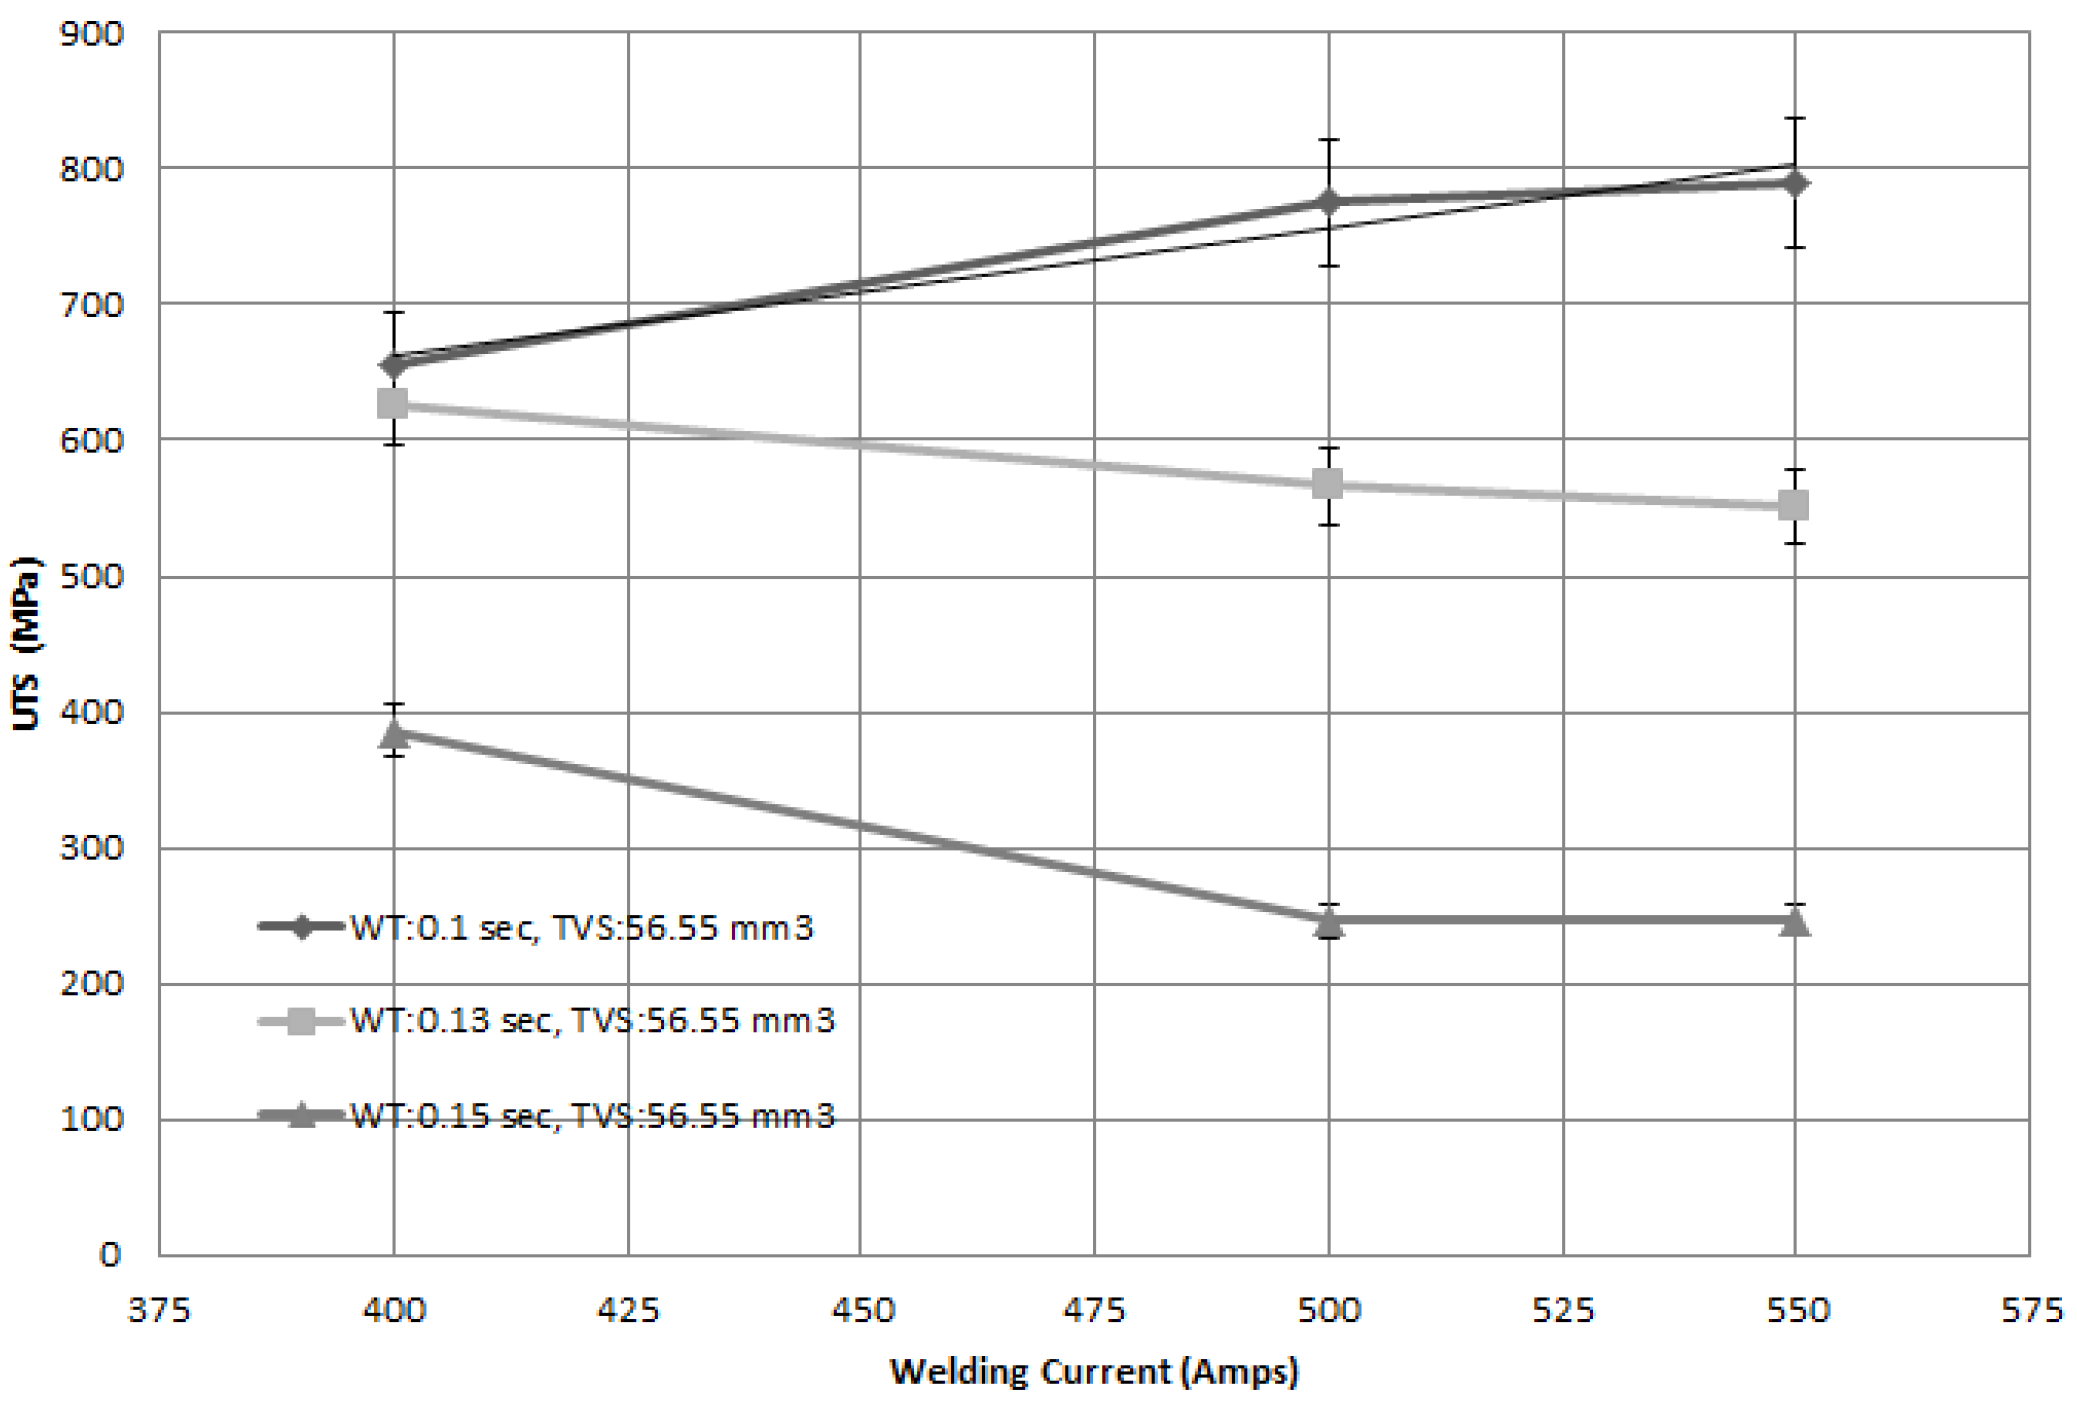
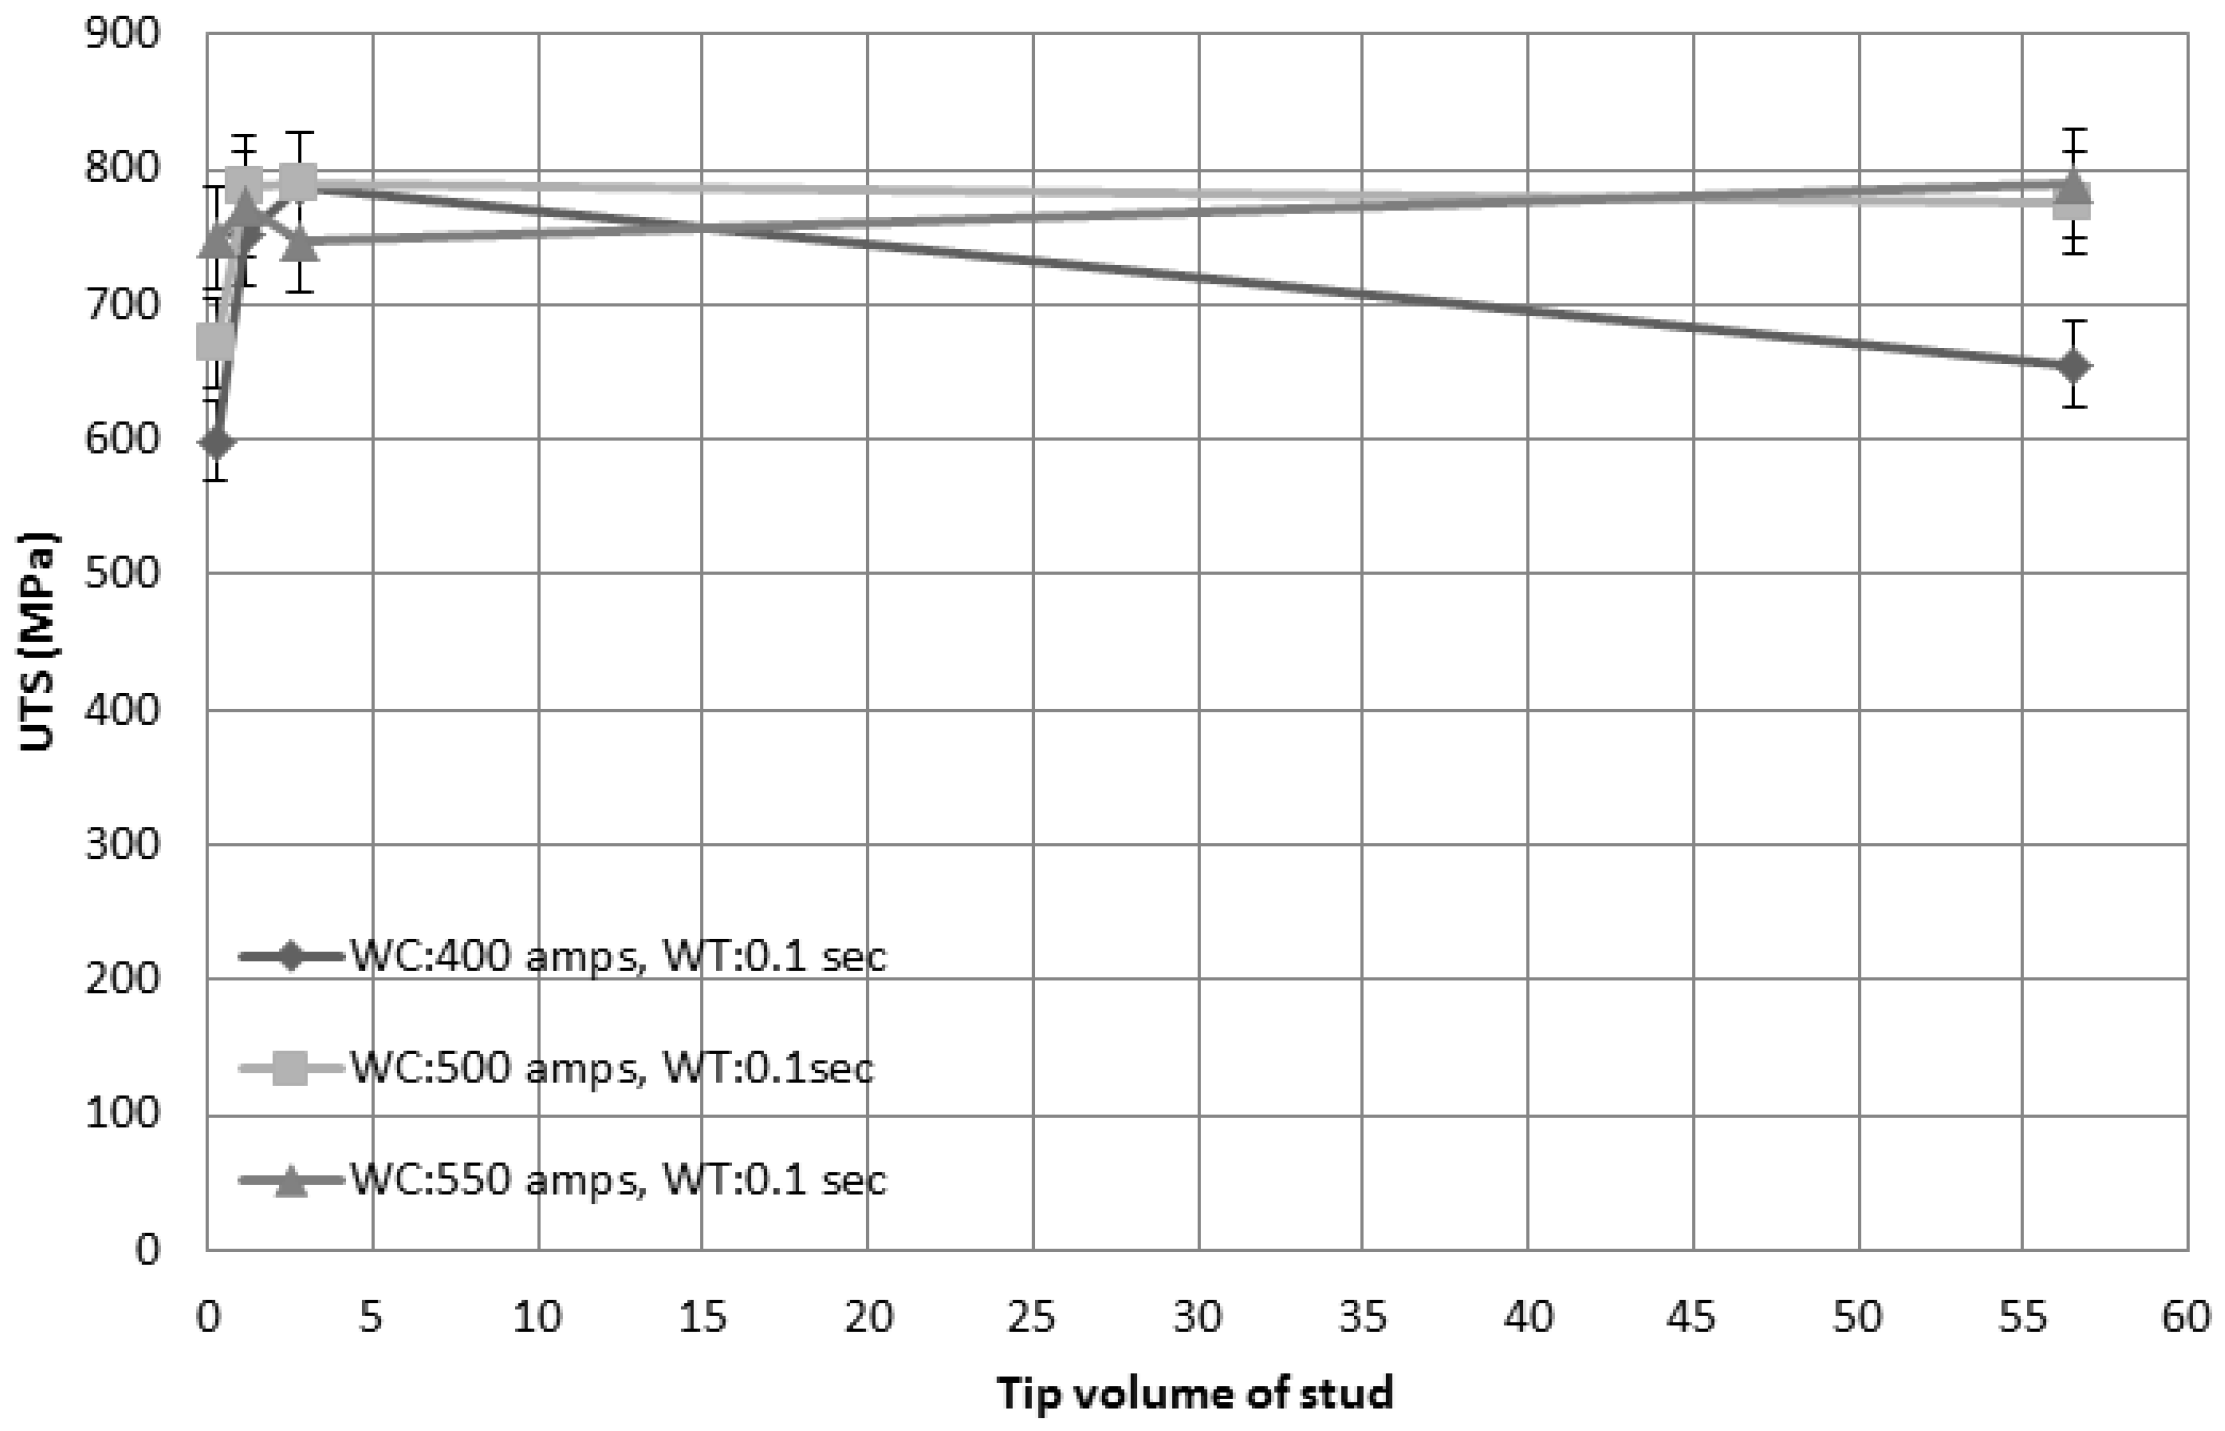
3.2. Mechanical Properties

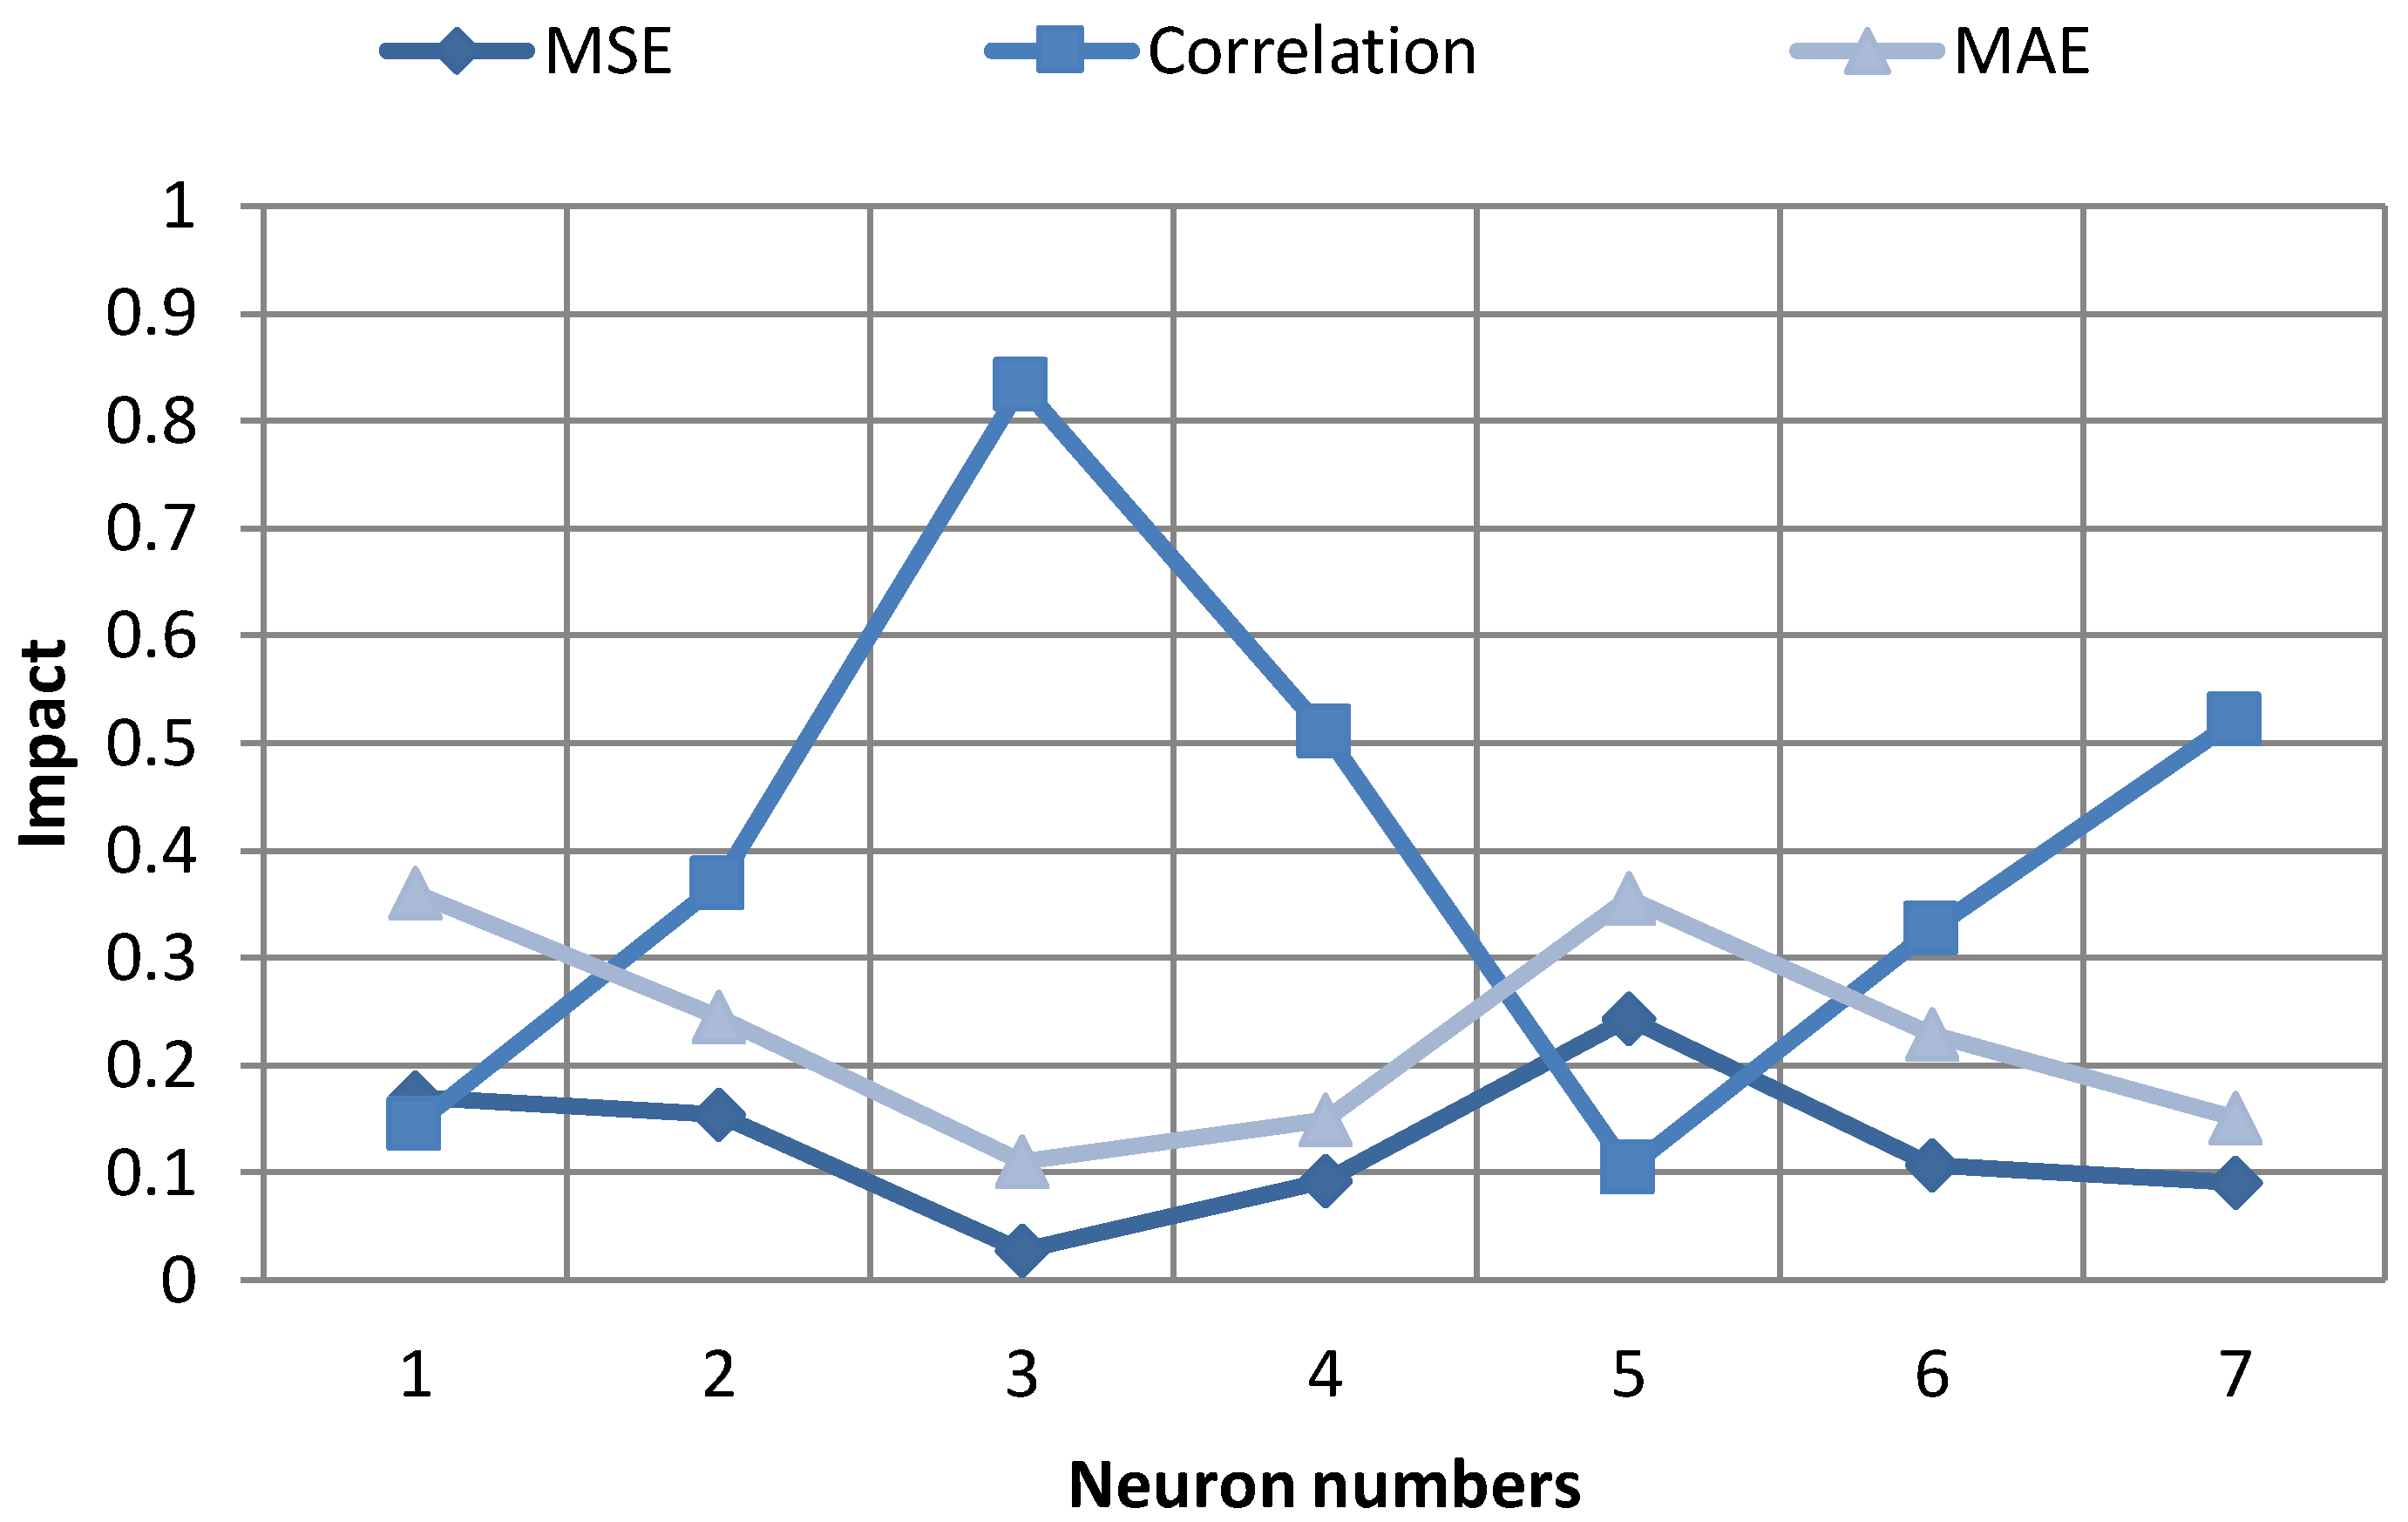
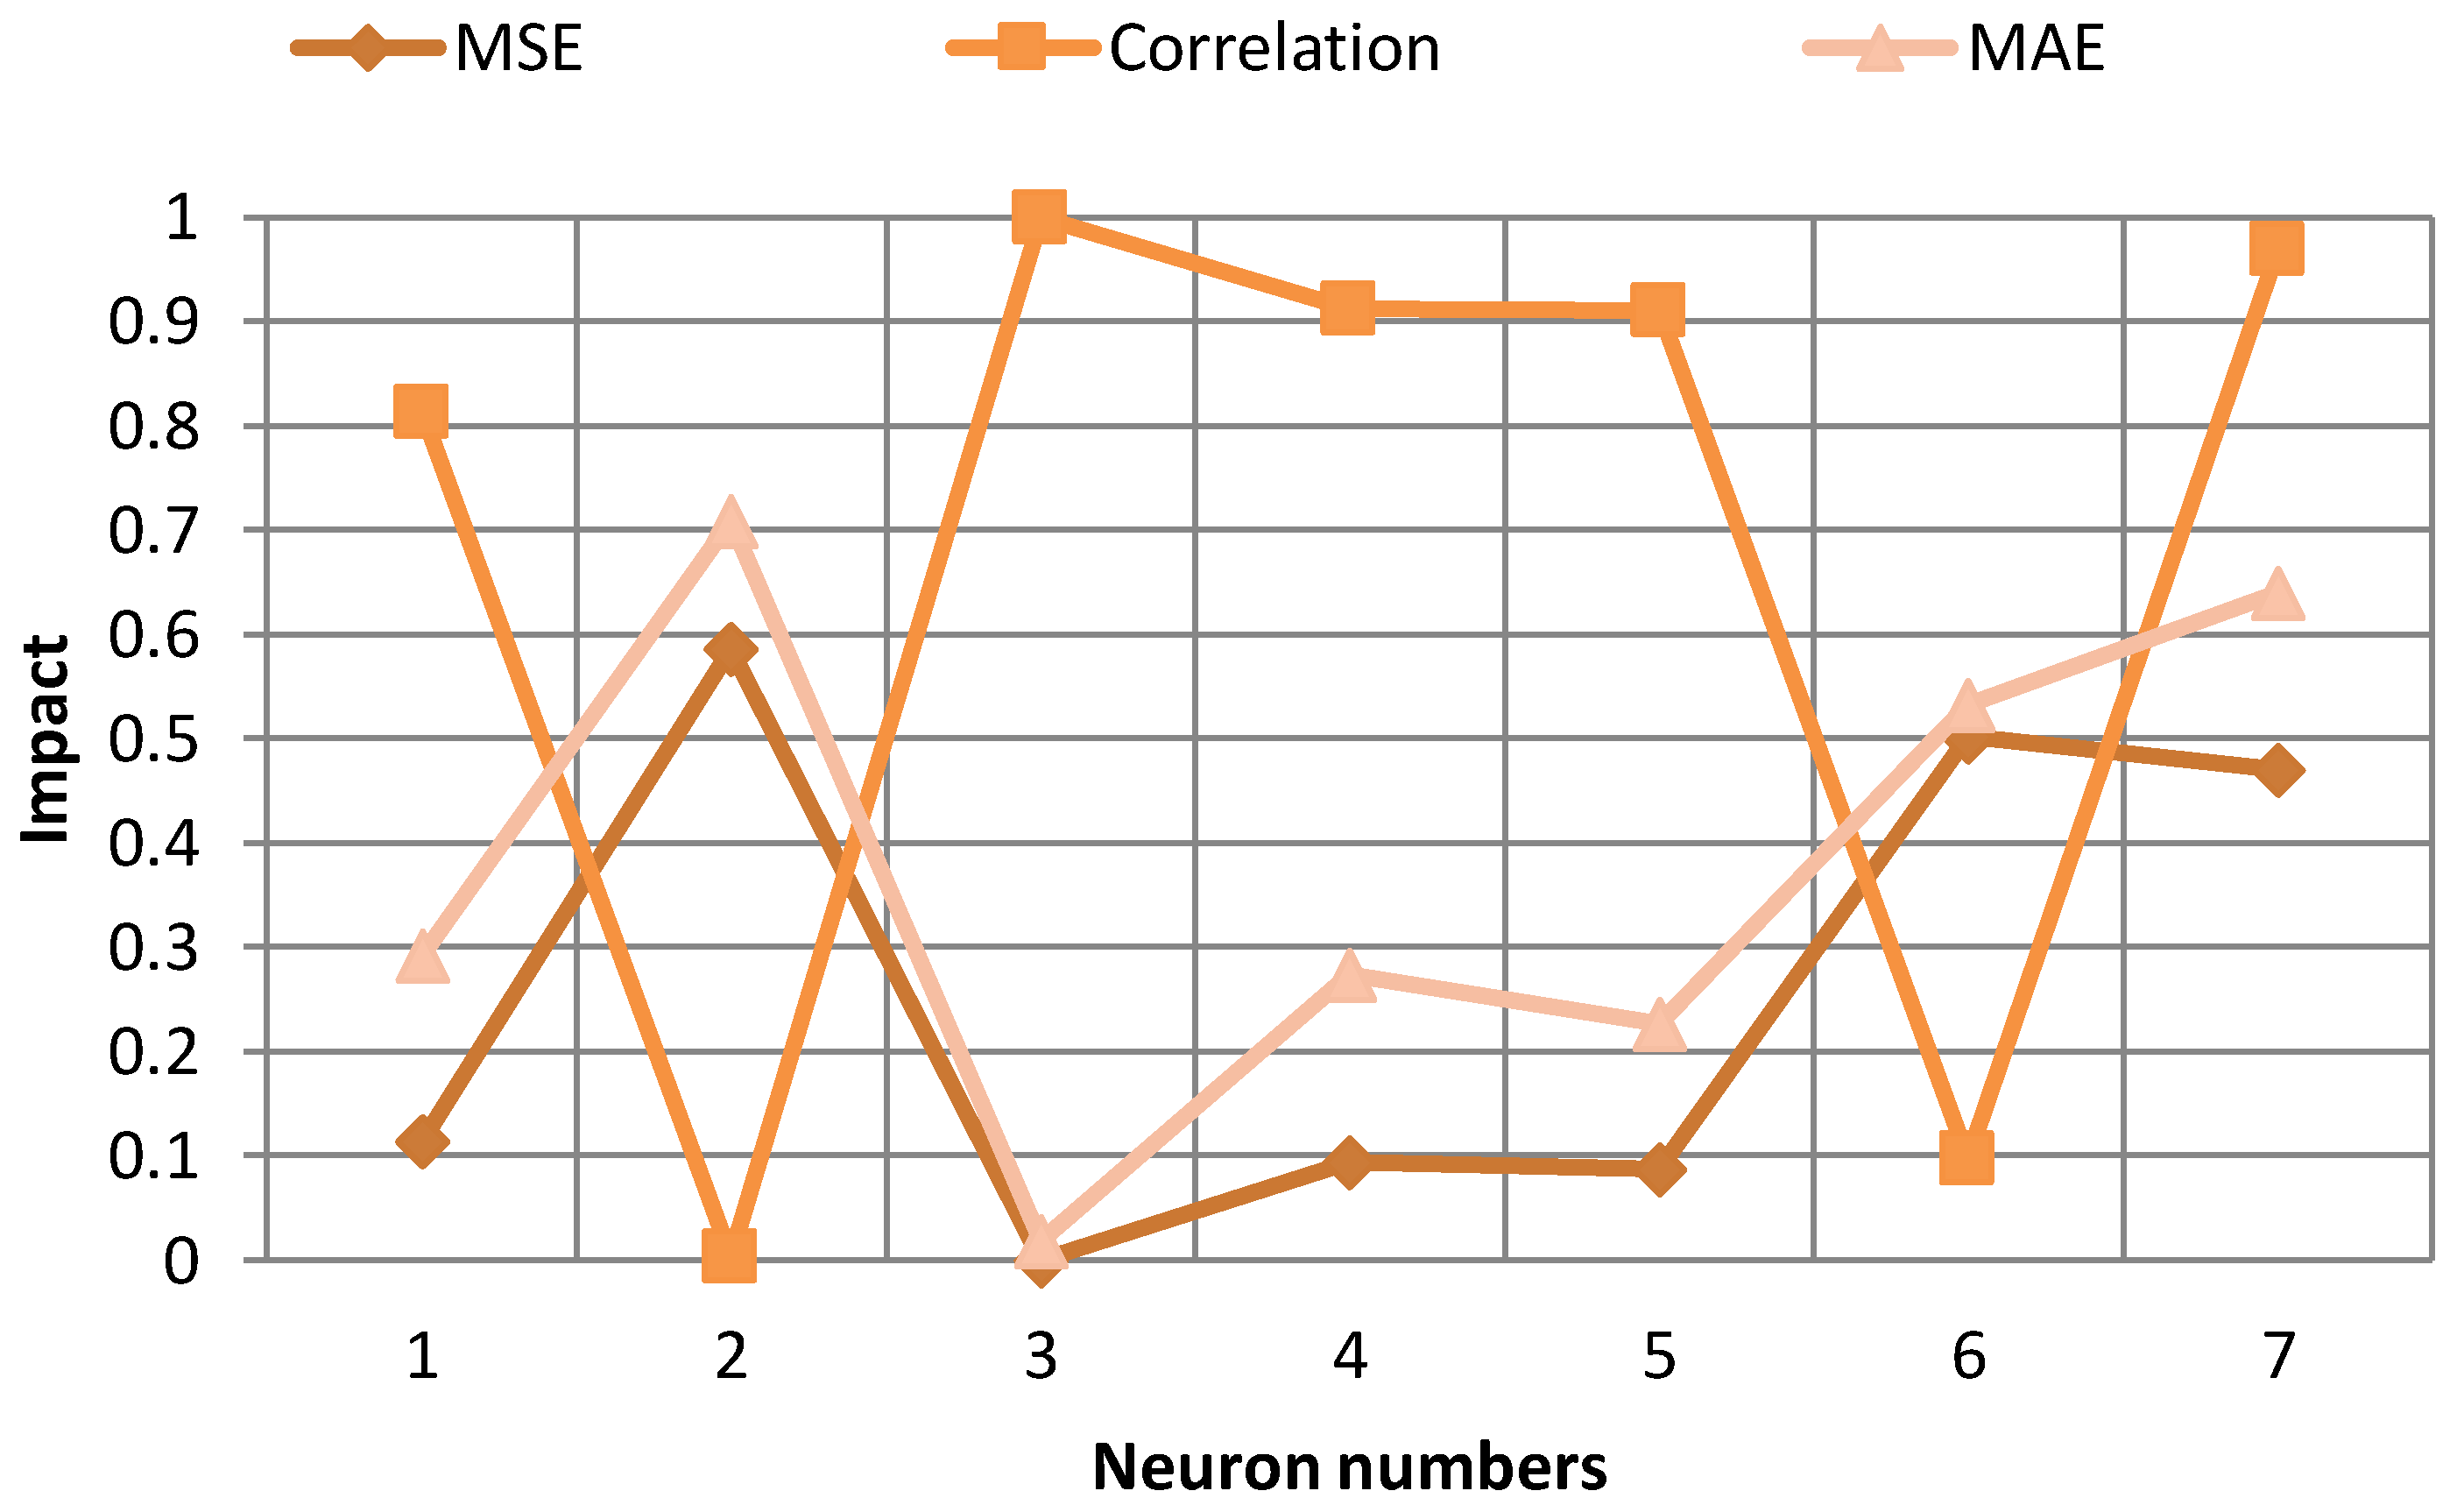
3.2.1. Neural Network Approach

In the neural network approach, tensile test results were divided into two groups of data sets: training (75%) and testing (25%). The input variables included welding current (WC; amps), welding time (WT; s), and tip volume of the stud (TVS; mm3), so the final output variable is the ultimate tensile strength (UTS) of the prepared samples. All parameters were normalized in the range of 0 to 1.0 using Equation (2):
θ normalized = v r v min v max v min
where vr is the variables, and vmax and vmin are the maximum and minimum values in the model, respectively.
Various neuron numbers (1–7) were used to fix the model architecture, when error-evaluation criteria were utilized from the mean square error (MSE), mean absolute error (MAE), and mean absolute percentage error (MAPE). The correlation coefficient (R) was used to calculate the model performance. Explanations about the layers, R, MAE, MAPE, and MSE have been provided in detail in other studies [17,18,19]. Figure 3 and Figure 4 provide the influences of neuron numbers for training and test sets, respectively.
For the training set, the minimum MSE and MAE values are 0.0274 and 0.1098, respectively, while the maximum correlation value is 0.8323. For the test set, the minimum MSE and MAE values are 0.0007 and 0.019, respectively, whereas the maximum correlation value is 0.9992. Equation (3) shows the explicit formulation of ultimate tensile strength for the welds as a function of welding parameters. This equation was procured using a macro value in MATLAB program. It could be written down that the proposed explicit formulation is forced for the given ranges of the experiments.
UTS = 543 . 28 × ( 1 1 + e - w ) + 246 . 46
where w is the u1 + u2 + u3 + 1.0144, in which u1, u2, and u3 are the empirical values given below:
  • u1 = (((1.0/(1.0 + exp(−1.0 × (((x) × (14.0987)) + ((y) × (−10.1375)) + ((z) × (−22.6694)) + (10.7274))))) × (25.5146)))
  • u2 = (((1.0/(1.0 + exp(−1.0 × (((x) × (−1.5550)) + ((y) × (−7.7413)) + ((z) × (−11.2698)) + (2.0932))))) × (−19.3582)))
  • u3 = (((1.0/(1.0 + exp(−1.0 × (((x) × (2.1121)) + ((y) × (6.3599)) + ((z) × (−7.9340)) + (−0.2742))))) × (−13.6633)))
where x, y, and z are normalized input data of the welding current, welding time, and tip volume of the stud.
Figure 5, Figure 6 and Figure 7 illustrate the effects of various welding parameters on the ultimate tensile strength of the welded joints.
It was observed that the optimum experimental results of welding time, welding current, and tip volume of the stud in all cases were found for 0.13 s, 400 amps, and 2.79 mm3, respectively. It can also be seen that the rise of both welding current and welding time together deteriorates the tensile results of the welds. UTS values of some samples were very high, and fracture in some of the prepared specimens occurred at the stud, as shown in Figure 8a. Fracture in other specimens also took place at the weld zone (Figure 8b).

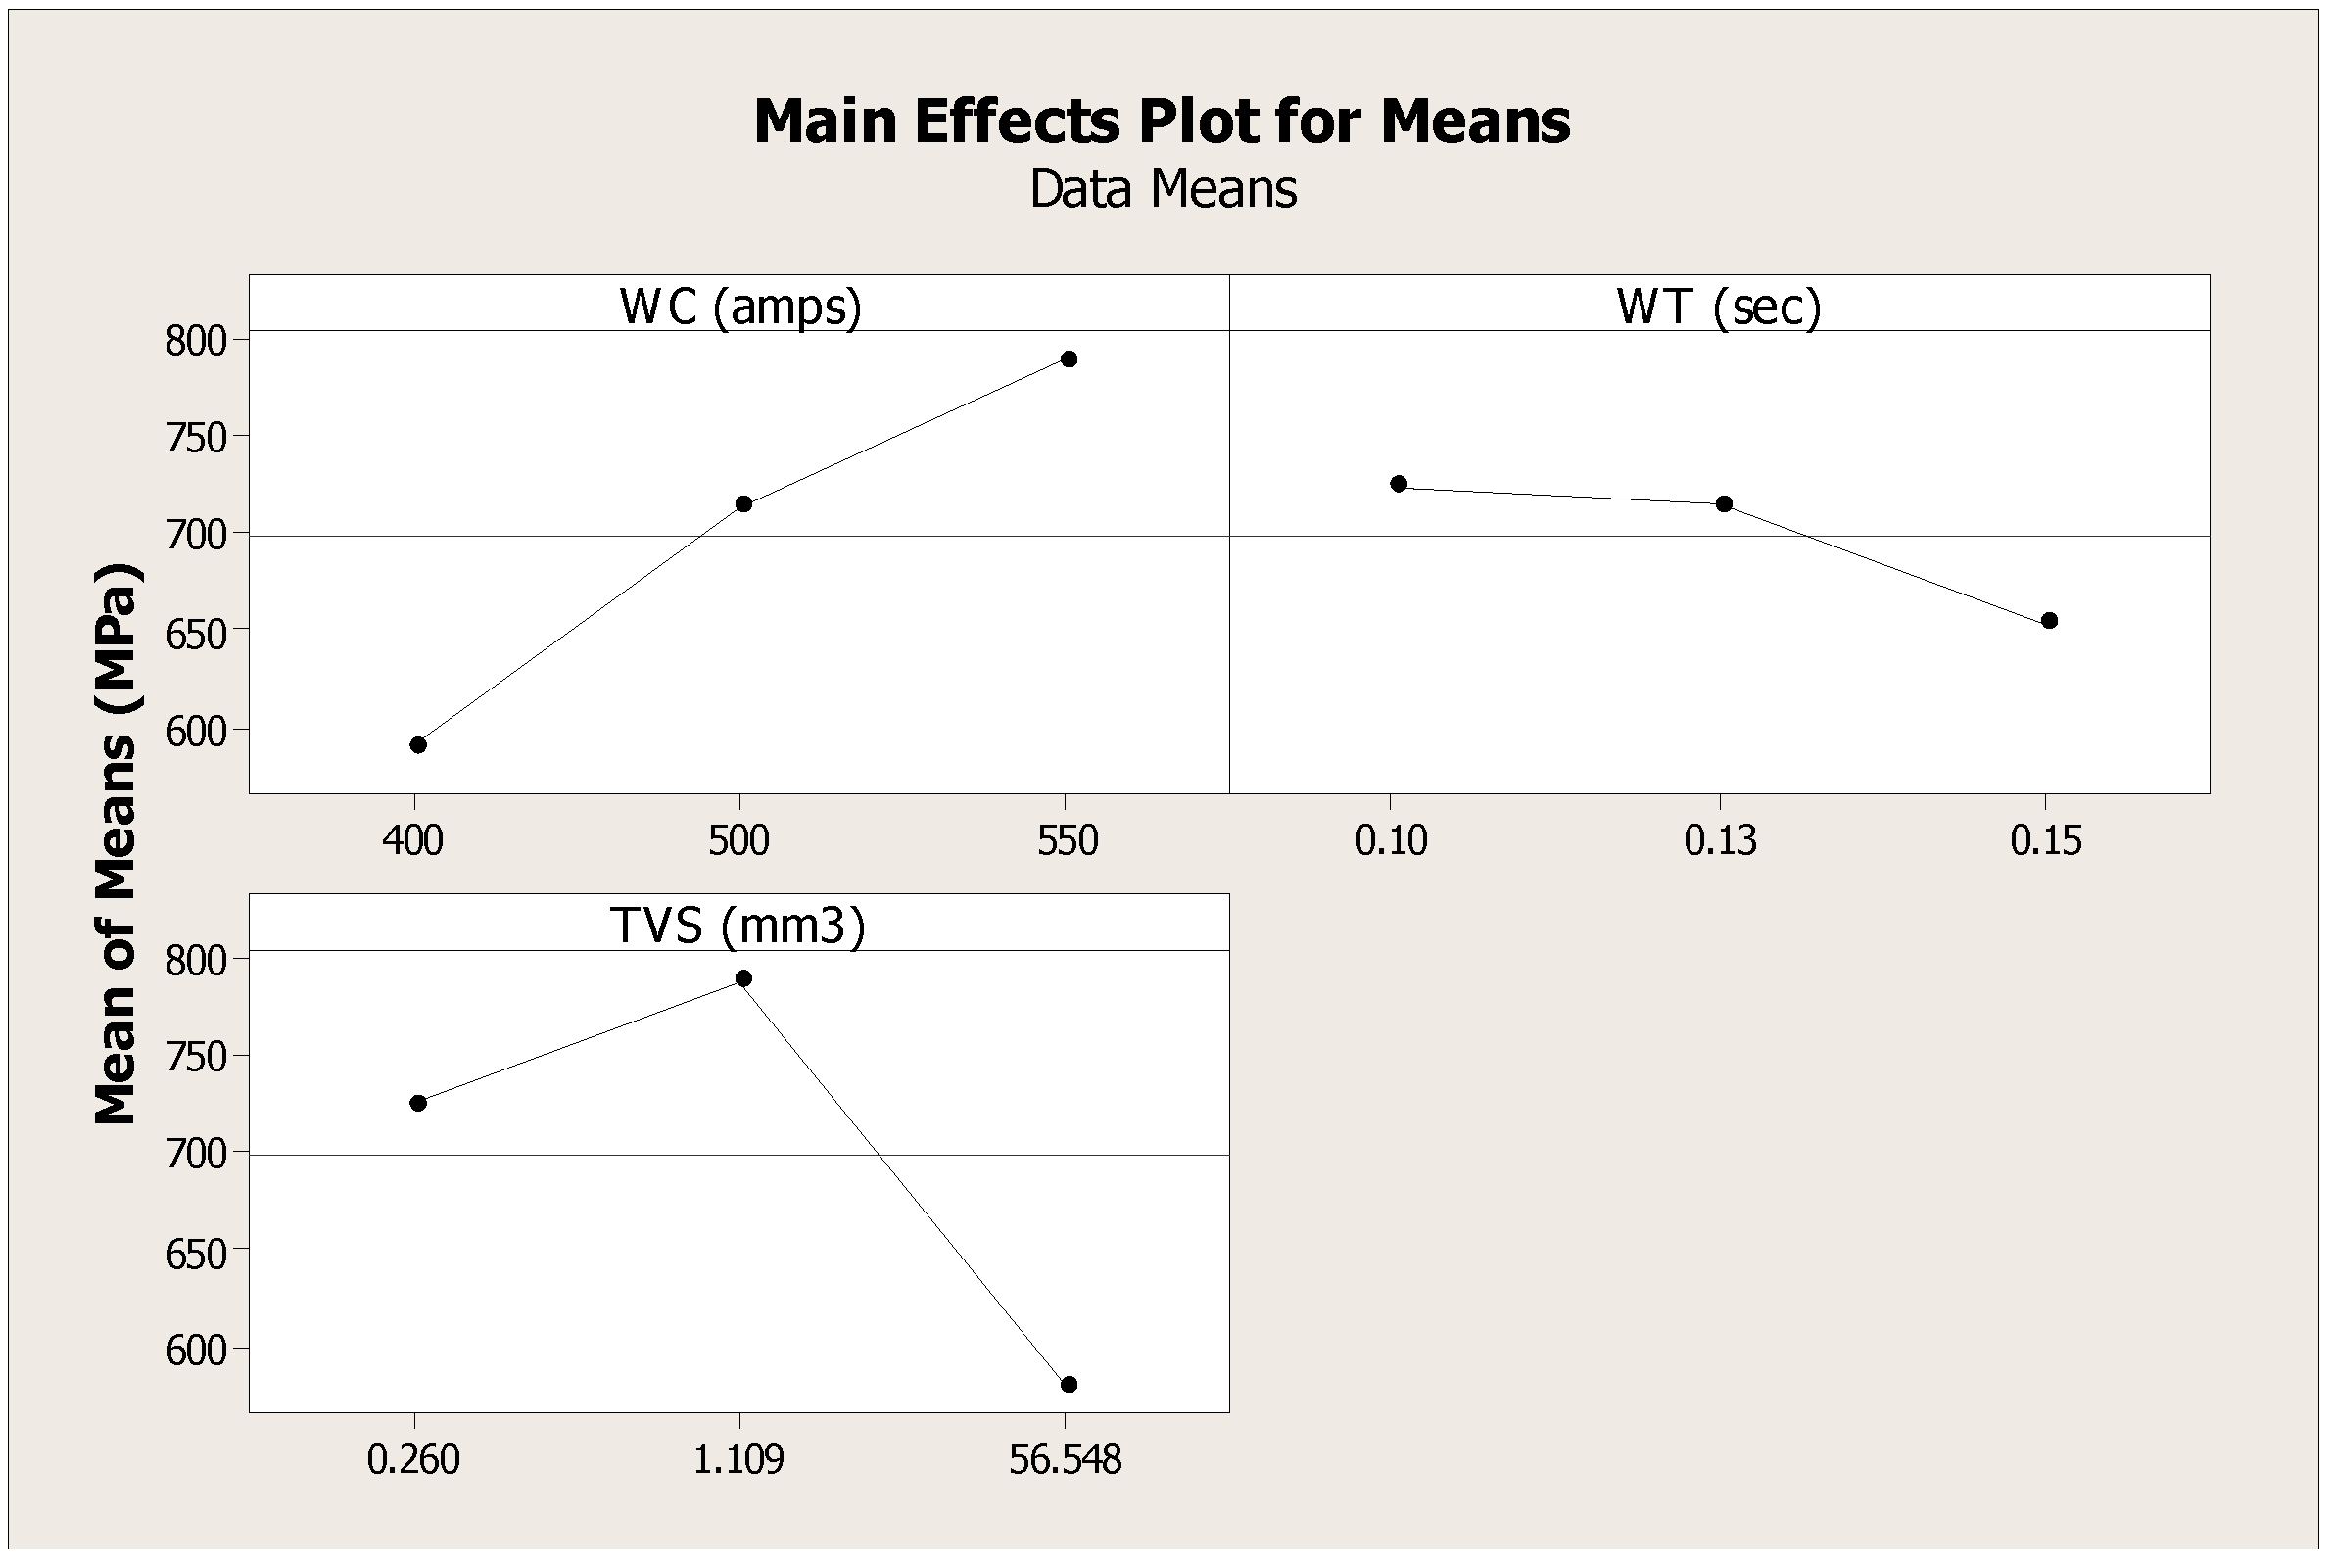
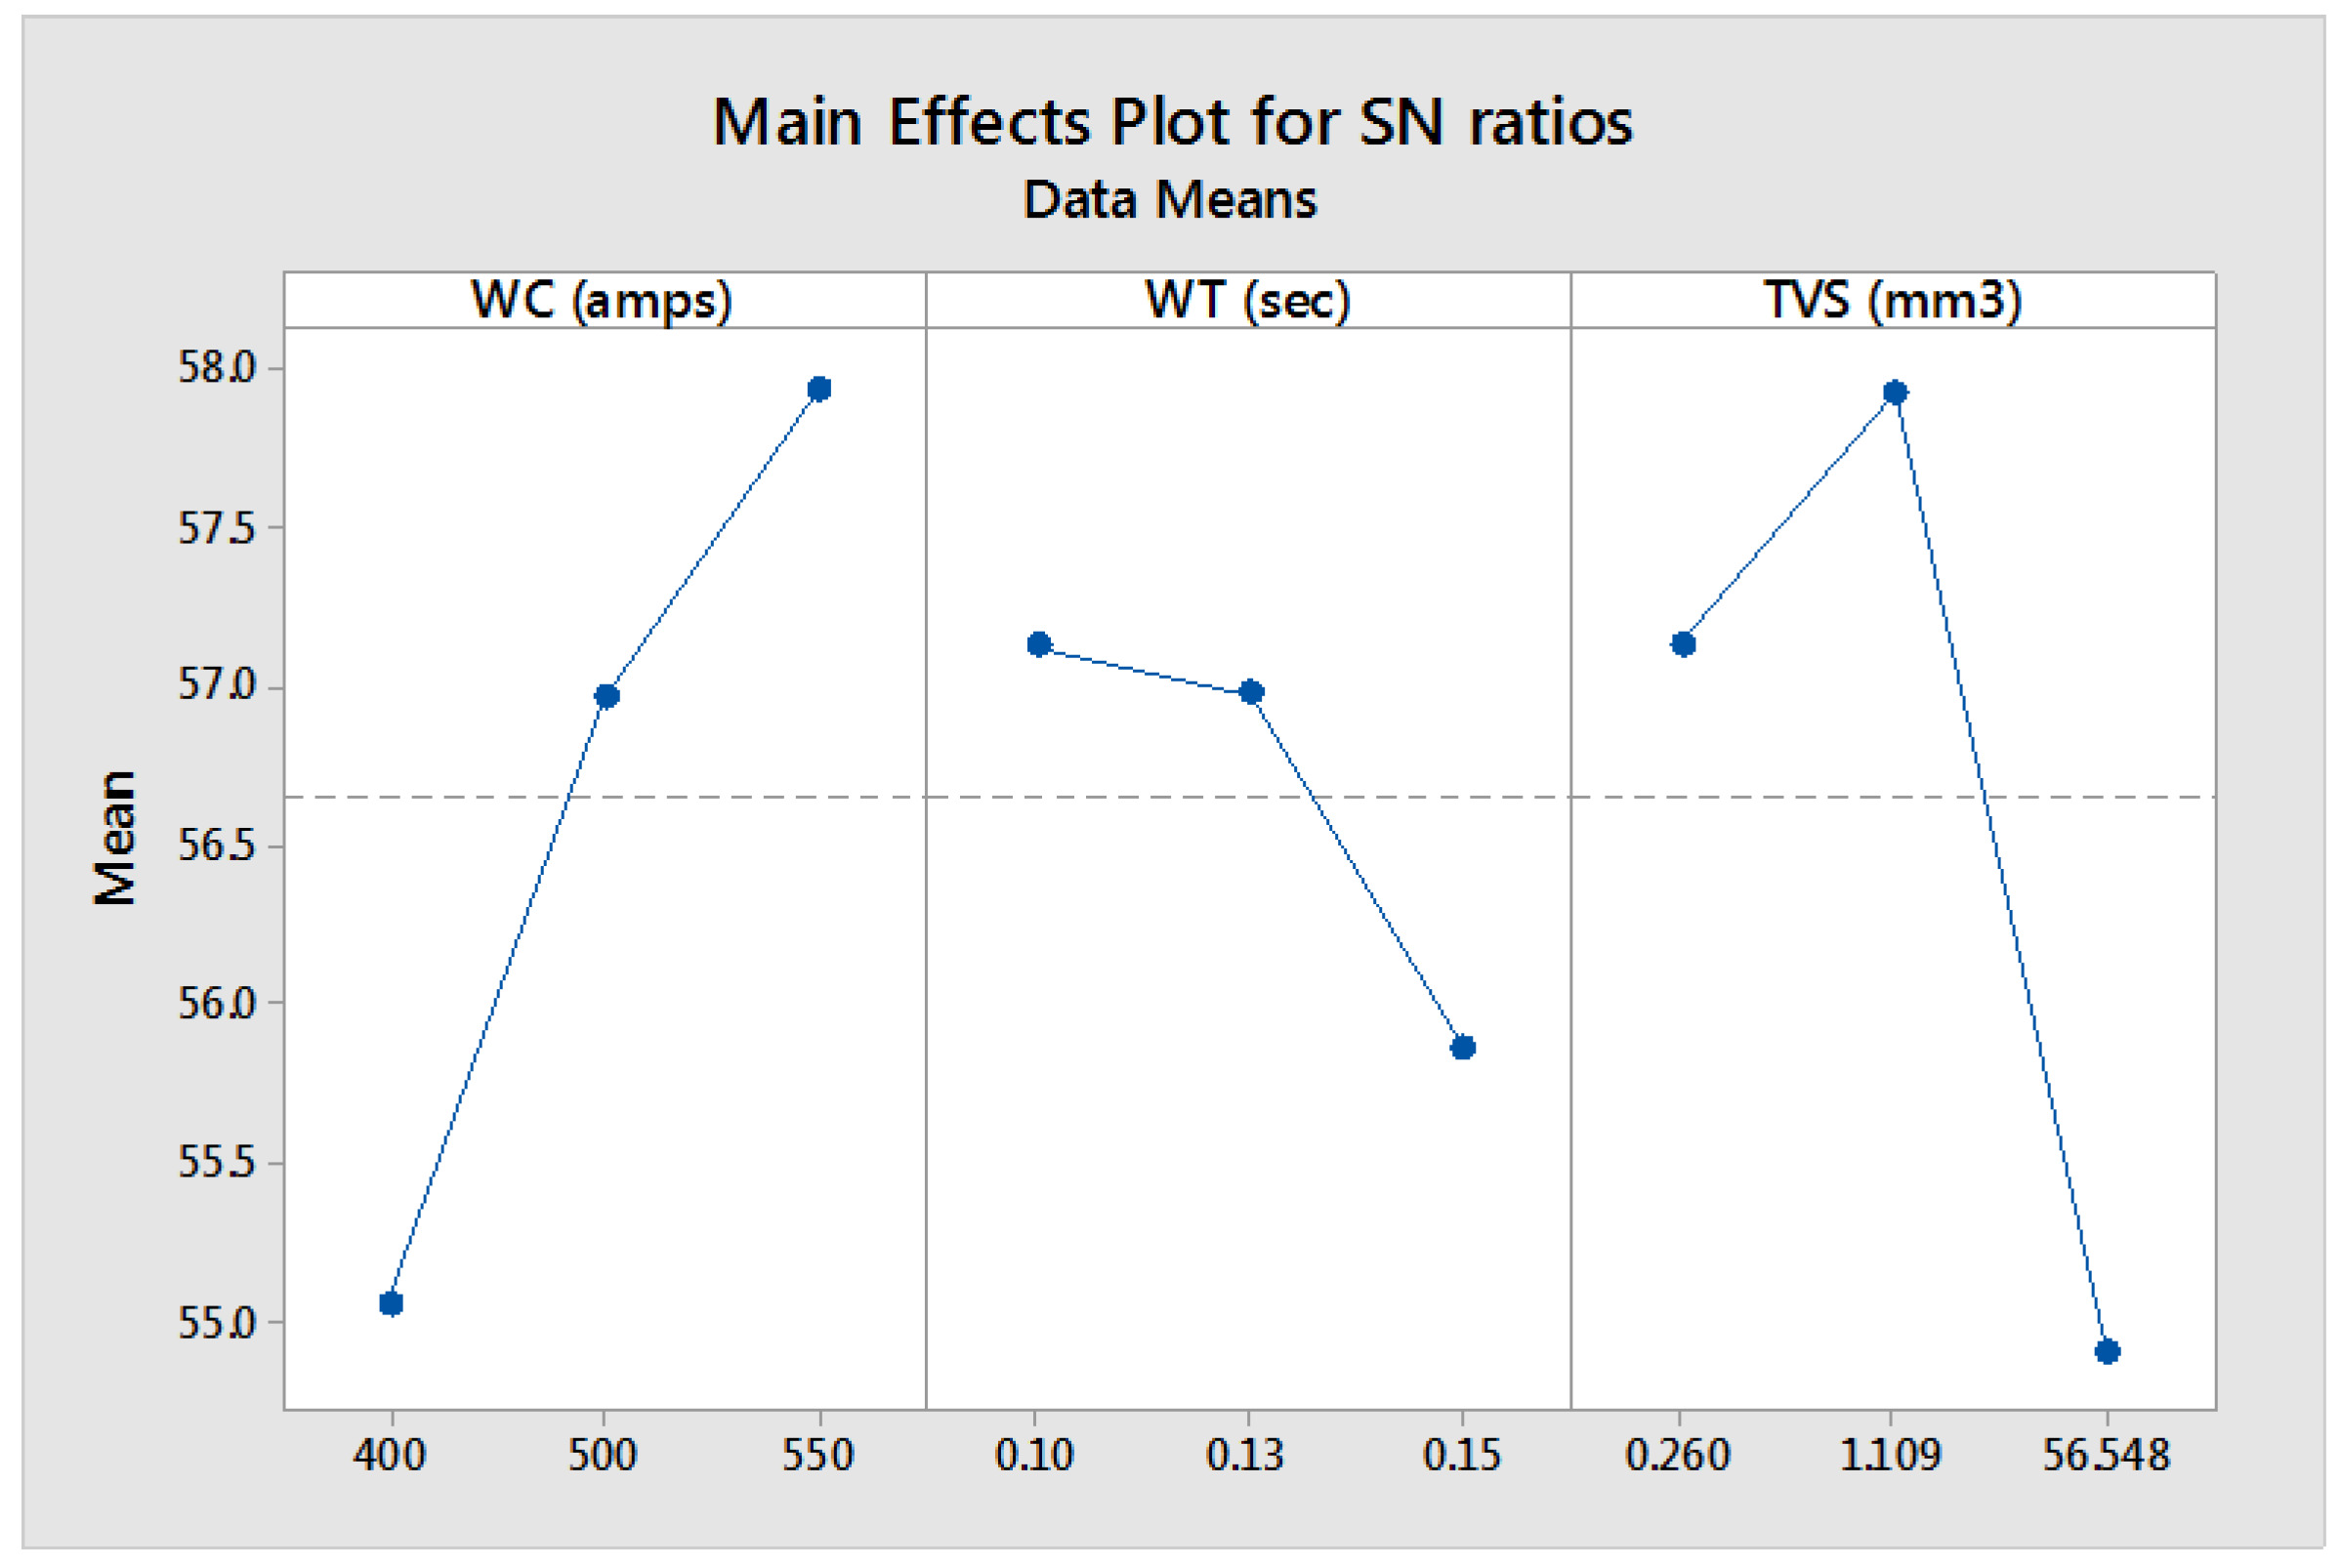
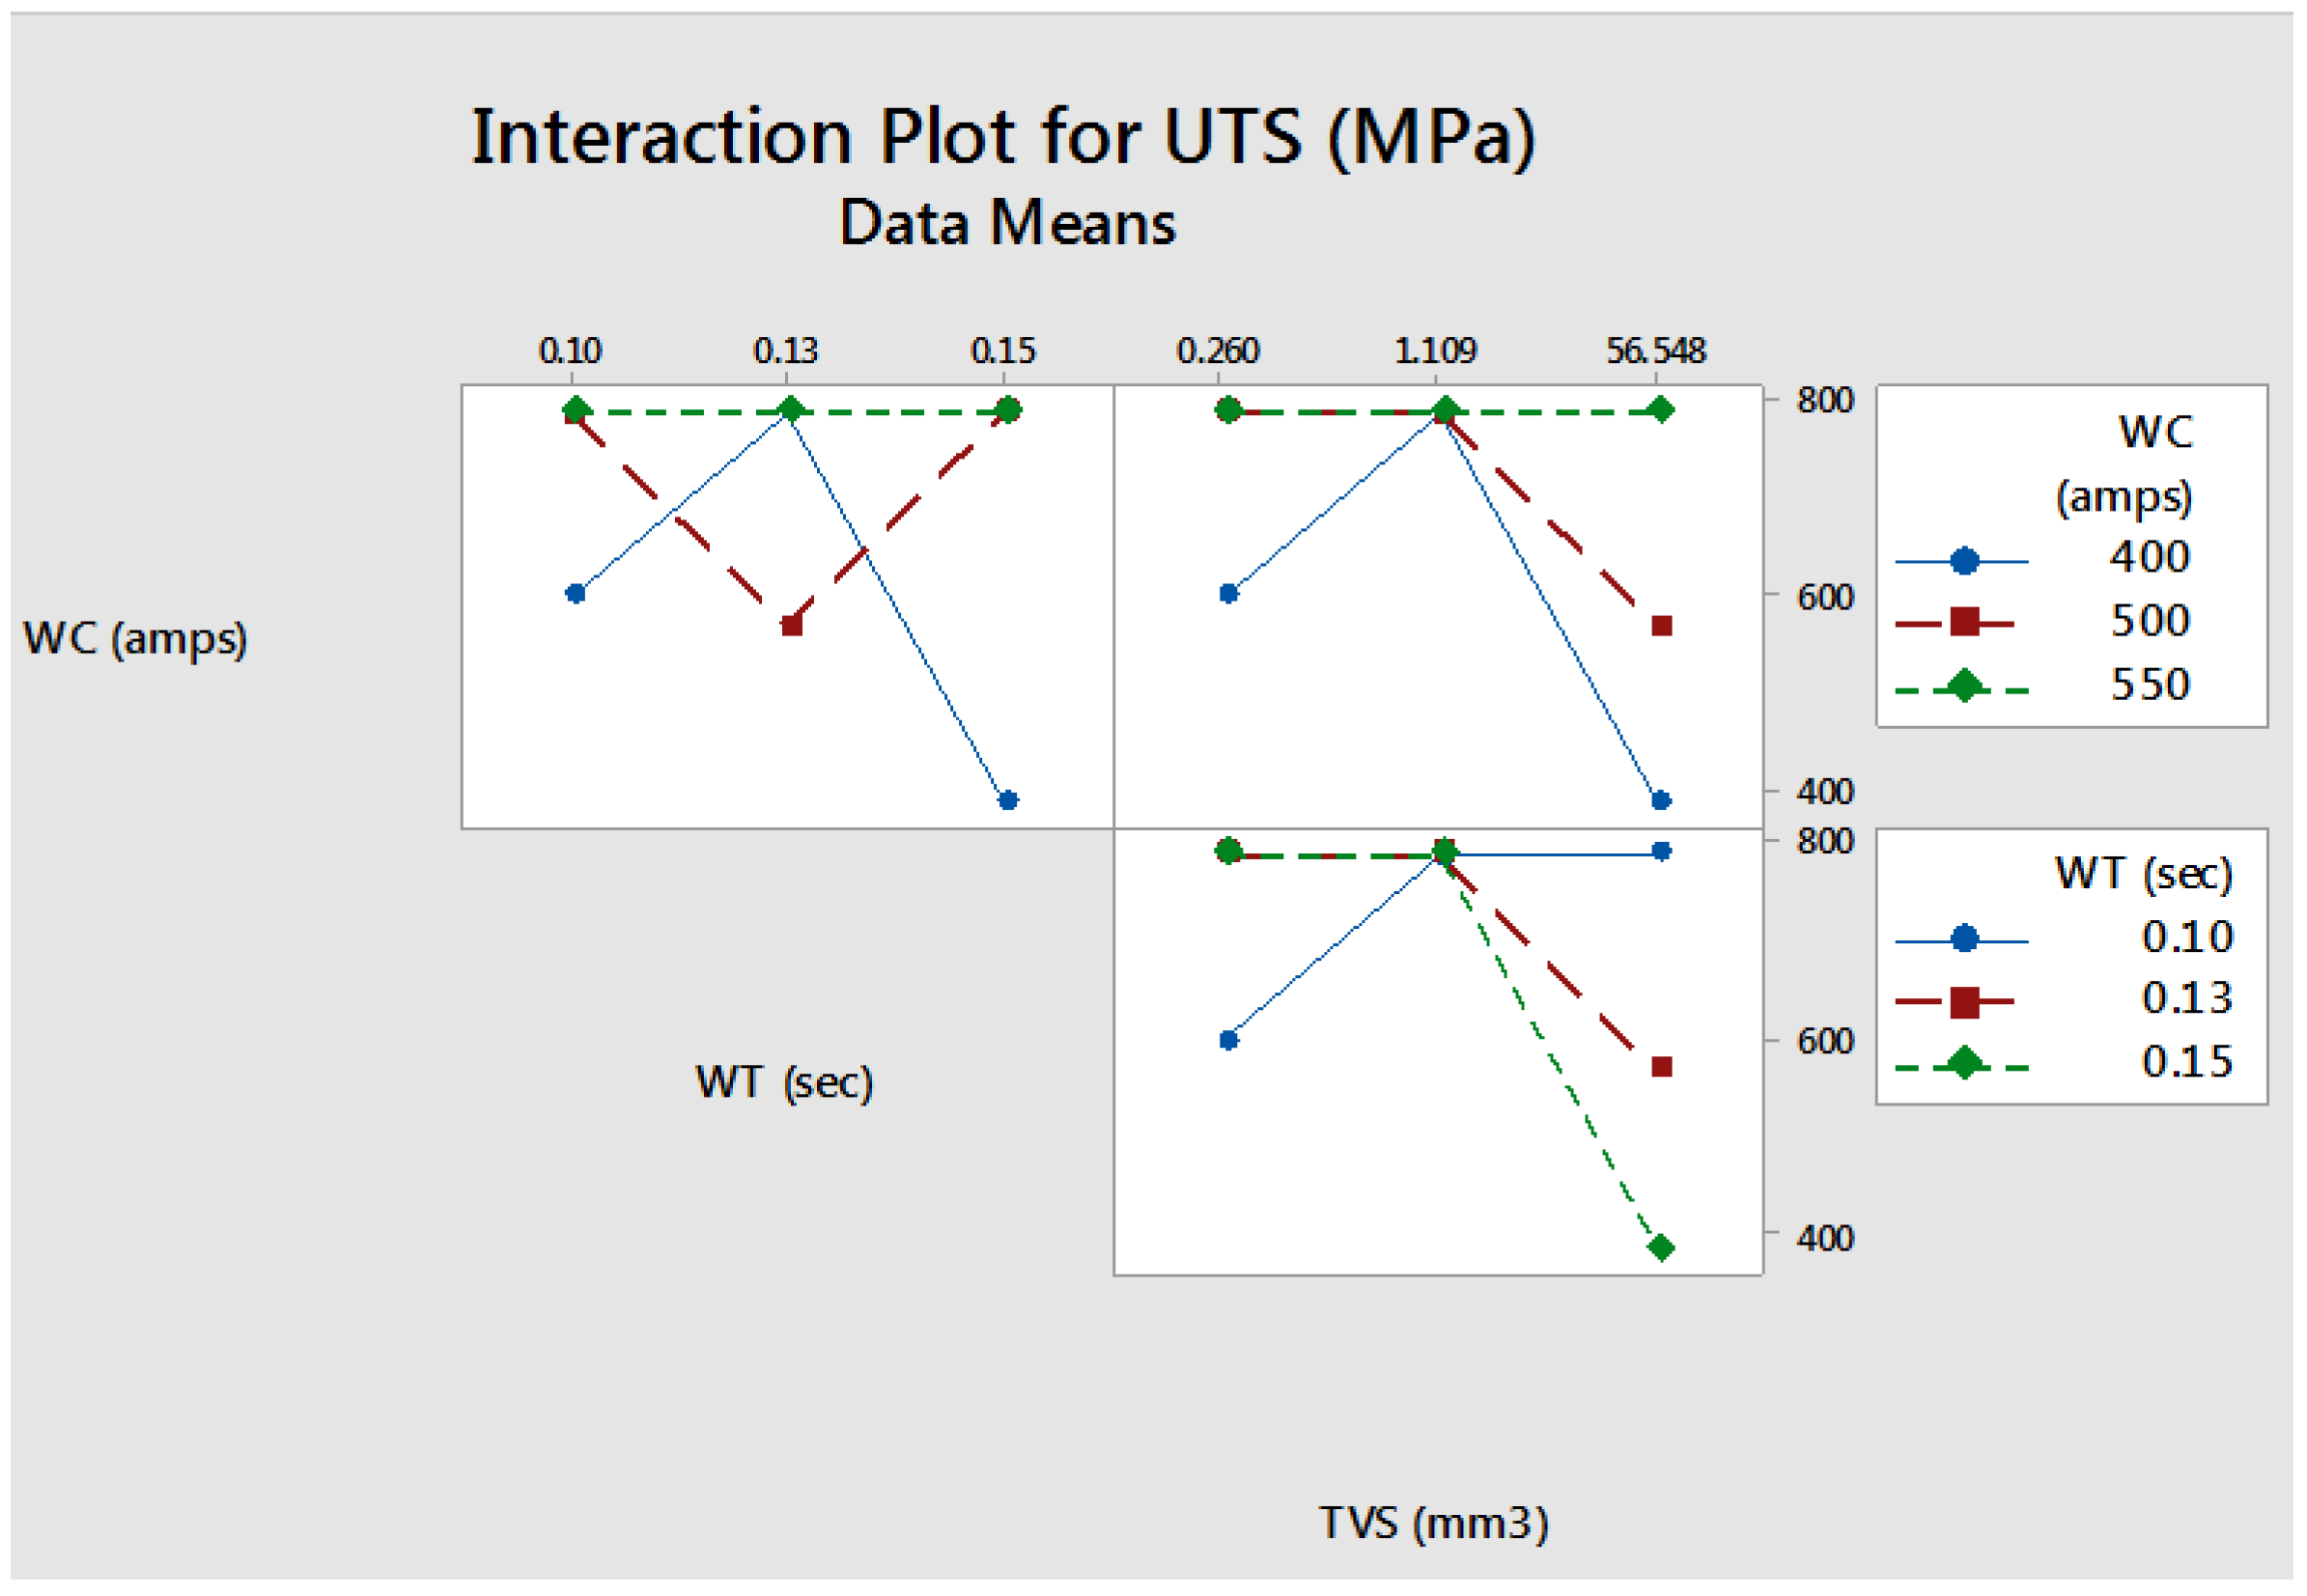
3.2.2. Taguchi Approach

The aims of this experimental design were to determine the effects of processing parameters on the output products, identify which of the selected parameters has the greatest effect on the output performance, and define the best possible ranges of those parameters in order to obtain high-quality products. ANOVA is a statistical tool that is used to determine the differences or similarities between groups of data [20]. Minitab software and the Taguchi method, which are efficient tools for the design of high-quality product manufacturing systems, were used for the optimum design of experiments [21]. The Taguchi approach provides an orthogonal array L9, which was selected based on three different welding parameters. This approach recommends analyzing the data using the mean effect or signal-to-noise (S/N) ratio, a logarithmic function of the desired result, which serves as an objective function for the optimization of the process parameters. This technique also helps with data analysis and prediction of optimum levels during the joining process [22].
The S/N ratio is the ratio of the “signal”, representing the desirable value, and the “noise”, representing the undesirable value. The signal-to-noise ratio is widely used to measure the quality performance and significance of the welding process. The S/N ratios were calculated according to the selected values of the formula for each experimental run. Figure 9 and Figure 10 show the main plots of the S/N ratios for tensile strength.
The optimum level setting of welding factors is the level showing the maximum value of S/N ratio. Figure 11 provides an interaction plot for the ultimate tensile strength.
Increasing the welding time results in decreasing the strength, so the enhancement in welding current raises the mean effect and S/N ratio for the tensile strengths of the specimens. The mean effect and S/N ratio for tensile strength improve with the tip volume of the stud and then decrease considerably. Test results provided in Figure 9, Figure 10 and Figure 11 are valid under the given conditions. The explicit formulation of the UTS as a function of welding parameters is given in Equation (4):
UTS   ( MPa ) = 292 + 1 . 31   WC   ( amps ) 1315   WT   ( s ) 3 . 15   TVS   ( mm 3 )
Based on the equation and calculations, the correlation coefficient and mean absolute percentage error values of the Taguchi approach are 0.5690 and 21.6911, respectively. The significance level (p-values) of the constant, welding current, welding time, and tip volume of the stud are 0.402, 0.051, 0.437, and 0.049, respectively. The p-value of the regression model is 0.66. Test results confirm that the error percentage is high while the learning rate is relatively low with the Taguchi method. From the Taguchi approach, it can be concluded that the optimum level setting of the welding current, welding time, and tip volume of the stud are 550 amps, 0.10 s, and 1.109 mm3, correspondingly.

4. Discussion

The arc stud welding method was successfully applied to stainless steel. From the macro visual inspection of the weld joints, it was found that welding without any macro-defects was obtained by selecting the appropriate parameters. The primary aim of using argon shielding gas was to protect the weld pool from the influences of the atmosphere, such as oxidation and nitrogen absorption, and also to stabilize the arc welding process. However, oxidation could still be seen around the welding metals, possibly because of the oxygen leakage from the atmosphere into the weld pool. In the ASW method, various welding parameters, such as welding current, welding time, lift, and plunge were widely applied. These parameters generally affect the quality of the welded materials and joint structures. The high welding current and welding time can deform the stud and decrease the joint efficiency of the welds substantially (Figure 1f). The solidification of δ-ferrite begins from the heat-affected zone and increases towards the welding zone area. The welding operation in an ASW process takes place in milliseconds; thus, solidification of the weld pool is very fast, and the width of the HAZ is quite narrow.
The amount and distribution of δ-ferrite, which mainly depends on chemical composition and cooling rate, significantly affect the properties and performance of austenitic stainless steels. The volume fraction of δ-ferrite can alter the microstructure of samples by changing the chemical composition of steel. It is well known that Cr, Si, Ti, and Mo are predominantly δ-ferrite stabilizing elements. The δ-ferrite has a body-centered cubic (BCC) crystalline structure and slows the grain growth with changing the strength of the steel. The interphase boundaries act as strong barriers to the dislocation motions [23,24]. The welding zone also exhibits a primarily ferrite mode during the solidification process, which could be mainly due to the higher heat input in the welding zone areas. It is also known that austenitic SS has austenite with its primary phase at room temperature and that the δ-ferrite in welding zone of austenitic SS forms some dendrites prior to solidification of the austenite at the peritectic temperature of around 1450 °C [25].
The network architecture, learning rate, and initial weight mainly affect the performance of the welding process. The hidden layers and neuron numbers are also important factors affecting the welding process and performance. In order to determine the network architecture and the optimal parameters, there have not been well-defined methods to date; thus, this study addresses some of these major concerns. Currently the trial-and-error approach has been the only approach for this aim. The optimal results were obtained with three neurons in one hidden layer. It can be concluded that the optimal model is a 3-3-1 architecture. The model learning ability is quite reliable according to the MSE and MAE results in the training set. The performance, effectiveness, and generalization ability of the system were evaluated using the test setups to calculate the expected ability in the next.
It is also clear that the correlation coefficient has a very high value and shows good reliability ratios. The equation could be used for fixing the influences of welding parameters on the strengths of the weld joints. MAPE (for average percentage error value) of testing set (for un-normalized results) is about 3.03%, and the maximum error should not exceed 6%. It was determined that the ultimate tensile strength of the welds could be calculated with 96.97% accuracy. The maximum strength value was obtained to be about 789.74 MPa. From the tensile test results, it was seen that some specimens had very good joint performance, while other samples demonstrated weak or insufficient joint performance. This may be due to local variations of the properties, grain coarsening, improper welding parameters, and surface oxidations. The change in any welding parameter drastically affects the other parameters and properties, as well. To produce high-quality joints, the optimum welding parameters should be properly selected and evaluated for each set of test specimens. Results show that the considered weld parameters are highly significant factors affecting the ultimate tensile strength of arc stud joints. A high welding current and welding time increase the heat and in turn deform the stud gradually. Also, any change in the cross-sectional area of the stud, which has an important effect on the weld quality, affects the arc current density and heat intensity distribution. Thus, parameters during the welding procedure must be selected properly to obtain maximum strength values [26,27].
Fisher introduced the design of experiments, which is considered a powerful technique for this type of analysis [28]. The technique is widely used for the experimental layout to determine the level of changes in the processing parameters on the output performance. The UTS could be estimated with 78.31% accuracy using the Taguchi method. Welding current and tip volume of the stud have lower p-values. Welding time with 0.437 p-values among the other parameters has a high p-value, which indicates that this is not an important parameter. In previous studies, promising results were achieved to find the method of optimization and control modeling, and estimation of the experimental and theoretical results [29,30]. A comparison of the neural network and Taguchi approaches are shown in Figure 12.
A comparison of the artificial neural network and Taguchi approaches follows:
  • The methods are extensively used to optimize engineering processes.
  • The Taguchi method has a significant advantage in the design of experiments, which can also be applied to a variety of quantitative tests; by using this method, time and cost can be saved and a much higher number of assays can be reduced.
  • ANOVA in the Taguchi approach can be used for analysis and is an alternative and efficient approach for fast, low-cost assay optimization. The Taguchi method incorporates one primary experiment to study the main effects of each factor, modeling some of the important interactions.
  • The ANN model is popular in predicting the field that is used to solve the problem by rebuilding any function with arbitrary precision and has good adaptive and self-learning ability.
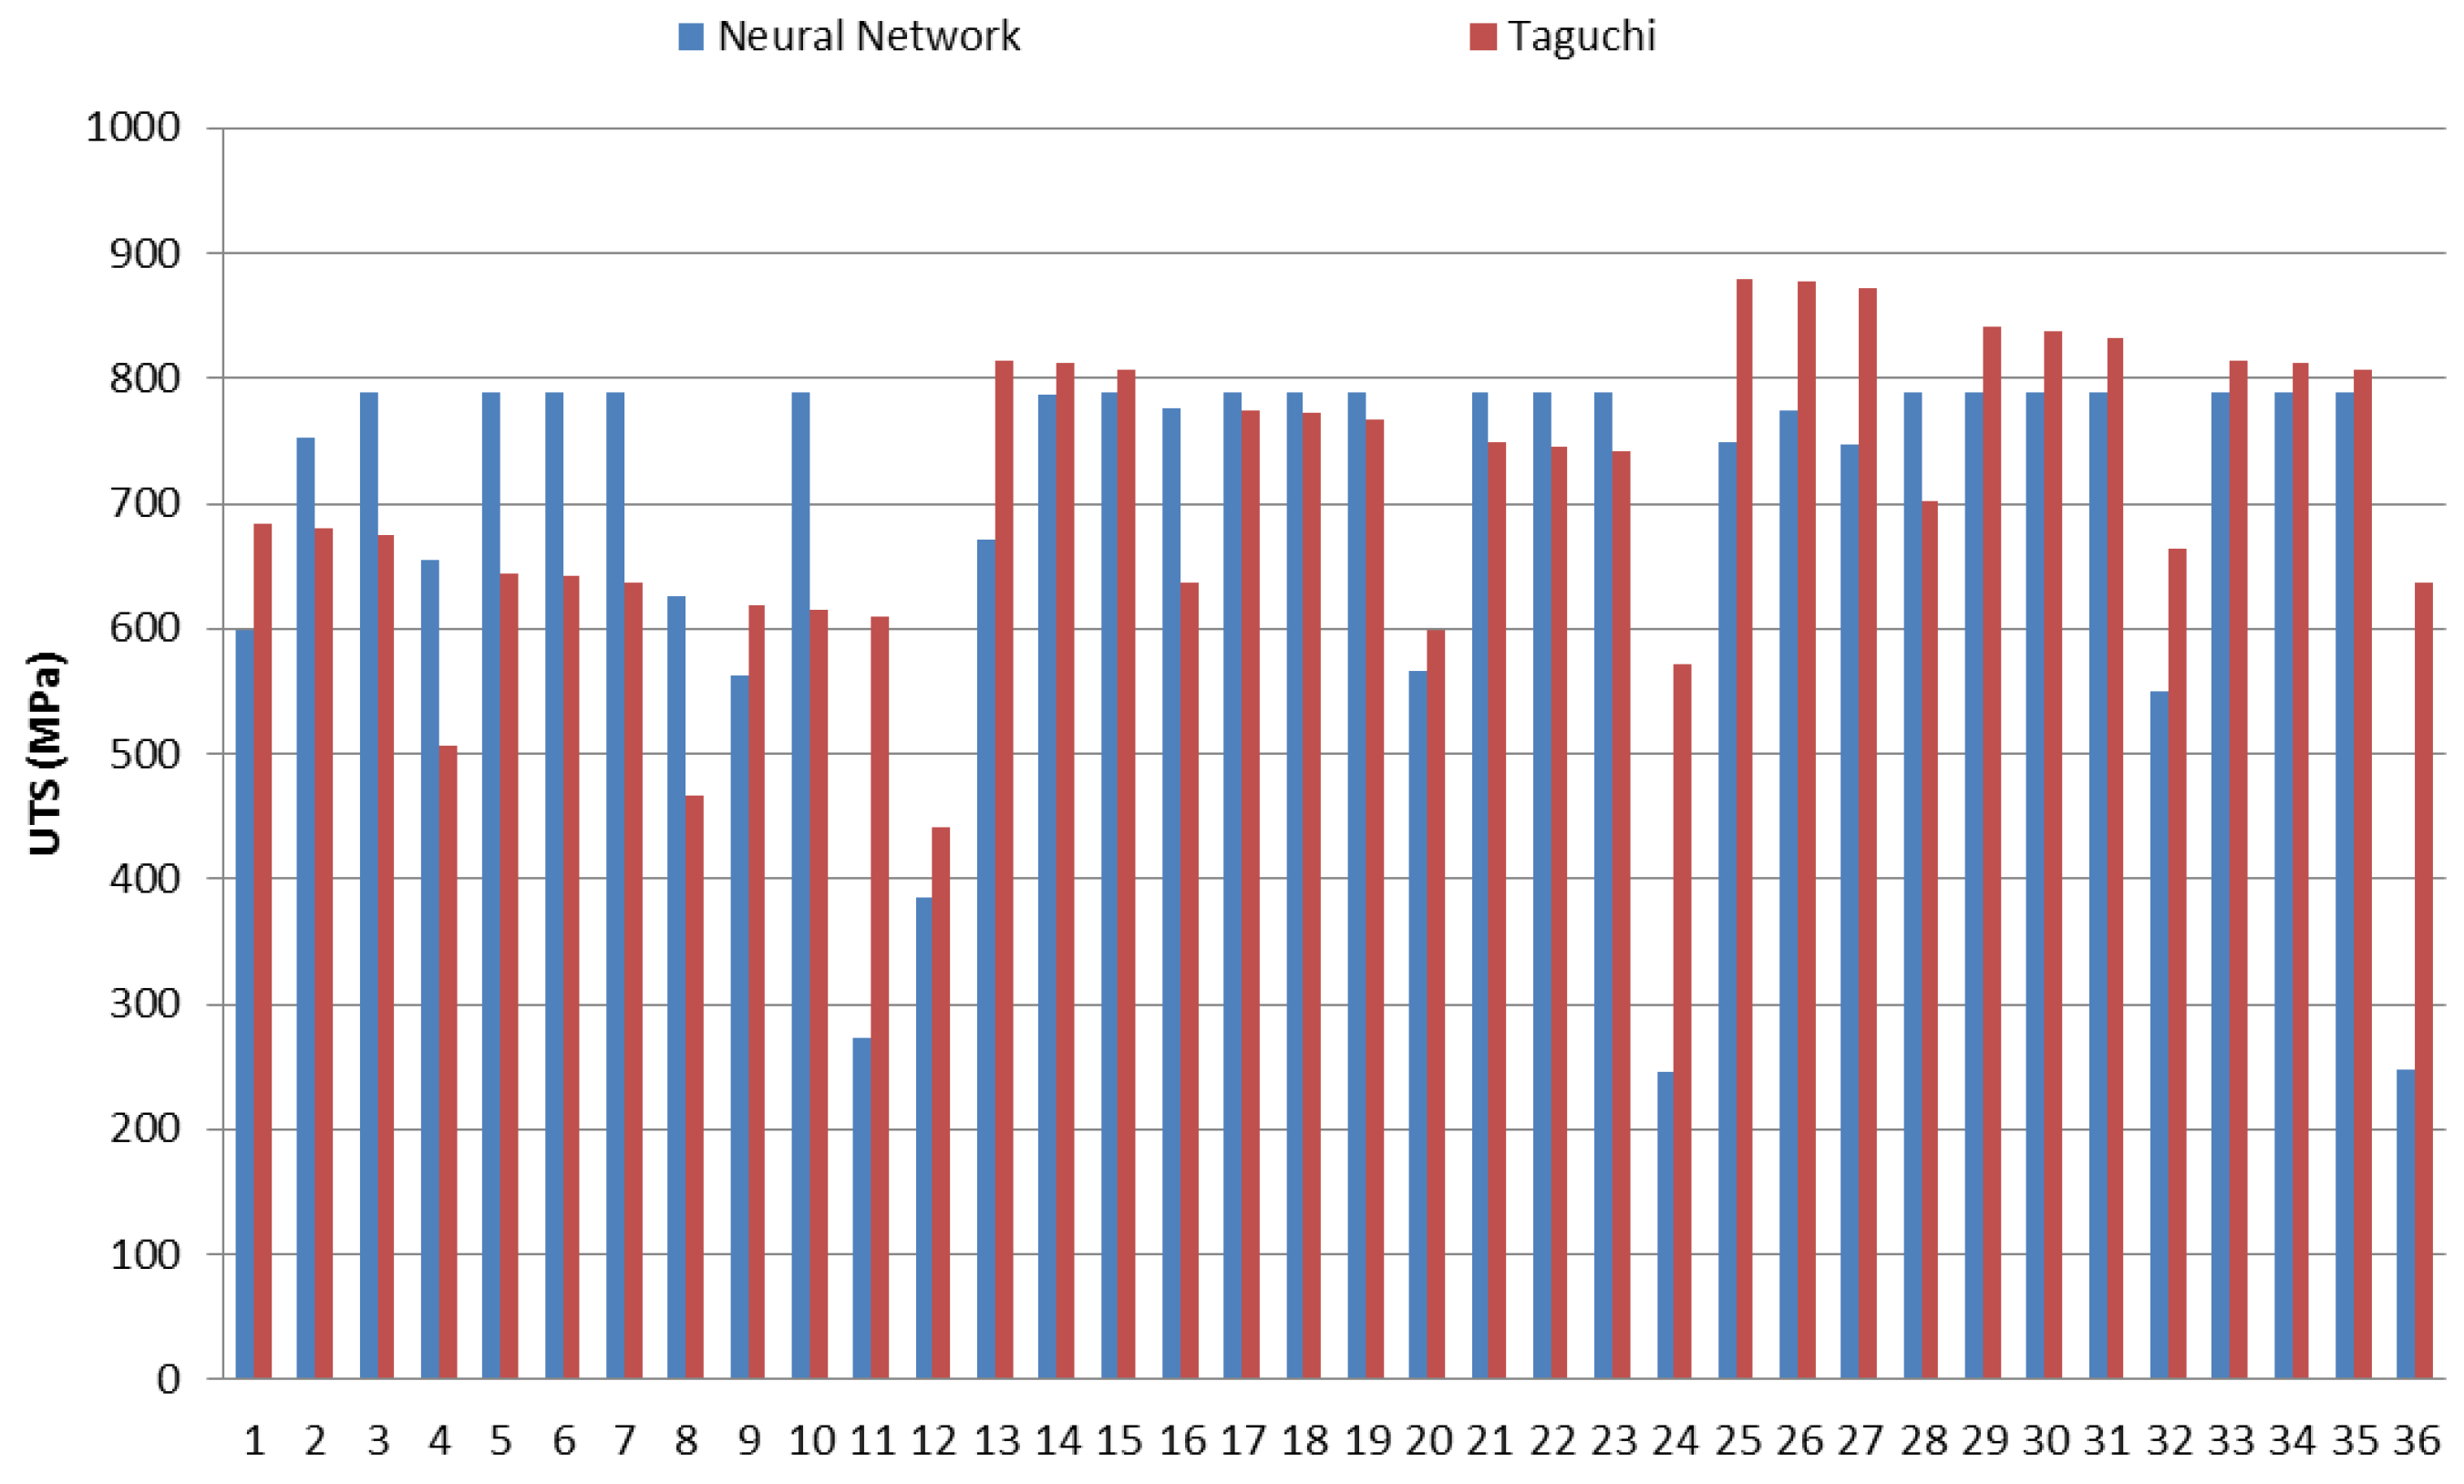
  • The average relative uncertainty values of ANN and Taguchi approaches are 3.86% and 56.37, respectively. The ANN has rapid overlearning, more accuracy (~3%), and precision (±24 MPa); however, the Taguchi method has more low accuracy (~21%) and precision (±389 MPa) in predicting the ultimate tensile strength of the welds.
  • A high p-value (0.066) of regression in the Taguchi method indicates that the equation used here has a low accuracy for estimating the ultimate tensile strength of welds.
  • It was observed that the average percentage error value decreased and the correlation coefficient value was significantly improved with the neural network approach compared to the Taguchi approach. In other words, results of the neural network approach are in better agreement with the test results, which may be attributed to the high learning rate of the ANN method.
In order to decrease experimental error and increase experimental reproducibility, all experimental steps were performed under the same conditions, and the materials used (commercial 304 and 316 SS) have the same properties. Three tensile tests for each sample were carried out, and the average of the results was reported. The proposed models are valid for the given ranges and conditions for a stud diameter of 6 mm. The optimal parameters of welding are a key issue to obtain the maximum tensile strength. The maximization of the quality and joint strength of welding is frequently related to optimization of the welding process parameters. In this paper, two model-based approaches for welding strength were presented. The artificial neural network and Taguchi methodologies were used to develop the appropriate welding current, welding time, and tip volume of the stud models based on real experimental measurement data. The well-known ANN and Taguchi modeling processes were selected for this case study. These models estimate the ultimate tensile strength as a function of welding current, welding time, and tip volume of the stud. The comparative study shows that optimization and control of the UTS using the ANN model provide better error-based performance than the Taguchi model.
Overall, the present study provides the following major findings based on the experimental test and model results:
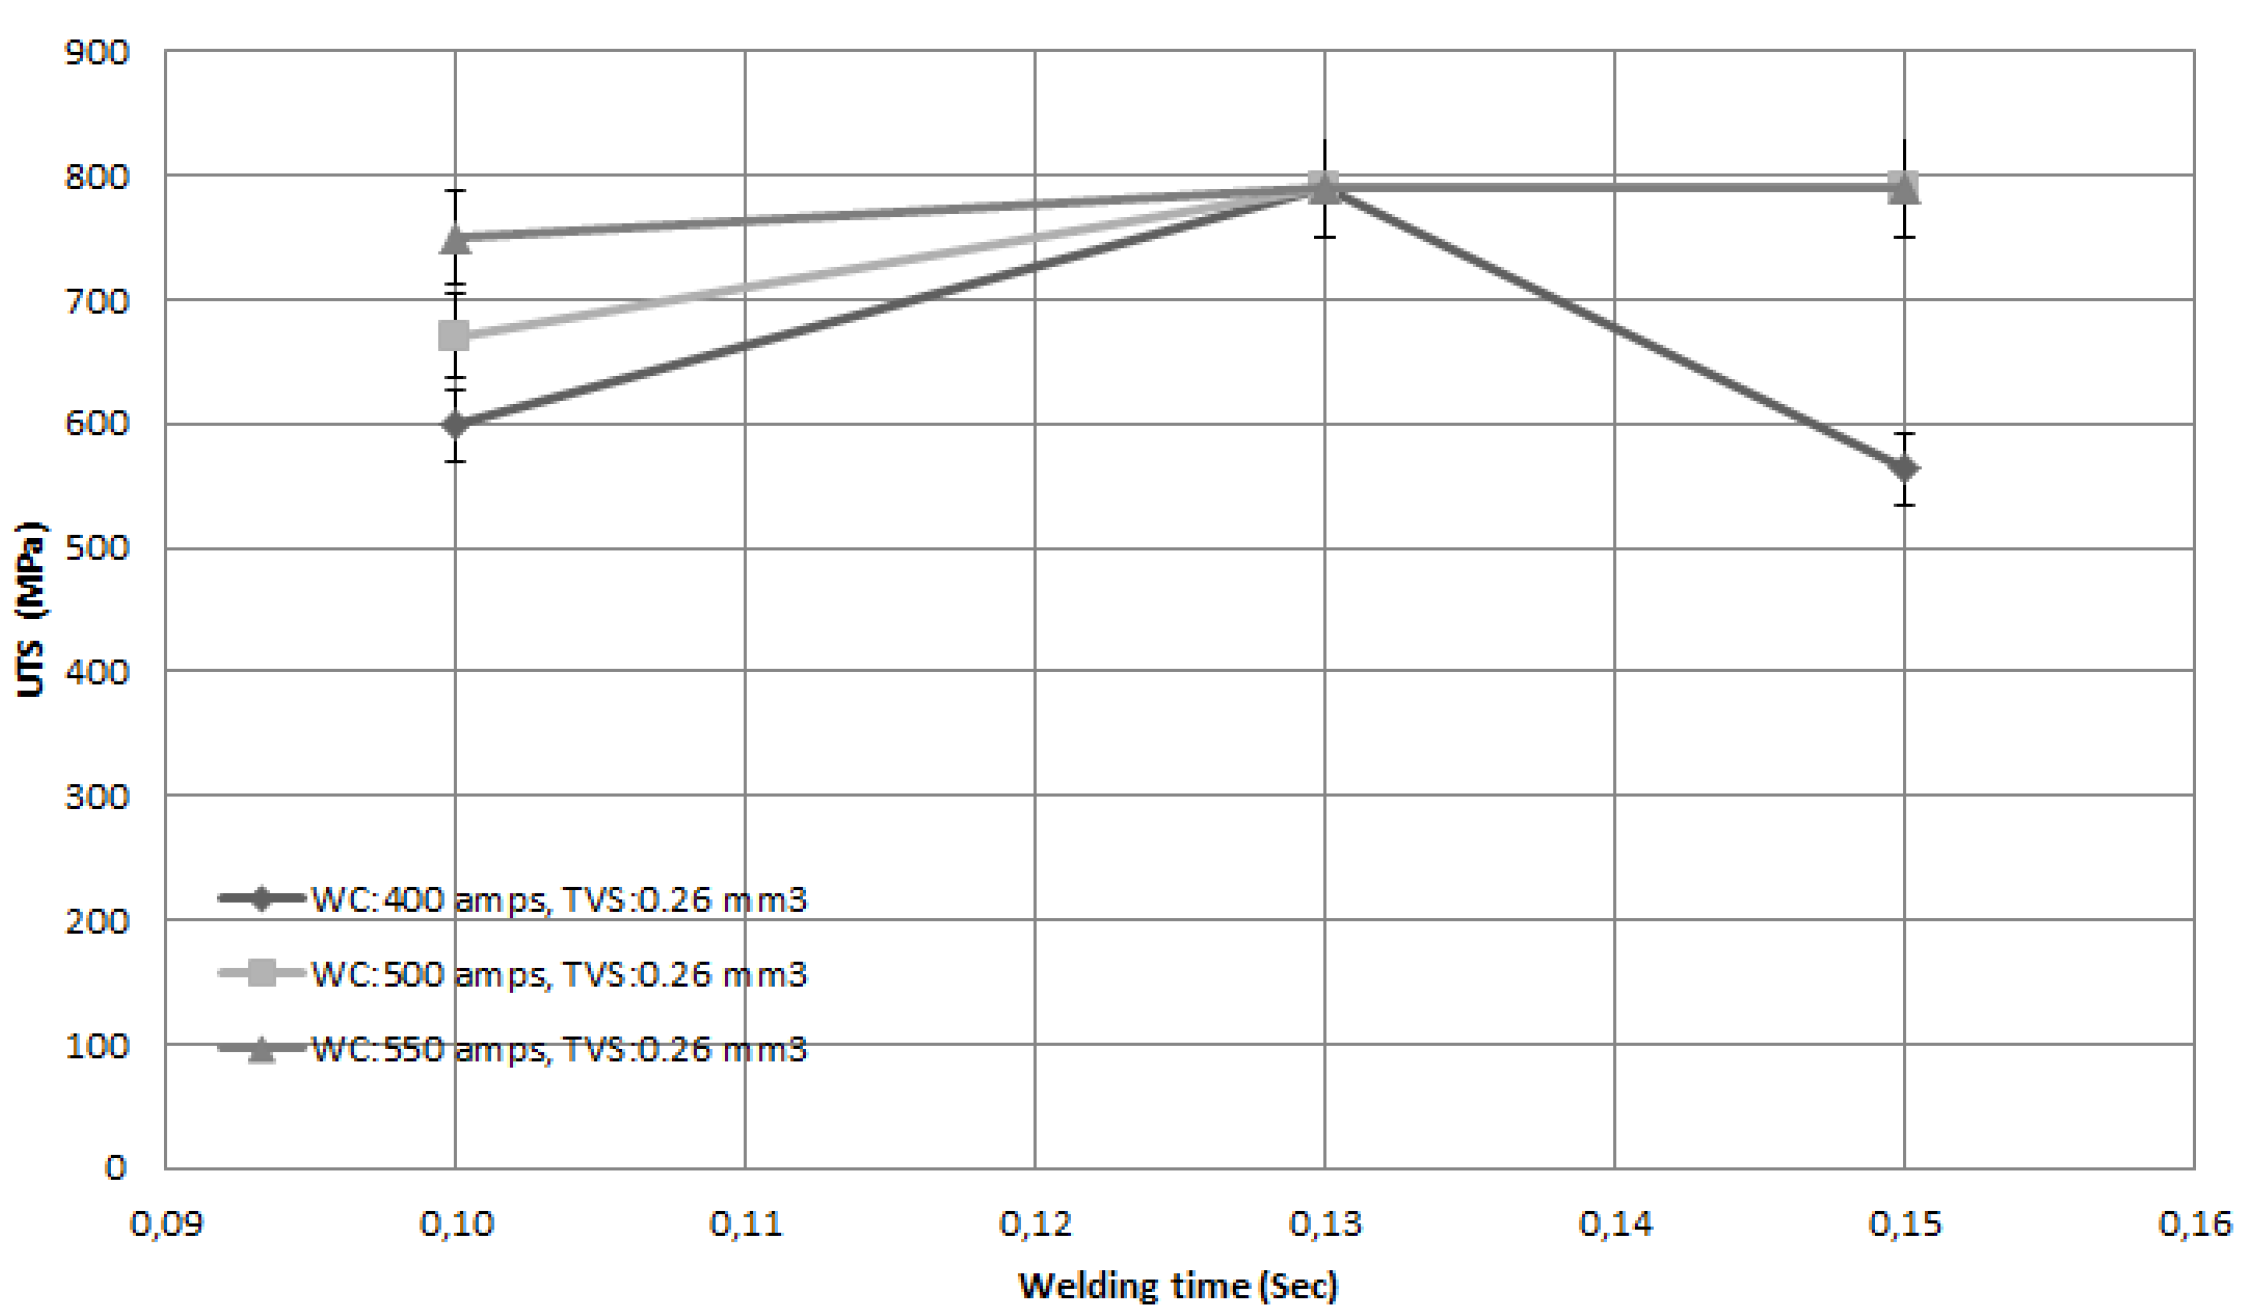
  • Increasing the welding current and time raises the local heat, which can probably cause some deformations on the stud, which in turn diminishes the ultimate tensile strength values.
  • The grain growth in the weld zone through external heat energy can cause a reduction in strength.
  • Decreasing the cross-sectional area of the stud with a high welding current and time enhances the heat intensity distribution and deteriorates the mechanical properties of the welded joints.
  • A higher welding current or higher welding time can increase the chance of defect formations in the weld areas, which can also significantly affect the mechanical properties and quality of the welded metal.
  • A high learning rate and high correlation coefficient indicate the effectiveness of the neural network model, which may be used for the mechanical predictions of welded materials in many industries.

5. Conclusions

Austenitic stainless steel materials were successfully welded using the arc stud welding method and tested for tensile properties.
  • Test results showed that a dendritic structure was formed during welding, which mainly contained a δ-ferrite and austenitic structure.
    Improper welding parameters significantly deteriorate the ultimate tensile strength of the welds.
  • Tensile test results were statistically studied using artificial neural network and Taguchi approaches. Neural network results were in good agreement with the test results, and the formulation has a high reliability with low error rates. The UTS of the joints using the ANN and Taguchi methods were estimated with an accuracy of 96.97% and 78.31%, respectively. More studies may be needed to obtain closer matching in the future. Hence, it was concluded that the neural network model was fairly successful and has analytical virtue for specifying the ultimate tensile strength of welds under different welding processing cases.
  • Welding parameters such as welding current, time, and tip volume of the stud are the most significant parameters in the ASW process. Thus, these parameters should be properly adjusted to maximize the mechanical properties of the welds because any change in any of the parameters can significantly affect all other parameters as well. For example, if a high level of welding current or welding time is selected during welding, then this leads to more fusion/melting and forms necking at the joined region due to grain coarsening effects and other structural changes.

Author Contributions

H.I.K., M.O., and N.F.Y. designed the tests, performed the tests, analyzed the data, and wrote the paper. E.E. contributed the theoretical section. N.F.Y. directed the research, and R.A. contributed to the results discussion.

Funding

This research received no external funding.

Acknowledgments

The authors declare that they did not receive any funds for covering the costs to publish in open access.

Conflicts of Interest

The authors declare no conflict of interest.

References

  1. Cabibbo, M.; Forcellese, A.; Simoncini, M.; Pieralisi, M.; Ciccarelli, D. Effect of welding motion and pre-/post-annealing of friction stir welded AA5754 joints. Mater. Des. 2016, 93, 146–159. [Google Scholar] [CrossRef]
  2. Wahba, M.; Mizutani, M.; Katayama, S. Single pass hybrid laser-arc welding of 25 mm thick square groove butt joints. Mater. Des. 2016, 97, 1–6. [Google Scholar] [CrossRef]
  3. Trzepiecinski, T.; Malinowski, T.; Pieja, T. Experimental and numerical analysis of industrial warm forming of stainless steel sheet. J. Manuf. Process. 2017, 30, 532–540. [Google Scholar] [CrossRef]
  4. Zhao, D.; Zhao, K.; Ren, D.; Guo, X. Ultrasonic welding of magnesium–titanium dissimilar metals: A study on influences of welding parameters on mechanical property by experimentation and artificial neural network. J. Manuf. Sci. Eng. 2017, 139, 031019. [Google Scholar] [CrossRef]
  5. Huang, L.; Wu, D.; Hua, X.; Liu, S.; Jiang, Z.; Li, F.; Wang, H.; Shi, S. Effect of the welding direction on the microstructural characterization in fiber laser-GMAW hybrid welding of 5083 aluminum alloy. J. Manuf. Process. 2018, 31, 514–522. [Google Scholar] [CrossRef]
  6. Habibi, M.; Hashemi, R.; Fallah Tafti, M.; Assempour, A. Experimental investigation of mechanical properties, formability and forming limit diagrams for tailor-welded blanks produced by friction stir welding. J. Manuf. Process. 2018, 31, 310–323. [Google Scholar] [CrossRef]
  7. Yang, J.; Yu, Z.; Li, Y.; Zhang, H.; Zhou, N. Laser welding/brazing of 5182 aluminium alloy to ZEK100 magnesium alloy using a nickel interlayer. Sci. Technol. Weld. Join. 2018, 1–8. [Google Scholar] [CrossRef]
  8. Kumar, V.; Hussain, M.; Raza, M.S.; Das, A.K.; Singh, N.K. Fiber laser welding of thin nickel sheets in air and water medium. Arabian J. Sci. Eng. 2017, 42, 1765–1773. [Google Scholar] [CrossRef]
  9. Krasnowski, K. Experimental study of FSW t-joints of EN-AW 6082-T6 and their behaviour under static loads. Arabian J. Sci. Eng. 2014, 39, 9083–9092. [Google Scholar] [CrossRef]
  10. Kumar, S.S.; Murugan, N.; Ramachandran, K.K. Microstructure and mechanical properties of friction stir welded AISI 316l austenitic stainless steel joints. J. Mater. Process. Technol. 2018, 254, 79–90. [Google Scholar] [CrossRef]
  11. Samardžić, I.; Kladarić, I.; Klarić, Š. The influence of welding parameters on weld characteristics in electric arc stud welding. Metalurgija 2009, 48, 181–185. [Google Scholar]
  12. Chi, Q.; Zhang, J.; Zhang, Y. Study on the autocontrol of stud plunge depth in stepping arc stud welding. J. Appl. Sci. 2006, 6, 362–365. [Google Scholar]
  13. Harada, Y.; Sada, Y.; Kumai, S. Dissimilar joining of AA2024 aluminum studs and AZ80 magnesium plates by high-speed solid-state welding. J. Mater. Process. Technol. 2014, 214, 477–484. [Google Scholar] [CrossRef]
  14. Feng, Y.; Luo, Z.; Liu, Z.; Li, Y.; Luo, Y.; Huang, Y. Keyhole gas tungsten arc welding of AISI 316l stainless steel. Mater. Des. 2015, 85, 24–31. [Google Scholar] [CrossRef]
  15. Ye, Z.; Huang, J.; Cheng, Z.; Gao, W.; Zhang, Y.; Chen, S.; Yang, J. Combined effects of mig and tig arcs on weld appearance and interface properties in al/steel double-sided butt welding-brazing. J. Mater. Process. Technol. 2017, 250, 25–34. [Google Scholar] [CrossRef]
  16. Shackelford, J.F.; Alexander, W. CRC Materials Science and Engineering Handbook, 3rd ed.; Taylor & Francis: Abingdon, UK, 2001. [Google Scholar]
  17. Kurt, H.I. Influence of hybrid ratio and friction stir processing parameters on ultimate tensile strength of 5083 aluminum matrix hybrid composites. Compos. Part B Eng. 2016, 93, 26–34. [Google Scholar] [CrossRef]
  18. Kurt, H.I.; Oduncuoglu, M. Formulation of the effect of different alloying elements on the tensile strength of the in situ Al-Mg2Si composites. Metals 2015, 5, 371–382. [Google Scholar] [CrossRef]
  19. Kurt, H.I.; Oduncuoglu, M.; Asmatulu, R. Wear behavior of aluminum matrix hybrid composites fabricated through friction stir welding process. J. Iron Steel Res. Int. 2016, 23, 1119–1126. [Google Scholar] [CrossRef]
  20. Rama, R.S.; Padmanabhan, G. Application of Taguchi methods and ANOVA in optimization of process parameters for metal removal rate in electrochemical machining of AL/5% SIC composites. Int. J. Eng. Res. Appl. 2012, 2, 192–197. [Google Scholar]
  21. Roy, R.K. A Primer on the Taguchi Method; Society of Manufacturing Engineers: Dearborn, MI, USA, 2010. [Google Scholar]
  22. Pandey, A.; Khan, M.; Moeed, K. Optimization of resistance spot welding parameters using Taguchi method. Int. J. Eng. Sci. Technol. 2013, 5, 234–241. [Google Scholar]
  23. Padilha, A.F.; Rios, P. Decomposition of austenite in austenitic stainless steels. ISIJ Int. 2002, 42, 325–327. [Google Scholar] [CrossRef]
  24. Janovec, J.; Sustarsic, B.; Medved, J.; Jenko, M. Phases in austenitic stainless steels. Mater. Technol. 2003, 37, 307–312. [Google Scholar]
  25. Lai, J.; Haigh, J. Delta-Ferrite Transformations in a Type 316 Weld Metal; Central Electricity Research Labs.: Leatherhead, UK, 1978. [Google Scholar]
  26. Radisavljevic, I.; Zivkovic, A.; Radovic, N.; Grabulov, V. Influence of FSW parameters on formation quality and mechanical properties of AL 2024-T351 butt welded joints. Trans. Nonferrous Met. Soc. China 2013, 23, 3525–3539. [Google Scholar] [CrossRef]
  27. Dorbane, A.; Ayoub, G.; Mansoor, B.; Hamade, R.F.; Kridli, G.; Shabadi, R.; Imad, A. Microstructural observations and tensile fracture behavior of FSW twin roll cast AZ31 mg sheets. Mater. Sci. Eng. A 2016, 649, 190–200. [Google Scholar] [CrossRef]
  28. Fisher, R.A. The Design of Experiments, 5th ed.; Macmillan Pub Co.: Oxford, UK, 1949. [Google Scholar]
  29. Al-Abdullah, K.I.A.-L.; Abdi, H.; Lim, C.P.; Yassin, W.A. Force and temperature modelling of bone milling using artificial neural networks. Measurement 2018, 116, 25–37. [Google Scholar] [CrossRef]
  30. Gajate, A.; Haber, R.; del Toro, R.; Vega, P.; Bustillo, A. Tool wear monitoring using neuro-fuzzy techniques: A comparative study in a turning process. J. Intell. Manuf. 2012, 23, 869–882. [Google Scholar] [CrossRef] [Green Version]
Figure 1. Macroscopic views of welded specimens with varying parameters: (a) 400-0.15-3-2-10°; (b) 400-0.15-3-2-20°; (c) 400-0.10-3-2-20°; (d) 500-0.10-3-2-0°; (e) 500-0.10-3-2-30°; and (f) 550-0.10-3-2-30°.
Metals 08 00326 g001
Figure 2. Specimen 400-0.15-3-2: (a) cross-section image and (b) microstructure.
Metals 08 00326 g002
Figure 3. Influence of neuron numbers for training set.
Metals 08 00326 g003
Figure 4. Influence of neuron numbers for test set.
Metals 08 00326 g004
Figure 5. Variation of ultimate tensile strength with welding current.
Metals 08 00326 g005
Figure 6. Effect of welding time on ultimate tensile strength.
Metals 08 00326 g006
Figure 7. Interaction of ultimate tensile strength by tip volume of stud.
Metals 08 00326 g007
Figure 8. Fractured samples after tensile tests.
Metals 08 00326 g008
Figure 9. Main effect plot for means of tensile strength.
Metals 08 00326 g009
Figure 10. Main effect plot for signal-to-noise (S/N) ratios of tensile strength.
Metals 08 00326 g010
Figure 11. Interaction plot for ultimate tensile strength.
Metals 08 00326 g011
Figure 12. Comparison of neural network and Taguchi approaches.
Metals 08 00326 g012
Table 1. Composition (wt %) of stud and base metal utilized in this study.
MaterialsCSiMnPSCrNiMoFe
Plate (304 SS)0.08120.0450.0318–208–10.5-Balance
Stud (316 SS)0.08120.0450.0316–1810–142–3Balance
Table 2. Mechanical properties of stud and base metal utilized in this study [16].
MaterialsUTS (MPa)El. (%)Hardness (HV)
Plate (304)515 -55275
Stud (316)515 -55275
Table 3. Maximum and minimum values of welding parameters utilized in this study.
LevelWelding Current (amps)Welding Time (s)Lift (mm)Plunge (mm)
Min4000.1032
Max5500.15

