Article

Influence of Solvent and Electrical Voltage on Cathode Plasma Electrolytic Deposition of Al2O3 Antioxidation Coatings on Ti-45Al-8.5Nb Alloys

1
State Key Laboratory for Advanced Metals and Materials, University of Science and Technology Beijing, Beijing 100083, China
2
Cast Titanium Alloys R&D Center, Beijing Institute of Aeronautical Materials, Beijing 100095, China
3
Beijing Research Institute of Mechanical & Electrical Technology, Beijing 100083, China
*
Author to whom correspondence should be addressed.
Metals 2018, 8(5), 308; https://doi.org/10.3390/met8050308
Submission received: 23 March 2018 / Revised: 18 April 2018 / Accepted: 27 April 2018 / Published: 1 May 2018
(This article belongs to the Special Issue Plasmas Processes Applied on Metals and Alloys)

Abstract

:
Al2O3 coatings were prepared on Ti-45Al-8.5Nb alloys via cathodic plasma electrolysis deposition (CPED) in both 1.2 M Al(NO3)3 aqueous and ethanolic solutions. Different voltages were also applied during the deposition process to optimize coating properties. Coatings deposited in both solutions mainly consisted of γ-Al2O3, with some Al(OH)3 found in coatings prepared in aqueous solution. Coatings prepared in ethanol solution exhibited better oxidation resistance at 900 °C as well as better substrate adhesion, which was mainly due to smaller crater sizes on coating surfaces. The deposition process was discussed in detail and the reason for the smaller craters examined. The results suggested that solution surface tension mainly influenced the average diameter of hydrogen bubbles that formed on cathode surfaces during the process. Smaller bubbles lead to both lower current densities on cathodes and smaller crater sizes on coatings.

1. Introduction

Lightweight TiAl alloys have outstanding characteristics of low density, specific strength, and elastic modulus, which yield it a key material for use in aero and aerospace applications [1,2,3]. At high temperature, the oxidation resistance of high Nb-containing (up to 10 at %) TiAl alloys is much higher compared with that of other TiAl alloys [4,5]. Hence, Ti-45Al-8.5Nb alloys have been chosen for use in engines working at 800–900 °C [5]. Nevertheless, non-protective Al2O3 + TiO2 scale has been observed to grow rapidly on these alloys at high temperatures, which limits their applications [6,7]. Therefore, new or revised surface treatments are necessary to improve the alloys’ oxidation resistance.
Although metal coatings can guarantee the long-term performance of TiAl alloys at high temperatures [8,9,10], element diffusion often appears at the interface between the coating and substrate, which, consequently, results in coating degradation [11,12,13]. Al2O3 ceramic coatings can effectively protect TiAl alloys against oxidation at high temperatures and no diffusion occurs at the interface during service [14,15], which is beneficial to both the properties of the substrate alloys and Al2O3 coatings [13]. Al2O3 coatings can be prepared by many techniques, including plasma spray (PS) [16], electron-beam physical vapor deposition (EB-PVD) [17], sol-gel [18], and electro-deposition [19,20]. However, all these techniques have their own weaknesses as well as merits. Specifically, PS and EB-PVD cannot be used for preparing sample coatings with complex shapes and, for industrial production, the sol-gel and electro-deposition should also not be used because of low efficiencies.
The process of plasma electrolysis (PE), a new surface-treatment technique, has seen wide application in ceramic coating depositions on alloys [21,22]. PE processes comprise anode and cathode plasma electrolysis, depending on the discharge electrode. As micro-arc oxidation (MAO) technique, anode plasma electrolysis had been widely used for coating metal substrates [23,24]. Nevertheless, the resulting composition and structure of coatings are subject to the substrate’s influence. Because of the advantages of high deposition efficiency, low energy consumption, good coating adhesion, and environmental friendliness, cathodic plasma electrolysis deposition (CPED) had been applied on many substrate materials, including metals, alloys, silicon, and carbon [25]. Wang et al. have suggested that porous Al2O3 coatings can be obtained by CPED on 304 stainless steel substrate and can improve substrate corrosion resistance [26]. With H2PtCl6 added to the solution, Al2O3-Pt composite coatings have been produced and the coatings showed excellent substrate adhesion [27,28]. In addition, with polyethylene glycol (PEG) added to aqueous solutions, Al2O3 coatings with smaller pores have been deposited on Ni-based super alloys, which significantly improved the anti-oxidation performance of alloys [29]. According to He et al., by adding PEG or glass beads into aqueous solution, the cathode current density is significantly reduced during CPED processes [25,29]. In general, studies conducted in this field have mainly focused on coating structures and performance. Few studies have focused attention on the deposition process and the relationship between coatings properties and deposition parameters. To improve the performance of Al2O3 coatings prepared by CPED process, it is important to determine how solvents and voltage parameters influence coating qualities and properties.
In this work, the CPED process was adopted to prepare Al2O3 coatings on Ti-45Al-8.5Nb alloy substrate. Al(NO3)3 solutions with different solvents were applied as electrolyte solutions during the deposition process. The coating morphology, chemical composition, and phase components were studied and the anti-oxidation performance investigated. The relationship between solvent and power parameters and coating properties was examined in detail.

2. Materials and Methods

The substrate of cylindrical samples (6 × 50 mm) used here was Ti-45Al-8.5Nb alloy (Nb, Al, Y, and W, at 8.5, 45, 0.1, and 0.2 at %, respectively, the remainder Ti). SiC paper was used to polish samples to a grit of #400 and ultrasonic-cleaning used to clean substrates with acetone and ethanol.
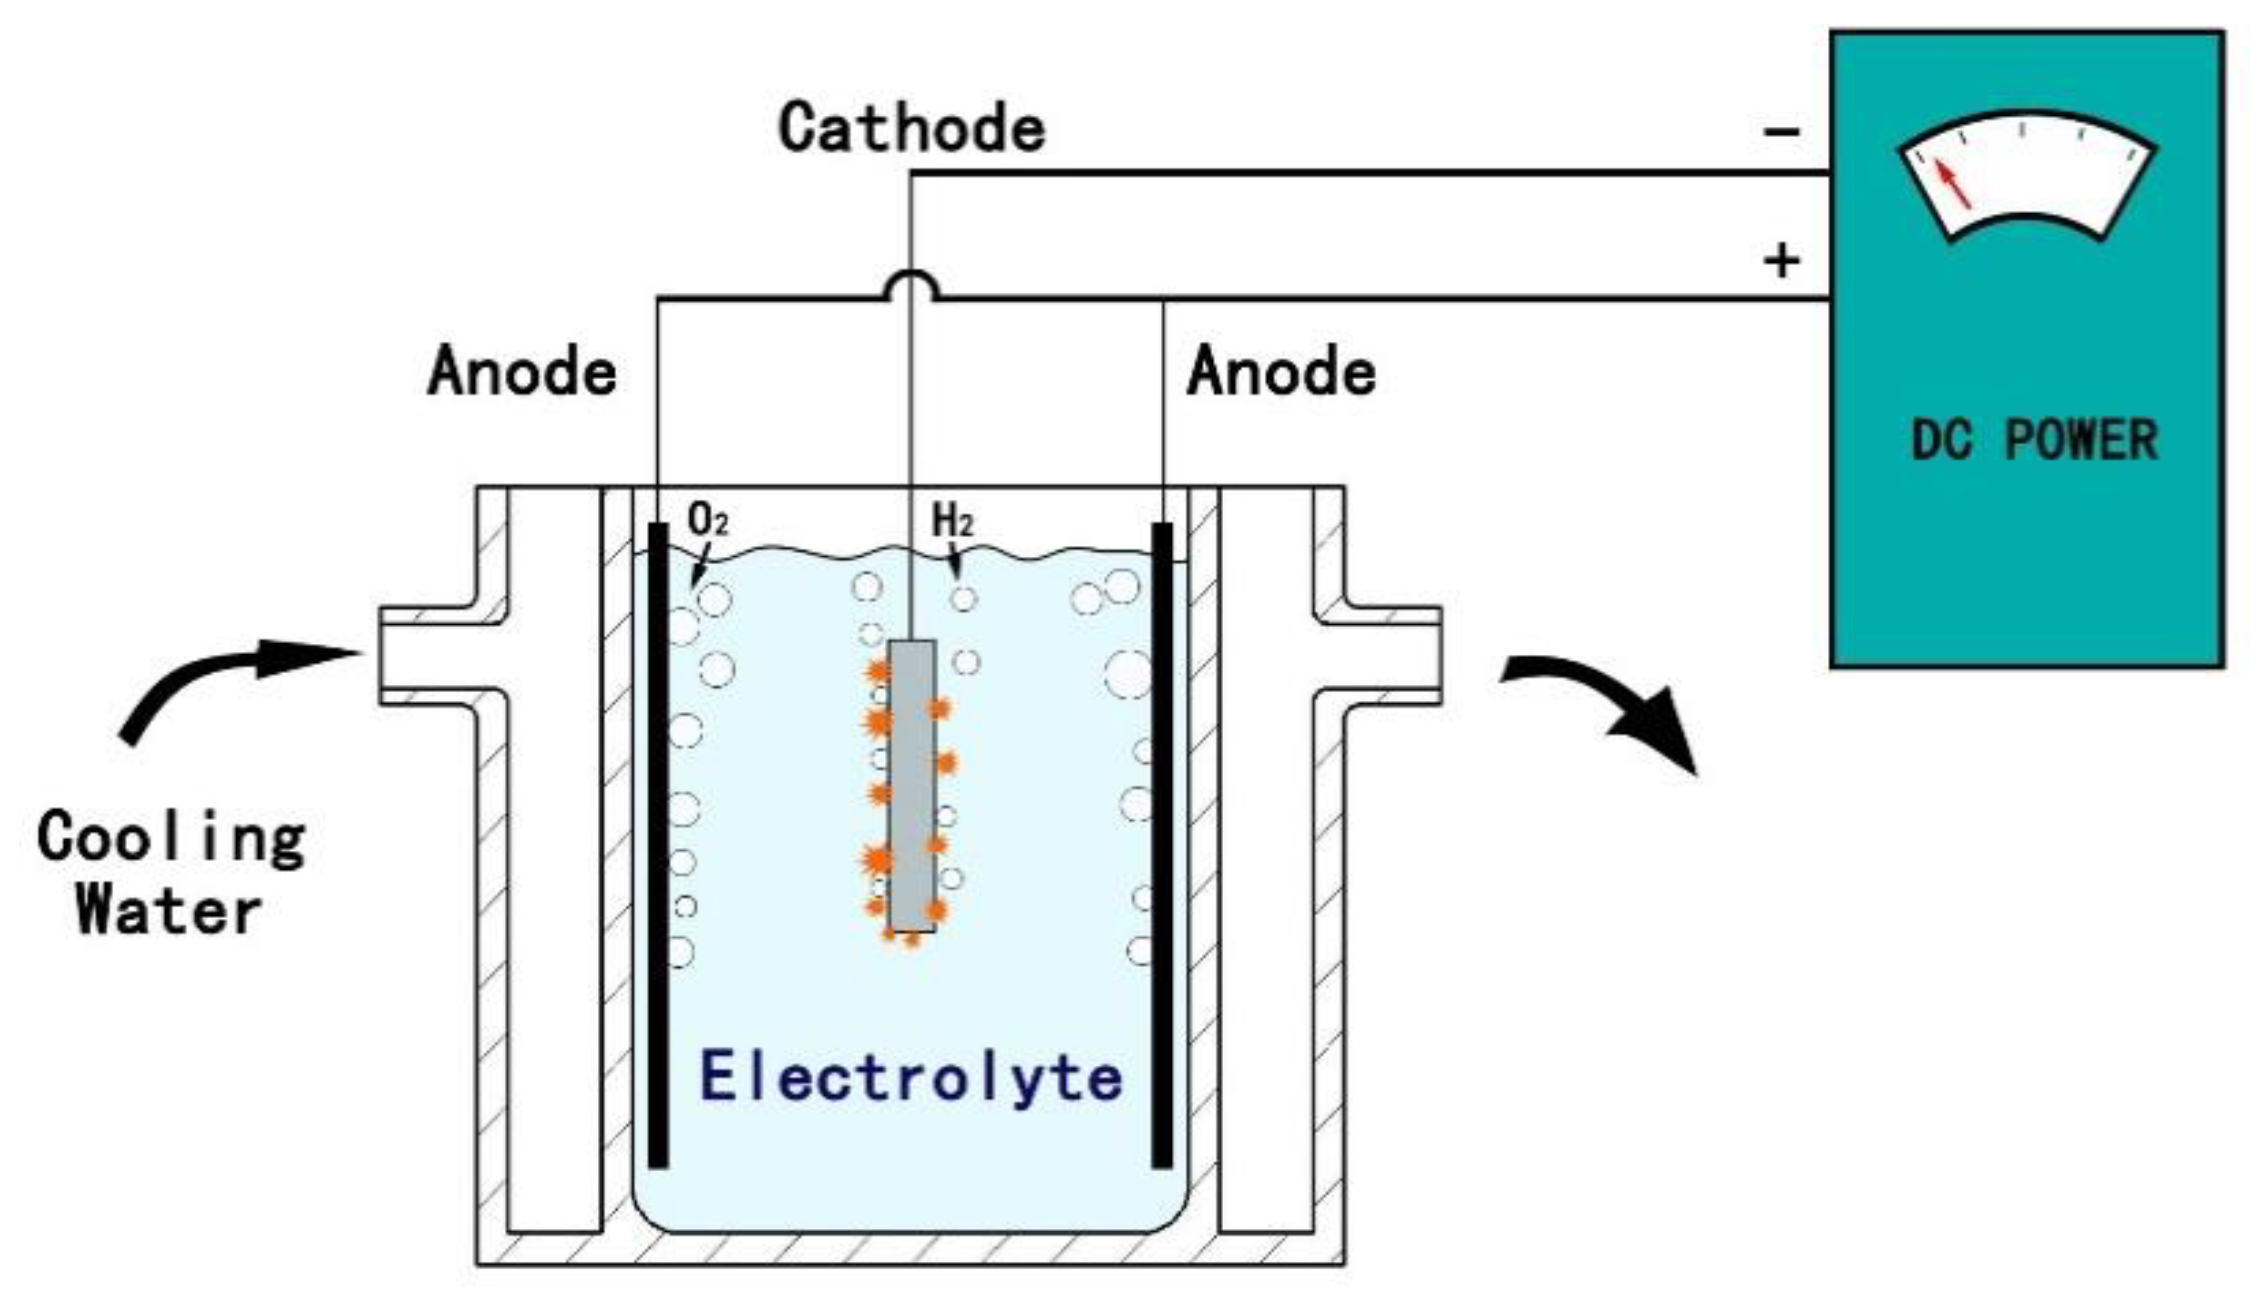
The experimental apparatus for CPED (TOPWER, Yangzhou, Jiangsu, China) involved a glass beaker containing circulating cooling water to control the electrolyte temperature at 25–30 °C during the CPED process (Figure 1). A direct-current (DC) source with a voltage range of 0–400 V was connected to the graphite plate anode and the substrate material the cathode. In experiments, the anode and cathode were inserted into the electrolyte 50 mm apart. The solutions employed for preparing Al2O3 coatings were 1.2 M Al(NO3)3 aqueous and ethanolic solutions.
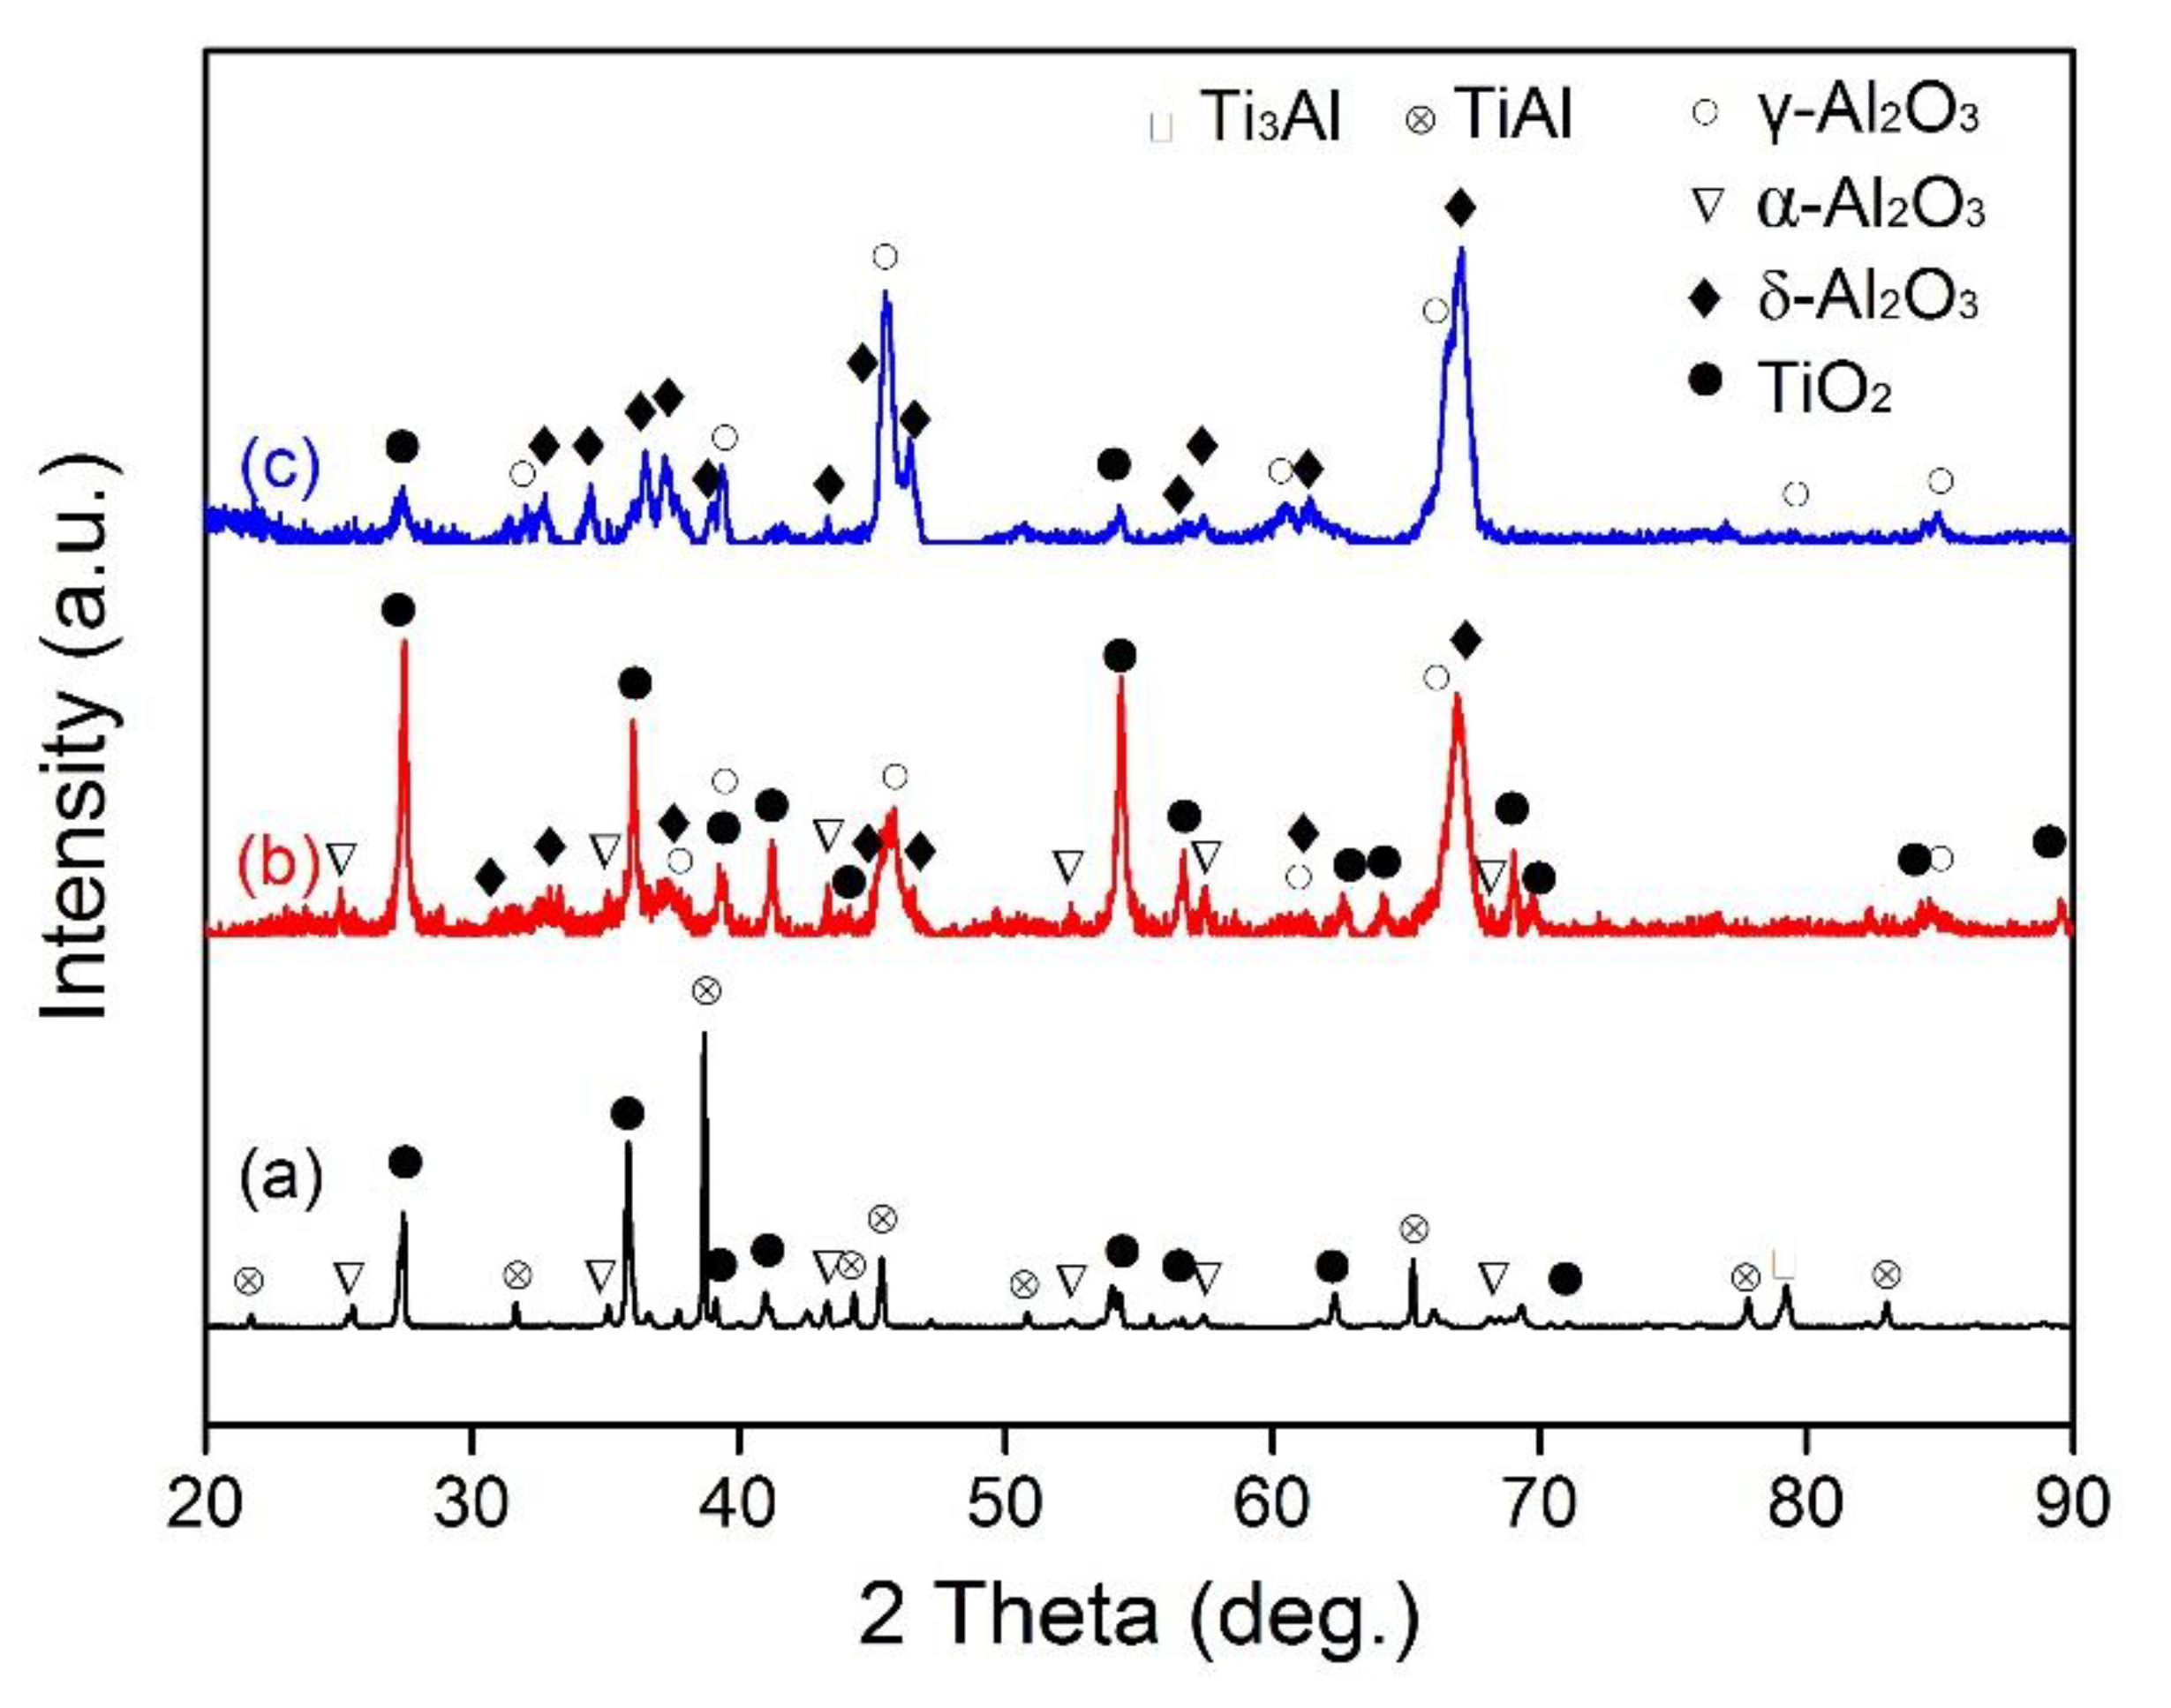
After deposition, phase constituents of deposited coatings were analyzed by X-ray diffraction (XRD) using a Rigaku Dmax-RB with Cu-Kα (40 kV, 40 mA, stepwise of 0.02°, and continuous scanning; Rigaku Corp., Tokyo, Japan) in the 2θ range of 20–90°. Additionally, The surface morphology of coatings were examined using scanning electron microscopy (SEM, Zeiss Supra55; Carl Zeiss Microscopy GmbH, Göttingen, Germany) in secondary electron (SE, 15 kV) imaging mode and cross sections were observed in back-scattered electron (BSE, 15 kV) mode. An energy-dispersive X-ray spectroscope (EDS, Thermo Scientific UltraDry; Thermo Fisher Scientific Inc., Pittsburgh, PA, USA) was used to analyze coating compositions. The adhesion properties of coatings were evaluated with a multi-function material surface tester (MFT-4000; Meriam, Wilmington, NC, USA). Dynamic contact angle measuring instruments and tensiometers (DCAT21; DataPhysics Instruments GmbH, Filderstadt, Germany) were applied to measure the surface tension of solutions.
Cyclic oxidation tests were conducted in a box-type resistance furnace at 900 °C in air for 100 h. During tests, samples were taken out from the furnace after 10 h, cooled to room temperature, and weighed. Then, samples were placed into the furnace again for another round of heating. The weight gained by samples during tests was measured with a 10−5 g-accuracy analytical balance. In a whole test period, 10 such rounds of heating were carried out to examine coating oxidation resistances.

3. Results

3.1. Current-Voltage Properties of Two Types of Solution

Current density-voltage (ic-V) curves in aqueous and ethanolic solutions were measured (Figure 2a) and it was found that the curves were similar to those measured in other previously reported solutions [30]. Regions larger than the critical voltage A0 in aqueous solution were suitable for the plasma process and the critical voltage in ethanolic solution termed E0. Compared to current density (ic) measured in aqueous solution, ic in ethanolic solution was much lower although the critical voltage (E0) was much larger. The reaction in ethanolic solution was also much slower than that in aqueous solution. The current density-time curves at selected voltages of 110 V (critical plasma voltage) in aqueous solution and at 180 V in ethanolic solutions are shown in Figure 2b. The cathode current density in aqueous solution changed little over the processing time. However, current density declined markedly within 60 s in ethanolic solution and the plasma intensity on the cathode surface also significantly decreased. As the stable current density in ethanolic solution was lower (~20 mA/cm2), such that the deposition time in ethanolic solution needed to be extended to obtain coatings with identical thicknesses with that obtained in aqueous solution. The experimental parameters of different samples in both solutions are shown in Table 1. All samples were conducted in constant electrode voltage mode and the processing times for samples deposited in aqueous and ethanolic solutions were 1 and 10 min.

3.2. Characterization of Prepared Coatings

The surface and cross-section morphologies of Al2O3 coatings on samples after CPED in aqueous solution at different voltages are shown in Figure 3. For samples treated at 110 V, most surfaces were covered with a thin layer of Al2O3 and some small craters observed, with the crater centers being plasma discharge channels on the surfaces. Far more craters were observed on the surfaces of samples treated at 120 V (Figure 3b) and a thicker Al2O3 coating accumulated within the same time, compared to the cross-section in Figure 3a. However, the coating structure was destroyed when the voltage was further raised to 130 V and most of the substrate surface remained exposed (Figure 3c). At 140 V, there was little coating on sample surfaces and the original surfaces damaged (Figure 3d). Some spheres of the same composition as the substrate were found on the surface after treatment with 140 V, which indicated that the substrate was partially melted by plasma during the process and then immediately cooled by the solution.
Surface morphologies of coatings prepared in ethanolic solution at 180–240 V for 10 min showed that coating surfaces prepared in ethanol solution (Figure 4) were clearly smoother than those obtained in aqueous solution (Figure 3). The coatings contained a large amount of small Al2O3 particles that particularly accumulated around small craters (Figure 4c). The crater sizes were much smaller than those observed in aqueous solution (Figure 3b) and their sizes grew with increasing electrode voltage. Average crater diameters were ~3 μm (Figure 4a) and grew up to ~6 μm when the voltage increased to 240 V (Figure 4d). Coating thicknesses also increased significantly with increasing voltage, with the coating thickness from 180 V at ~9 μm, which reached ~27 μm at 240 V.
EDS composition results of coating surfaces showed that Al and O contents on coating surfaces increased significantly, compared with uncoated samples, which confirmed that the coatings primarily consisted of Al compounds (Table 2). The detected Ti and Nb mainly derived from the substrate, with the Ti and Nb content attributable to both the coatings’ low thickness and high porosity. The results from coatings prepared at 120 V revealed that the lowest Ti component was among the A1–A4 samples (Table 2, A2), which indicated that these coatings had the maximum thickness. There was almost no Ti component in coatings produced in ethanolic solution when the voltage exceeded 200 V, which also showed that coatings were denser because the coating thickness of E2 was identical to that of A2. In addition, the atomic Al/O content was close to 2/3 in coating samples E1–E4, while the ratio was ~1/2 in samples A1–A4, which suggested that coatings fabricated in aqueous solution might contain OH.
XRD patterns of uncoated Ti-45Al-8.5Nb alloys and deposited Al2O3 coatings showed that, in XRD patterns of coatings obtained in each solution (Figure 5), the phase compositions did not change with voltage. There were peaks of γ-Al2O3 only in coatings prepared in ethanolic solution, which was similar to coatings prepared via anodic micro-arc oxidation, which were also mainly composed of γ-Al2O3 [31]. However, besides the γ-Al2O3 component, a small amount of Al(OH)3 was found in coatings deposited in aqueous solution, which agreed well with the earlier EDS analysis.

3.3. Scratch Tests of Prepared Coatings

In these experiments, adhesion characteristics were examined using scratch tests. A2 and E2 were selected as examples for scratch tests because of their similar 18-μm coating thickness (Figure 6). The critical normal loads of spallation (LS) of a coating obtained from ethanolic solution (E2) were larger than that from aqueous solution (A2). However, the critical spallation did not completely represent the adhesion property because local initial coating failure occurred at much lower loads (LC1) before spallation. In addition, LC2 values, defined as high loads at which catastrophic failure occurred, were also different, showing how long the coating could hold and withstand further loading before catastrophic fracture. Critical loads were determined from an average of 10 readings for each scratch track and 3 scratches applied to each coating (Table 3). These results showed that E2 coating possessed a higher critical load because of the higher LC1, which meant that it was more difficult to initiate a crack in the coating than in the A2 coating. The higher LC2 indicated that the coating prepared in ethanolic solution could also bear a larger load than that prepared in aqueous solution. Measurement of the scratch crack propagation resistance (CPRS) was applied as a quick qualitative index of coating toughness and the results showed that coatings prepared in ethanolic solution had the higher toughness.

3.4. High-Temperature Cyclic Oxidation Kinetics

Oxidation kinetics curves of samples obtained during 100-h cyclic oxidation tests are shown in Figure 7. Equation (1) was used to fit the curves of sample-weight gained in cyclic oxidation tests to analyze the kinetic rule in the oxidation process
Δ M = k × t n
where ∆M is the weight gain per unit area (mg/cm2), n the exponential power, k the high-temperature oxidation reaction rate constant (mg/(cm2·hn)), and t the oxidation time (h). The values of n and k, after fitting the curves of mass gain for different samples, showed that sample oxidation resistances were significantly improved by Al2O3 coatings, compared to uncoated substrates (Table 4). Among the samples processed in aqueous solution (A1–A4), A2 had the mimimun k value, which indicated that the A2 coating had the highest high-temperature oxidation resistance because this coating had the highest thickness (Figure 3b). Sample E3 was found to exhibit the best oxidation resistance among samples processed in ethanolic solution (E1–E4). Combined with the results shown in Figure 4, sample oxidation resistance also increased with coating thickness. However, although E4’s coating was thicker, its k was closer to that of E3, which was due to the larger crater sizes in the E4 coating. Furthermore, the coating formed in ethanolic solution showed higher resistance in terms of mass gains and k values of A2 and E2, because the coating thickness A2 was similar to that of E2, while A2 had higher mass gains during the oxidation process. This was also because of the larger craters sizes on the A2 coating. These results suggested that oxidation resistance had a clear, positive correlation with coating thickness and a negative correlation with porosity. Thus, a thicker coating needed to be obtained in aqueous solution to achieve the same oxidation resistance as that deposited in ethanolic solution.

3.5. Characterization of Samples after Oxidation

The surface morphology of samples A2 and E3 after oxidation tests showed that their morphologies changed little after oxidation (Figure 8). EDS results from different zones in Figure 8a,c are summarized in Table 5. Substrate elements were detected in the center in both craters on samples A2 and E3 (Table 5, Regions B and D), because the coating thicknesses of crater centers were smaller than in other regions. Both the crater sizes and numbers on A2 were much larger than those on E3, which led to higher mass gain in A2 during oxidation. EDS results from different positions in cross-sections in Figure 8d are also listed in Table 6. It was confirmed that the substrate was oxidized and that the oxidized scale possessed a triple-layer structure: an inner Nb-enriched, TiO2-enriched, and Al2O3-enriched layer [5]. The oxide layer of substrate A2 was clearly thicker than that of E3, which agreed with oxidation results (Figure 7).
XRD patterns of an uncoated sample (pattern a) and Al2O3-coated samples treated in aqueous solution (pattern b) and ethanolic solution (pattern c) after oxidation (Figure 9), which showed that oxidized scale of uncoated samples was mainly composed of α-Al2O3 and TiO2 [5]. The α-Al2O3 and TiO2 of patterns b and c also originated from substrate scales. The γ-Al2O3 in the original coating might have partially transformed to δ-Al2O3 at 900 °C, which conformed with results from a previous study [32].

4. Discussion

When a sample was immersed in electrolyte as a cathode and voltage potential loaded, hydrogen reduction occurred on the cathode surface, with hydrogen bubbles appearing on the cathode. Then, the electric field strength in the bubbles increased because the covering hydrogen bubbles provided a barrier layer and cations gathered on their surfaces. The gas inside the bubbles ionized and plasma appeared when the electric field strength in the bubbles exceeded a critical value; similar descriptions have been proposed for plasma processes [30]. Some physical and chemical reactions were then promoted by high temperature around this plasma zone. Thus, here, Al(OH)3 formed around the cathode surface and then transformed into Al2O3 [33], according to
A l 3 + + 3 O H A l ( O H ) 3
2 A l ( O H ) 3 p l a s m a A l 2 O 3 + 3 H 2 O
Hydroxide ions were mainly derived from the reduction of O2, NO3-, and H2O [34]:
O 2 + 2 H 2 O + 4 e 4 O H
2 H 2 O + 2 e H 2 + 2 O H
N O 3 + H 2 O + 2 e N O 2 + 2 O H
During early deposition stages, a thin Al2O3 coating was deposited on the TiAl substrate, replacing the hydrogen bubbles as a barrier layer. Cathode micro-arc discharges always happened at thinner Al2O3-coating areas because of lower electric resistance while some Al2O3 coating accumulated on thinner areas. The reactions in aqueous and ethanolic solutions were similar during the deposition process but the current characteristics and coating quality differed considerably. According to the circuit law proposed by Kirchhoff, the bath voltage in electrolysis was defined by the equation [29]
V = η a + i c S c R i + η c
in which, ηa is the anode overpotential, ηc that of the cathode, ic the cathode current density, Sc the cathode surface area, and Ri the solution resistance. The current declined in ethanolic solution with increasing deposition time because the ceramic coating thickness increased such that a larger overpotential loaded on the cathode surface because of the coating electric resistance. The Al2O
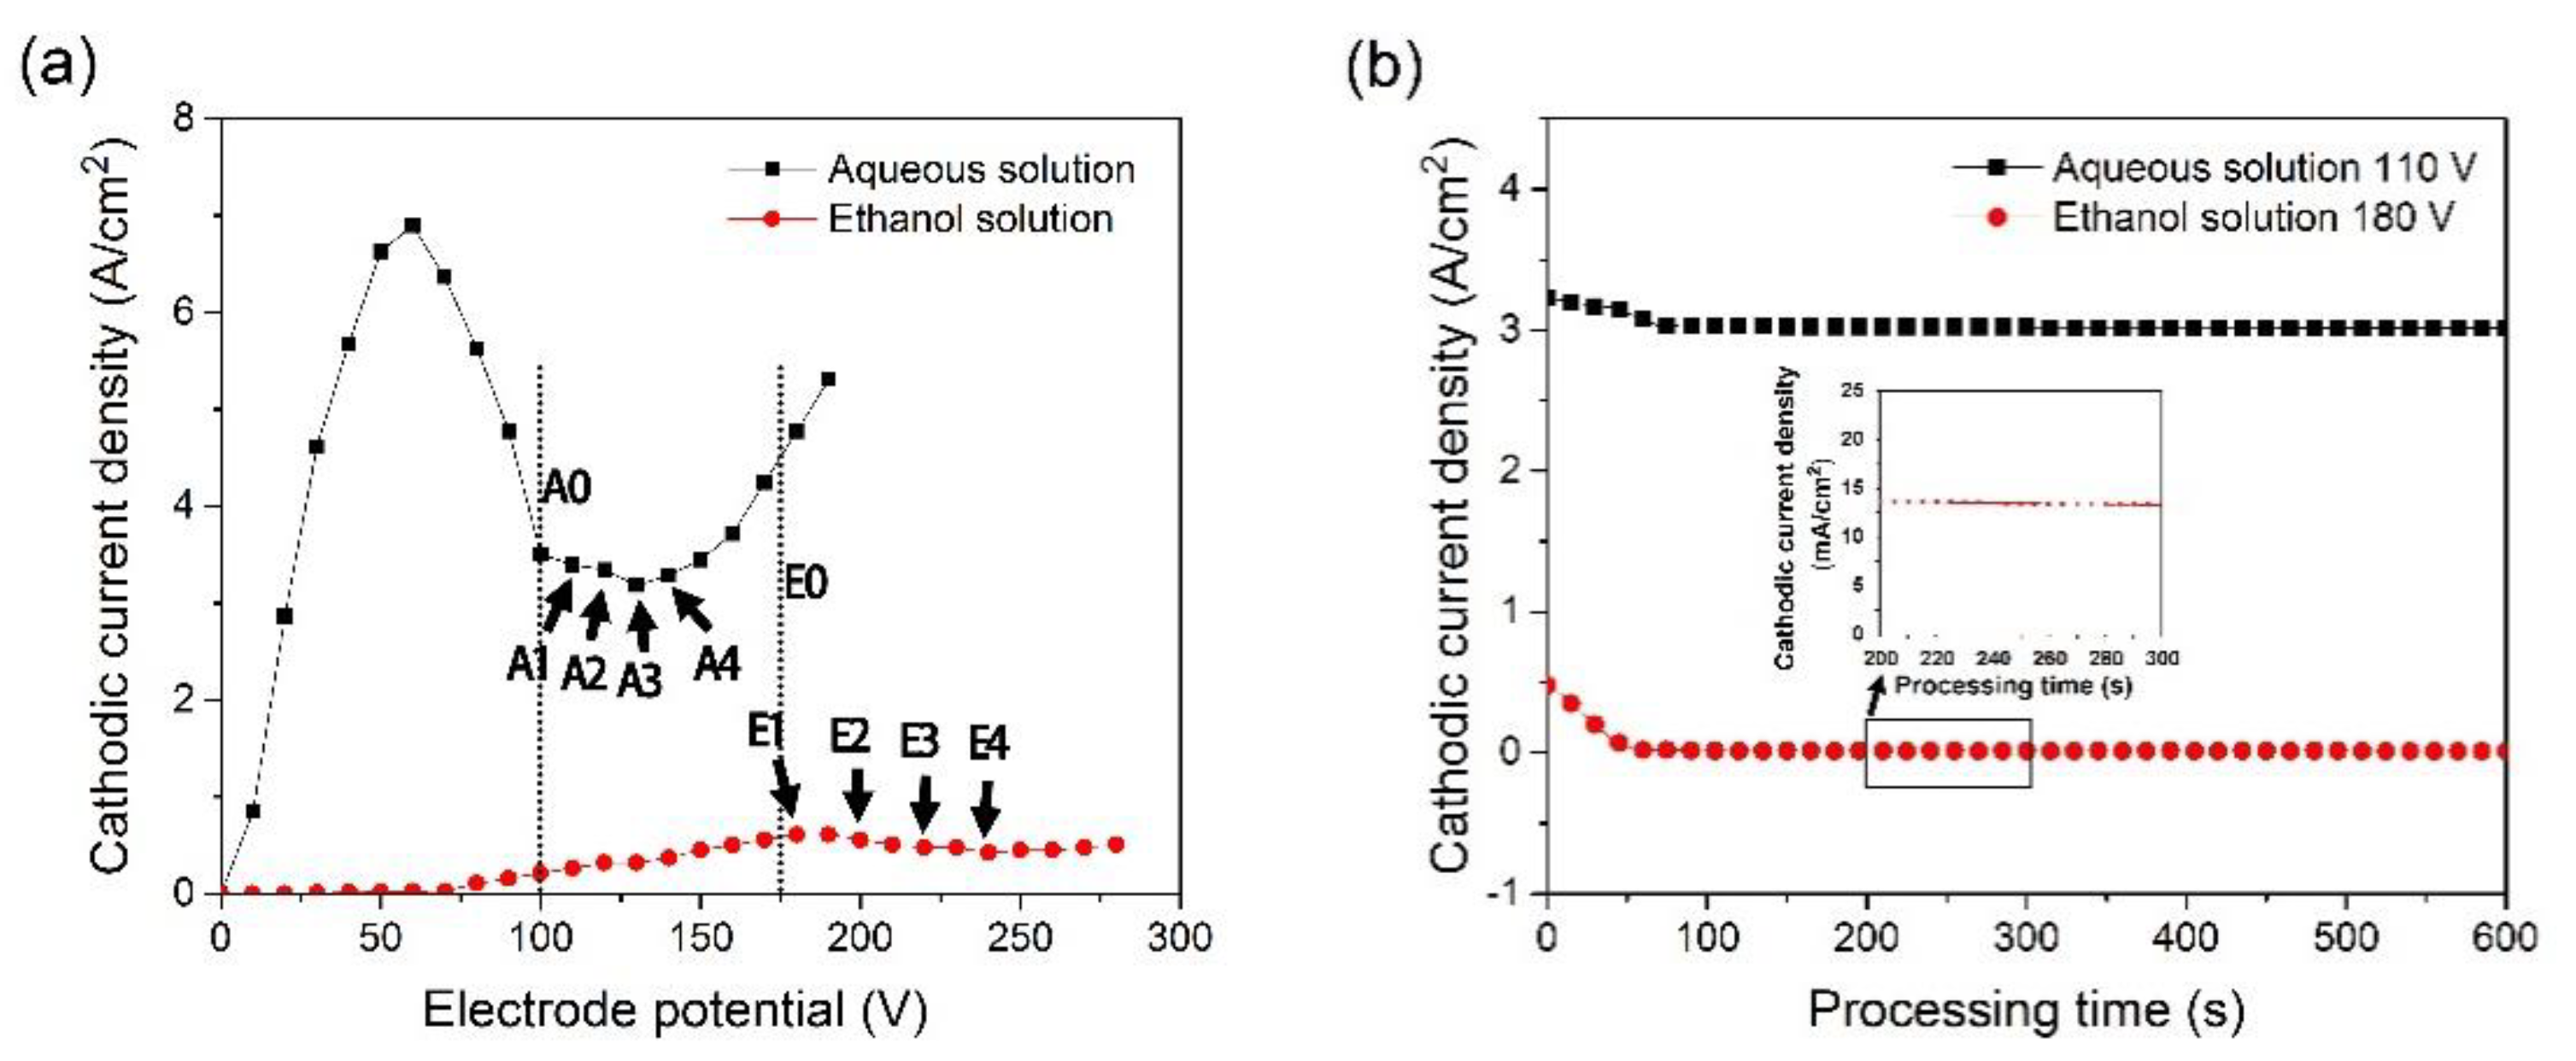
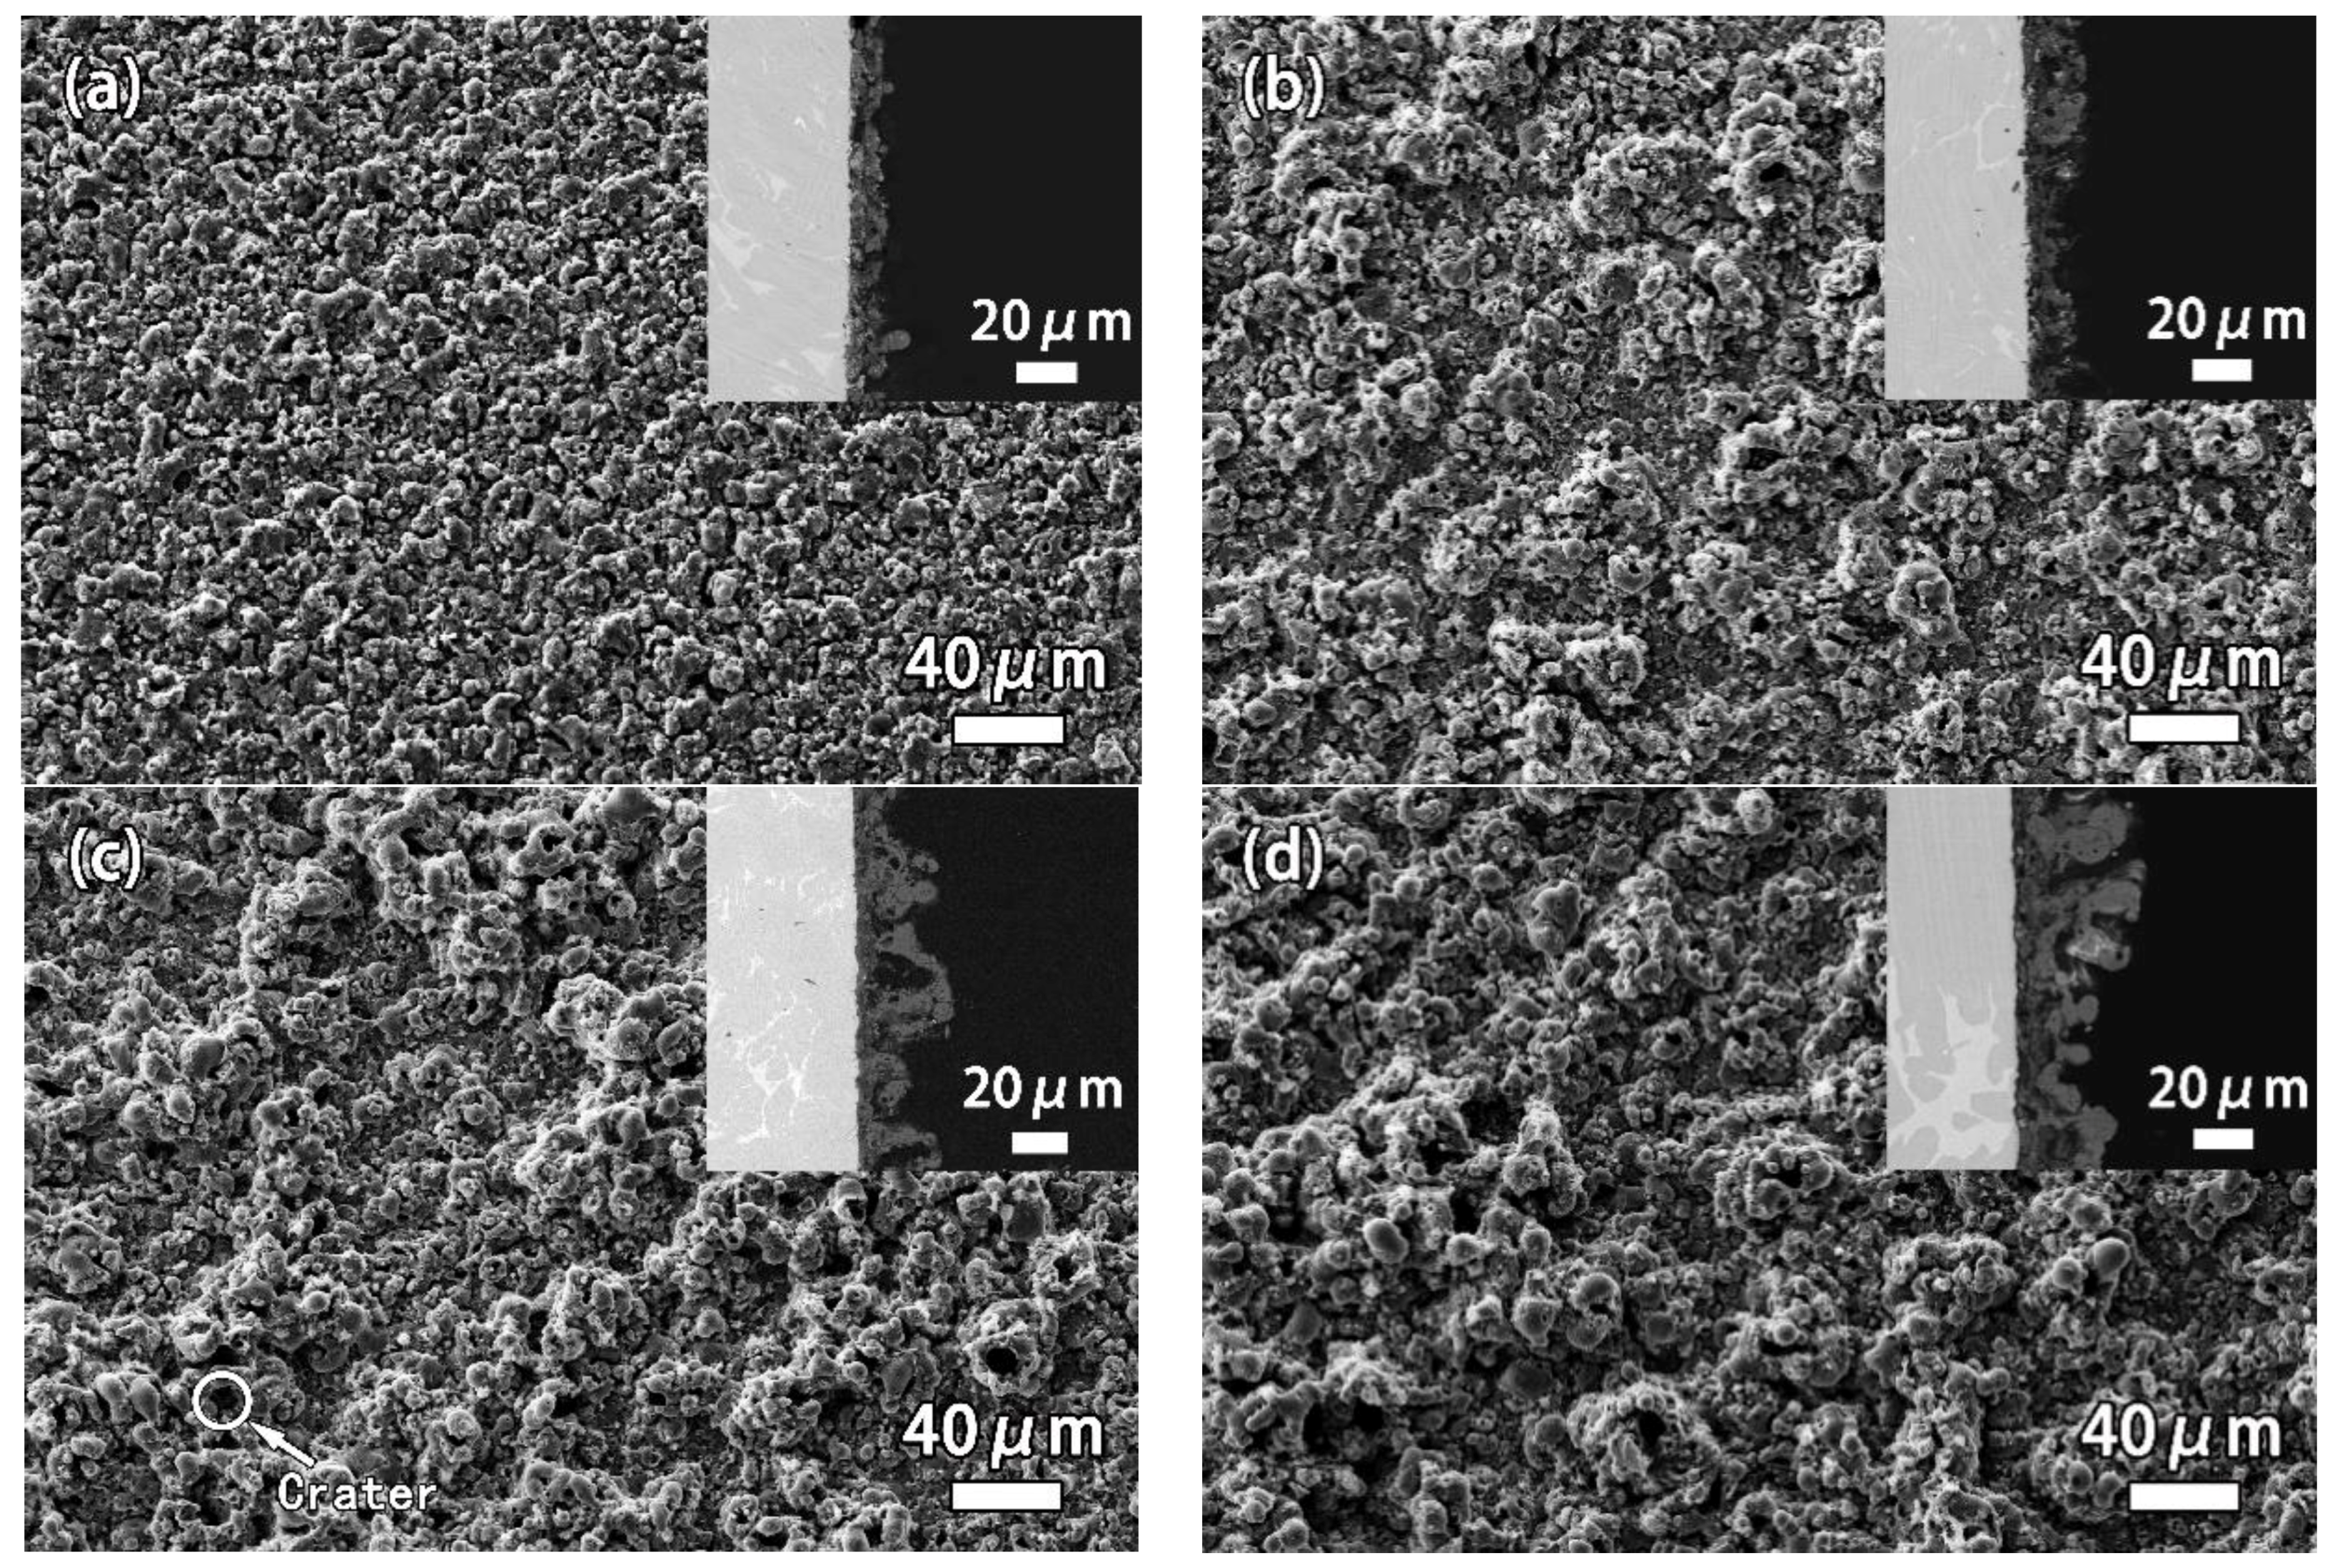
3 coating replaced the bubble film during coating growth, such that the cathode reaction area declined. The current preferentially flowed across the coating’s weak regions, such that the number of tiny arcs (plasma) was also reduced. However, the current density in aqueous solution did not decrease with deposition time because the electric resistance of aqueous solution was much lower than that of the ethanolic solution. The coating’s electric resistance little affected the overpotential and the bubble layer played the main role in the barrier layer for plasma formation. In addition, the crater sizes on coatings obtained from aqueous solution were larger, which further weakened its oxidation resistance. Therefore, from this point of view, ethanolic solution was more appropriate for ceramic coating deposition.
During the initial stage of the deposition process, there was no coating on the cathode surface and the current density in ethanolic solution also smaller than that in aqueous solution. Some mathematical models describing electrode surface bubble coverage and current density have been established in previous studies [35]. A hypothesis has been proposed here that constant bubble coverage of the cathode surface is required for plasma formation in different solutions. It is certain that solution surface tension reduction increases bubble coverage at a constant current density [35,36]. In other words, a lower current density is required for the same bubble coverage on the electrode when bubbles are smaller. From the surface tensions of these two solutions at 25 °C, it was clear that the ethanolic solution surface tension was much lower than that of the aqueous solution, which was the main reason why the initial current density was lower in the ethanolic solution (Table 7). Surface tensions are also known to considerably influence a bubble’s departure size, which is the largest size bubble attached on the cathode surface before release, and surface tension also provides an estimate of the static bubble departure size, given by [37]
d = 1 2 C ( σ g ( ρ 1 ρ g ) ) 1 / 2
where C represents constant coefficients, ρg the hydrogen gas density, ρ1 the solution density, and σ the solution surface tension. Figure 10 shows the crater size distribution on coatings of A2 and E4, with the sizes of 300 craters per sample counted from SEM figures. A crater center was the plasma channel position on the cathode surface at which Al2O3 particles accumulated. Therefore, crater size was related to bubble size in the deposition process. According to Equation (8), the maximum bubble size in solution was only in relation to solution properties. Thus, the maximum crater size did not change in response to deposition voltage. The maximum crater size ratio on coatings prepared in aqueous and ethanolic solutions was ~1.67. From Equation (8), the approximate estimation of the ratio for bubble departure sizes in the two solutions was ~1.6, which was similar to the crater size ratio. Therefore, it was confirmed that a lower solution surface tension led to crater size declines on the coatings.
Crater size also affected coating structure, as craters on a surface were held in the coating as pores during the following coating accumulation. Therefore, porosity also increased with average bubble size, significantly affecting coating properties. Discontinuity induced by pores was the main factor affecting adhesion properties and oxidation resistance. Larger porosity reduced coating strength as well as the contact surface area between coating and substrate, which then resulted in lower coating toughness in scratch tests. There was also little doubt that larger porosity was the chief factor responsible for the lower oxidation resistance. Thus, the application of ethanol as a solvent did not only improve coating quality but also would reduce energy consumption during industrial coating production. Although the processing time would be extended using ethanolic solutions, current density decreased rapidly when the ceramic coating covered most of the substrate surface. Therefore, ethanol could attain a dominant position as the preferred solvent, compared to water.

5. Conclusions

Al2O3 was prepared on Ti-45Al-8.5Nb alloy using the CPED process, which improved the substrate’s oxidation resistance. The resulting coatings mainly consisted of γ-Al2O3, with coatings obtained in ethanolic solution showing smaller surface craters compared to coatings prepared in aqueous solution, which significantly affected adherence and oxidation resistance. Coatings prepared in ethanolic solution obtained higher adhesion properties with the substrate as well higher oxidation resistance. Oxidation resistance was also affected by coating thickness. The chief solution property that affected the deposition process and coating quality was solution surface tension. The application of ethanol as the solvent noticeably reduced solution surface tension, which significantly reduced bubble sizes during the CPED process and led to lower current density of CPED process and smaller coating-crater size.

Author Contributions

The work presented here was carried out in collaboration between all authors. X.Y. conceived and designed the experiments; Z.J. performed the experiments; G.H., X.D. and Y.L. analyzed the data; J.L. contributed analysis tools; and X.Y. wrote the paper.

Acknowledgments

This research was supported by the National Natural Science Foundation of China (Nos. 51671016 and 51671026).

Conflicts of Interest

The authors declare no conflict of interest.

References

  1. Zhao, L.L.; Li, G.Y.; Zhang, L.Q.; Lin, J.P.; Song, X.P.; Ye, F.; Chen, G.L. Influence of Y addition on the long time oxidation behaviors of high Nb containing TiAl alloys at 900 °C. Intermetallics 2010, 18, 1586–1596. [Google Scholar] [CrossRef]
  2. Froes, F.H. Production, characteristics, and commercialization of titanium aluminides. J. Mater. Eng. 1991, 31, 1235–1248. [Google Scholar] [CrossRef]
  3. Yamaguchi, M.; Inui, H.; Ito, K. High-temperature structural intermetallics ☆. Acta Mater. 2000, 48, 307–322. [Google Scholar] [CrossRef]
  4. Chen, G.; Sun, Z.; Zhou, X. Oxidation and mechanical behavior of intermetallic alloys in the Ti-Nb-Al ternary system. Mater. Sci. Eng. A 1992, 153, 597–601. [Google Scholar] [CrossRef]
  5. Lin, J.P.; Zhao, L.L.; Li, G.Y.; Zhang, L.Q.; Song, X.P.; Ye, F.; Chen, G.L. Effect of Nb on oxidation behavior of high Nb containing TiAl alloys. Intermetallics 2011, 19, 131–136. [Google Scholar] [CrossRef]
  6. Taniguchi, S.; Uesaki, K.; Zhu, Y.C.; Zhang, H.X.; Shibata, T. Influence of niobium ion implantation on the oxidation behaviour of TiAl under thermal cycle conditions. Mater. Sci. Eng. A 1998, 249, 223–232. [Google Scholar] [CrossRef]
  7. Becker, S.; Rahmel, A.; Schorr, M.; Schütze, M. Mechanism of isothermal oxidation of the intel-metallic TiAl and of TiAl alloys. Oxid. Met. 1992, 38, 425–464. [Google Scholar] [CrossRef]
  8. Prasad, B.D.; Sankaran, S.N.; Wiedemann, K.E.; Glass, D.E. Platinum substitutes and two-phase-glass overlayers as a low cost alternatives to platinum aluminide coatings. Thin Solid Films 1996, 345, 255–262. [Google Scholar] [CrossRef]
  9. Deodeshmukh, V.; Mu, N.; Li, B.; Gleeson, B. Hot corrosion and oxidation behavior of a novel Pt + Hf-modified γ-Ni3Al+γ-Ni-based coating. Surf. Coat. Technol. 2006, 201, 3836–3840. [Google Scholar] [CrossRef]
  10. Yang, X.; Peng, X.; Wang, F. Hot corrosion of a novel electrodeposited, Ni-6Cr-7Al nanocomposite under molten (0.9Na, 0.1K)(2)SO4 at 900 degrees C. Scripta Mater. 2007, 56, 891–894. [Google Scholar] [CrossRef]
  11. Miyake, M.; Tajikara, S.; Hirato, T. Fabrication of TiAl3 coating on TiAl-based alloy by Al electrodeposition from dimethylsulfone bath and subsequent annealing. Surf. Coat. Technol. 2011, 205, 5141–5146. [Google Scholar] [CrossRef] [Green Version]
  12. Wang, Y.H.; Liu, Z.G.; Ouyang, J.H.; Wang, Y.M.; Zhou, Y. Preparation and high temperature oxidation resistance of microarc oxidation ceramic coatings formed on Ti2AlNb alloy. Appl. Surf. Sci. 2012, 258, 8946–8952. [Google Scholar] [CrossRef]
  13. Yao, J.; He, Y.; Wang, D.; Lin, J. High-temperature oxidation resistance of (Al2O3–Y2O3)/(Y2O3-stabilized ZrO2) laminated coating on 8Nb–TiAl alloy prepared by a novel spray pyrolysis. Corros. Sci. 2014, 80, 19–27. [Google Scholar] [CrossRef]
  14. Medraj, M.; Hammond, R.; Parvez, M.A.; Drew, R.A.L.; Thompson, W.T. High temperature neutron diffraction study of the Al2O3–Y2O3 system. J. Eur. Ceram. Soc. 2006, 26, 3515–3524. [Google Scholar] [CrossRef]
  15. Mah, T.I.; Keller, K.A.; Sambasivan, S.; Kerans, R.J. High-Temperature Environmental Stability of the Compounds in the Al2O3–Y2O3 System. J. Am. Ceram. Soc. 1997, 80, 874–878. [Google Scholar] [CrossRef]
  16. Keyvani, A.; Saremi, M.; Sohi, M.H. Oxidation resistance of YSZ-alumina composites compared to normal YSZ TBC coatings at 1100 °C. J. Alloys Compd. 2011, 509, 8370–8377. [Google Scholar] [CrossRef]
  17. Braun, R.; Fröhlich, M.; Braue, W.; Leyens, C. Oxidation behaviour of gamma titanium aluminides with EB-PVD thermal barrier coatings exposed to air at 900 °C. Surf. Coat. Technol. 2007, 202, 676–680. [Google Scholar] [CrossRef]
  18. Ruhi, G.; Modi, O.P.; Sinha, A.S.K.; Singh, I.B. Effect of sintering temperatures on corrosion and wear properties of sol-gel alumina coatings on surface pre-treated mild steel. Corros. Sci. 2008, 50, 639–649. [Google Scholar] [CrossRef]
  19. Kępas, A.; Grzeszczuk, M. Implications of layer-by-layer electrodeposition of polypyrrole from a solution of the same composition for ion transport in the polymer electrode. J. Electroanal. Chem. 2005, 582, 209–220. [Google Scholar] [CrossRef]
  20. Cordero-Arias, L.; Boccaccini, A.R.; Virtanen, S. Electrochemical behavior of nanostructured TiO2/alginate composite coating on magnesium alloy AZ91D via electrophoretic deposition. Surf. Coat. Technol. 2015, 265, 212–217. [Google Scholar] [CrossRef]
  21. Gupta, P.; Tenhundfeld, G.; Daigle, E.; Ryabkov, D. Electrolytic plasma technology: Science and engineering—An overview. Surf. Coat. Technol. 2007, 201, 8746–8760. [Google Scholar] [CrossRef]
  22. Yerokhin, A.; Nie, X.; Leyland, A.; Matthews, A.; Dowey, S. Plasma electrolysis for surface engineering. Surf. Coat. Technol. 1999, 122, 73–93. [Google Scholar] [CrossRef]
  23. Nie, X.; Leyland, A.; Song, H.; Yerokhin, A.; Dowey, S.; Matthews, A. Thickness effects on the mechanical properties of micro-arc discharge oxide coatings on aluminium alloys. Surf. Coat. Technol. 1999, 116, 1055–1060. [Google Scholar] [CrossRef]
  24. Yerokhin, A.L.; Snizhko, L.O.; Gurevina, N.L.; Leyland, A.; Pilkington, A.; Matthews, A. Matthews Discharge characterization in plasma electrolytic oxidation of aluminium. J. Phys. D 2003, 36, 2110–2120. [Google Scholar] [CrossRef]
  25. Deng, S.; Wang, P.; He, Y. Influence of adding glass beads in cathode region on the kinetics of cathode plasma electrolytic depositing ZrO2 coating. Surf. Coat. Technol. 2015, 279, 92–100. [Google Scholar] [CrossRef]
  26. Wang, Y.; Jiang, Z.; Liu, X.; Yao, Z. Influence of treating frequency on microstructure and properties of Al2O3 coating on 304 stainless steel by cathodic plasma electrolytic deposition. Appl. Surf. Sci. 2009, 255, 8836–8840. [Google Scholar] [CrossRef]
  27. Deng, S.; Wang, P.; He, Y.; Zhang, J. Thermal barrier coatings with Al2O3–Pt composite bond-coat and La2Zr2O7–Pt top-coat prepared by cathode plasma electrolytic deposition. Surf. Coat. Technol. 2016, 291, 141–150. [Google Scholar] [CrossRef]
  28. Wang, P.; He, Y.; Zhang, J. Influence of Pt particles on the porosity of Al2O3 coating prepared by cathode plasma electrolytic deposition. Mater. Chem. Phys. 2016, 184, 1–4. [Google Scholar] [CrossRef]
  29. Wang, P.; Deng, S.; He, Y.; Liu, C.; Zhang, J. Influence of polyethylene glycol on cathode plasma electrolytic depositing Al2O3 anti-oxidation coatings. Ceram. Int. 2016, 42, 8229–8233. [Google Scholar] [CrossRef]
  30. Meletis, E.I.; Nie, X.; Wang, F.L.; Jiang, J.C. Electrolytic plasma processing for cleaning and metal-coating of steel surfaces. Surf. Coat. Technol. 2002, 150, 246–256. [Google Scholar] [CrossRef]
  31. Oliver, W.C.; Lucas, B.N.; Pharr, G.M. Mechanical Characterization Using Indentation Experiments; Springer: Dordrecht, The Netherlands, 1993. [Google Scholar]
  32. Lee, J.; Jeon, H.; Dong, G.O.; Szanyi, J.; Kwak, J.H. Morphology-dependent phase transformation of γ-Al2O3. Appl. Catal. A 2015, 500, 58–68. [Google Scholar] [CrossRef]
  33. Wang, X.; Liu, F.; Song, Y.; Liu, Z.; Qin, D. Structure and properties of Al2O3coatings formed on NiTi alloy by cathodic plasma electrolytic deposition. Surf. Coat. Technol. 2016, 285, 128–133. [Google Scholar] [CrossRef]
  34. Gal-Or, L.; Silberman, I.; Chaim, R. Electrolytic ZrO2 Coatings. J. Electrochem. Soc. 1991, 138, 1939–1942. [Google Scholar] [CrossRef]
  35. Vogt, H.; Balzer, R.J. The bubble coverage of gas-evolving electrodes in stagnant electrolytes. Electrochim. Acta 2005, 50, 2073–2079. [Google Scholar] [CrossRef]
  36. Shakarji, R.A.; He, Y.; Gregory, S. The sizing of oxygen bubbles in copper electrowinning. Hydrometallurgy 2011, 109, 168–174. [Google Scholar] [CrossRef]
  37. Jiang, B.; Lan, S.; Wilt, K.; Ni, J. Modeling and experimental investigation of gas film in micro-electrochemical discharge machining process. Int. J. Mach. Tool. Manuf. 2015, 90, 8–15. [Google Scholar] [CrossRef]
Figure 1. Experimental apparatus used for cathode plasma electrolytic deposition (CPED).
Metals 08 00308 g001
Figure 2. Typical cathodic current density versus voltage in the two solutions (a) and cathodic current density versus processing time (b).
Metals 08 00308 g002
Figure 3. Typical deposition surface morphologies and cross-sections (upper-right insets) after CPED processing in aqueous solution at different voltages: (ad) 110; 120; 130; and 140 V, respectively.
Metals 08 00308 g003
Figure 4. Typical deposition surface morphologies and cross-sections (upper-right insets) after CPED processing in ethanol solution at different voltages: (ad) 180; 200; 220; and 240 V, respectively.
Metals 08 00308 g004
Figure 5. Sample XRD patterns of uncoated substrate (a) and Al2O3 coating obtained in aqueous (b) and ethanolic solutions (c).
Metals 08 00308 g005
Figure 6. Results of scratch tests on Al2O3 coatings prepared in aqueous (a) and ethanolic (b) solutions.
Metals 08 00308 g006
Figure 7. Cyclic oxidation kinetic curves of samples treated in aqueous (a) and ethanolic solution (b).
Metals 08 00308 g007
Figure 8. Surface morphologies and cross-sections of samples of A2 (a,b) and E3 (c,d) after oxidation.
Metals 08 00308 g008
Figure 9. XRD patterns of samples after oxidation, showing phase constituents of uncoated sample (a) and Al2O3 prepared in aqueous solution (b) and ethanolic solution (c).
Metals 08 00308 g009
Figure 10. Size distribution of craters on Al2O3 coating of sample A2 (a) sample E4 (b).
Metals 08 00308 g010
Table 1. Sample processing parameters.
SolutionSampleVoltage (V)Processing Time (min)
AqueousA11101
A21201
A31301
A41401
EthanolE118010
E220010
E322010
E424010
Table 2. Energy-dispersive X-ray spectroscope (EDS) analysis of the surface of samples and deposition processing.
SolutionSampleComposition (at %)
AlOTiNb
-Pure Al2O340.9559.05--
AqueousA127.8463.27.841.12
A228.5266.014.461.01
A329.1361.648.250.97
A424.7159.2114.541.54
EthanolE141.1253.494.870.52
E240.8757.491.520.12
E340.4558.810.700.04
E441.0758.260.660.01
Table 3. Critical loads on scratch test.
SampleLoad at Initial Failure (LC1/N)Load at Coating Spallation (LS/N)Load at Complete Substrate Exposure (LC2/N)CPRS LC1 (LC2-LC1)
Aqueous1.5 ± 0.533.3 ± 1.539.5 ± 2.157.0
Ethanolic8.2 ± 1.248.0 ± 3.749.8 ± 5.9341.12
Table 4. The k and n values for CPED-treated samples at 900 °C after oxidation for 100 h.
ParametersSubstrateA1A2A3A4E1E2E3E4
k0.2420.1120.1060.1270.1890.0870.0800.0610.071
n0.2910.4310.4300.4150.3370.4680.4810.4980.472
Table 5. EDS analysis of different positions marked in Figure 8a,b.
SolutionRegionComposition (at %)
AlOTiNb
AqueousA31.1261.117.140.62
B30.3451.7417.560.37
EthanolC39.8159.180.880.13
D31.4254.0614.420.09
Table 6. EDS analysis of different positions on the cross-section in Figure 8d.
PositionComposition (at %)
AlOTiNb
137.0811.9332.9118.07
29.7055.8226.478.01
335.1256.497.820.57
447.2051.950.760.09
Table 7. Surface tension of both electrolytes.
SolutionSubstrate (mN/m)
1.2 M Al(NO3)3 aqueous solution70.30
1.2 M Al(NO3)3 ethanolic solution26.54

