Article

Correlation between Fatigue Crack Growth Behavior and Fracture Surface Roughness on Cold-Rolled Austenitic Stainless Steels in Gaseous Hydrogen

1
Nuclear Fuels and Materials Division, Institute of Nuclear Energy Research, Taoyuan 32546, Taiwan
2
Department of Materials Science and Engineering, National Taiwan University, Taipei 10617, Taiwan
3
Institute of Materials Engineering, National Taiwan Ocean University, Keelung 20224, Taiwan
*
Author to whom correspondence should be addressed.
Metals 2018, 8(4), 221; https://doi.org/10.3390/met8040221
Submission received: 6 March 2018 / Revised: 26 March 2018 / Accepted: 26 March 2018 / Published: 28 March 2018

Abstract

:
Austenitic stainless steels are often considered candidate materials for use in hydrogen-containing environments because of their low hydrogen embrittlement susceptibility. In this study, the fatigue crack growth behavior of the solution-annealed and cold-rolled 301, 304L, and 310S austenitic stainless steels was characterized in 0.2 MPa gaseous hydrogen to evaluate the hydrogen-assisted fatigue crack growth and correlate the fatigue crack growth rates with the fracture feature or fracture surface roughness. Regardless of the testing conditions, higher fracture surface roughness could be obtained in a higher stress intensity factor (∆K) range and for the counterpart cold-rolled specimen in hydrogen. The accelerated fatigue crack growth of 301 and 304L in hydrogen was accompanied by high fracture surface roughness and was associated with strain-induced martensitic transformation in the plastic zone ahead of the fatigue crack tip.

1. Introduction

Austenitic stainless steels (ASSs) are used extensively in different industries because of their superior corrosion resistance, adequate mechanical properties, and low hydrogen embrittlement (HE) susceptibility. The tensile strength of these materials can be increased by means of rolling at room temperature which causes austenite(γ)-to-martensite transformation during plastic deformation [1,2,3,4,5,6,7,8]. The martensitic transformation is related to the austenite stability which varies with the Cr and Ni contents of ASSs [9,10]. Angel et al. determined the austenite stability by Md(30/50) temperature [11], i.e., the temperature at which 50% of the austenite transforms into martensite during tensile testing at a true strain of 0.3, as shown in the following equation:
Md(30/50) (°C) = 413 − 13.7 (%Cr) − 9.5 (%Ni) − 8.1 (%Mn) − 18.5 (%Mo) − 9.2 (%Si) − 462 (%(C + N))
Higher Md(30/50) temperatures mean greater instability of the austenite. Moreover, the degree of martensitic transformation is both temperature and strain dependent [12,13,14,15,16,17,18,19]. An increase in the degree of cold work will assist the transformation, whereas an increase in the temperature exhibits the opposite effect [20,21,22].
The HE susceptibility is directly associated with the microstructure, stress state, and hydrogen concentration at the crack tip [23,24,25]. It has been reported that Ni contents play a vital role in the HE susceptibility of ASSs [26,27,28]. The strain-induced martensite in the metastable ASSs provides a short path for the diffusion of hydrogen to the fatigue crack tip, leading to an increased hydrogen concentration in the plastic zone [29,30,31,32]. Brittle fracture of strain-induced martensite ahead of the crack tip accounts for accelerated fatigue crack growth rates (FCGRs) of the ASSs in hydrogen as compared with those in air [33,34].
In addition to the microscopic technique, several methods have been employed to investigate the crack growth behavior under cyclic loading; theoretical models of crack opening displacement (COD) and plastic zone size were developed by Irwin to evaluate the stress state near the crack tip [35]. The X-ray microtomography has proved to be a promising technique for in situ or local study of three-dimensional crack propagation [36]. Tanabe et al. [37] proposed a nondestructive measurement using scanning Hall probe microscope (SHPM) to highlight the changes of magnetic flux density at the crack tip. Results showed that the magnetic flux density had a strong correlation with the stress intensity factor. Another nondestructive evaluation in Saka’s [38] work characterized the approximate crack length of a three-dimensional surface crack through electromagnetic method. Furthermore, the infrared thermography allowed real-time acquisition of data by means of a simple set-up of an infrared camera which made on-line monitoring of the crack growth possible [39,40].
The fatigue-fractured appearance of a tested sample will change under different testing conditions. Thus, fatigue fractography may provide sufficient information for distinguishing the fatigue-fractured mechanism of a material. In addition, the surface roughness of a fatigue crack may relate to the fatigue fracture feature. A rough fracture surface is usually associated with a tortuous crack path. Generally, deflected crack growth may have a lower FCGR than straight crack growth; therefore, fracture surface roughness (FSR) might be used as another indicator to associate with fracture mode or fracture feature under ordinary fatigue crack growth (FCG). The FSR is measured with a conventional roughness tester which provides a simple and economic solution for acquiring the fracture surface profile. It helps to distinguish the fracture mechanism of a fatigue sample. However, studies that focus on the correlation of FCG and FSR are rare in the literature. In this work, the FCGRs of ASSs in the annealed or cold-rolled conditions were correlated with both the fracture mode and FSR and were tested in air or in gaseous hydrogen. The FCG test was performed on a dynamic universal testing machine and the FSR was measured with a contact-type (stylus) roughness tester. Furthermore, the crack path was inspected using an electron back-scattered diffraction (EBSD) approach.

2. Materials and Experimental Procedures

2.1. Materials

In this study, AISI 301, 304L, and 310S ASSs plates with thickness of 4.8 mm were selected as the experimental materials. Before the test, all materials were solution-annealed (SA) in a vacuum furnace at a temperature of 1050 °C for 0.5 h, followed by Ar-assisted cooling to room temperature. The chemical compositions (by weight percentage) of these materials are listed in Table 1. On the basis of the chemical compositions and the equation developed by Angel et al. [11], the Md(30/50) temperatures of the 301, 304L, and 310S were calculated to be 67, 41, and −146 °C, respectively. To investigate the effect of cold-rolling (CR) on FCG tests, some SA samples were subjected to rolling with a 20% reduction in thickness at room temperature by DBR 150 rolling machine (Daito Seisakuzyo, Tokyo, Japan), i.e., rolled to a final thickness of 3.84 mm. In addition, the SA materials were milled to the same thickness as the CR materials before solution treatment, after which the fatigue specimens were prepared.

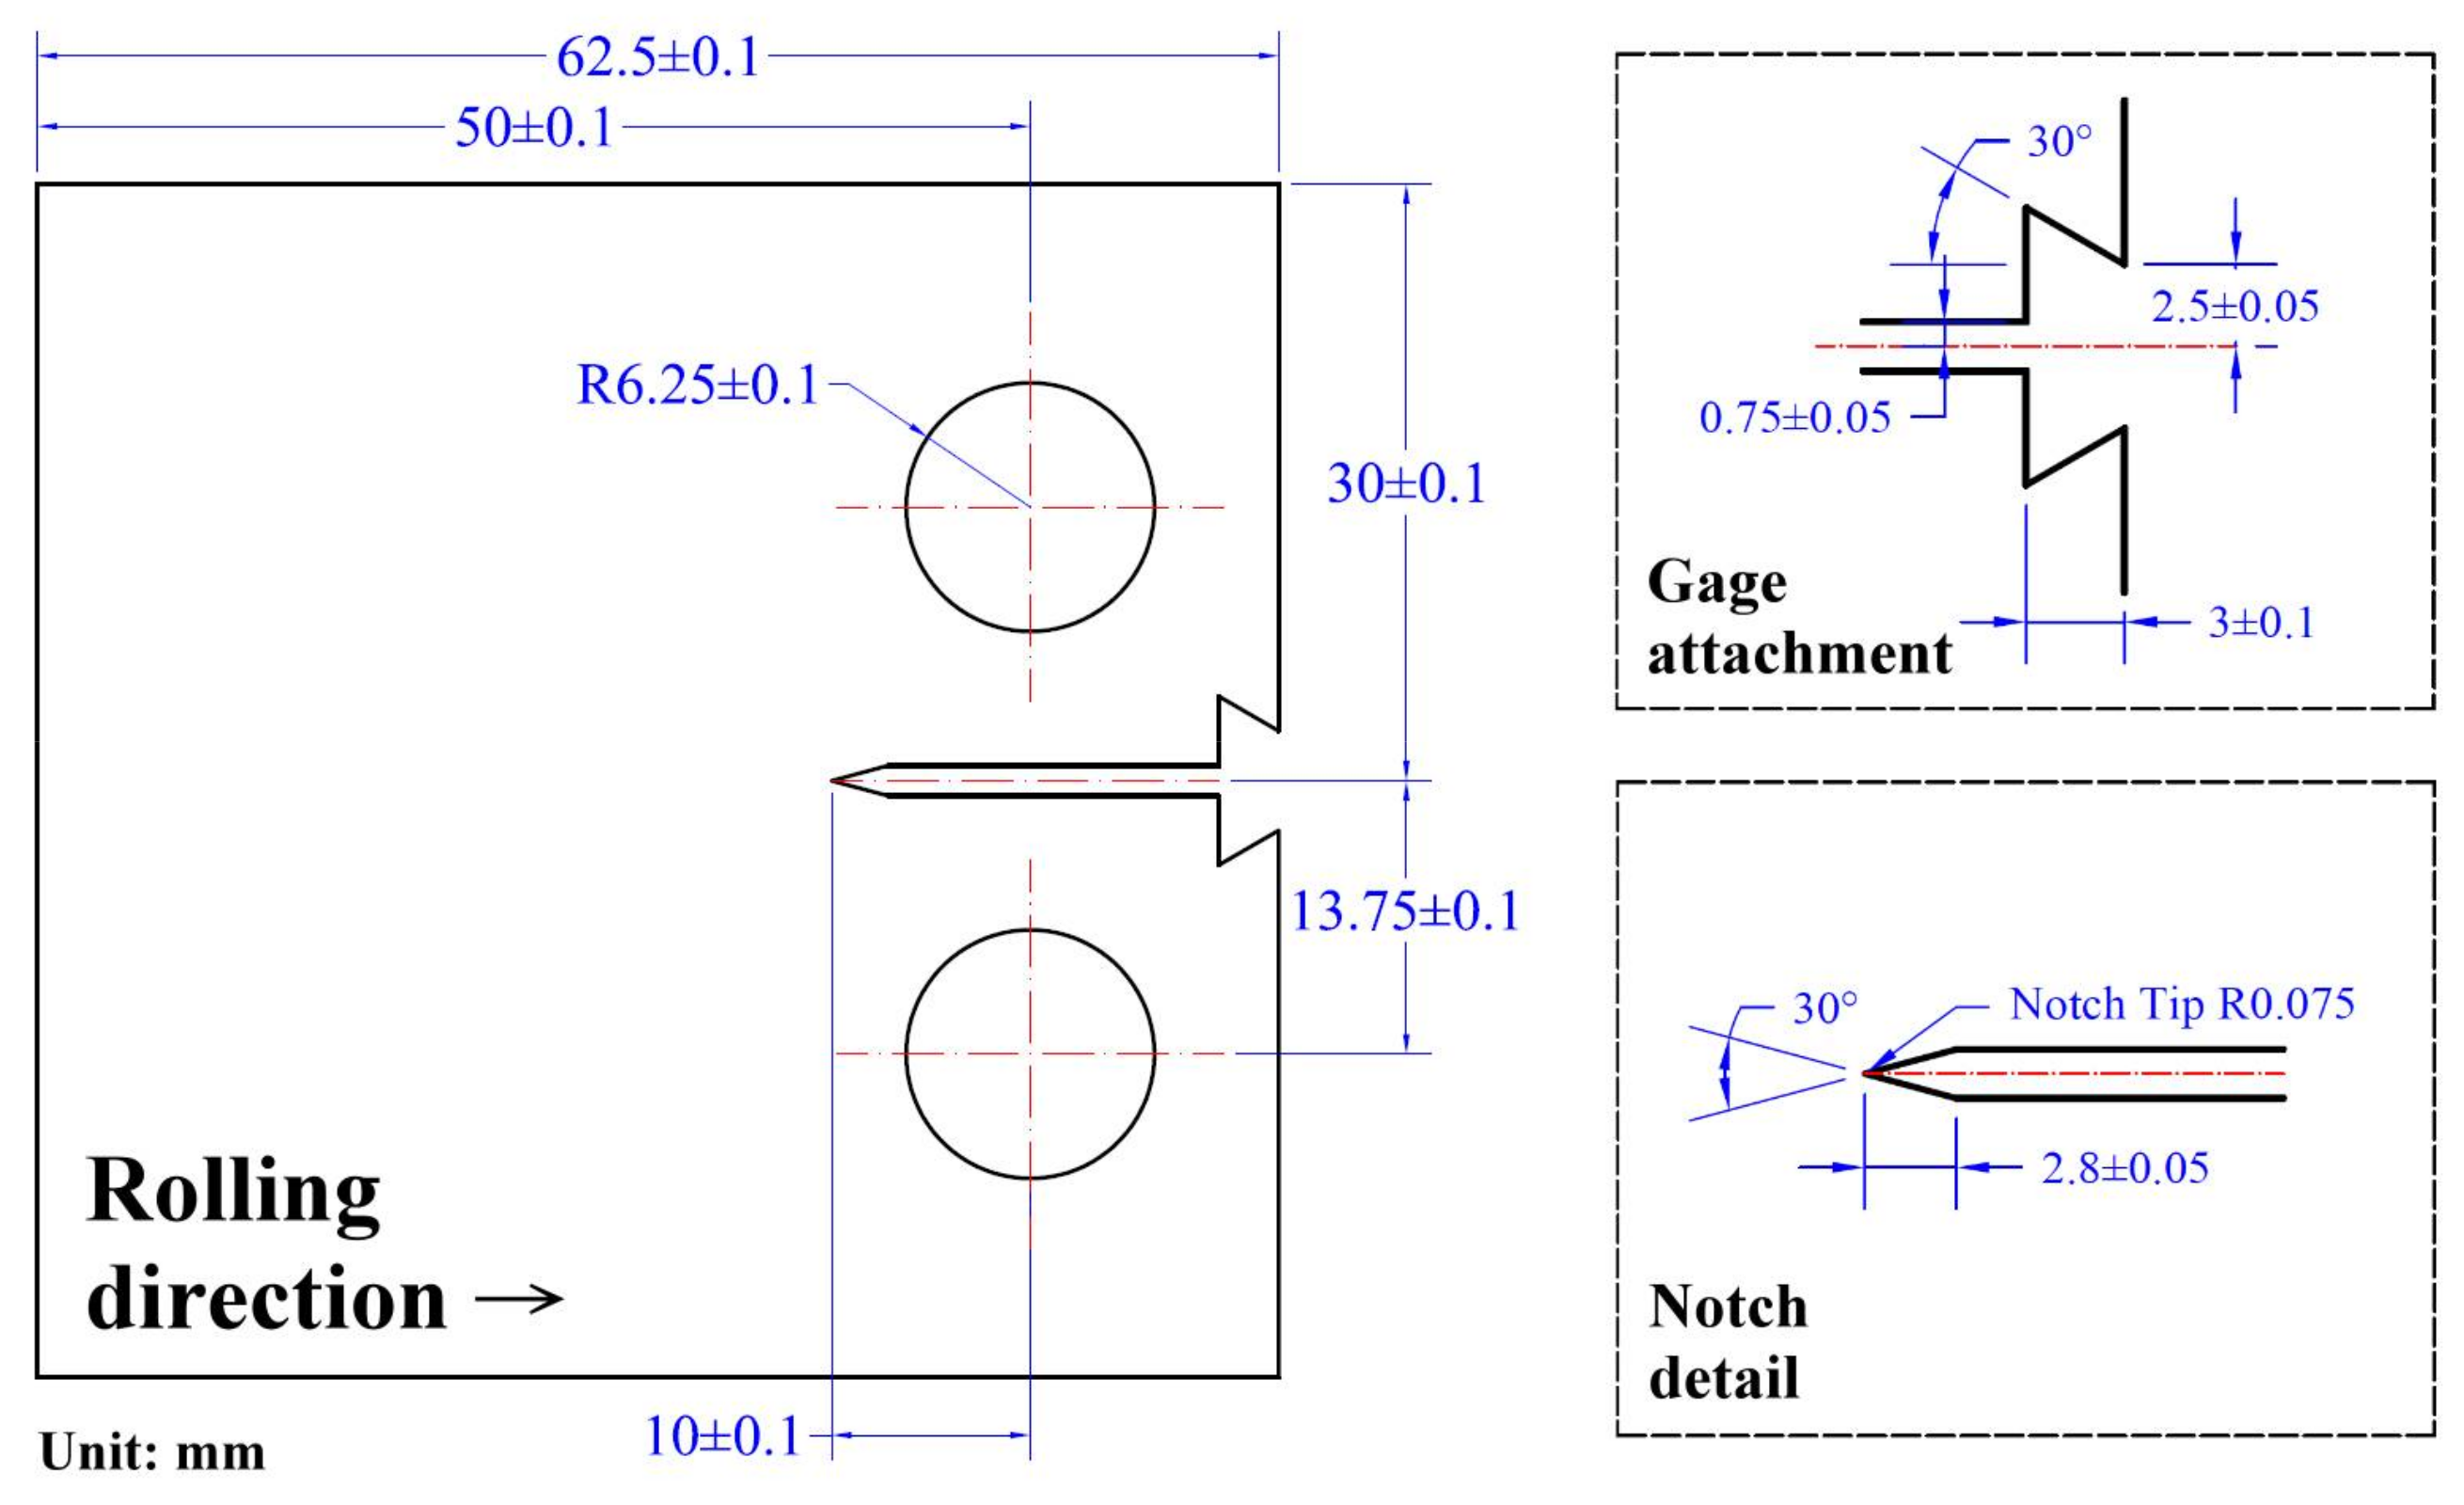
2.2. Fatigue Crack Growth Tests

The compact tension (CT) specimen for the FCG test was wire-cut by an electro-discharge machine with its notch parallel to the rolling direction. The dimensions of the CT specimen, as shown in Figure 1, were in accordance with the ASTM E647 standard. The surfaces of the CT specimen were ground and polished by abrasive papers before the fatigue test. The FCG tests at a stress ratio (R) of 0.5 were performed on an MTS 810 material testing system (MTS, Eden Prairie, MN, USA) in ambient air, at 20 Hz with a sinusoidal waveform [33,34]. To evaluate the effects of HE on the FCG behaviors of various ASSs, the FCG tests were also performed in 0.2 MPa high purity (99.99%) gaseous hydrogen inside a stainless steel chamber. COD, measured by a clip-on gauge, was used to determine the crack length. The crack length was calculated by a compliance function [41] and confirmed by optical microscope (OM).
The fatigue specimens are nominated according to their testing condition; the suffix “a” or “h” is for the specimen fatigue-tested in air or hydrogen, respectively. Therefore, 301-CR-h represents the cold-rolled 301 specimen tested in gaseous hydrogen. All results presented in this study are typical data of the repeated experiment of at least three samples. The test matrix of the current study is given in Table 2.

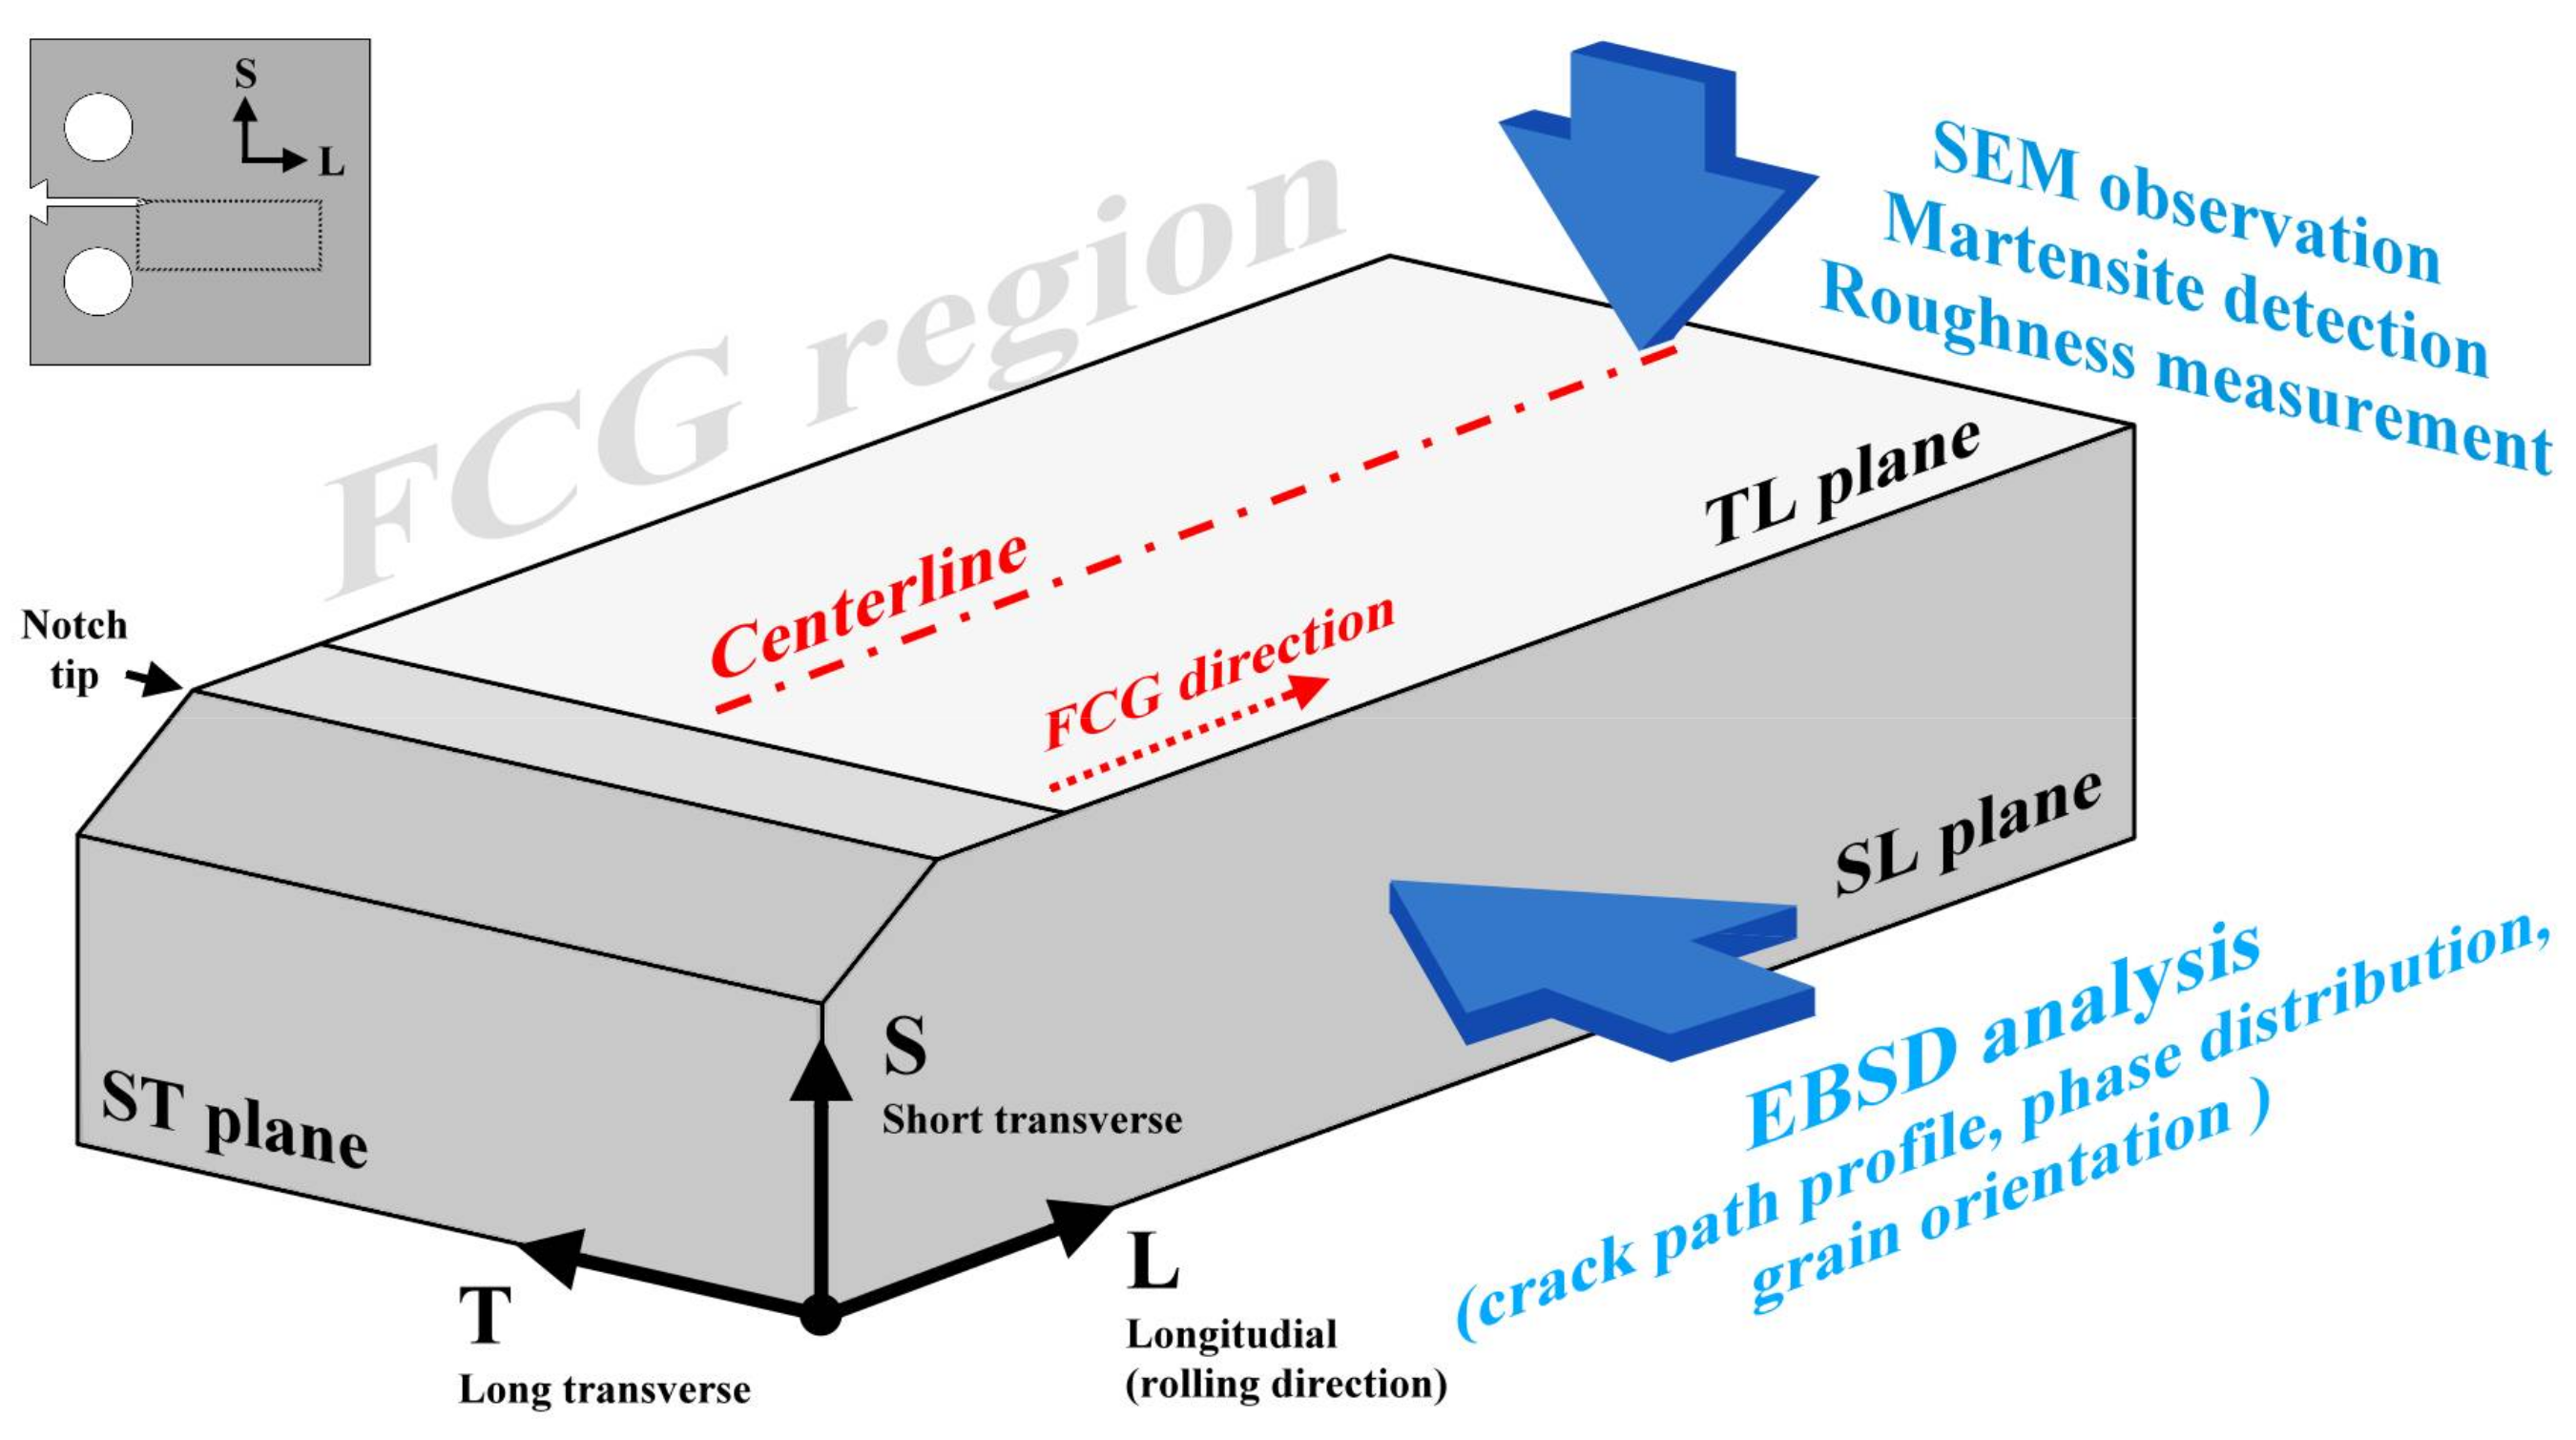
2.3. Roughness Measurement and Martensite Detection

After the fatigue test, the fracture surface was carefully sliced by an abrasive cutoff machine and ultrasonically cleaned in acetone. The investigation of fatigued FSR was carried out using an SJ-210 surface roughness tester (Mitutoyo, Kawasaki, Japan) with the increasing stress intensity factors (∆K). The measurements were obtained at the locations of the corresponding ∆K values of around 10, 15, and 20 MPa m . The arithmetic mean roughness (Ra) was employed as the parameter for evaluating the irregularity of the FSR, which is defined as the integral of the absolute value of the roughness profile in the height direction. The degrees of strain-induced α′-martensite transformation on the fracture surfaces of various specimens were detected by FMP30 ferrite scope (Helmut Fischer, Sindelfingen, Germany), which measures the magnetic permeability of the specimen in a specific volume [42,43,44,45]. Measurements on the fracture surface were taken along the centerline at the location corresponding to its ∆K from 10 to 20 MPa m .

2.4. Microstructural Observation

The fatigue-fractured feature was observed via a JSM-7100F field-emission scanning electron microscope (SEM, JEOL, Tokyo, Japan). To correlate the results of the roughness measurement with the crack growth mechanism, NordlysMax2 EBSD (Oxford Instruments, Abingdon, UK) analysis was carried out on the fatigue-fractured specimens in the short transverse-longitudinal (SL) plane. Additional evaluations of the crack path, phase distribution, and grain orientation were performed using HKL Channel 5 software (Oxford Instruments, Abingdon, UK) as well as the Kikuchi patterns obtained from the EBSD. The measuring sites of the above analysis on the fatigue-fracture specimen are summarized in Figure 2.

3. Results

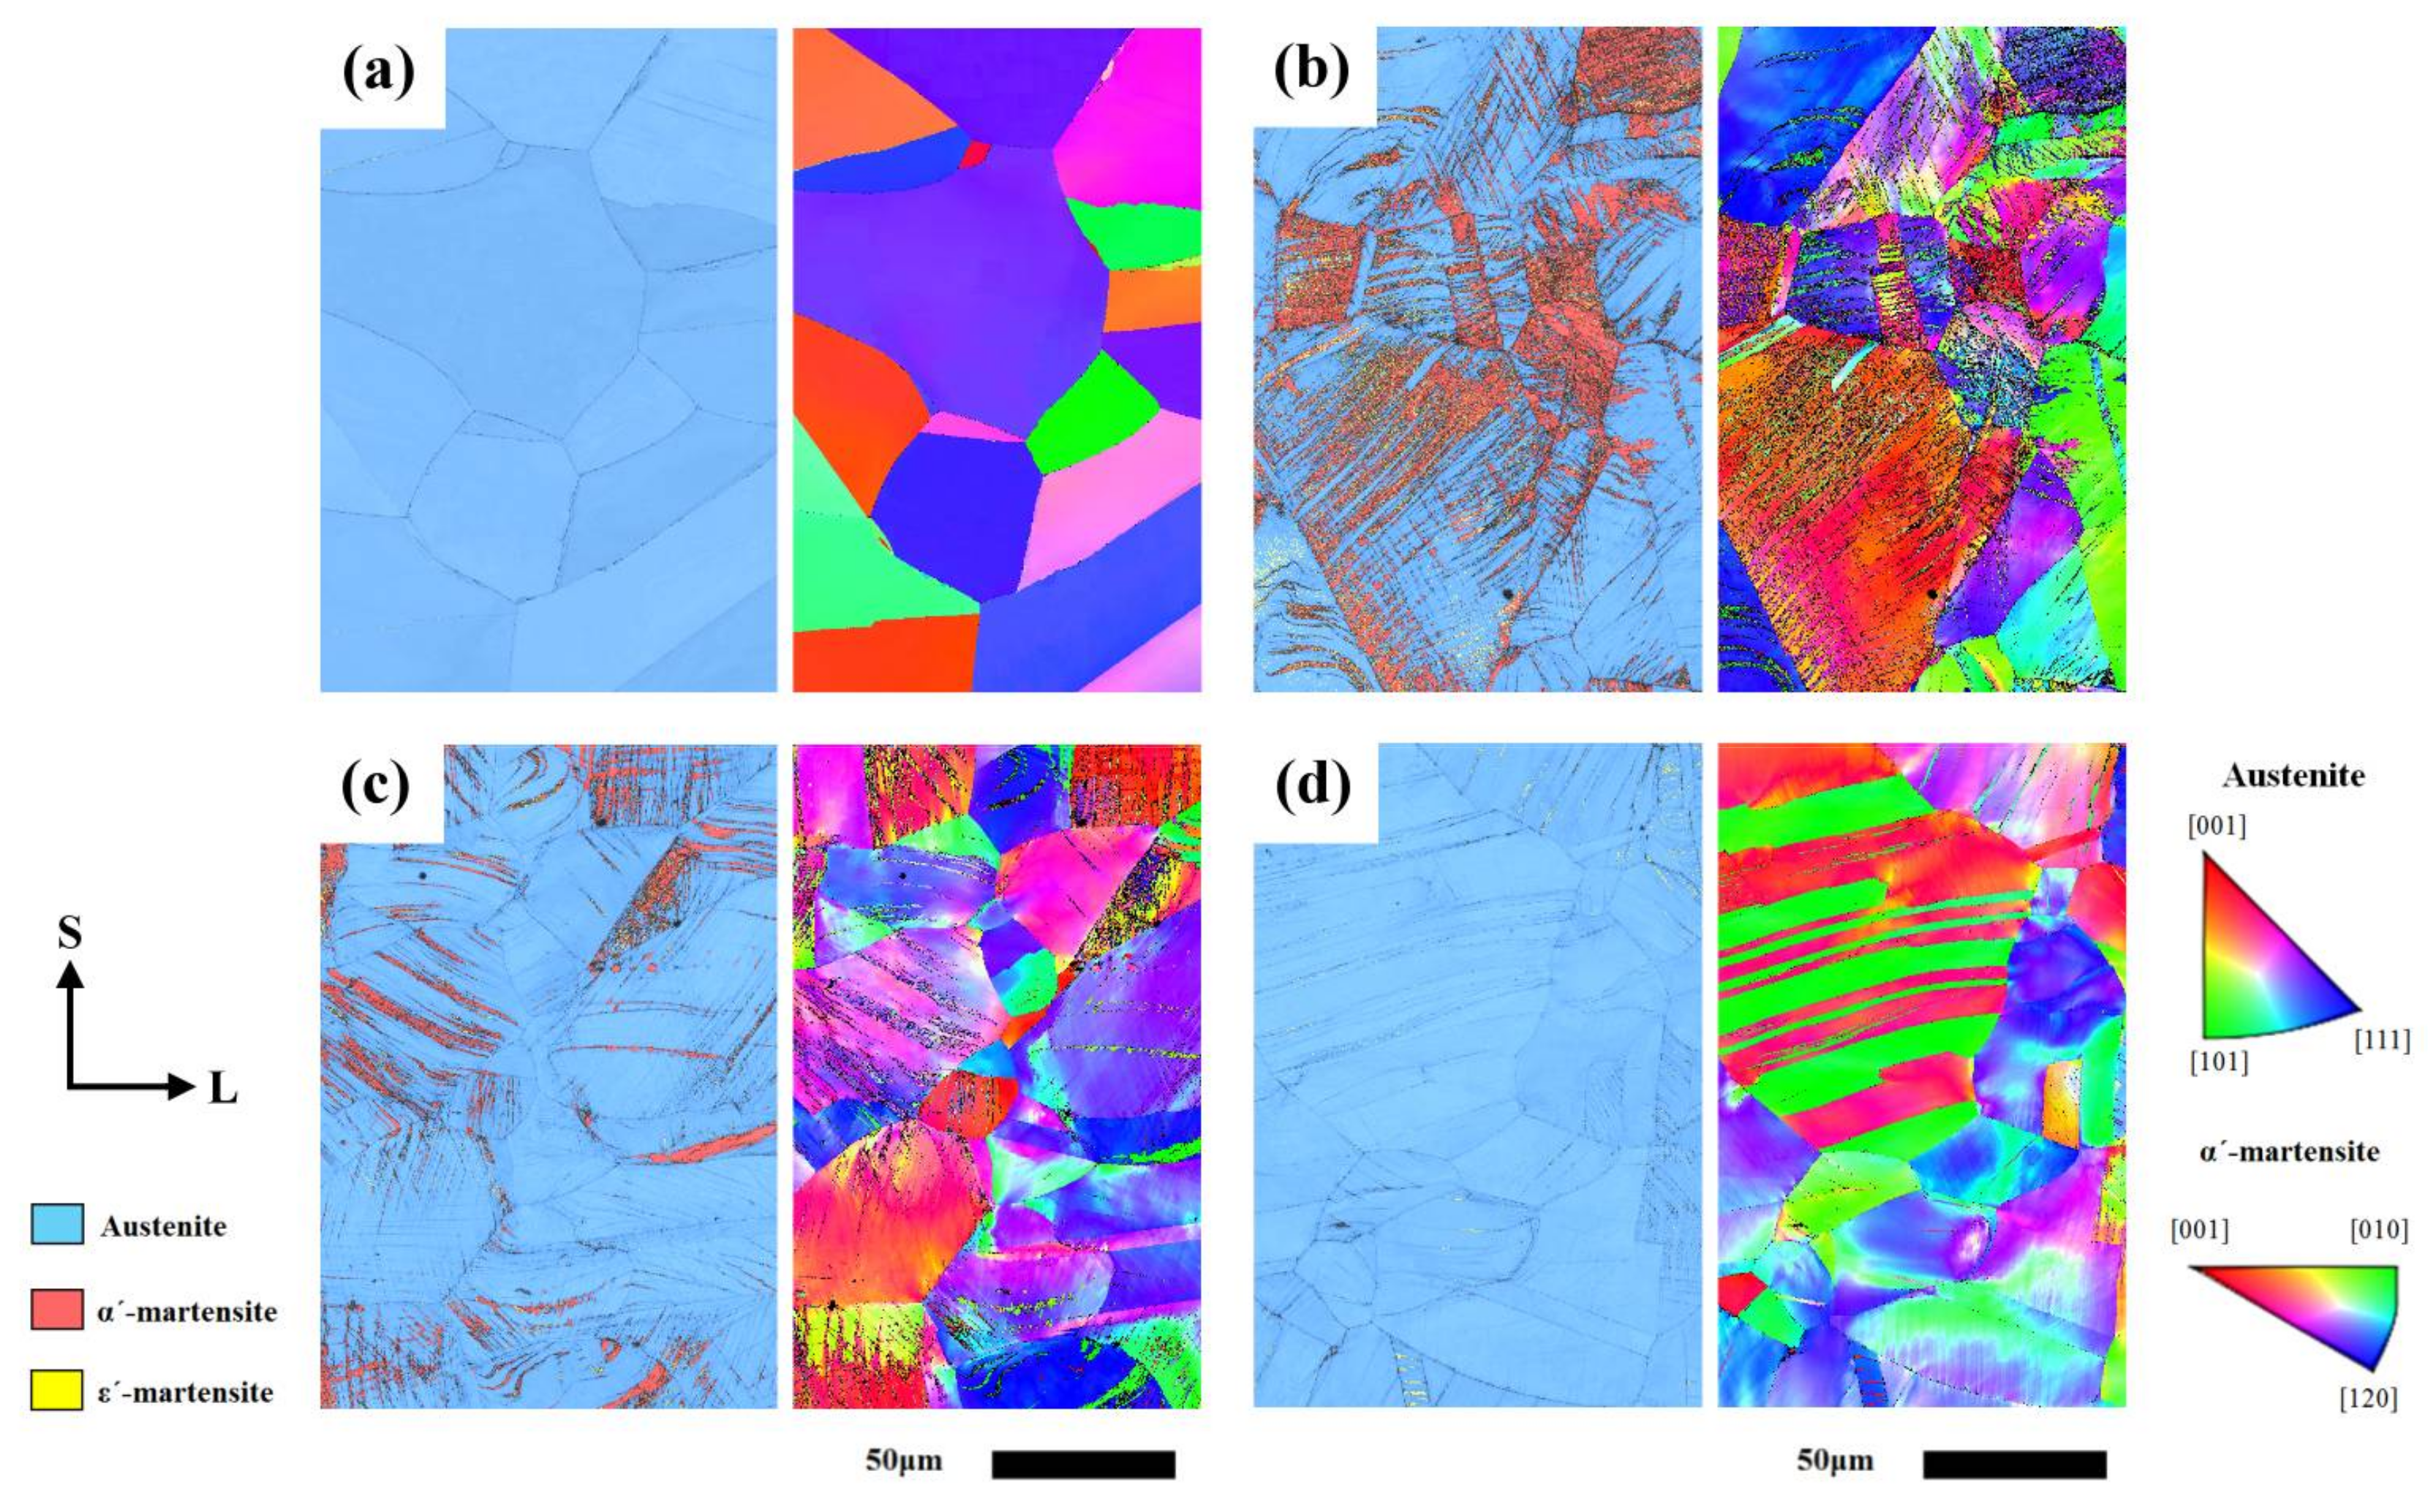
3.1. Microstructural Observation

Figure 3 shows the EBSD phase distribution map (left) and the corresponding inverse pole figure (IPF, right) of the SA and the CR specimens in the SL plane. In the EBSD map, the red region represents the site of α′-martensite, yellow is the ε′-martensite, and blue is the austenite matrix. The discrepancy in color in the IPF reveals the misorientation between adjacent grains. The microstructure of the SA specimens predominantly consisted of austenite grains with some twins inside, as shown in Figure 3a. The ferrite and α′-martensite contents of the SA specimens measured by ferrite scope were nearly 0%. After cold rolling, the distortion of austenite grains and strain-induced phase transformation occurred in the unstable ASSs. As shown in Figure 3b,c, cold rolling induced the transformation of γ→ε and γ→α′ in 301 and 304L ASSs, especially in the 301. The α′-martensite contents measured by ferrite scope of the 301 and 304L specimens were 19.1% and 10.6%, respectively, which was in accordance with the EBSD examinations. The results indicate that the 301 ASS is more likely to have γ→α′ transformation under straining. Regarding 310S specimen (Figure 3d), cold rolling caused the formation of slip bands within the austenite grains but did not induce phase transformation. Only a minor amount of ε-martensite was observed in the 310S-CR specimen. The results indicate that the amount of strain-induced martensite could be related to the Md(30/50) temperature of the ASSs. Stable ASSs of low Md(30/50) temperature, such as 310S, were able to resist phase transformation during straining; in contrast, 301 ASS of high Md(30/50) temperature was more likely to have γ→α′ transformation if cold work was applied.

3.2. FCGRs and Roughness Measurement

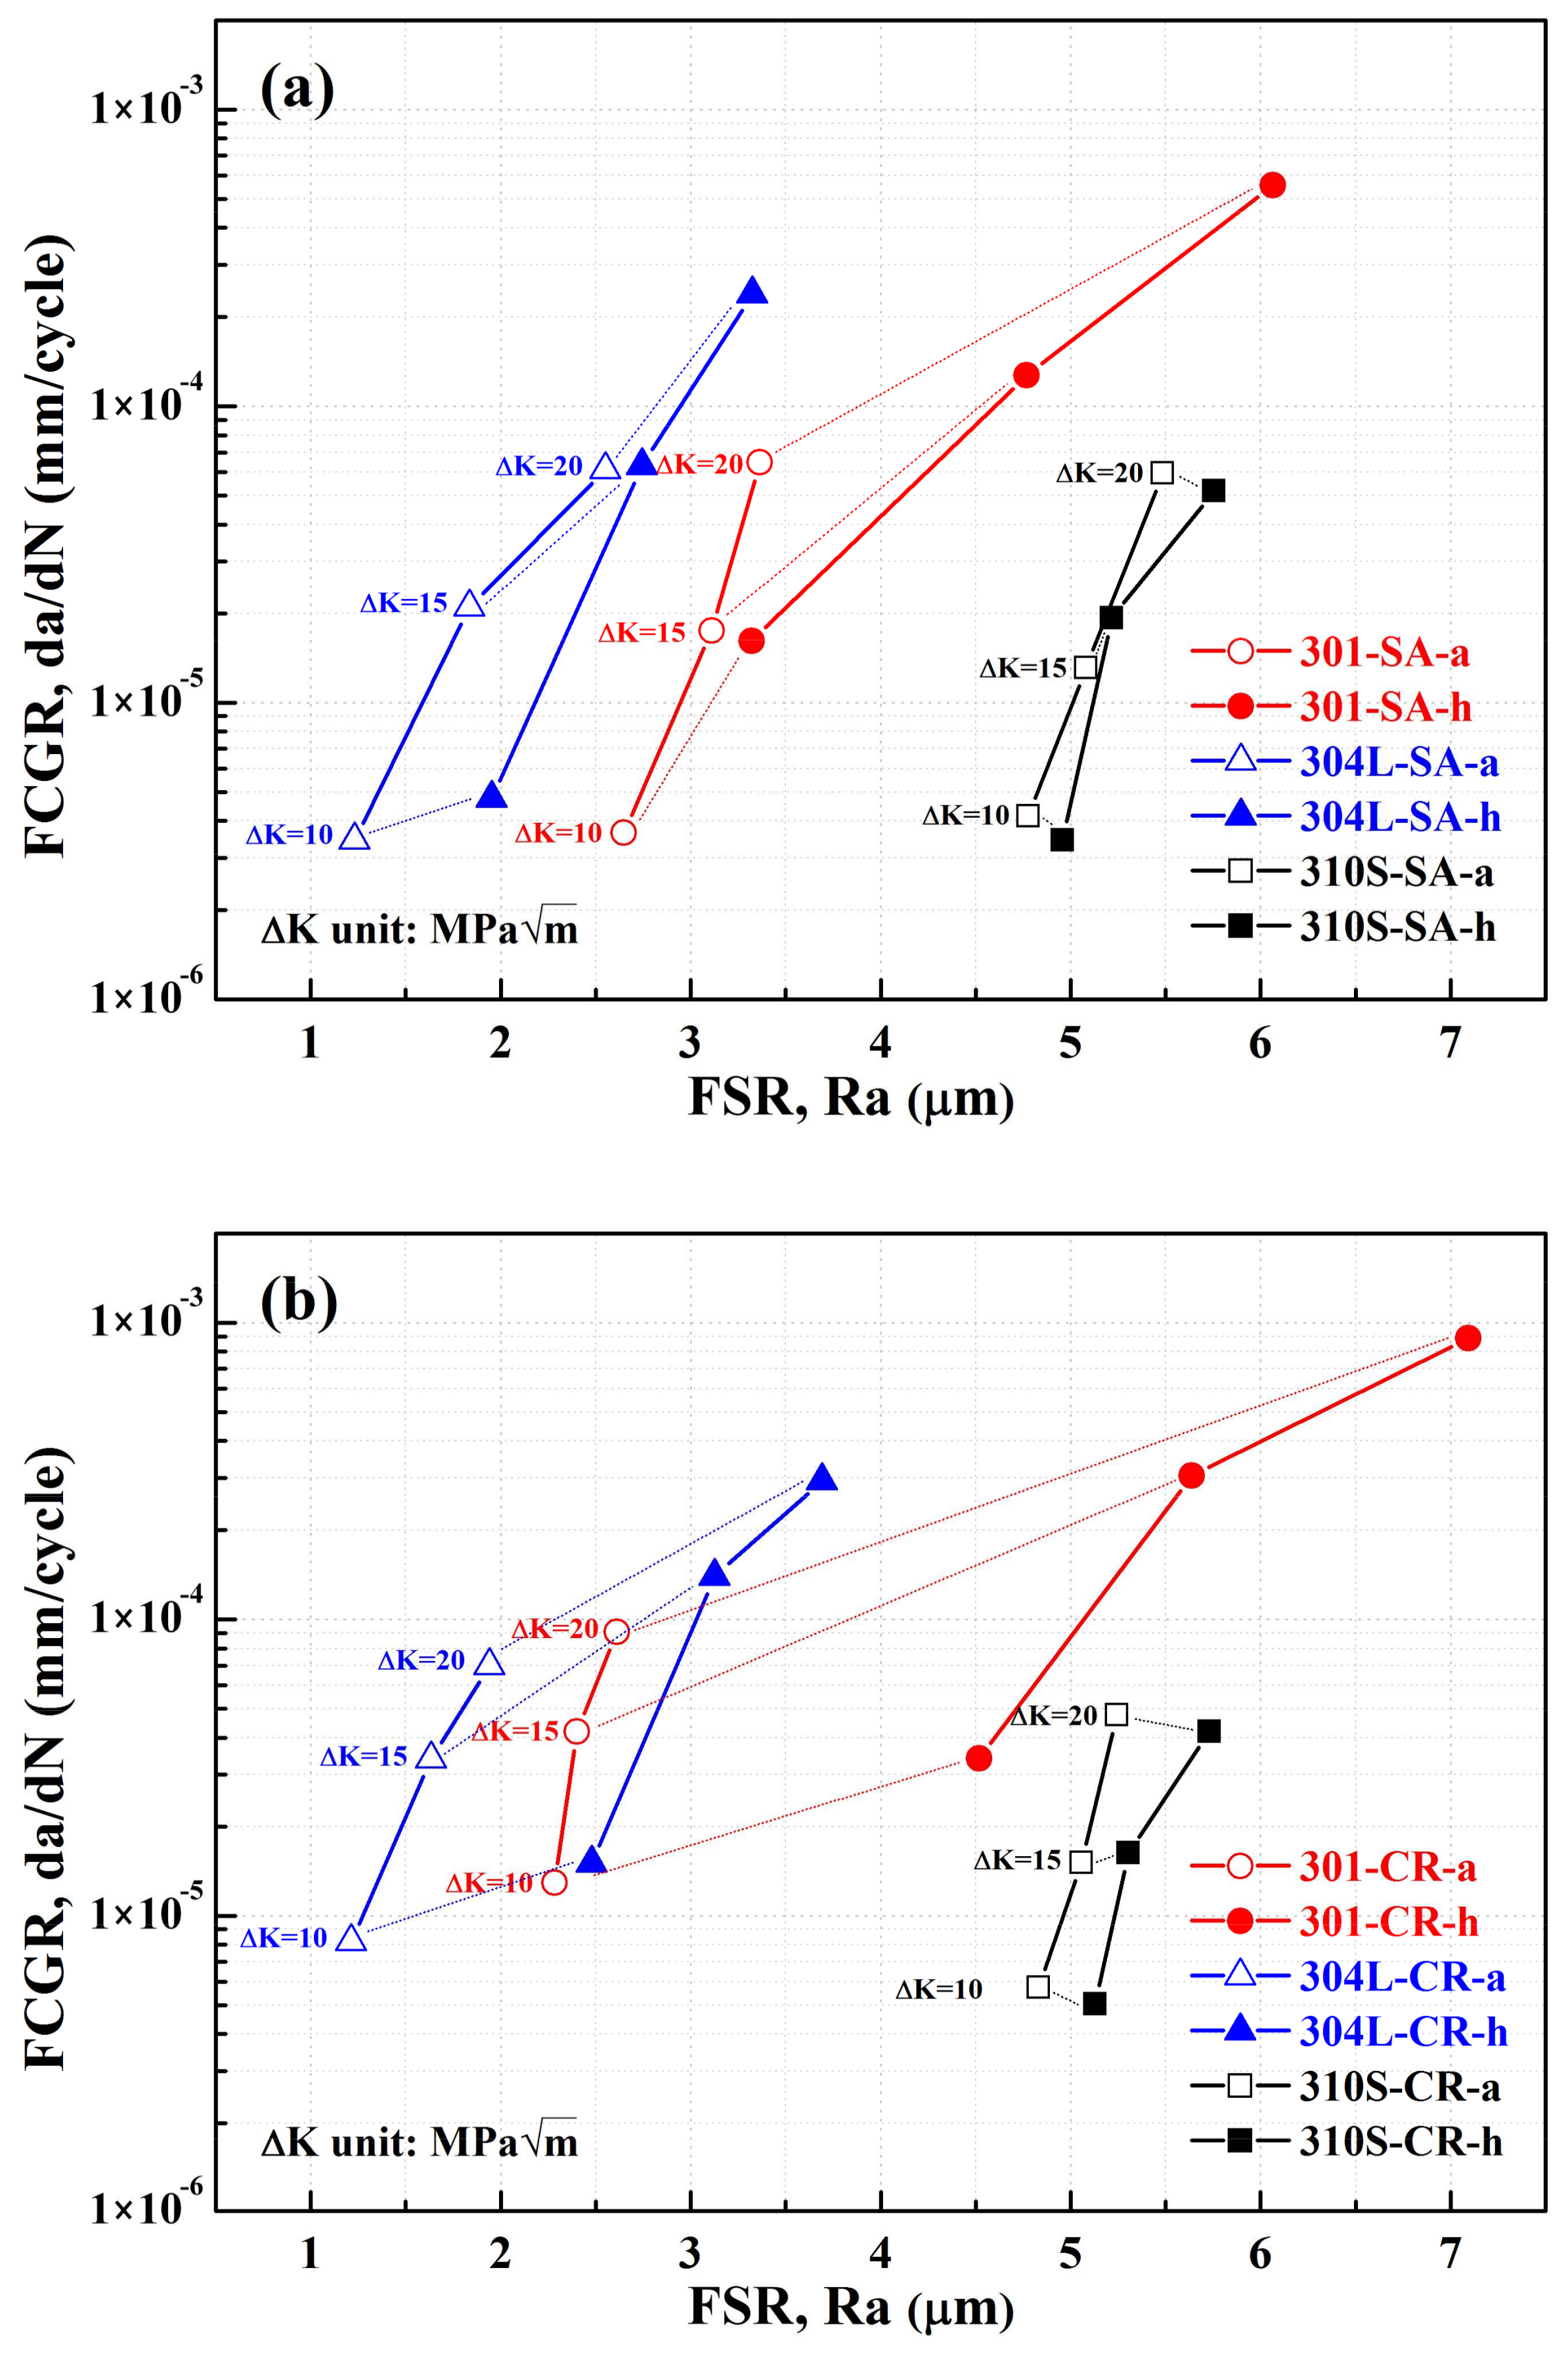
3.2.1. Hydrogen Effect

Figure 4 shows the FCGRs of the specimens in the ∆K ranges of 10, 15, and 20 MPa m as a function of the fatigue FSR (in Ra) in air or gaseous hydrogen. Irrespective of the testing environment, the FCGRs and FSR of all specimens increased with increasing ∆K, as shown in Figure 4. Under the same testing ∆K in air, all annealed specimens showed similar FCGRs in air but different FSR (hollow points in Figure 4a). For example, at ∆K = 15 MPa m , the FCGRs of 301-SA-a, 304L-SA-a, and 310S-SA-a specimens were approximately 2.0 × 10⁻⁵ mm/cycle, while the Ra were 3.1, 1.8, and 5.1 μm, respectively. In this work, fatigue crack closure was not measured during FCG. The results indicate that the effects of strain-induced transformation or FSR did not affect the FCGRs of the tested ASSs.
Hydrogen was found to significantly increase the FCGRs and FSR of the annealed 301 and 304L specimens (Figure 4a). In contrast, the 310S-SA specimen showed low susceptibility to hydrogen-assisted FCG. In the annealed condition, 301 ASS was the most susceptible to hydrogen-assisted FCG among the three ASSs in the same ∆K range; however, the 310S ASS was the least susceptible and exhibited the lowest FCGRs in hydrogen. The results also reveal that, in the annealed condition, the 301-SA-h specimens had not only the highest FCGRs but also the roughest fracture surface among the three tested samples in high ∆K condition. It was determined that hydrogen-assisted FCG also induced an obvious change in fracture mode.
The trend of variation in FCGRs for the cold-rolled samples shown in Figure 4b was similar to that of the annealed samples shown in Figure 4a. HE played an important role in accelerating the FCGRs of 301 and 304L ASSs but not that of 310S ASS, even in the cold worked state. In addition, the FCGRs of the cold-rolled specimens in air at the same ∆K were as follows in descending order: 301 > 304L > 310S. As compared with the annealed materials, cold work decreased the FCG resistance of 301 and 304L ASSs, especially that of 301 ASS (Figure 4b).

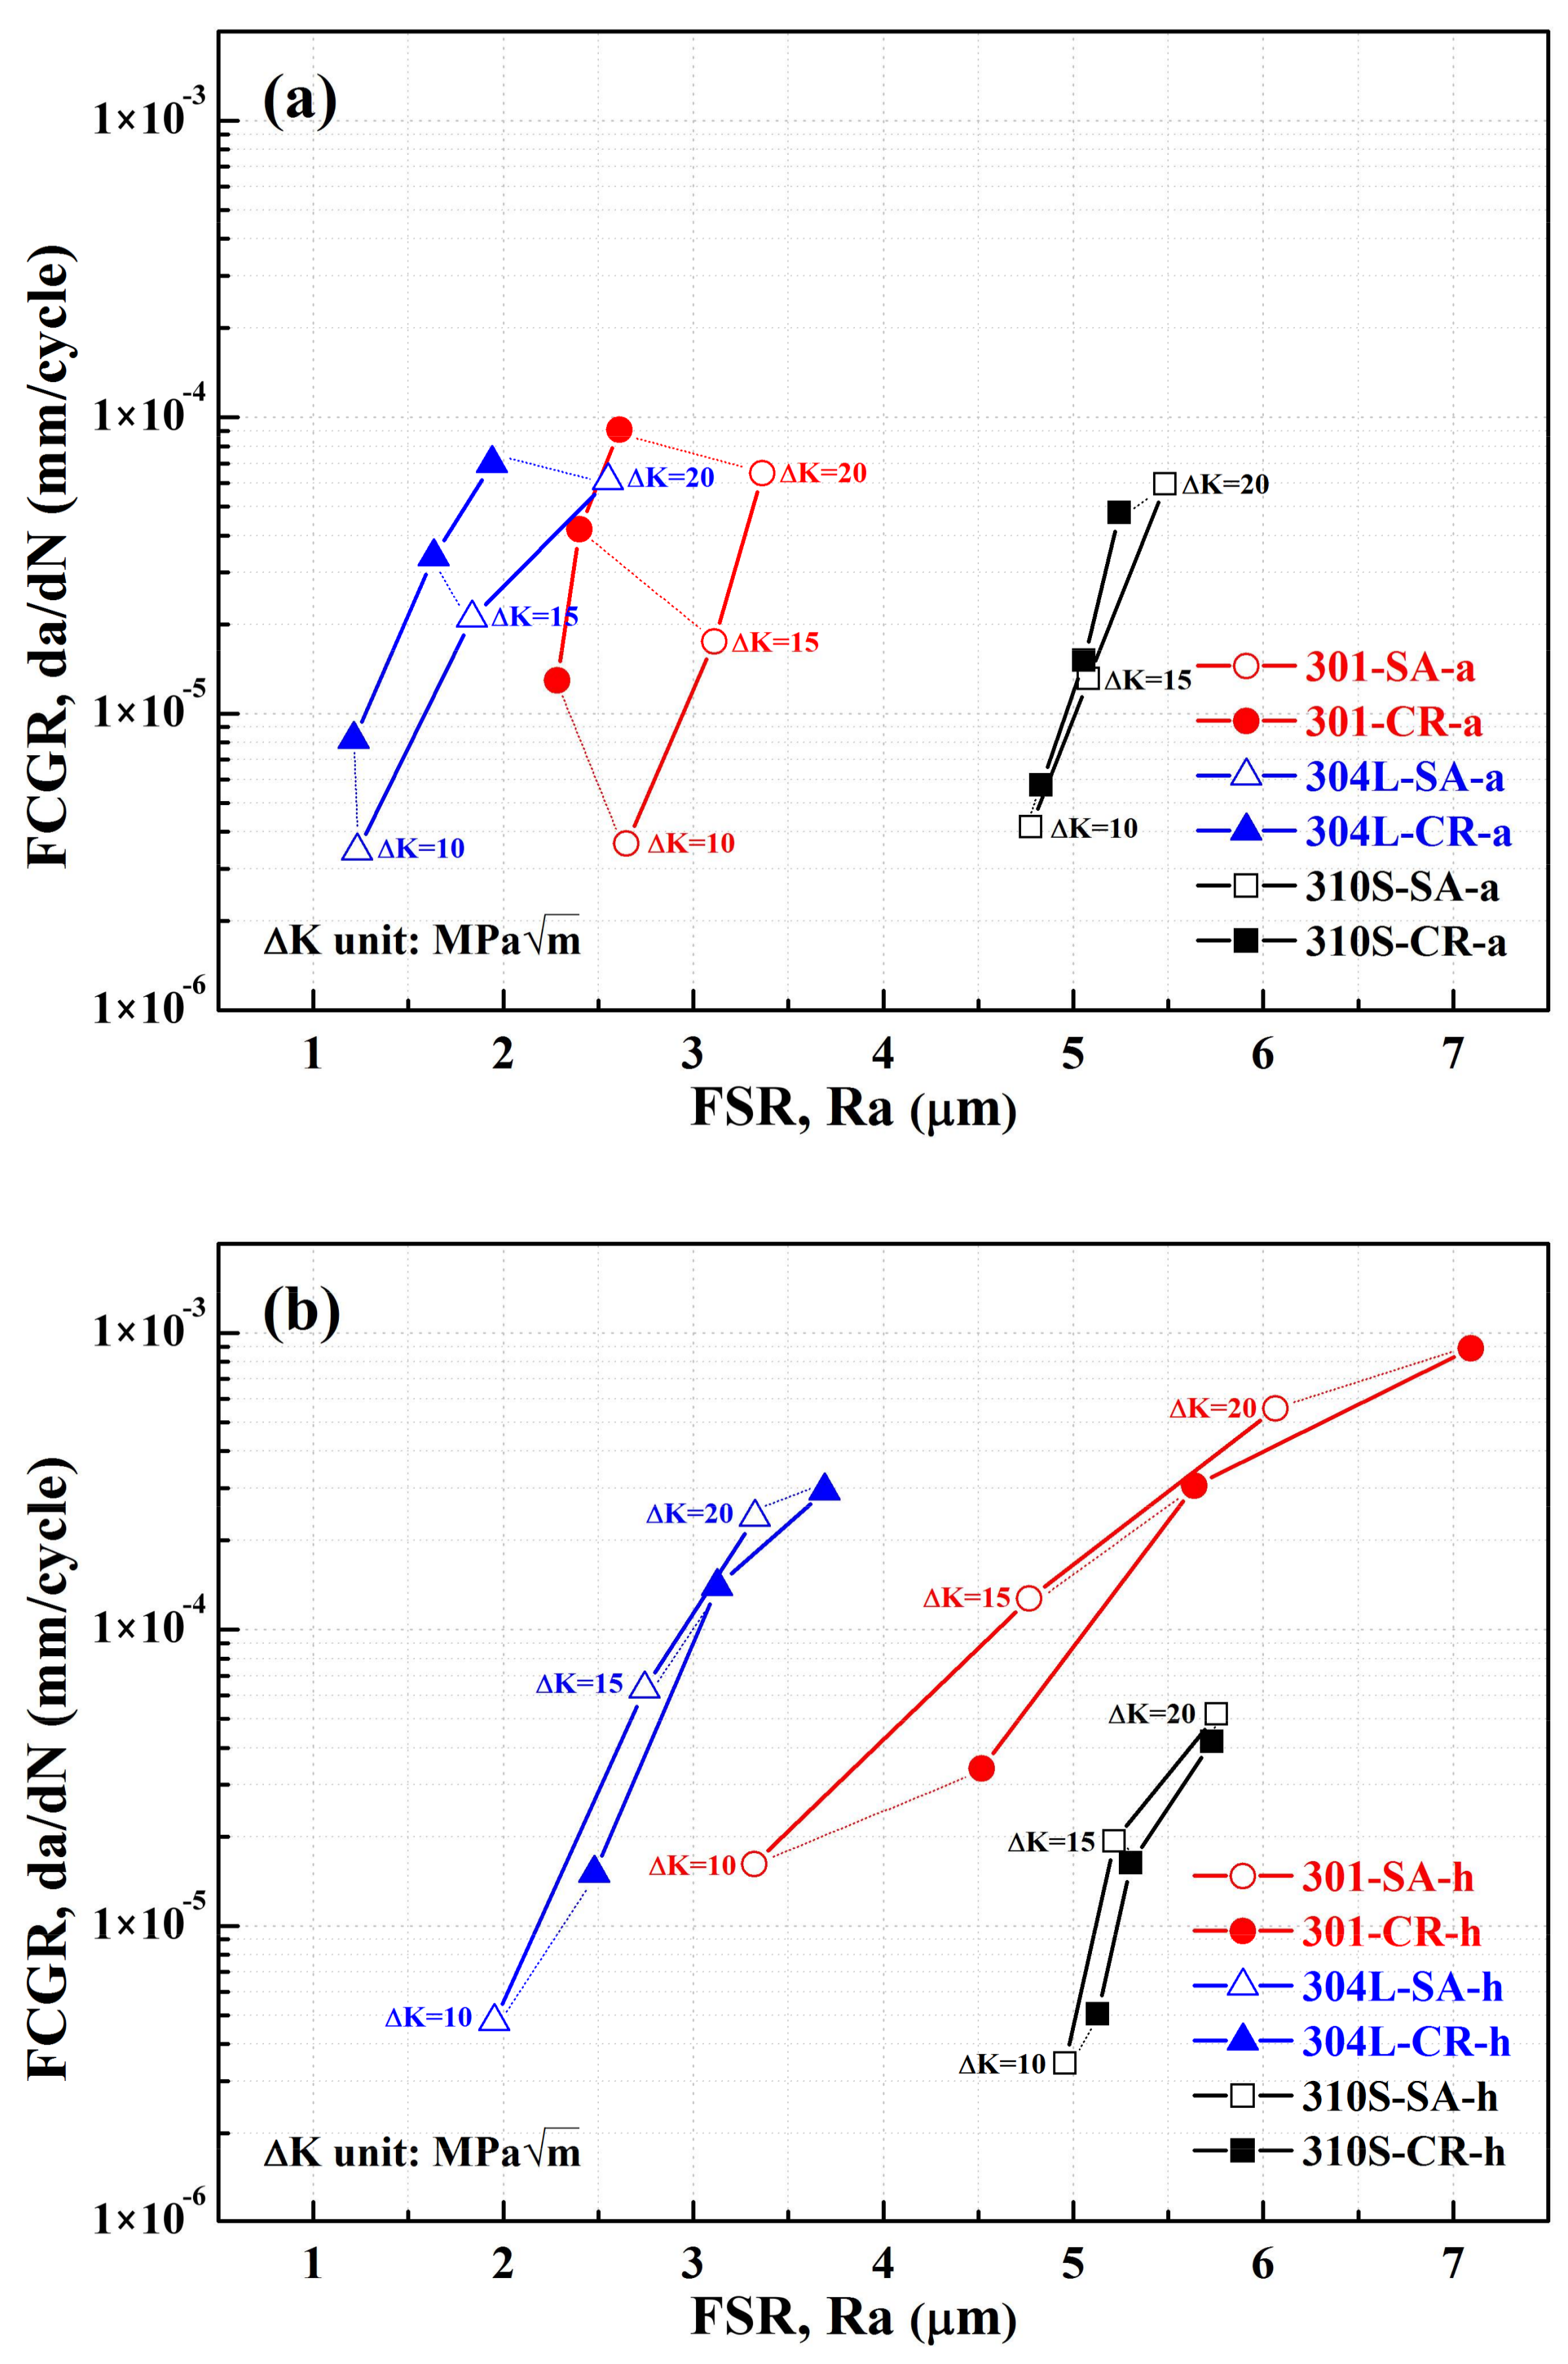
3.2.2. Cold-Rolling Effect

Figure 5 shows the FCGRs-FSR relation of the specimens in the ∆K ranges tested in air or gaseous hydrogen. All annealed specimens in air presented similar FCGRs but different FSR under the same ∆K in Figure 5a. Cold rolling led to an increase in FCGRs of the 301 and 304L specimens, but a decrease in FSR, especially that of 301. As for the 310S specimens, cold rolling seemed to have little effect on the FCGRs and the FSR. In hydrogen (Figure 5b), cold rolling caused an obviously accelerated FCG for the 301 and 304L specimens. The 310S also showed little change in FCGRs and FSR, even after cold rolling in hydrogen. Notably, the cold-rolling of 301 and 304L specimens in air led to a decrease in FSR (Figure 5a). The reverse trend was found for those tested in hydrogen when compared with the annealed ones (Figure 5b). The change in FSR of the specimens was expected to have an alternation in fracture features after cold work and/or testing in hydrogen.

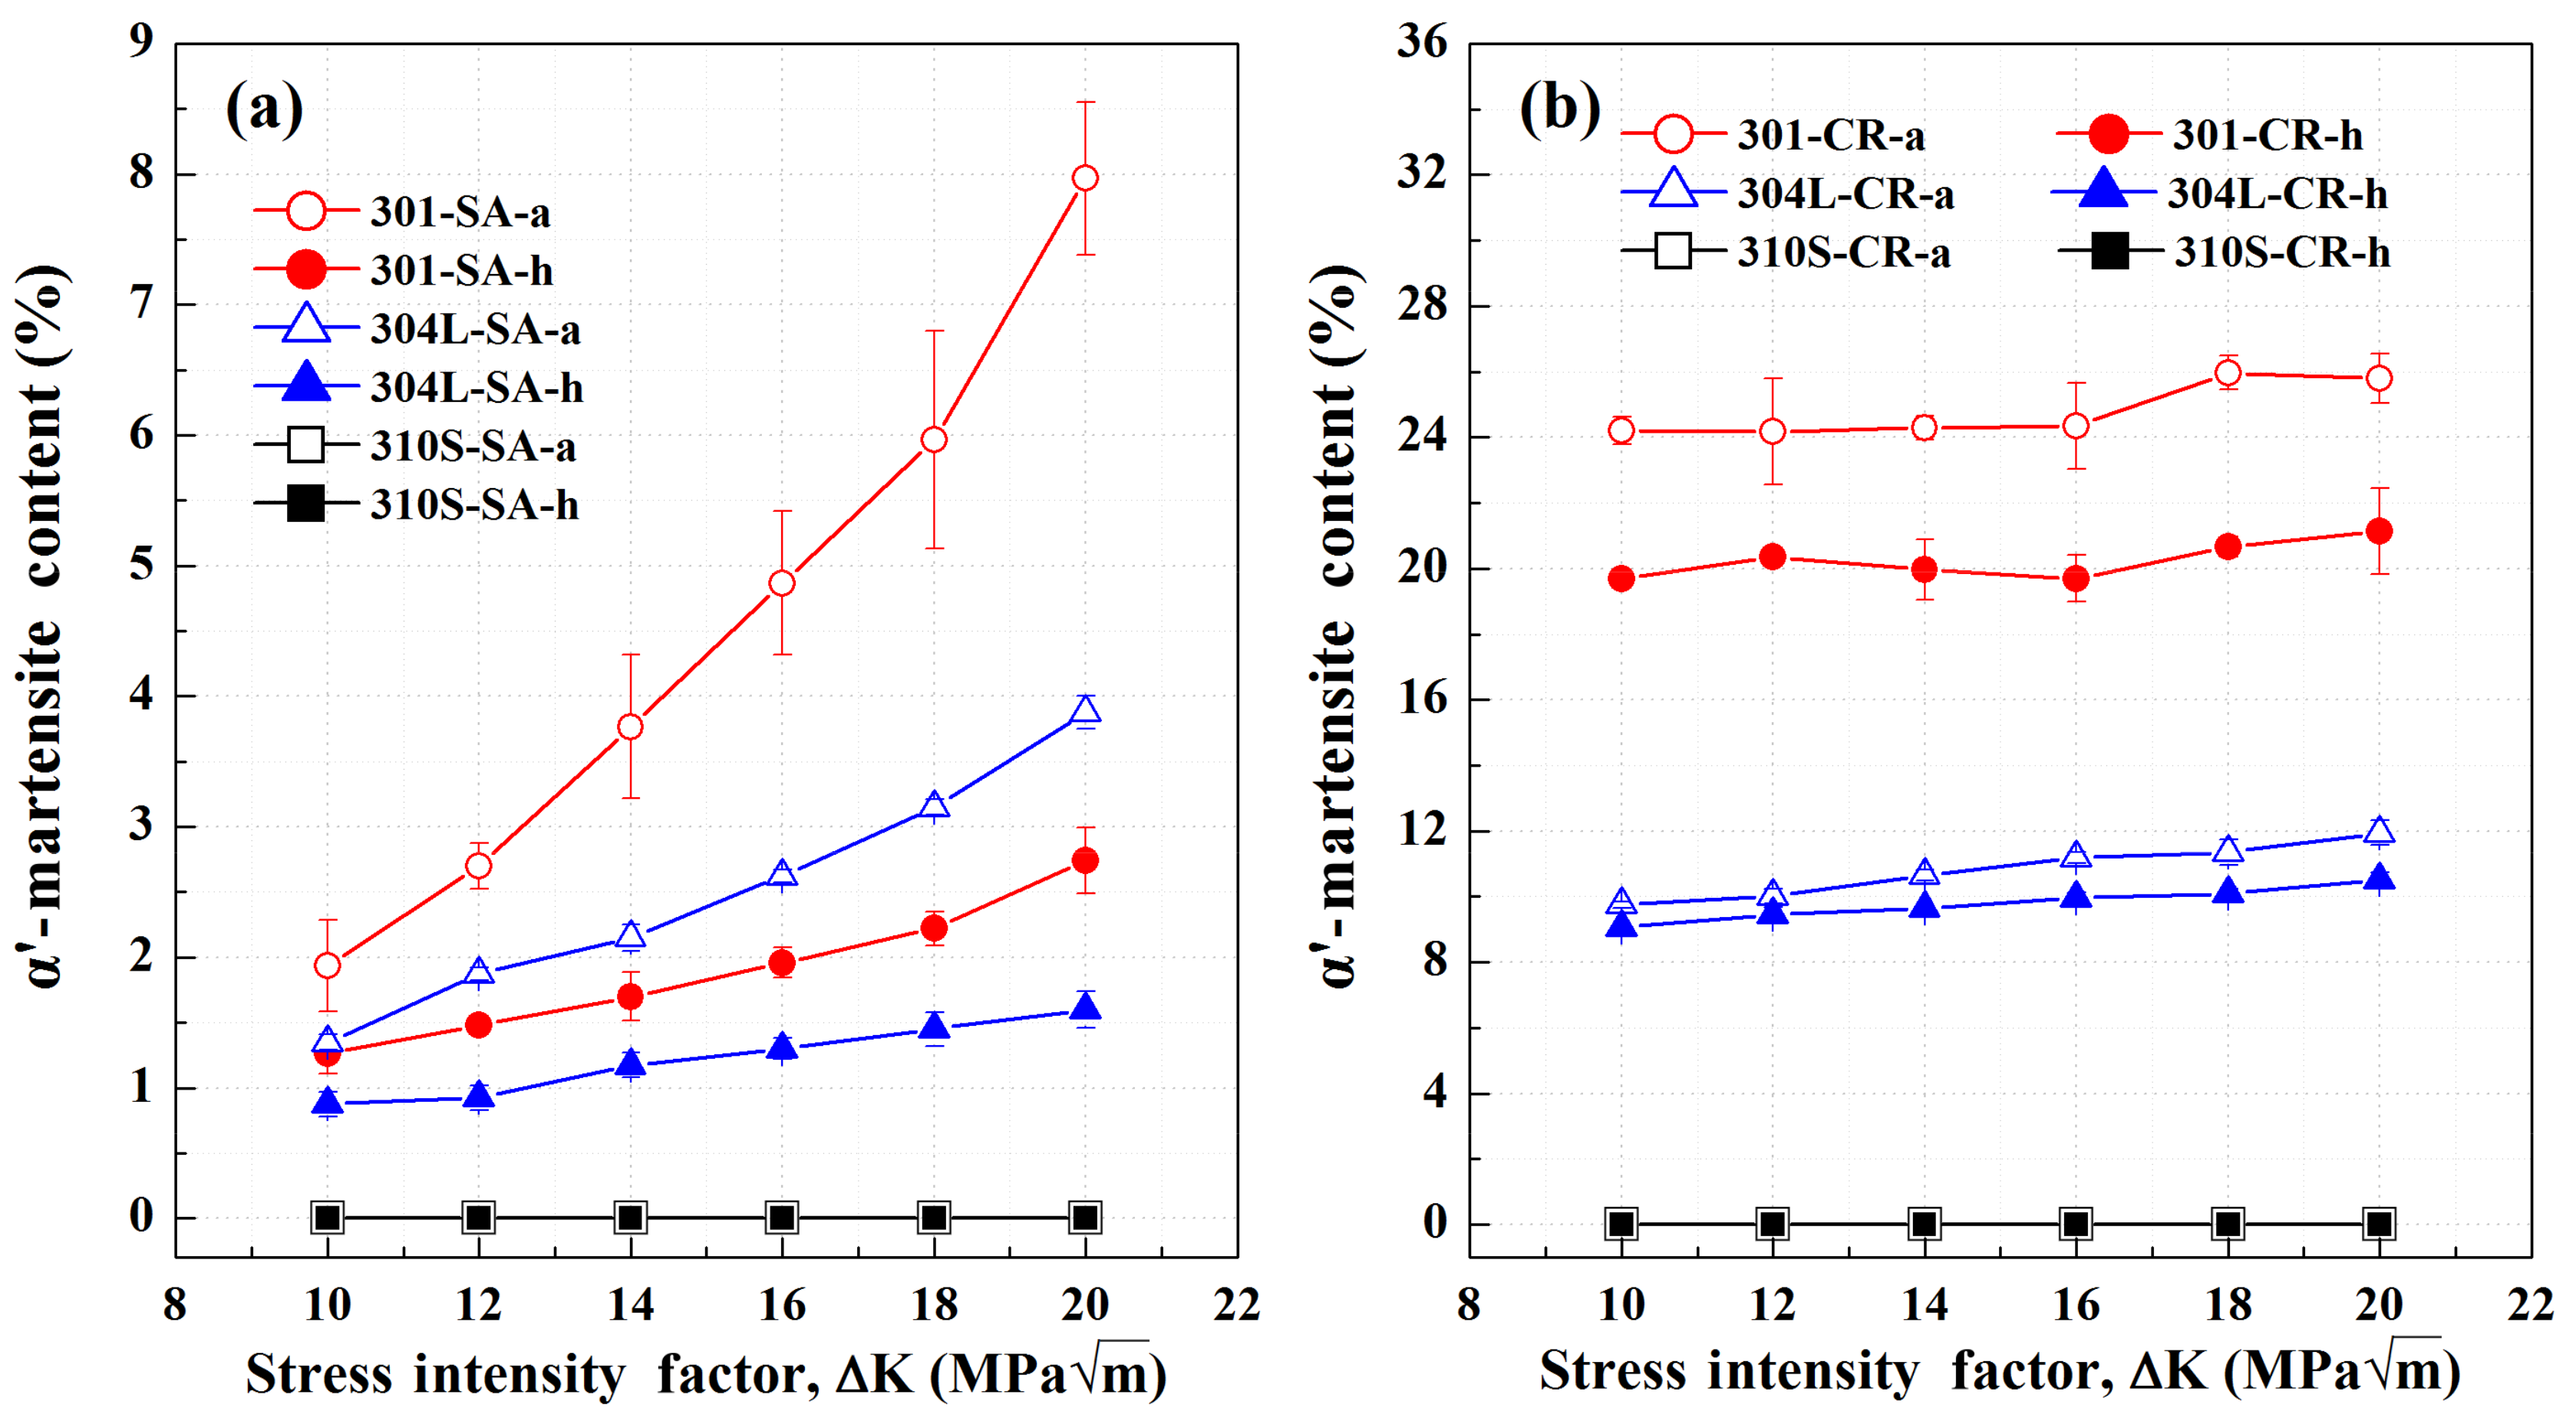
3.3. Martensite Distribution on the Fatigue Fractured Surface

The amount of α′-martensite on the fatigue fractured surface of the SA and CR specimens shown in Figure 6 was measured with a ferrite scope. The ferromagnetic content determined by ferrite scope, shown in Figure 6, qualitatively indicated the trend of induced transformation by fatigue straining. Notably, the α′-martensite contents of all the SA specimens were negligible in the unstrained condition. In the testing range of ∆K = 10–20 MPa m , the α′-martensite contents of the 301-SA and 304L-SA specimens increased with an increase in the ∆K range, regardless of the testing environment (Figure 6a). This indicated that the enlarged plastic zone size or fatigue strain with increasing ∆K range accounted for the increased amount of α′-martensite. It can be seen in the figure that the 301-SA specimens presented a greater amount of α′-martensite than the 304L-SA specimens. This difference was particularly evident for those specimens tested in air. Additionally, hydrogen was found to restrain the formation of α′-martensite in both 301 and 304L specimens. It was expected that premature cracking, not plastic deformation, in the plastic zone ahead of the fatigue crack tip was responsible for the reduced transformation in the 301 and 304L specimens in hydrogen. With regard to the 310S specimens, no α′-martensite was detected in the specimens within the entire ∆K range, irrespective of the testing environment. Such results are also consistent with the fact that the FCG behaviors of the 310S showed low HE susceptibility.
Cold rolling led to an increase in martensite content on the fatigue fractured surface of the 301 and 304L specimens (Figure 6b). Before fatigue-straining, a certain amount of α′-martensite was formed in the 301 and 304L specimens after cold rolling. Overall, the α′-martensite contents of the 301-CR and 304L-CR specimens also increased slightly with the increase of ∆K. The drop in the rate of transformation could be partly attributed to the volume detection of the ferromagnetic phase of the ferrite scope. At ∆K = 20 MPa m , the α′-martensite contents of the 301-CR-a and 304L-CR-a specimens were 25.8% and 12.0%, respectively. Compared with the counterpart specimens in the cold-rolled state, the increase in martensite content in the 301-CR-a and 304L-CR-a specimens indicated that fatigue straining was responsible for phase transformation. In addition, the martensite contents in the 301-CR-a and 304L-CR-a specimens were much greater than those of their counterpart SA samples (8.0% and 3.9%, respectively, at ∆K = 20 MPa m ). Furthermore, the introduction of hydrogen reduced the α′-martensite transformation in the 301-CR and 304L-CR specimens. Regardless of the testing environment, no α′-martensite was detected in the 310S-CR specimen within the entire testing ∆K range, as shown in Figure 6b.

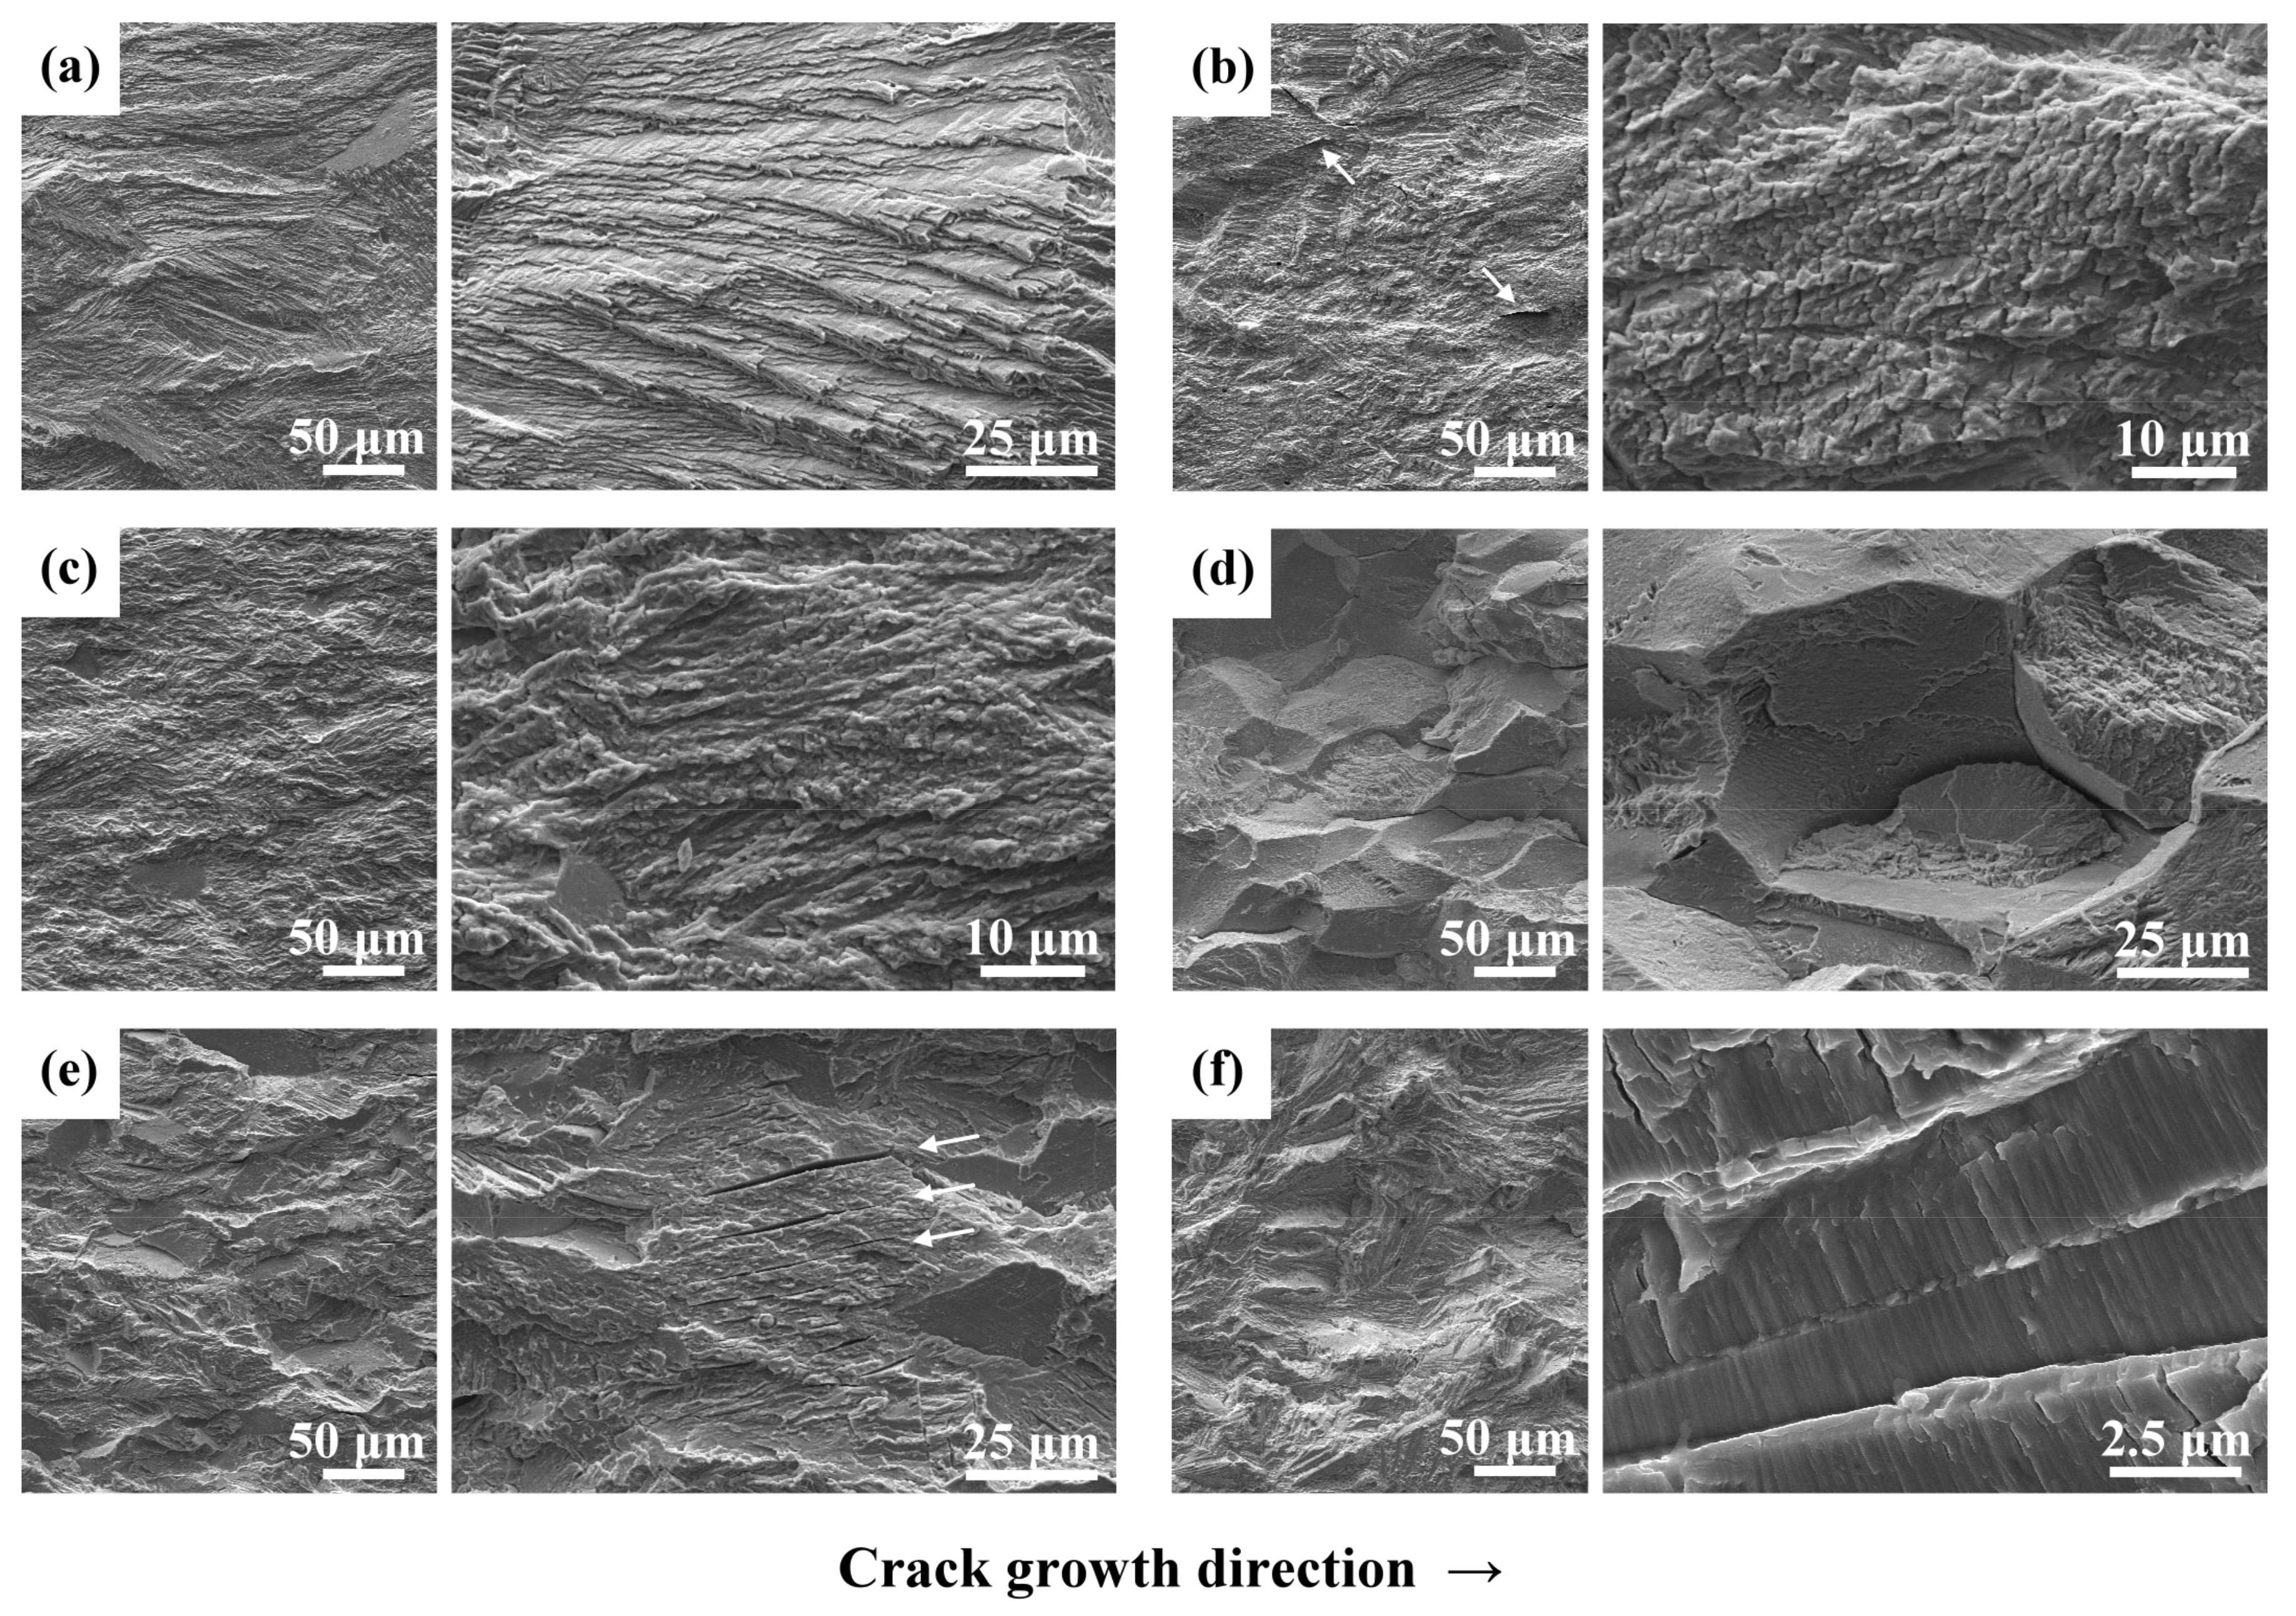
3.4. SEM Fractogragh of the Fatigue Fractured Surface

Figure 7 presents the SEM images of the fatigue fractured surfaces of various specimens tested at ∆K = 15 MPa m . The fractographs of the 301-SA-a specimen showed that the crack mainly propagated transgranularly (Figure 7a left) with a lath morphology of martensite on the fracture surface (Figure 7a right). Fracture features of the 301-CR-a specimen showed more secondary cracks (indicated by the white arrow in Figure 7b left) than the 301-SA-a specimen (Figure 7a left). Moreover, the lath structure of the 301-CR-a specimen was rather fragmented (Figure 7b right), as compared with that of the 301-SA-a specimen (Figure 7a right). The fractographs of the 304L-CR-a specimen were similar to those of the 301-CR-a specimen, as shown in Figure 7c.
The fracture features of the 301-CR-h specimen exhibited severe intergranular cracking as well as quasi-cleavage due to HE (Figure 7d left). Secondary cracks along the grain boundary and intergranular separation were also observed on the fracture surface under high magnitude (Figure 7d right). The fracture appearance of the 304L-CR-h specimens indicated quasi-cleavage fracture as well as some intergranular failure (Figure 7e left). Notably, parallel secondary cracks formed on the fracture surface of the 304L-CR-h specimens, as indicated by the white arrow in Figure 7e right, which could be associated with hydrogen-induced cracking along slip bands during fatigue straining. The fracture appearance of the 310S specimen revealed stepwise crack growth, regardless of the specimen preparation or testing environment (Figure 7f left). In addition, fatigue striations could be seen under high magnification on all the 310S specimens, particularly in the hydrogen-charged environment (Figure 7f right). This event could be a result of the enhanced localized slip in hydrogen.

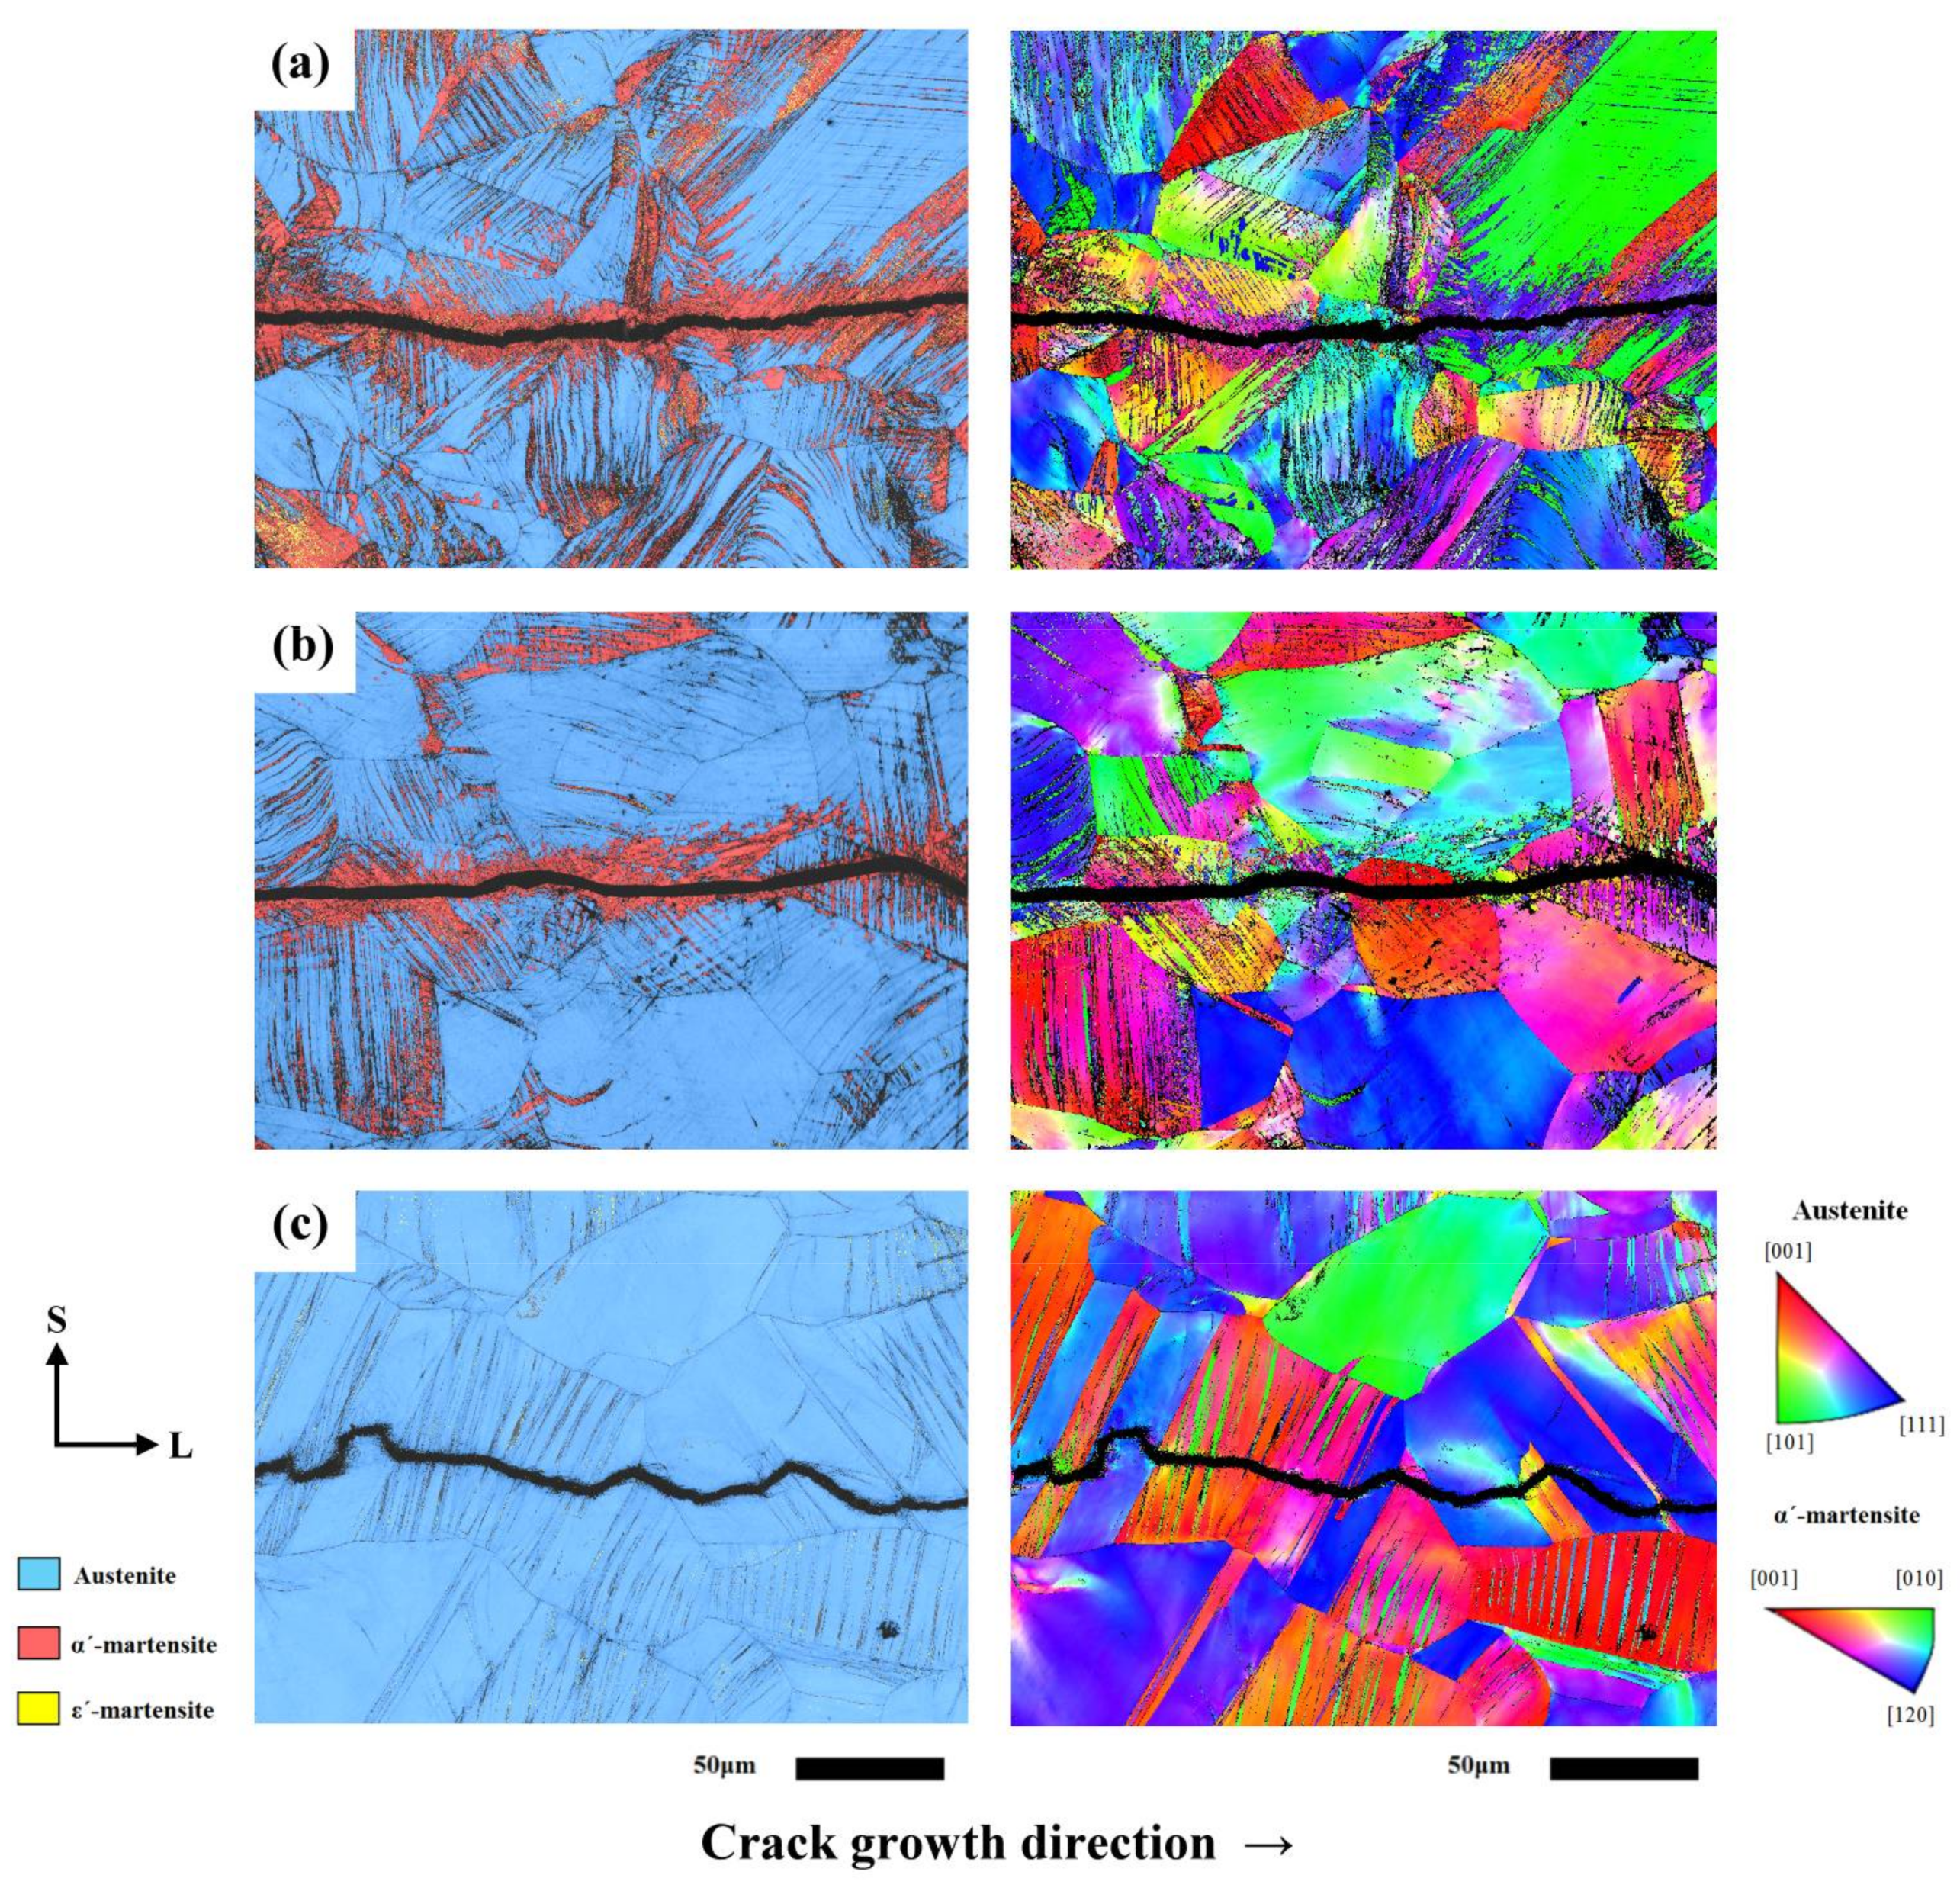
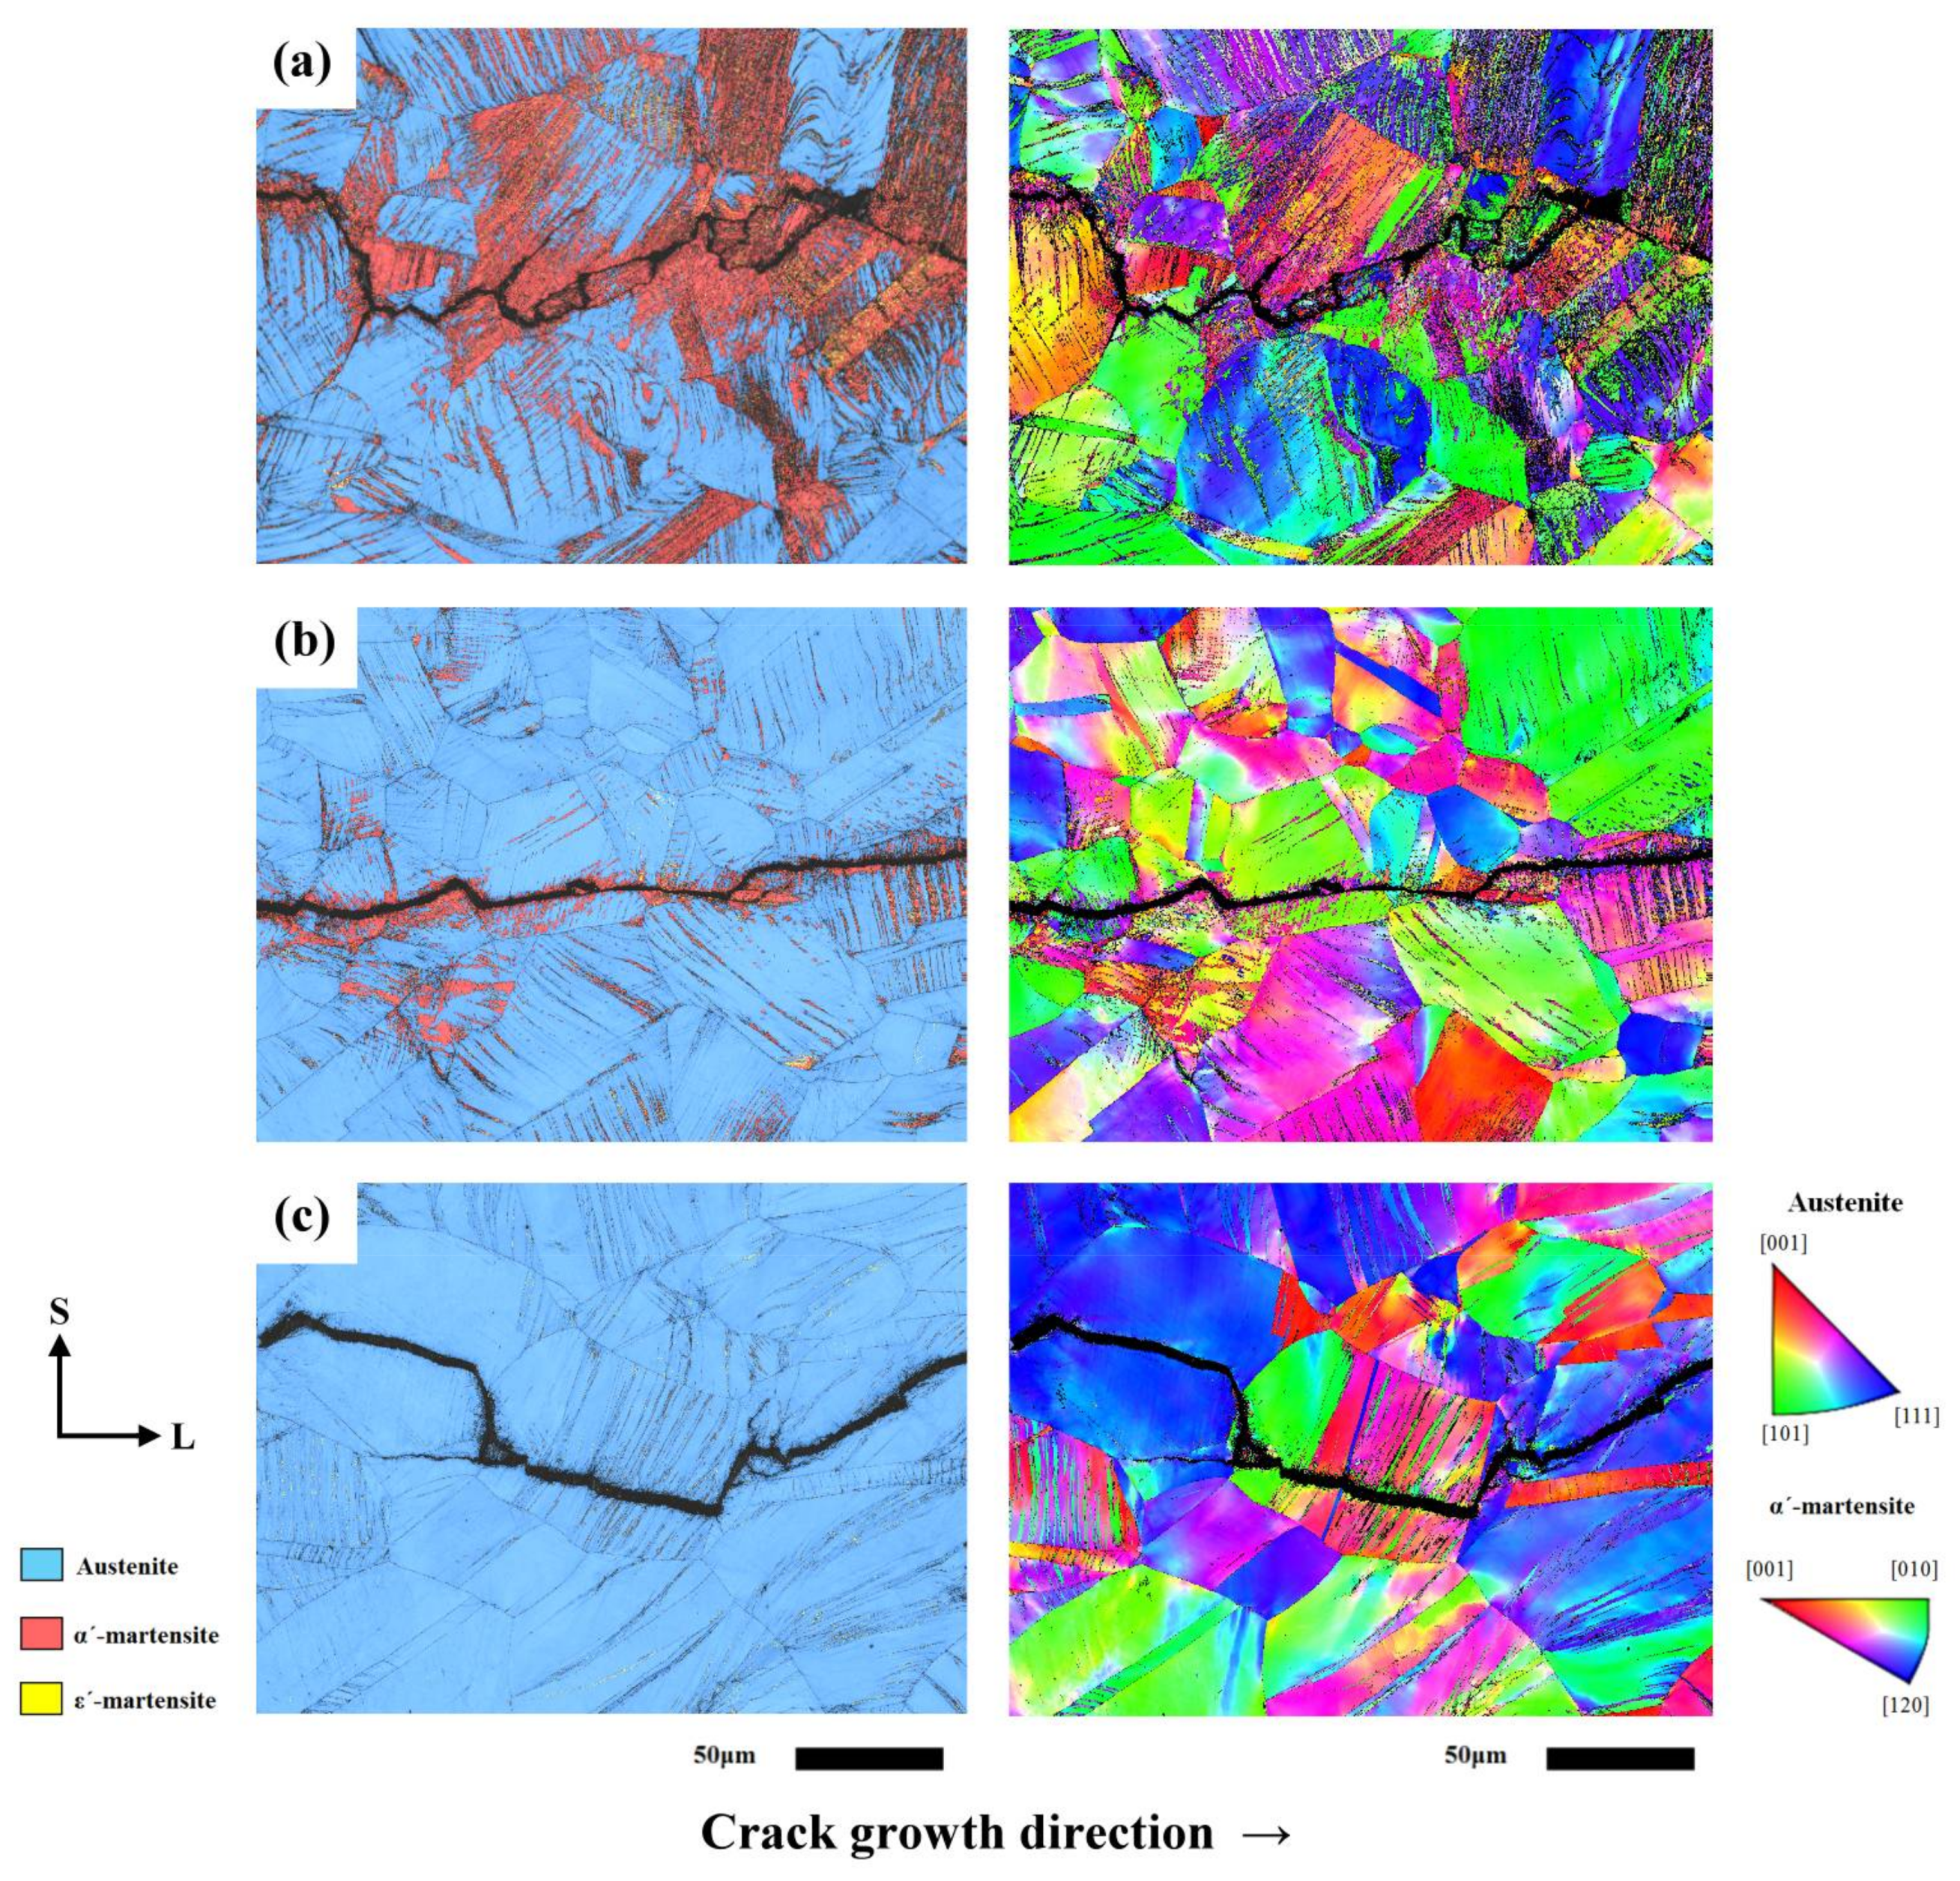
3.5. EBSD Analysis on the Fatigue Crack Path

Figure 8 presents the results of EBSD analysis on the fatigue crack path (in the SL plane) of various cold-rolled specimens in air at the ∆K of 15 MPa m . The left image is the phase distribution map, while the right image is the IPF of the phase map. As shown in Figure 8a, the fatigue crack of the 301-CR-a specimen propagated through a thin α′-martensite layer with few ε-martensite formed alongside the crack path. Basket-weaved slip bands in the 301-CR-a specimen were introduced during cold rolling or induced in the plastic zone ahead of the crack tip during FCG. In comparison with the 301-CR-a specimen, the induced α′-martensite layer around the fatigue crack in the 304L-CR-a specimen was thinner (Figure 8b). In these two specimens, the fatigue crack penetrated the induced martensite, indicating that the resistance to FCG was strongly affected by the α′-martensite. In the case of the 310S-CR-a specimen, the fatigue crack exhibited a transgranular zigzag crack path (Figure 8c). Notably, fewer intense slip bands were formed and no α′-martensite was induced around the fatigue crack in the 310S-CR-a specimen when compared with the other specimens.
The EBSD results of the fatigue crack path of the cold-rolled specimens in hydrogen at ∆K = 15 MPa m are presented in Figure 9. Figure 9a shows an intergranular tortuous crack path with intense slip bands by the side of the crack in the 301-CR-h specimen. It is possible that hydrogen tended to diffuse along the grain boundaries and cause intergranular separation in the 301-CR-h specimen. In addition to the main crack, some branch cracks were also found to propagate mainly along slip bands or induced martensite. Moreover, a predominantly transgranular crack with a small intergranular fracture was seen in the 304L-CR-h specimen (Figure 9b). Regarding the 310S-CR-h specimens shown in Figure 9c, the crack path was similar to that of the 310S-CR-a specimen (Figure 8c), which is a transgranular crack route with slip bands adjacent to the fatigue crack.

4. Discussion

4.1. The Effect of Cold Rolling on the FCG Mechanism of ASSs

The FCGRs of all annealed specimens in air were approximately the same in the same ∆K range. However, cold rolling caused an increase in FCGRs and a decrease in FSR for the 301 and 304L specimens in air as compared with the counterpart SA specimens (Figure 5a). Cold work caused strain hardening. Accordingly, the plastic zone size ahead of the fatigue crack tip in a cold-worked specimen would be smaller than that of the anne aled specimen at the same ∆K. A small plastic zone was expected to have a small FSR for a fatigue crack. In addition, cold rolling of unstable ASSs helped to introduce interlaced slip bands as well as the induced α′-martensite, as shown in Figure 3b,c. The γ→α′ transformation was more likely to occur in the 301 ASS. The fatigue straining ahead of the crack tip further enforced the slip processes and phase transformation. The brittle martensite tended to crack rather than deform during straining. Therefore, assisted martensitic transformation ahead of the crack tip enhanced the straightforward crack growth (Figure 8a,b). As a result, the FSR of the cold-rolled 301 and 304L specimens was lower than that of the annealed counterpart specimens in air. In contrast, regardless of specimen preparation, the fracture surface of the 310S specimen was much rougher than that of other samples. In an ordinary fatigue crack growth, the crack path will be affected by the interaction of fatigue crack tip and slip bands induced by fatigue strain (Figure 8 and Figure 9), resulting in apparent transgranular fracture features (Figure 7). The fatigue crack will propagate either parallel or normal to the induced slip bands (Figure 8 and Figure 9). In the case of a coarse-grained material, the larger and coarse slip bands tended to enhance a zig-zag fatigue crack path. Thus, a coarse-grained material had a higher FSR than a fine-grained one. In this work, the grain size of the 301, 304L, and 310S SSs was 38.6, 36.2, and 63.1 μm, respectively. Clearly, the grain size of 310S SS was much larger than the other two. Results indicate that a deflected crack path is more likely to occur in a coarse-grained alloy than in a fine-grained alloy [46]. Therefore, the coarse grain size accounted for the high FSR or tortuous crack path of 310S SS relative to the 301 and 304L SSs.

4.2. The Effect of Hydrogen on the FCG Mechanism of ASSs

The results of FCG tests showed that the FCGRs and FSR of all specimens increased with increasing ∆K, as shown in Figure 4 and Figure 5. This meant that a larger plastic zone size or greater amount of martensite led to higher FSR. Moreover, the effect of testing environments on alterations in the FSR could be related to the variation in the specimens’ fracture modes. The change in the testing environments from air to hydrogen led to a marked increase in FCGRs and FSR for the 301 and 304L specimens (Figure 4), i.e., the 301 and 304L ASSs were sensitive to HE and exhibited a change in fracture appearance. In contrast, HE had less effect on the FCGRs and FSR of the 310S specimen. The EBSD results revealed that a thin α′-martensite layer decorated the fatigue crack. The ease of cracking of α′-martensite in hydrogen was confirmed by the reduced amount of α′-martensite on the fracture surface (Figure 6) and the thickness of the martensite layer alongside the fatigue crack (Figure 9a,b). Hydrogen embrittlement caused a significant change in fatigue fracture features for the 301 and 304L specimens (Figure 7d,e). As shown in Figure 7d, the cold-rolled 301 specimen illustrated the prevalence of intergranular fractures in hydrogen versus any transgranular fatigue across the slip bands in air. It was deduced that the hydrogen diffused into the plastic zone and caused intergranular fracture therein during fatigue-straining of the ASSs. For the unstable ASSs, the interaction of hydrogen with grain boundary martensite led to a significant change in fracture features in comparison with that of fatigue in air. Thus, the noticeably high FSR might be used as an indicator of hydrogen-accelerated FCG in the unstable ASSs.

5. Conclusions

(1)
The degrees of strain-induced martensite transformation in descending order were 301 > 304L > 310S if cold rolling was applied. Regardless of the testing conditions, the FCGRs and FSR of all specimens increased with increasing ∆K. This indicated that a larger plastic zone size led to a greater amount of martensite which resulted in higher FSR.
(2)
The 310S, a stable ASS, showed that the FCGRs and FSR were less affected by cold rolling and hydrogen embrittlement. In contrast with 301 and 304L SSs, the 310S specimen with a coarse grain size showed a much higher FSR and a tortuous crack path which was the result of the interaction of the crack growth with the slip bands, induced by fatigue strain.
(3)
For the unstable ASSs, such as 301 and 304L, cold rolling caused the formation of interlaced slip bands and induced martensite. The fatigue strain further enhanced slip processes and martensitic transformation ahead of the fatigue crack. The premature cracking of brittle martensite at the crack tip led to an increased FCGRs and a straightforward fatigue crack path.
(4)
The interaction of hydrogen with grain boundary martensite caused a hydrogen-accelerated FCG and intergranular fracture in the 301 ASS, which was associated with a high FSR. Thus, the high FSR might be used as an indicator of hydrogen-accelerated FCG in unstable ASSs.

Author Contributions

Tai-Cheng Chen performed the experiment and prepared the manuscript. Sheng-Tsan Chen assisted in performing the fatigue tests. Leu-Wen Tsay and Ren-Kae Shiue designed and planned this study.

Conflicts of Interest

The authors declare no conflict of interest.

Abbreviations

ASSsAustenitic stainless steels
HEHydrogen embrittlement
FCGRsFatigue crack growth rates
CODCrack opening displacement
SHPMScanning Hall probe microscope
FSRFracture surface roughness
FCGFatigue crack growth
EBSDElectron back-scattered diffraction
SASolution-annealed
CRCold-rolled
CTCompact tension
OMOptical microscope
SEMScanning electron microscope
IPFInverse pole figure

References

  1. Datta, K.; Delhez, R.; Bronsveld, P.M.; Beyer, J.; Geijselaers, H.J.M.; Post, J. A low-temperature study to examine the role of ε-martensite during strain-induced transformations in metastable austenitic stainless steels. Acta Mater. 2009, 57, 3321–3326. [Google Scholar] [CrossRef]
  2. Perdahcıoğlu, E.S.; Geijselaers, H.J.M.; Groen, M. Influence of plastic strain on deformation-induced martensitic transformations. Scr. Mater. 2008, 58, 947–950. [Google Scholar] [CrossRef]
  3. Gey, N.; Petit, B.; Humbert, M. Electron backscattered diffraction study of ε/α′ martensitic variants induced by plastic deformation in 304 stainless steel. Metall. Mater. Trans. A 2005, 36, 3291–3299. [Google Scholar] [CrossRef]
  4. Okayasu, M.; Fukui, H.; Ohfuji, H.; Shiraishi, T. Strain-induced martensite formation in austenitic stainless steel. J. Mater. Sci. 2013, 48, 6157–6166. [Google Scholar] [CrossRef]
  5. Da Rocha, M.R.; de Oliveira, C.A.S. Evaluation of the martensitic transformations in austenitic stainless steels. Mater. Sci. Eng. A 2009, 517, 281–285. [Google Scholar] [CrossRef]
  6. Tamura, I. Deformation-induced martensitic transformation and transformation-induced plasticity in steels. Met. Sci. 1982, 16, 245–253. [Google Scholar] [CrossRef]
  7. Bak, H.S.; Abro, A.M.; Lee, B.D. Effect of hydrogen and strain-induced martensite on mechanical properties of AISI 304 stainless steel. Metals 2016, 6, 169. [Google Scholar] [CrossRef]
  8. Böhner, A.; Niendorf, T.; Amberger, D.; Höppel, H.W.; Göken, M.; Maier, H.J. Martensitic transformation in ultrafine-grained stainless steel AISI 304L under monotonic and cyclic loading. Metals 2012, 2, 56–64. [Google Scholar] [CrossRef]
  9. Tian, Y.; Lienert, U.; Borgenstam, A.; Fischer, T.; Hedström, P. Martensite formation during incremental cooling of Fe-Cr-Ni alloys: An in-situ bulk X-ray study of the grain-averaged and single-grain behavior. Scr. Mater. 2017, 136, 124–127. [Google Scholar] [CrossRef]
  10. Tian, Y.; Gorbatov, O.I.; Borgenstam, A.; Ruban, A.V.; Hedström, P. Deformation microstructure and deformation-induced martensite in austenitic Fe-Cr-Ni alloys depending on stacking fault energy. Metall. Mater. Trans. A 2017, 48, 1–7. [Google Scholar] [CrossRef]
  11. Angel, T. Formation of martensite in austenitic stainless steels. J. Iron Steel Inst. 1954, 177, 165–174. [Google Scholar]
  12. Hecker, S.S.; Stout, M.G.; Staudhammer, K.P.; Smith, J.L. Effects of strain state and strain rate on deformation-induced transformation in 304 stainless steel: Part I. Magnetic measurements and mechanical behavior. Metall. Trans. A 1982, 13, 619–626. [Google Scholar] [CrossRef]
  13. Murr, L.E.; Staudhammer, K.P.; Hecker, S.S. Effects of strain state and strain rate on deformation-induced transformation in 304 stainless steel: Part II. Microstructural study. Metall. Trans. A 1982, 13, 627–635. [Google Scholar] [CrossRef]
  14. Lichtenfeld, J.A.; VanTyne, C.J.; Mataya, M.C. Effect of strain rate on stress-strain behavior of alloy 309 and 304L austenitic stainless steel. Metall. Mater. Trans. A 2006, 37, 147–161. [Google Scholar] [CrossRef]
  15. Chen, X.; Wang, Y.; Gong, M.; Xia, Y. Dynamic behavior of SUS304 stainless steel at elevated temperatures. J. Mater. Sci. 2004, 39, 4869–4875. [Google Scholar] [CrossRef]
  16. Talonen, J.; Hänninen, H. Formation of shear bands and strain-induced martensite during plastic deformation of metastable austenitic stainless steels. Acta Mater. 2007, 55, 6108–6118. [Google Scholar] [CrossRef]
  17. Lee, W.-S.; Lin, C.-F. The morphologies and characteristics of impact-induced martensite in 304L stainless steel. Scr. Mater. 2000, 43, 777–782. [Google Scholar] [CrossRef]
  18. Talonen, J.; Hänninen, H.; Nenonen, P.; Pape, G. Effect of strain rate on the strain-induced γ → α′-martensite transformation and mechanical properties of austenitic stainless steels. Metall. Mater. Trans. A 2005, 36, 421–432. [Google Scholar] [CrossRef]
  19. Hedström, P.; Lindgren, L.E.; Almer, J.; Lienert, U.; Bernier, J.; Terner, M.; Odén, M. Load partitioning and strain-induced martensite formation during tensile loading of a metastable austenitic stainless steel. Metall. Mater. Trans. A 2009, 40, 1039–1048. [Google Scholar] [CrossRef]
  20. De Abreu, H.F.G.; de Carvalho, S.S.; de Lima Neto, P.; dos Santos, R.P.; Freire, V.N.; de Silva, P.M.O.; Tavares, S.S.M. Deformation induced martensite in an AISI 301LN stainless steel: Characterization and influence on pitting corrosion resistance. Mater. Res. 2007, 10, 359–366. [Google Scholar] [CrossRef]
  21. Mumtaz, K.; Takahashi, S.; Echigoya, J.; Zhang, L.; Kamada, Y.; Sato, M. Temperature dependence of martensitic transformation in austenitic stainless steel. J. Mater. Sci. Lett. 2003, 22, 423–427. [Google Scholar] [CrossRef]
  22. Byun, T.S.; Hashimoto, N.; Farrell, K. Temperature dependence of strain hardening and plastic instability behaviors in austenitic stainless steels. Acta Mater. 2004, 52, 3889–3899. [Google Scholar] [CrossRef]
  23. Perng, T.P.; Altstetter, C.J. Comparison of hydrogen gas embrittlement of austenitic and ferritic stainless steels. Metall. Trans. A 1987, 18, 123–134. [Google Scholar] [CrossRef]
  24. Tsay, L.W.; Chen, J.J.; Huang, J.C. Hydrogen-assisted fatigue crack growth of AISI 316L stainless steel weld. Corros. Sci. 2008, 50, 2973–2980. [Google Scholar] [CrossRef]
  25. Tsay, L.W.; Yu, S.C.; Huang, R.T. Effect of austenite instability on the hydrogen-enhanced crack growth of austenitic stainless steels. Corros. Sci. 2007, 49, 2973–2984. [Google Scholar] [CrossRef]
  26. Zhang, L.; Wen, M.; Imade, M.; Fukuyama, S.; Yokogawa, K. Effect of nickel equivalent on hydrogen gas embrittlement of austenitic stainless steels based on type 316 at low temperatures. Acta Mater. 2008, 56, 3414–3421. [Google Scholar] [CrossRef]
  27. Martin, M.; Weber, S.; Theisen, W.; Michler, T.; Naumann, J. Effect of alloying elements on hydrogen environment embrittlement of AISI type 304 austenitic stainless steel. Int. J. Hydrogen Energy 2011, 36, 15888–15898. [Google Scholar] [CrossRef]
  28. Kang, J.-H.; Noh, H.-S.; Kim, K.-M.; Lee, S.C.; Kim, S.-J. Modified Ni equivalent for evaluating hydrogen susceptibility of Cr-Ni based austenitic stainless steels. J. Alloys Compd. 2017, 696, 869–874. [Google Scholar] [CrossRef]
  29. Kanezaki, T.; Narazaki, C.; Mine, Y.; Matsuoka, S.; Murakami, Y. Effects of hydrogen on fatigue crack growth behavior of austenitic stainless steels. Int. J. Hydrogen Energy 2008, 33, 2604–2619. [Google Scholar] [CrossRef]
  30. Murakami, Y.; Matsuoka, S. Effect of hydrogen on fatigue crack growth of metals. Eng. Fract. Mech. 2010, 77, 1926–1940. [Google Scholar] [CrossRef]
  31. Mine, Y.; Narazaki, C.; Murakami, K.; Matsuoka, S.; Murakami, Y. Hydrogen transport in solution-treated and pre-strained austenitic stainless steels and its role in hydrogen-enhanced fatigue crack growth. Int. J. Hydrogen Energy 2009, 34, 1097–1107. [Google Scholar] [CrossRef]
  32. Chen, X.; Zhou, C.; Cai, X.; Zheng, J.; Zhang, L. Effects of external hydrogen on hydrogen transportation and distribution around the fatigue crack tip in type 304 stainless steel. J. Mater. Eng. Perform. 2017, 26, 4990–4996. [Google Scholar] [CrossRef]
  33. Chen, T.C.; Chen, S.T.; Tsay, L.W. The role of induced α′-martensite on the hydrogen-assisted fatigue crack growth of austenitic stainless steels. Int. J. Hydrogen Energy 2014, 39, 10293–10302. [Google Scholar] [CrossRef]
  34. Chen, T.C.; Chen, S.T.; Kai, W.; Tsay, L.W. The effect of phase transformation in the plastic zone on the hydrogen-assisted fatigue crack growth of 301 stainless steel. Mater. Charact. 2016, 112, 134–141. [Google Scholar] [CrossRef]
  35. Irwin, G.R. Linear fracture mechanics, fracture transition, and fracture control. Eng. Fract. Mech. 1968, 1, 241–257. [Google Scholar] [CrossRef]
  36. Réthoré, J.; Limodin, N.; Buffière, J.-Y.; Roux, S.; Hild, F. Three-dimensional analysis of fatigue crack propagation using X-ray tomography, digital volume correlation and extended finite element simulations. Procedia IUTAM 2012, 4, 151–158. [Google Scholar] [CrossRef]
  37. Tanabe, H.; Kida, K.; Takamatsu, T.; Itoh, N.; Santos, E.C. Observation of magnetic flux density distribution around fatigue crack and application to non-destructive evaluation of stress intensity factor. Procedia Eng. 2011, 10, 881–886. [Google Scholar] [CrossRef]
  38. Saka, M.; Sato, I.; Abé, H. NDE of a 3-D surface crack using magnetic field induced by DC current flow. NDT E Int. 1998, 31, 325–328. [Google Scholar] [CrossRef]
  39. Palumbo, D.; Ancona, F.; DeFinis, R.; Galietti, U. Experimental study of the crack growth in stainless steels using thermal methods. Procedia Eng. 2015, 109, 338–345. [Google Scholar] [CrossRef]
  40. Ancona, F.; DeFinis, R.; Palumbo, D.; Galietti, U. Crack growth monitoring in stainless steels by means of TSA technique. Procedia Eng. 2015, 109, 89–96. [Google Scholar] [CrossRef]
  41. Saxena, A.; Hudak, S.J., Jr. Review and extension of compliance information for common crack growth specimens. Int. J. Fract. 1978, 14, 453–468. [Google Scholar] [CrossRef]
  42. Haušild, P.; Davydov, V.; Drahokoupil, J.; Landa, M.; Pilvin, P. Characterization of strain-induced martensitic transformation in a metastable austenitic stainless steel. Mater. Des. 2010, 31, 1821–1827. [Google Scholar] [CrossRef]
  43. Talonen, J.; Aspegren, P.; Hänninen, H. Comparison of different methods for measuring strain induced α′-martensite content in austenitic steels. Mater. Sci. Technol. 2004, 20, 1506–1512. [Google Scholar] [CrossRef]
  44. Moallemi, M.; Kermanpur, A.; Najafizadeh, A.; Rezaee, A.; Baghbadorani, H.S.; Nezhadfar, P.D. Deformation-induced martensitic transformation in a 201 austenitic steel: The synergy of stacking fault energy and chemical driving force. Mater. Sci. Eng. A 2016, 653, 147–152. [Google Scholar] [CrossRef]
  45. Kisko, A.; Misra, R.D.K.; Talonen, J.; Karjalainen, L.P. The influence of grain size on the strain-induced martensite formation in tensile straining of an austenitic 15Cr-9Mn-Ni-Cu stainless steel. Mater. Sci. Eng. A 2013, 578, 408–416. [Google Scholar] [CrossRef]
  46. Yin, D.; Liu, H.; Chen, Y.; Yi, D.; Wang, B.; Wang, B.; Shen, F.; Fu, S.; Tang, C.; Pan, S. Effect of grain size on fatigue-crack growth in 2524 aluminium alloy. Int. J. Fatigue 2016, 84, 9–16. [Google Scholar] [CrossRef]
Figure 1. Schematic diagram showing the dimensions of the specimen for the FCG (fatigue crack growth) test.
Metals 08 00221 g001
Figure 2. Schematic illustration of all measurements on the fatigue-fractured specimen.
Metals 08 00221 g002
Figure 3. EBSD analysis showing the phase distribution map (left) and the corresponding IPF (right) of the: (a) 301-SA; (b) 301-CR; (c) 304L-CR; (d) 310S-CR specimens in the SL plane.
Metals 08 00221 g003
Figure 4. The FCGRs as a function of the fatigue FSR of various (a) SA; and (b) CR specimens.
Metals 08 00221 g004
Figure 5. The FCGRs as a function of the fatigue FSR of various specimens tested in (a) air; and (b) gaseous hydrogen.
Metals 08 00221 g005
Figure 6. The distribution of α′-martensite contents on the fatigue fractured surface of various (a) SA and (b) CR specimens.
Metals 08 00221 g006
Figure 7. The SEM fractographs of various fatigue fractured specimens tested at ∆K = 15 MPa m : (a) 301-SA-a, (b) 301-CR-a, (c) 304L-CR-a, (d) 301-CR-h, (e) 304L-CR-h and (f) 310S-CR-h specimens.
Metals 08 00221 g007
Figure 8. EBSD images showing the phase distribution map (left) and the corresponding IPF (right) of the (a) 301-CR-a; (b) 304L-CR-a; (c) 310S-CR-a specimens under the condition of ∆K = 15 MPa m .
Metals 08 00221 g008
Figure 9. EBSD images showing the phase distribution map (left) and the corresponding IPF (right) of the (a) 301-CR-h; (b) 304L-CR-h; (c) 310S-CR-h specimens under the condition of ∆K = 15 MPa m .
Metals 08 00221 g009
Table 1. Chemical compositions of various ASSs (austenitic stainless steels) used in this study.
MaterialChemical Composition (wt. %)
CMnSiSPCrNiNFe
3010.081.160.540.0030.02016.716.89-bal.
304L0.021.580.370.0020.03218.208.040.045bal.
310S0.051.170.800.0030.01524.6619.09-bal.
Table 2. Test matrix of the FCG tests.
MaterialConditionTesting Environment
AirGaseous Hydrogen
301SA301-SA-a301-SA-h
CR301-CR-a301-CR-h
304LSA304L-SA-a304L-SA-h
CR304L-CR-a304L-CR-h
310SSA310S-SA-a310S-SA-h
CR310S-CR-a310S-CR-h

