Article

Microstructural Characterization of the Anisotropy and Cyclic Deformation Behavior of Selective Laser Melted AlSi10Mg Structures

Department of Materials Test Engineering (WPT), TU Dortmund University, D-44227 Dortmund, Germany
*
Author to whom correspondence should be addressed.
Metals 2018, 8(10), 825; https://doi.org/10.3390/met8100825
Submission received: 24 September 2018 / Revised: 11 October 2018 / Accepted: 12 October 2018 / Published: 13 October 2018
(This article belongs to the Special Issue Fatigue Damage of Additively-Manufactured Metallic Materials)

Abstract

:
The laser-based fusion of metallic powder allows construction of components with arbitrary complexity. In selective laser melting, the rapid cooling of melt pools in the direction of the component building causes significant anisotropy of the microstructure and properties. The objective of this work is to investigate the influence of build anisotropy on the microstructure and mechanical properties in selective laser melted AlSi10Mg. The alloy is comprehensively used in the automotive industry and has been one of the most frequently investigated Al alloys in additive manufacturing. Using specimens produced in three different building orientations with respect to the build platform, the anisotropy of the microstructure and defects will be investigated using scanning electron microscopy and microcomputed tomography. The analysis showed a seven-times higher pore density for the 90°-specimen compared to the 0°-specimen. The scanning electron microscopy revealed the influence of the direction of the cooling gradient on the constitution of the eutectic phase. Mechanical properties are produced in quasi-static and fatigue tests of variable and constant loading amplitudes. Specimens of 0° showed 8% higher tensile strength compared to 90°-specimens, while fracture strain was reduced almost 30% for the 45°-specimen. The correlation between structural anisotropy and mechanical properties illustrates the influence of the building orientation during selective laser melting on foreseen fields of application.

1. Introduction

Selective laser melting (SLM) as a near-net shape layer-wise additive manufacturing technique that has been in development for two decades for the production of topologically-optimized components for the aerospace and automobile industries [1]. The process also offers efficient production and a sustainable resource approach in modern manufacturing. Due to reliability concerns on the components produced using this technology, their application is now limited in transport airplanes [2]. Further regulation by NASA dictated that sampling experiments for mechanical reliability must be carried out parallel to building jobs which are consequently to be used in structurally-sensitive components [3]. However, such questioning of the quality of SLM components did not stop their development from being more complex and critical in the application fields. On the other hand, recent review articles reveal how wide the material palette for SLM now is [4,5]. Review articles have also highlighted the importance of feedstock in the process chain and its influence on the final quality [6]. Improving surface quality through ultrasonic burnishing methods has been reported to save costs [7]. In parallel, the production philosophy is also being developed side by side with the technology to fulfill the requirements of specific industries [8].
The development of defects which raises the question about the safety of SLM components is due to the dynamic nature of the process and the constitution of unstable melt pools which are subjected to high cooling rates. The instability of the melt pool is mainly responsible for porosity and surface roughness. The mechanism described by Qiu et al. [9] is based on the recoil pressure from Marangoni force which reduces the stability of the melt pool. On the other hand, reducing energy density to avoid this phenomenon will result in an increase in porosity if the energy density is not sufficient to achieve sound powder fusion. On the lower scale of the porosity and surface roughness problem, a significant anisotropy and microstructure heterogeneity were observed in various alloying systems and with different process routes [10]. Various reasons can be tracked, which are grain morphology, crystallographic texture, or heterogenous recrystallization. What concerns materials engineers is that a significant dependence of properties on building orientation is developed. Simonelli et al. [11] showed that ductility is dependent on the building orientation for Ti-6Al-4V. Furthermore, the anisotropy of the microstructure affected the fracture mode according to the prior-β grain boundaries, which resulted in an intergranular crack path.
Aluminum (Al) alloys are very relevant nowadays to the concepts of lightweight design and resource sustainability in engineering practices. Hence, the production efficiency of SLM is very relevant to the processing of Al alloys. Several cast Al alloys have been reported successfully processed using SLM technology, such as AlSi12 [12], AlSi10Mg [13], and Scalmalloy® [14]. High-strength Al alloys, like EN AW 7075, which are wrought, and precipitation hardening alloys were not processable by SLM due to the formation of hot cracks [15]. Only by modification of the composition through the addition of ≈4% Si was a structure without hot cracks obtainable with reasonable density and hardness [16]. Yang et al. [17] reported various defect types in AlSi7Mg and AlSi10Mg processed by SLM. The defects ranged from a lack of fusion defects with an orientation parallel or perpendicular to the building orientation to keyhole and gas porosity defects. Residual gas porosity was also observed that were normally round and formed at high energy densities. Statistical design of process parameters was reported to reduce porosity and enhance densification. The resulting strength was superior to the conventional cast AlSi10Mg [18]. Hot isostatic pressing (HIP) eliminated pores in addition to T6 heat treatment, which allowed AlSi10Mg, made from recycled powder, to reach adequate tensile strength [19]. Dai et al. [20] attempted the elimination of porosity by the application of in situ remelting of the solidified layer, so entrapped gas porosity can escape. A byproduct was a homogenous dispersion of Si particles in the structure to a degree, which is more pronounced than the literature reported earlier [12]. Although mechanical properties were improved by this technique [20], there is no report in the visible literature on the effect of such a strategy on cyclic deformation properties.
Mechanical properties of SLM Al alloys in the quasi-static, as well as fatigue loading spectra, have been investigated and proven sensitive to residual defects [13,19,21]. Brandl et al. [22] investigated peak hardening treatments for specimens built at 0°, 45°, and 90°. Specimens built at 0° experienced higher fatigue resistance than 45° and 90° specimens. Aboulkhair et al. [23] reported that enhancement of fatigue strength due to surface machining was most significant at lower stress levels typical of high-cycle fatigue (HCF). Enhanced ductility by heat treatments improved fatigue strength due to microstructure homogenization and relief of residual stresses. In Al alloys, fatigue failure was repeatedly initiated from the surface or sub-surface defects [21,23,24]. Reports on the effectiveness of platform heating (PH) in improving fatigue strength in the HCF regime were justified by reduced porosity and enhanced microstructural homogeneity in the specimens where PH was applied [21,22,24]. Siddique et al. [25] reported ≈33% improvement of fatigue strength for PH specimens, which were also stress-relieved (SR) at 1 × 10⁹ cycles. Crack propagation resistance was also enhanced due to improved ductility by the increased dendritic width of the microstructure. Various fatigue life prediction techniques were, thus, introduced for AlSi alloys which were based on fracture mechanics and cyclic deformation damage. The fracture mechanics approaches were more effective at higher stress levels [26,27].
In this study, three batches which correspond to the building orientations of 0°, 45°, and 90° were investigated. The structure was analyzed by using light microscopy with Barker etching to reveal melting tracks. Chemical etching of the phase boundaries of the hypoeutectic alloy is applied to reveal the morphology which is highly influenced by the directions of cooling gradient of the melt pools. Quasi-static tensile properties were applied to correlate anisotropy of the structure to the tensile strength. Cyclic loading under continuously increasing load amplitude was applied to separate the fatigue transition mechanisms of the batches from low- to high-cycle fatigue (LCF and HCF). Constant amplitude loading was applied to compare the fatigue strength of batches at selected load levels while the microstructural degradation mechanism was monitored by tracking the evolution of the dynamic modulus of elasticity. The cyclic, as well as the quasi-static deformation mechanisms, are correlated with the defect status and pore morphology which was based on X-ray microcomputed tomography (µ-CT). The study is designed and aimed at understanding the influence of microstructure and defect anisotropy on the tensile and fatigue properties of SLM AlSi10Mg.

2. Materials and Methods

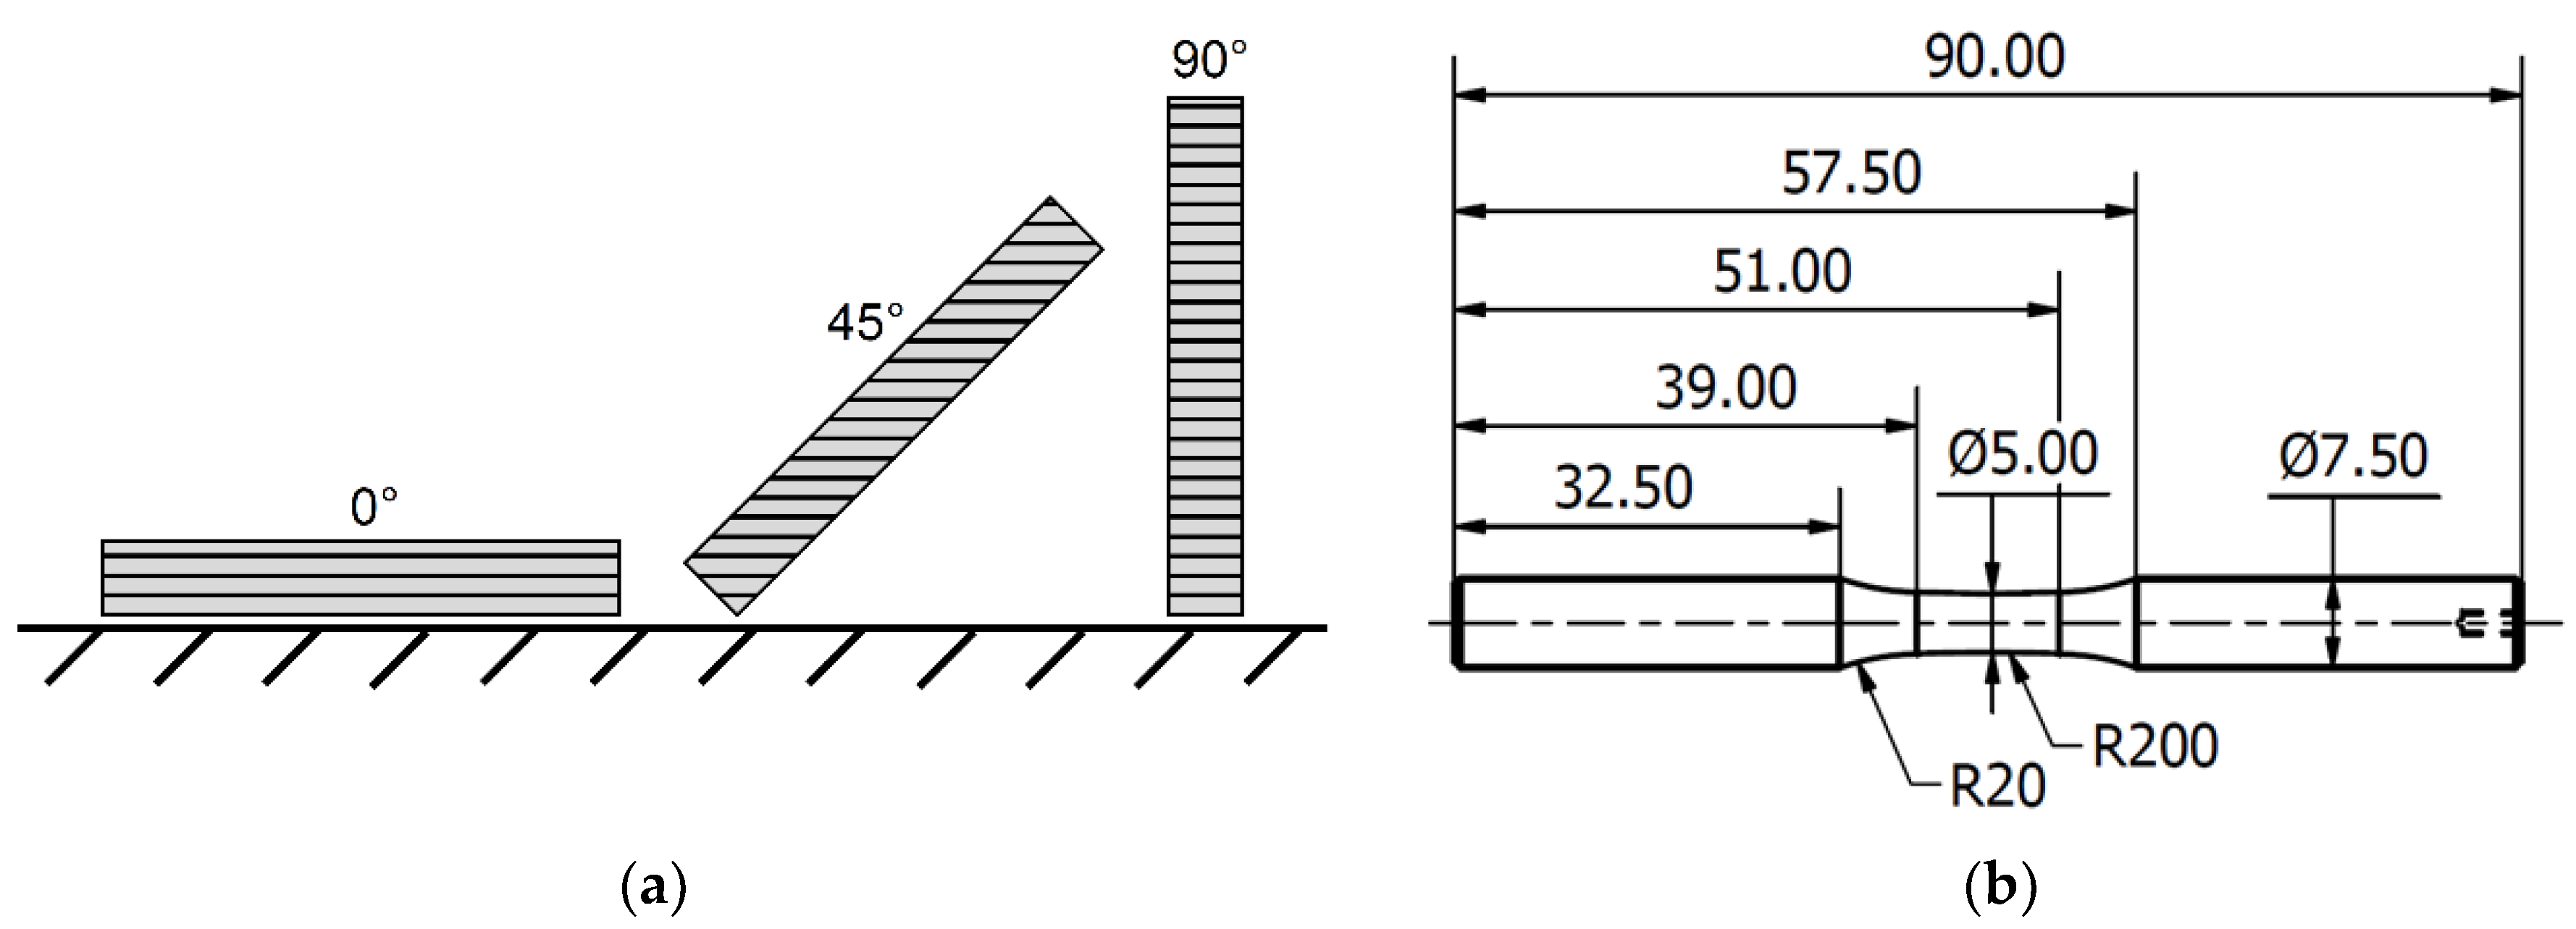
2.1. Experimental Setup

The AlSi10Mg bulk material in form of cuboid specimens with a quadratic edge length of 10 mm and a total length of 100 mm was manufactured using a M2 Cusing System (Concept Laser, Lichtenfels, Germany) with an integrated 200 W fiber laser without any base plate heating. Further details regarding the SLM scanning parameters are not available to be published in this work. The material was tested in the as-built state and no additional post heat treatment was carried out. In order to examine the influence of the building orientation on the microstructure and mechanical properties, the samples were oriented in different directions (0°, 90°, and 45°) related to the build platform, as can be seen in Figure 1a. All specimens were manufactured with identical process parameters during one production run. In order to avoid influence by the as-built surface roughness and borderline porosity [28], specimens were machined and subsequently ground and polished. The specimen geometry used for tensile and fatigue tests is shown in Figure 1b, based on German standard DIN 50125.

2.1.1. Structure and Morphology Analysis

The as-built material was used for basic characterization like microscopic investigations and non-destructive analysis of process-induced microstructural features, such as pores and lack of fusion. For light microscopy, the specimens were cold-embedded in epoxy resin, ground with SiC abrasive paper and polished with suspension (3 µm, 1 µm, and 0.05 µm). Afterward, the samples were prepared with Barker etching for 80 s by a voltage of 25 V and a flow rate of 15 L/min with the machine LectroPol-5 (Struers, Willich, Germany). Light microscope images have been taken with the light microscope Axio Imager (Carl Zeiss, Oberkochen, Germany) with 50× magnification. For fracture surfaces analysis of the tensile and fatigue specimens, a scanning electron microscope (SEM) (TESCAN, Brno, Czech Republic) of was used. Related cell size measurements were carried out according to DIN EN ISO 643. For this purpose, the cell size is characterized by the linear intercept method at five different areas, whereby the ratio between a defined line length and total number of at least 50 cut grains results in the average cell size.
Defect characterization was carried out by 3D non-destructive analysis using X-ray microcomputed tomography system (µ-CT) XT H 160 (Nikon, Tokyo, Japan). The Nikon system reaches a maximum acceleration voltage of 160 kV with a micro-focus of 3 µm. The conical shaped X-ray beam is emitted by a tungsten filament and penetrates the specimen where it is partially absorbed. During the measurement, the sample rotates 360°, and the detector captures 1582 2D-projection images, from which a 3D dataset of volume elements (voxels) is reconstructed. The scanning parameters are summarized in Table 1.
Further details regarding the scanning setup can be found in [14]. For pore detection, the reconstructed volumes were visualized using the software VGSTUDIO MAX 2.2 (Volume Graphics, Heidelberg, Germany). By using a pore detection algorithm, the voxels were identified as defects if their gray value is below the specified threshold. In order to describe the morphology of the pores, the equivalent diameter was determined based on the defect volume V according to Equation (1):
d e q = 6 V π 3
This diameter refers to a sphere enclosing the defect. For better visualization, the equivalent pore diameter is divided into classes (deq−5, deq+5) based on the voxel size. To be able to describe the 3D-pore morphology, a 3D-form factor (sphericity, S) is introduced, which is calculated based on defect volume V and surface area A of a defect according to Equation (2) [29]:
S = π 1 / 3 ( 6 V ) 2 / 3 A
The sphericity is defined as S ⊂ [0, 1] and for a perfect sphere is S = 1.

2.1.2. Mechanical Properties

The quasi-static tensile tests were conducted according to ISO 6892-1 in air at room temperature using a Shimadzu AG-X plus system (Kyoto, Japan) with a 100 kN load cell. All specimens were extracted from the center of the manufactured cuboids and final specimen geometry, shown in Figure 1b, was achieved through subsequent machining and polishing. For quasi-static testing, three specimens were tested for every building orientation. The tests were carried out under displacement-control at strain rates of ε ˙ = 0.7 × 10⁻⁴ s−1 for the elastic region and ε ˙ = 2.5 × 10⁻⁴ s−1 for the elastic-plastic region. Strain measurements for tensile and fatigue tests were realized by applying a tactile extensometer with a gauge length of 10 mm.
For fatigue testing, the same specimen geometry as for quasi-static testing was used. Two types of stress-controlled fatigue tests based on ISO 1099 were carried out using the servohydraulic system Instron 8872 (Norwood, CO, USA) with a 10 kN load cell and an Instron 8800 controller. For the characterization of the fatigue behavior load increase tests (LIT) as well as constant amplitude tests (CAT) were performed. In the LIT the specimen is exposed to a stress amplitude that is increased as a function of time with a constant ramp. Thus, the cyclic material response can be observed and evaluated by the use of strain measurement techniques. The material reaction against the increasing stress can be used to detect critical stress amplitudes where irreversible fatigue damage causes a change in plastic strain amplitude. Therefore, constant amplitude tests (CAT) are used for characterization of fatigue strength at defined stress levels. Further details regarding experimental setup can be found in [20]. The starting stress amplitude for the LIT was set to 30 MPa. During the experiment, the stress amplitude was continuously increased (dσa/dN = 10 MPa/104 cycles) at a test frequency of f = 20 Hz under tension-compression, i.e., fully-reversed loading (stress ratio R = −1). According to Table 2 one specimen of each building orientation was tested for the LIT, while for the CAT two specimens for each building orientation were tested at constant stress amplitudes of σa = 120 MPa and 140 MPa, respectively.

3. Results and Discussion

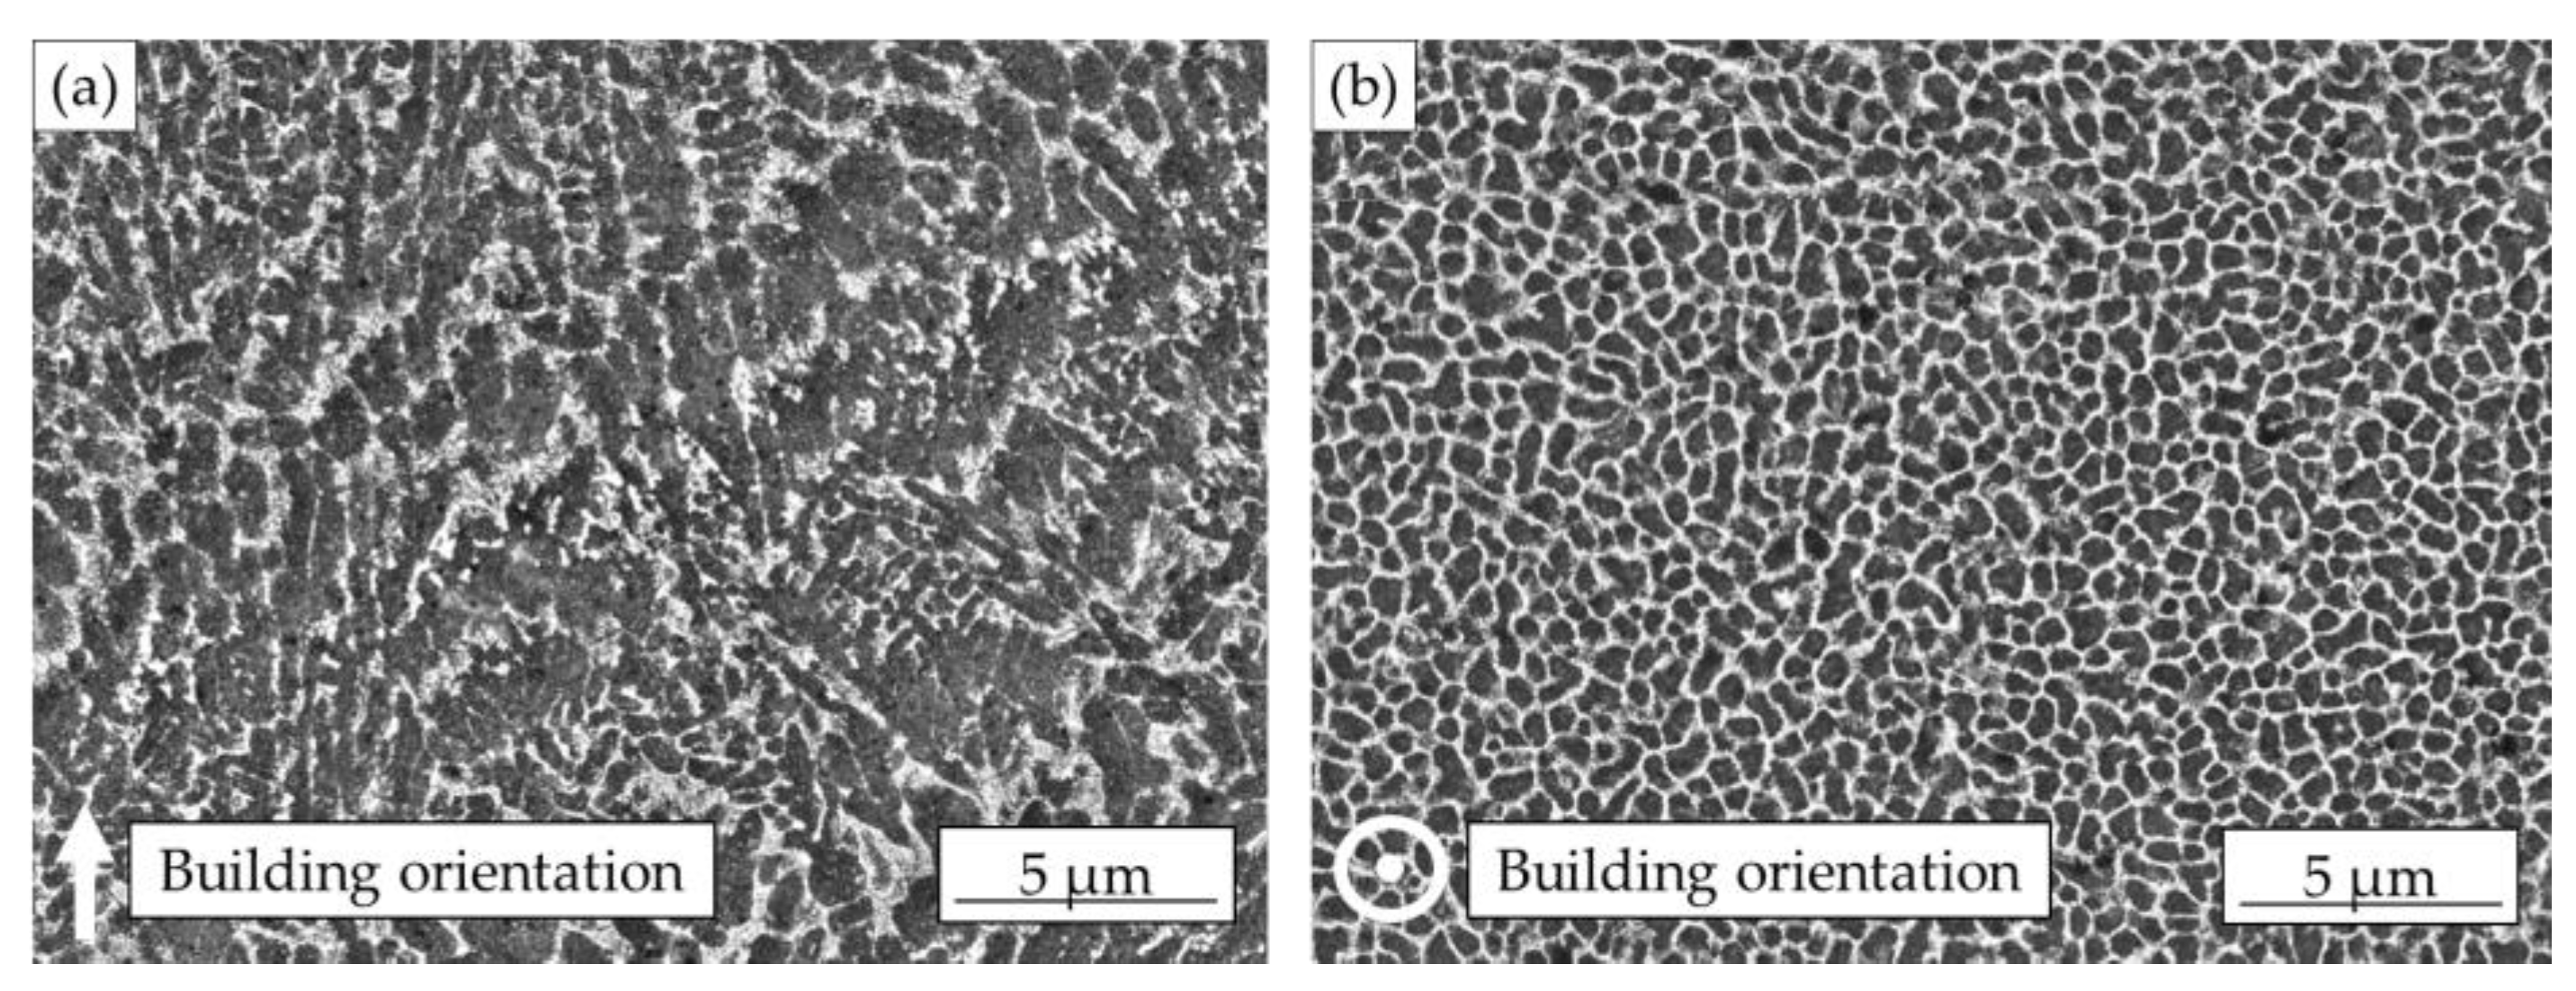
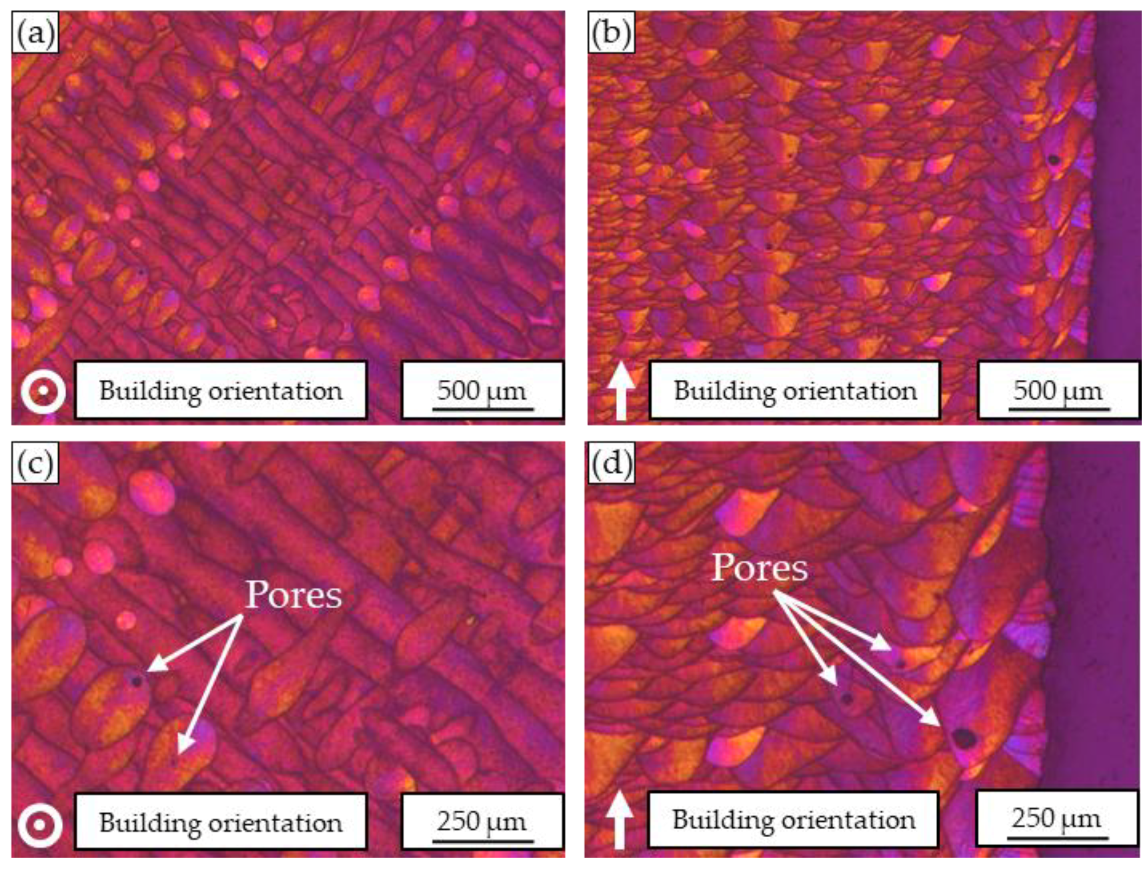
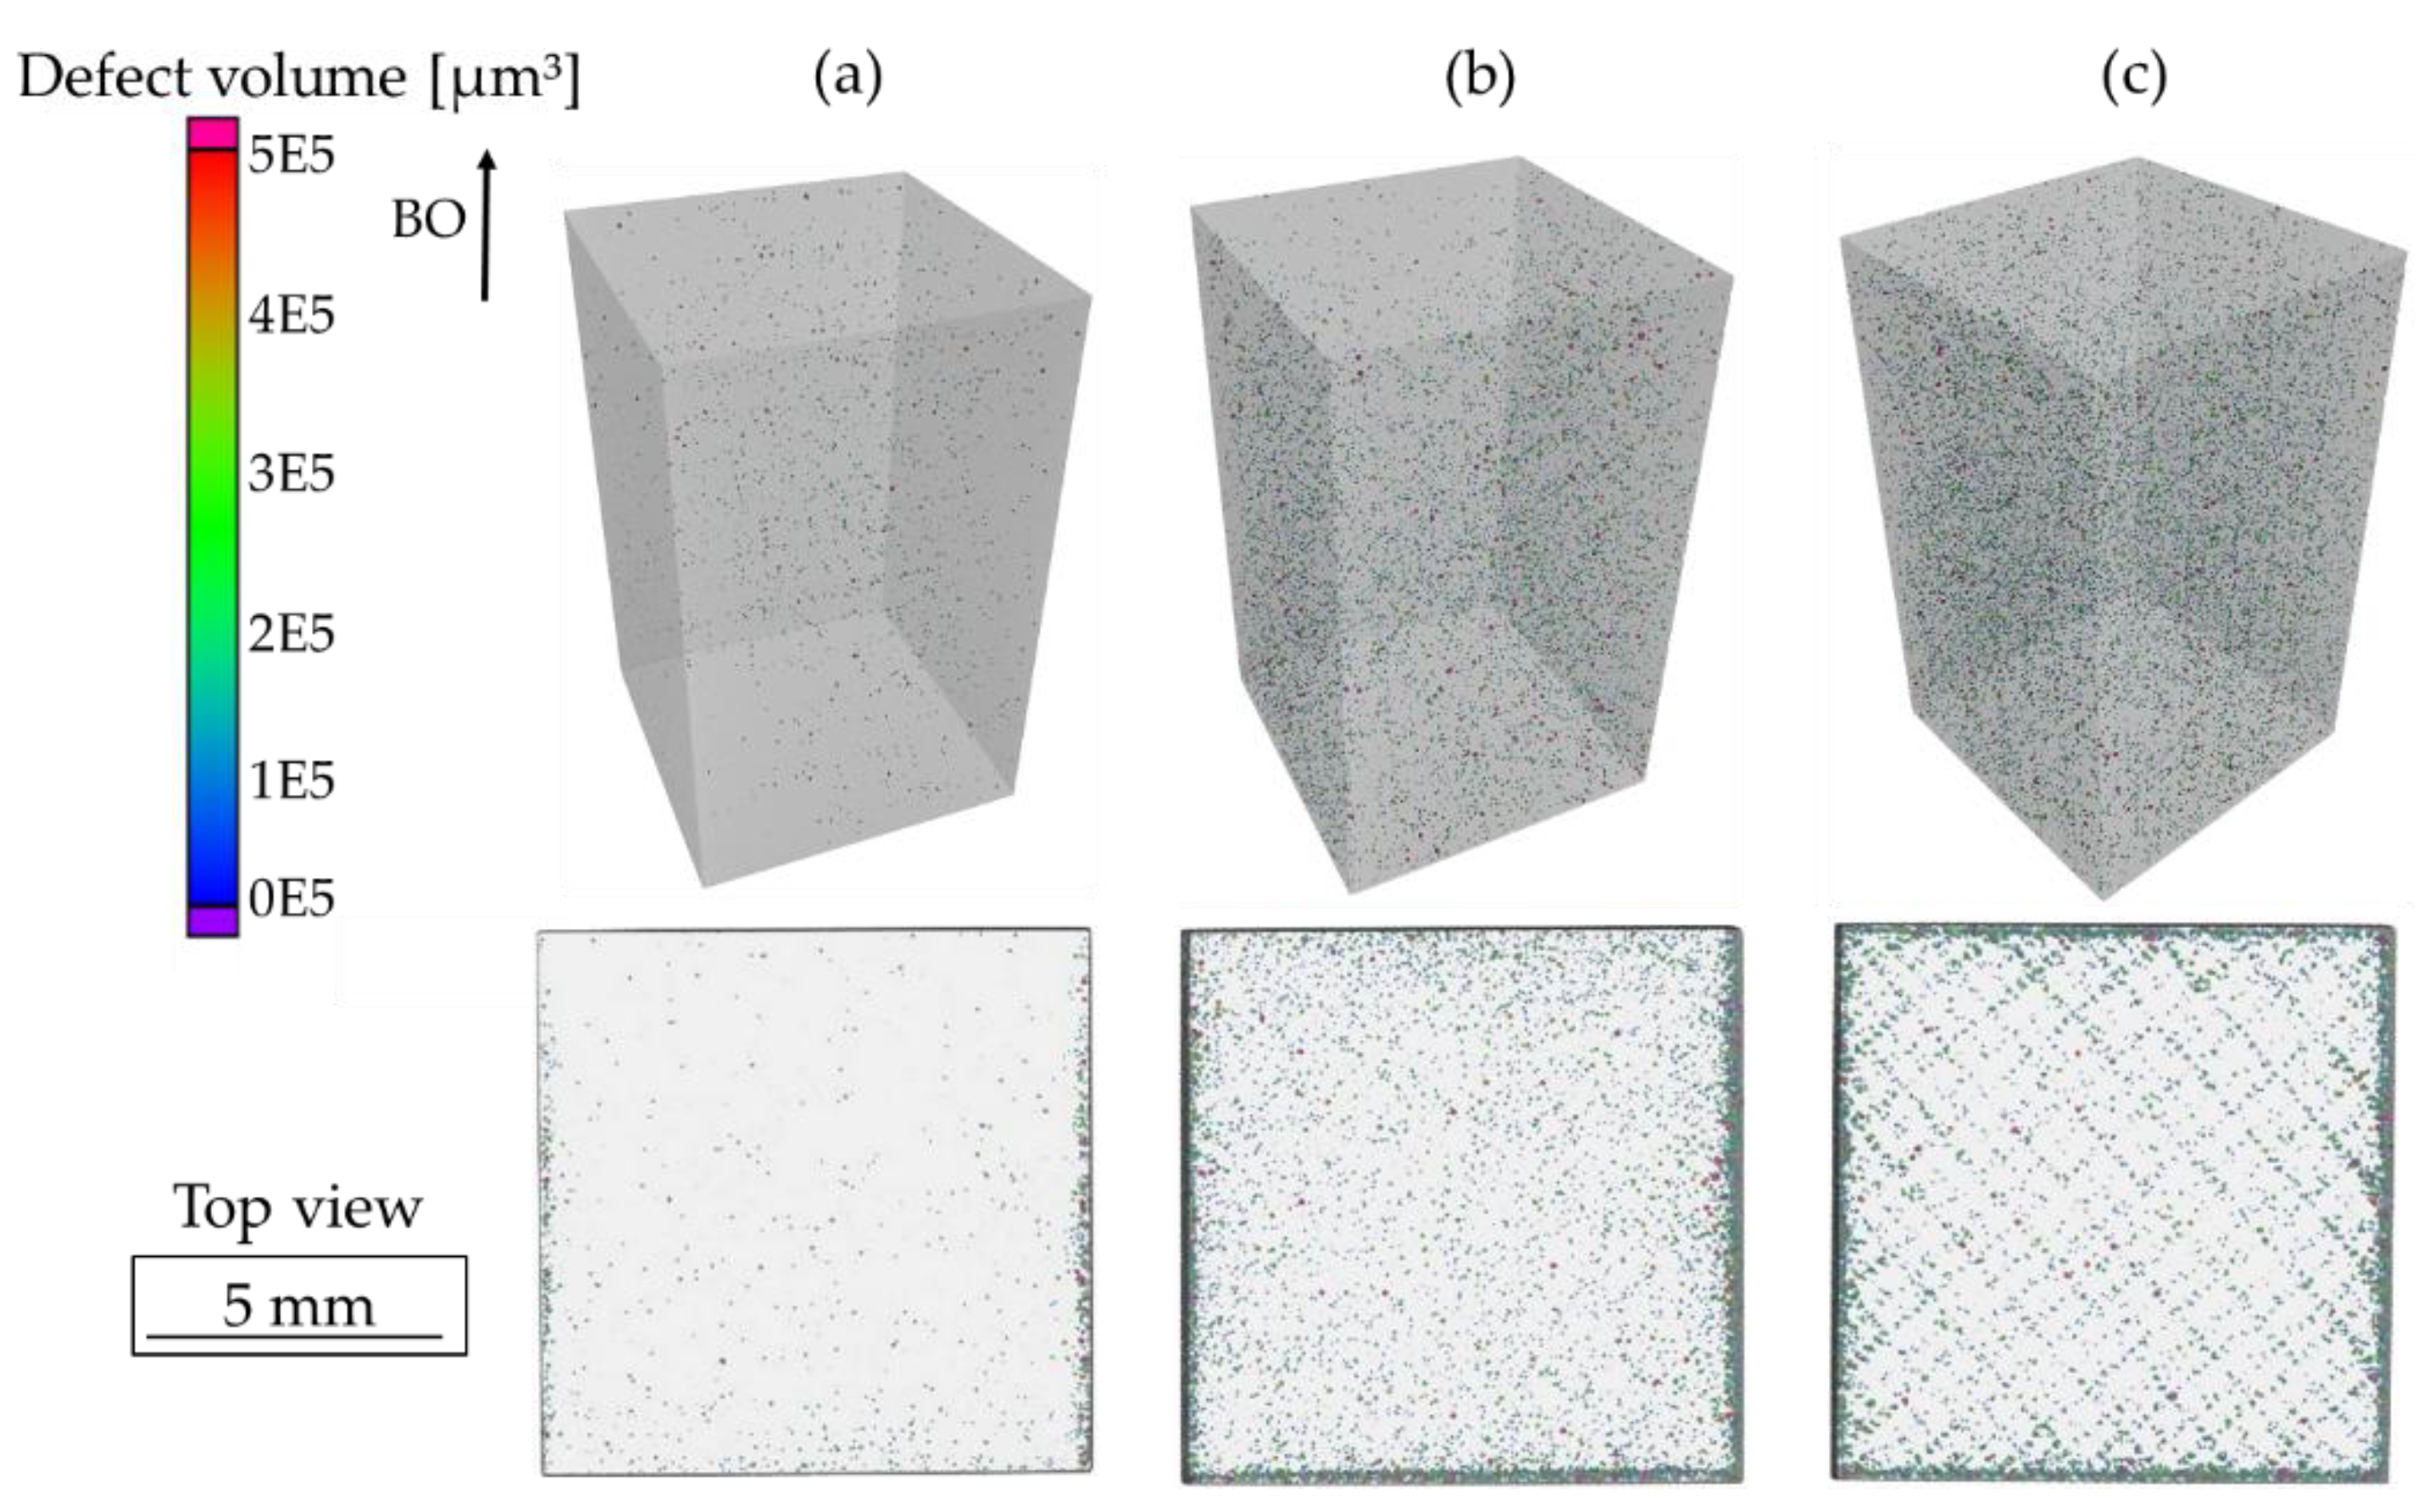
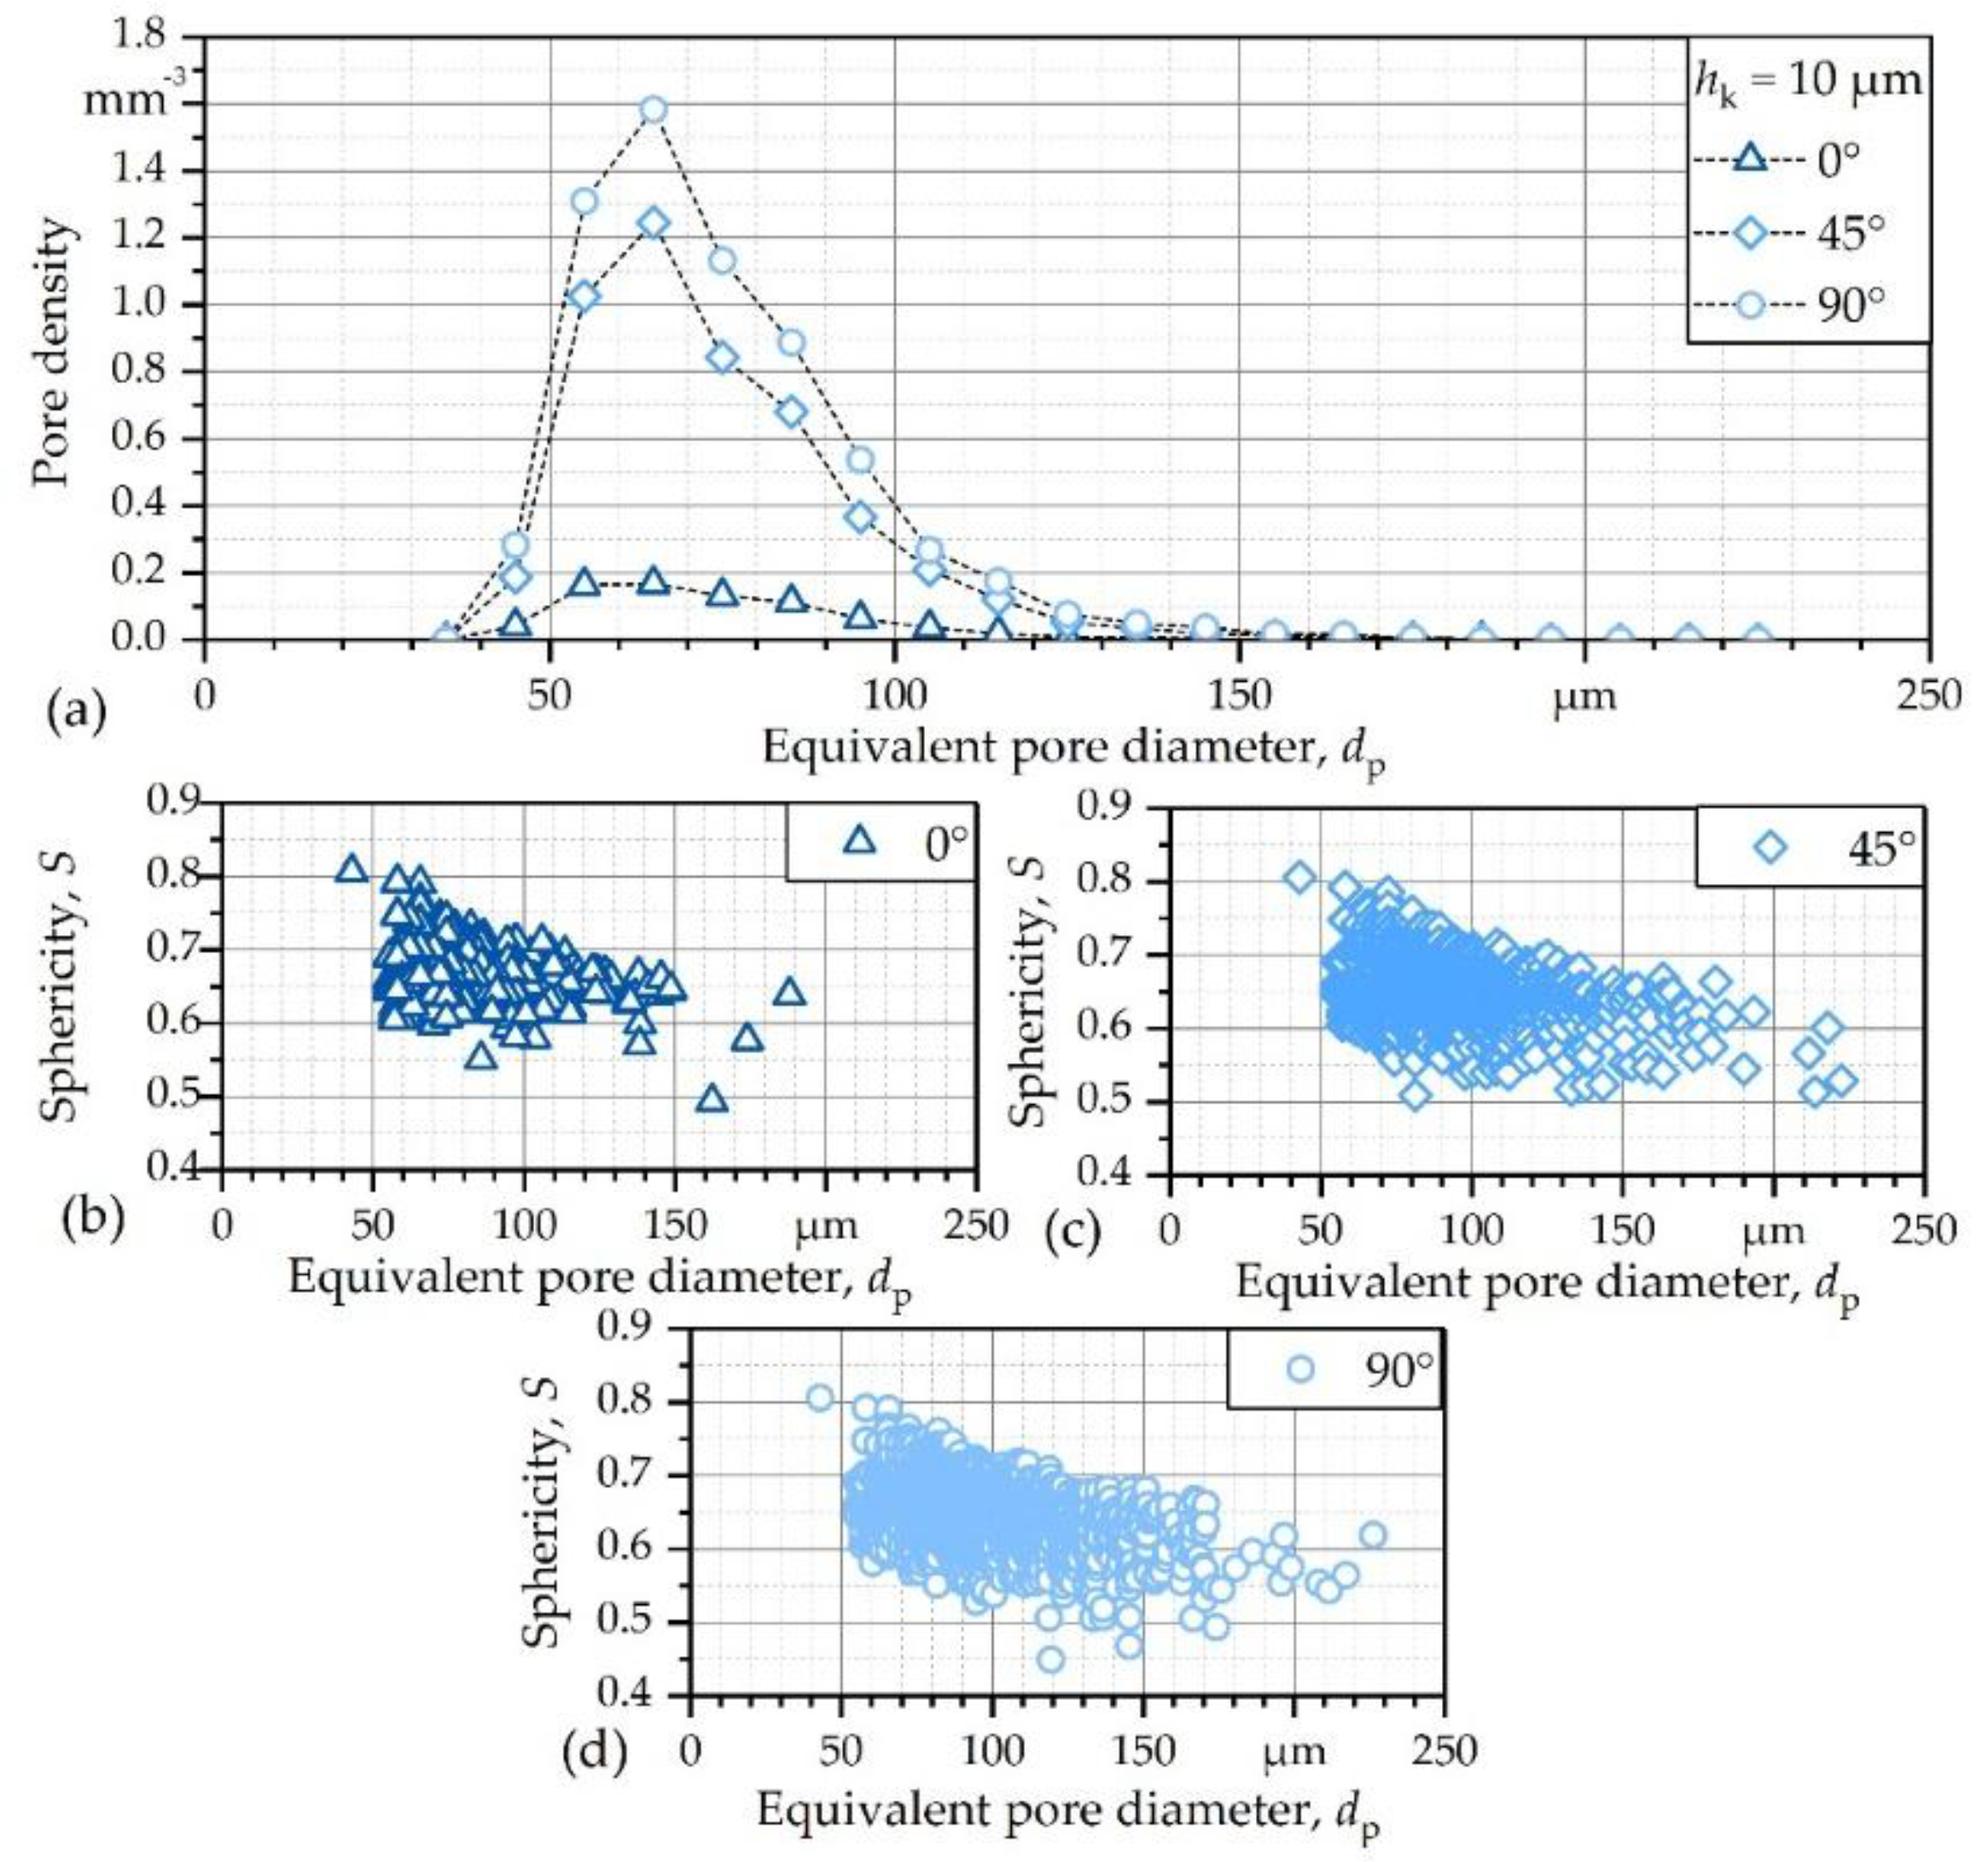
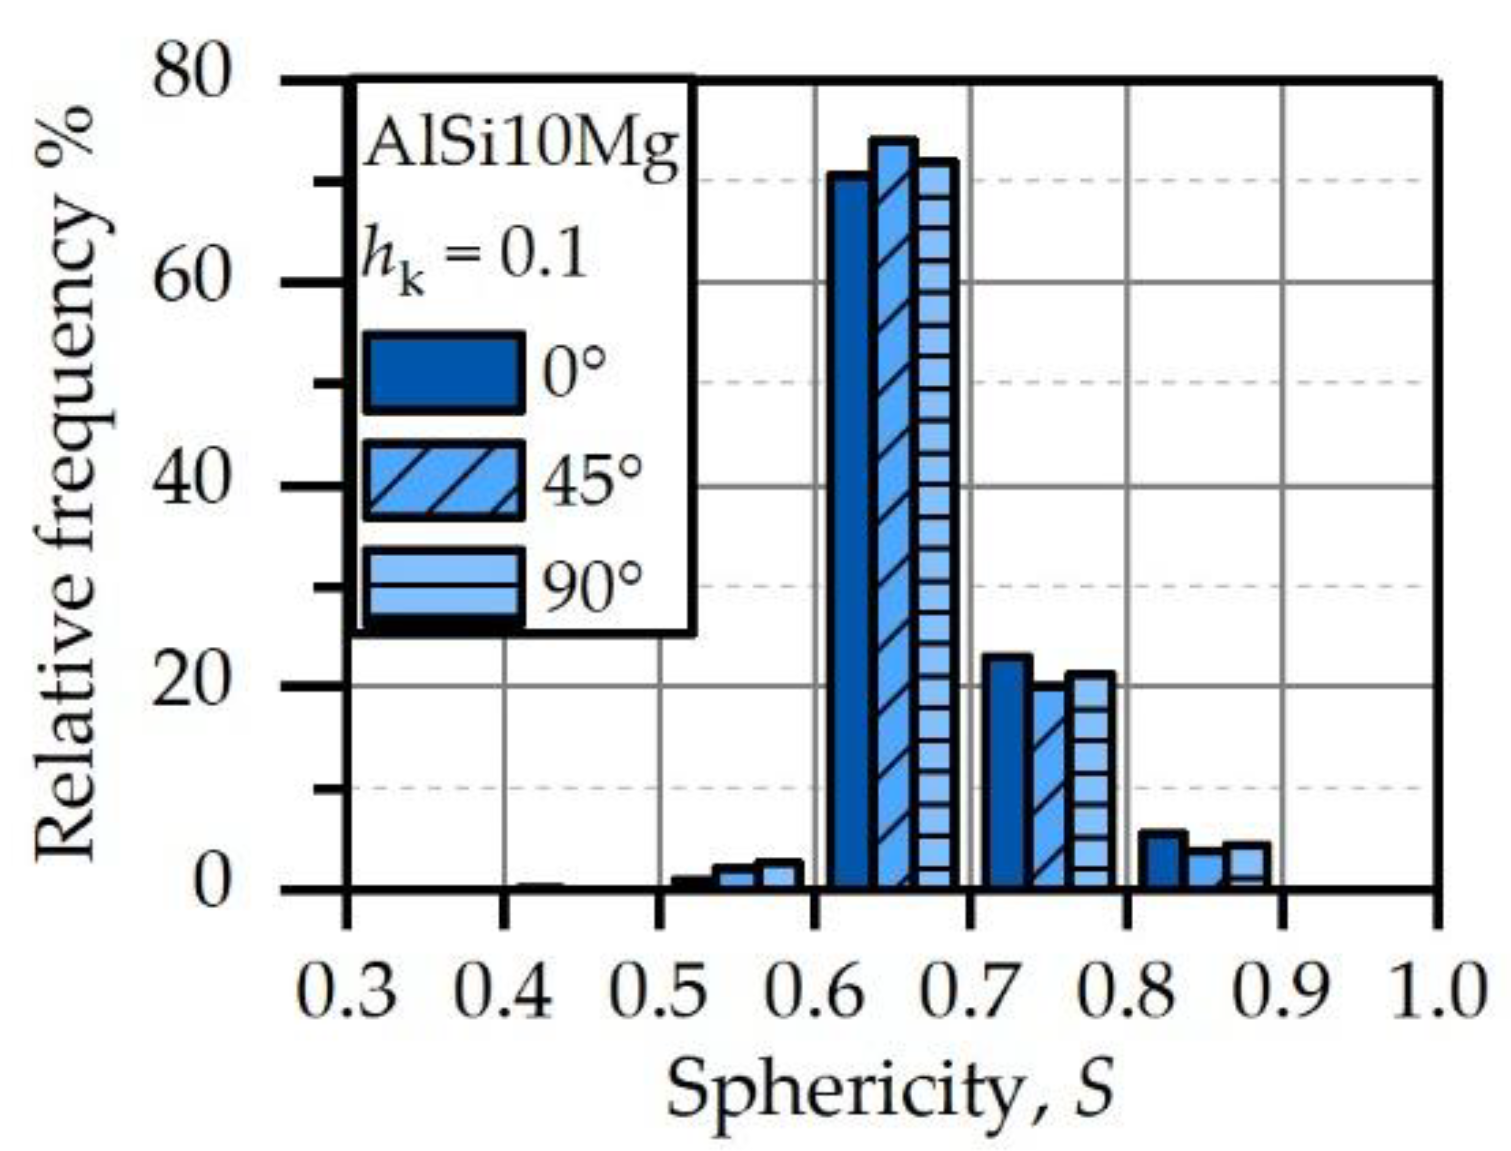
3.1. Microstructure and Porosity

The material microstructure is shown in Figure 2a,b for the 0° building orientation in low magnification light microscopy. The Barker etching allows to clearly identify the different scan tracks caused by the laser, creating a specific pattern.
Thus, it is possible to deduce the applied scan strategy in the form of the so-called island scanning strategy. Additionally, the different melt pools of the powder-based layer-by-layer melting of the laser are clearly recognizable. Figure 2c shows characteristic pores on the boundaries of different islands. In the side view with respect to the building orientation, even some process-induced pores (Figure 2d) are present which are mainly forming in the bottom area of the melt pool. The metallographic results for both of the other orientations are either directly vice versa (0° top/side view are the same as 90° side/top view) or show no real characteristic patterns as the layers are oriented under an angle of 45°. High-magnification SEM images of the raw material reveal the cellular structure of the additively manufactured AlSi10Mg alloy. The microstructure consists of the darker α-aluminum and the brighter eutectic phase. In Figure 3a, the microstructure along the building orientation is shown, presenting a columnar growth of dendrites, according to the results of previous investigations, done by Thijs et al. [30] and Wu et al. [31]. Based on the top view perpendicular to the build platform, as shown in Figure 3b, the average cell size for the different building orientations has been determined. For the 0° and 45° specimen a cell size of around 0.7 µm was measured, whereas the 90° specimen had a cell size of around 0.9 µm. Similar findings have been published by Thijs et al. [30], however, the 90° specimen showed a slightly larger cell size in comparison to the results.
The µ-CT scans of the cuboids reveal the inner defect and pore structure of SLM AlSi10Mg specimens. Based on the building orientation, the amount, location, and size of the pores can differ significantly. The detected pores and their locations can be seen in Figure 4 in the top view.
Based on µ-CT scans, evaluation and visualization of the spatial distribution of process-induced pores were successful. The total analyzed volume for the 0° specimen was around 1170 mm3, for the 45° specimen 1354 mm3 and for the 90° specimen 1458 mm3. The 45° and 90° specimen exhibit a quite large number of pores with maximum defect volumes of more than 106 µm3.
In contrast, the quantity of pores is considerably lower for the 0° specimen, and the maximum defect volume is less than 6 × 105 µm3, i.e., the defect size is slightly smaller compared to the 45° and 90° specimens. These results are also reflected in the relative density, which was found to be 99.92% for the 90° specimen, 99.94% for the 45° specimen, and higher than 99.99% for the 0° specimen. Slightly lower relative densities (99.82%) have been obtained by Aboulkhair et al. [13], using a multiple scan strategy with optimized process parameters. Concerning the used scanning strategy, even in the top view perpendicular to the building orientation (Figure 4), process-related characteristics can be determined. On the basis of the alignment of the pores, the used scanning strategy is clearly visible. Several pores of single areas are equiaxially oriented and show clearly the island scanning strategy, where single quadratic areas in one layer are melted successively. It can also be seen that a high number of pores are located in the border area of the 90° specimen. This correlates with the investigations carried out by Kempen et al. [28], showing an increased borderline porosity in upright oriented tensile samples, caused by the beginning and end of a scan vector.
Figure 5a shows the pore density, i.e., the normalized number of pores per volume element in mm3, plotted versus the equivalent pore diameter dp. The diagram reveals the substantially higher pore density of the 45° and 90° specimens, which reaches its maximum pore density of 1.2 mm−3 (45°) and 1.6 mm−3 (90°) at pore diameters of 60 µm ≤ dp < 70 µm. For larger pore diameters the density decreases and only a few defects with a diameter bigger than 200 µm were present in the material. However, the pore density of the 0° specimen never exceeds a value of 0.2 mm−3, and no defect larger than 130 µm was detected. The sphericity of the defects is shown in Figure 5b–d and plotted against the equivalent pore diameter dp. The 0° specimen has in comparison to the 45° and 90° specimen the lowest total number of pores. It is evident, that the relatively small defects of the 0° specimen all exhibit a sphericity higher than 0.5, i.e., a relatively round, spherical shape. The same holds true for the majority of defects of the 45° and 90° specimen, although the total number of pores is higher. For all the specimens, it can be seen that sphericity decreases with increasing equivalent pore diameter. However, the total number of pores for the three building orientations is different, whereas the relative frequency of sphericity for all the three specimens is nearly the same, as shown in Figure 6. Only the 45° and 90° specimens have a small percentage of pores with a sphericity smaller than 0.5.

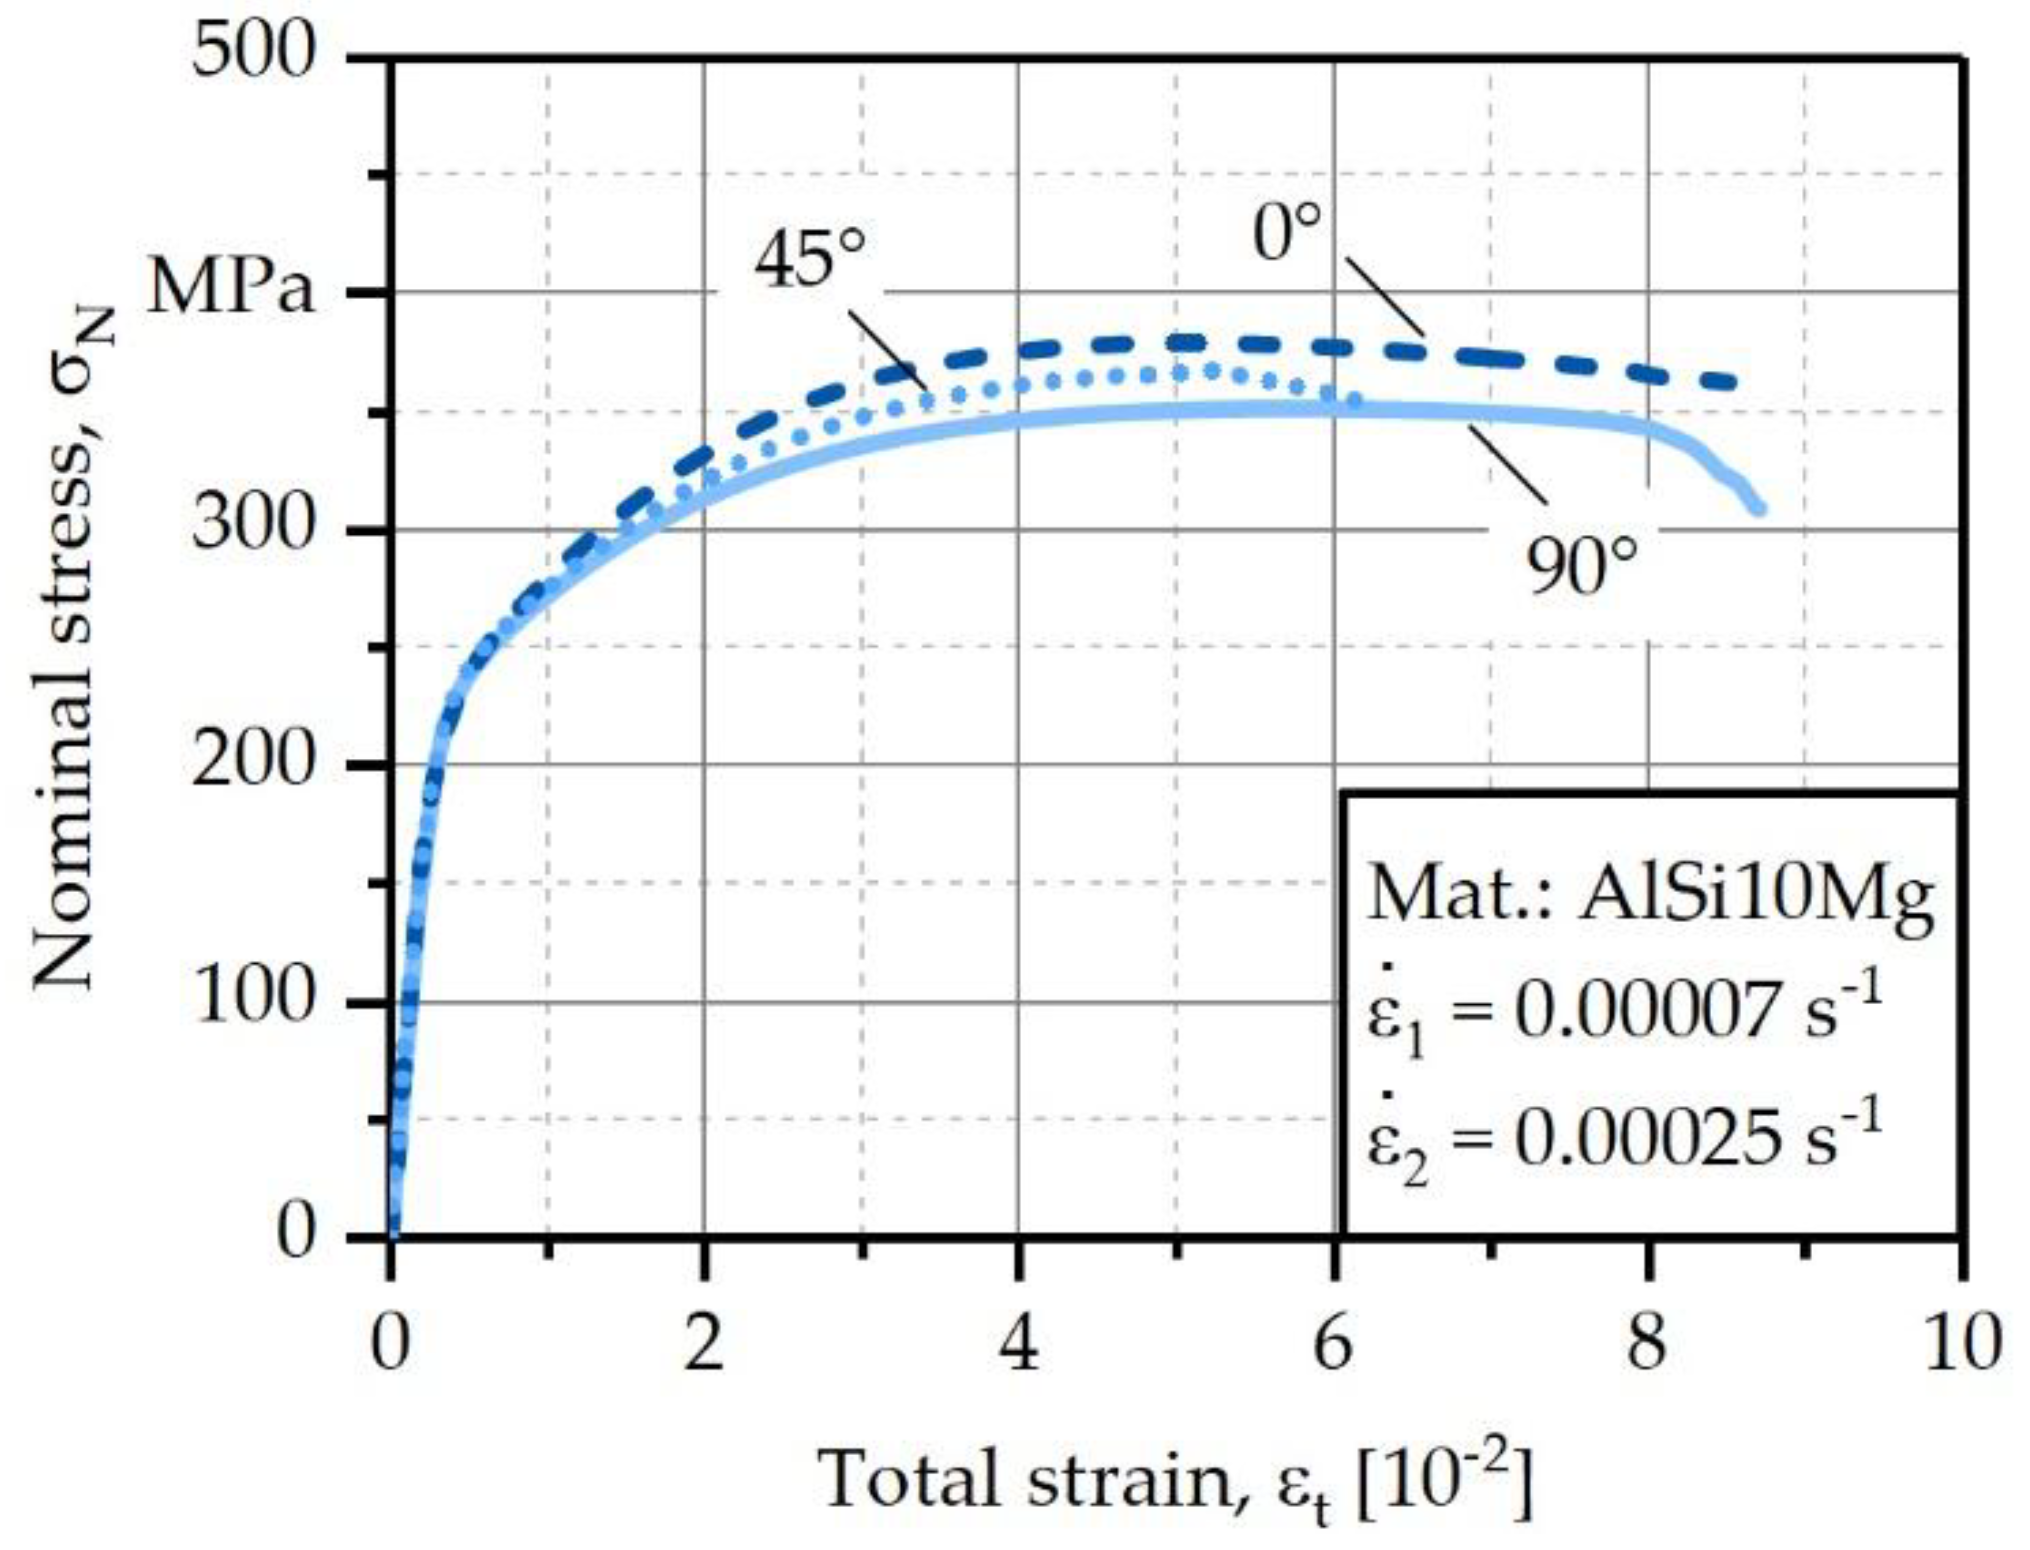
3.2. Quasi-Static Properties

The obtained test results are depicted in Figure 7. The yield strength σy, ultimate tensile strength UTS and fracture strain εf can be found in Table 3.
As can be seen, the quasi-static behavior in terms of UTS and σy differs slightly depending on the building orientation, whilst the fracture strain of the investigated orientations displays higher differences.
The aforementioned values for ultimate tensile strength correlate with the results for cell size and porosity, implicating that finer microstructure combined with small overall porosity leads to higher mechanical strength. However, current results show slightly lower mechanical strength in comparison to the investigations done by Read et al. [18] and Kempen et al. [28].

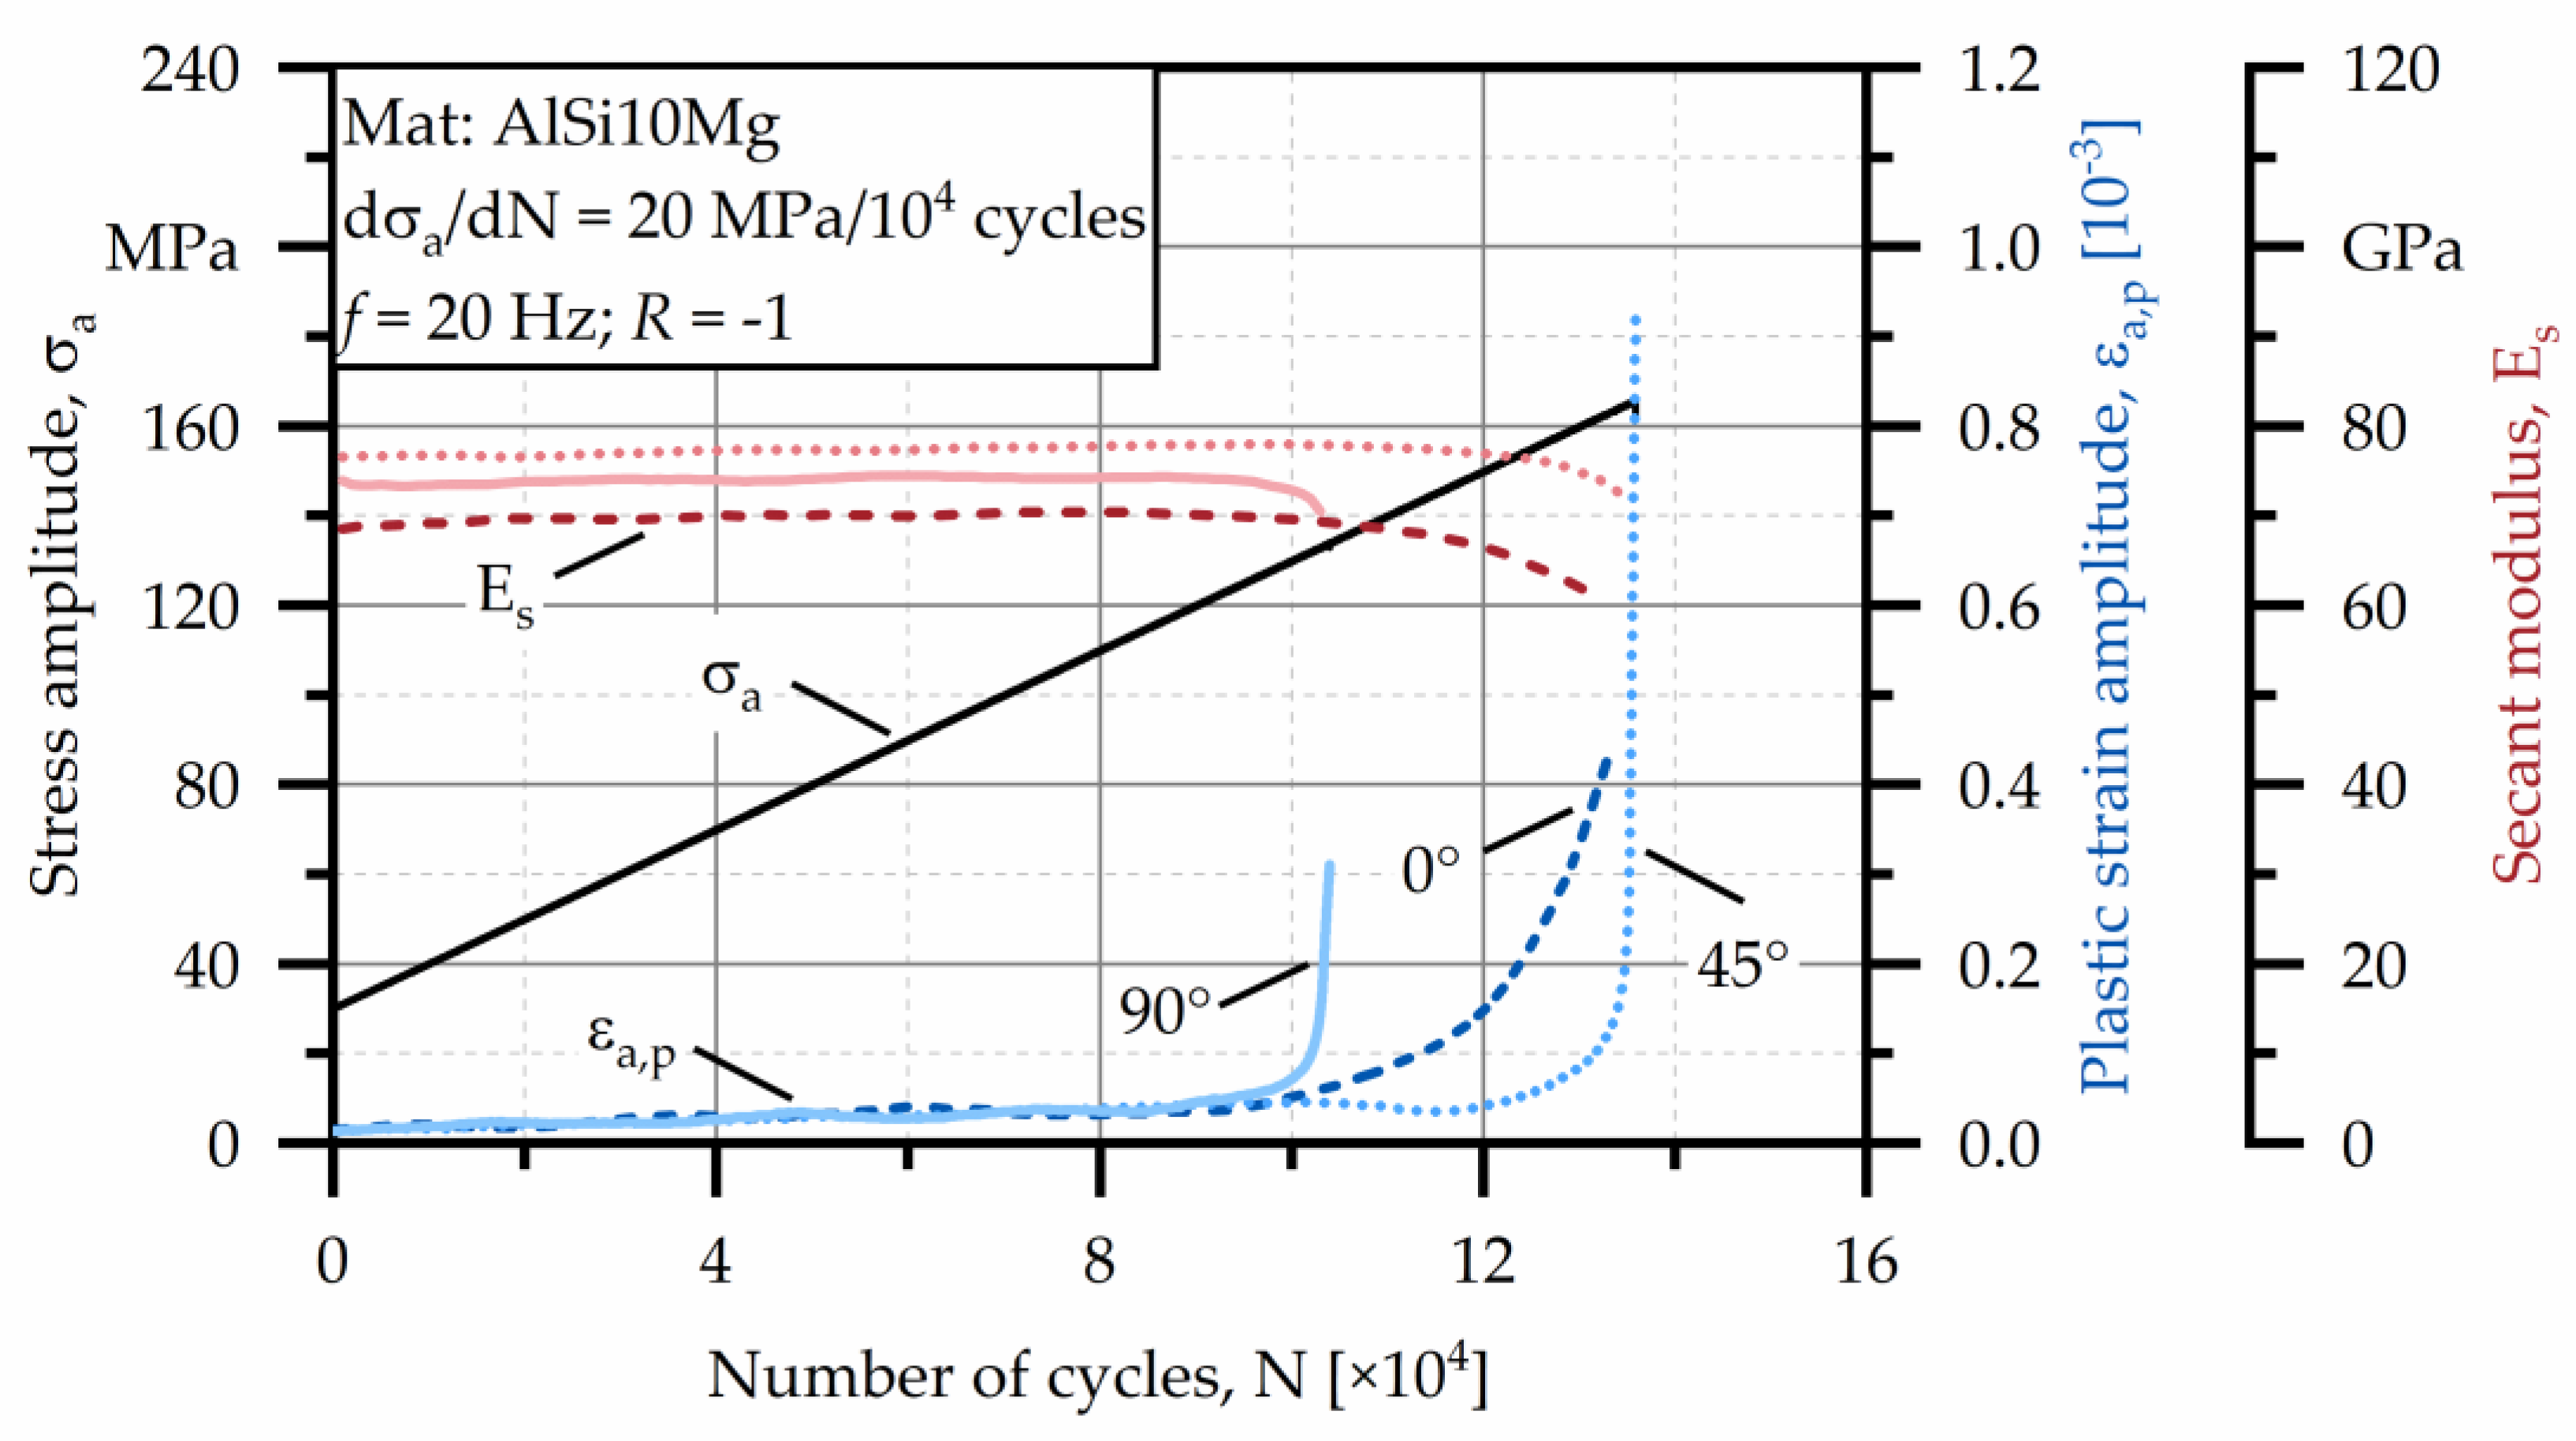
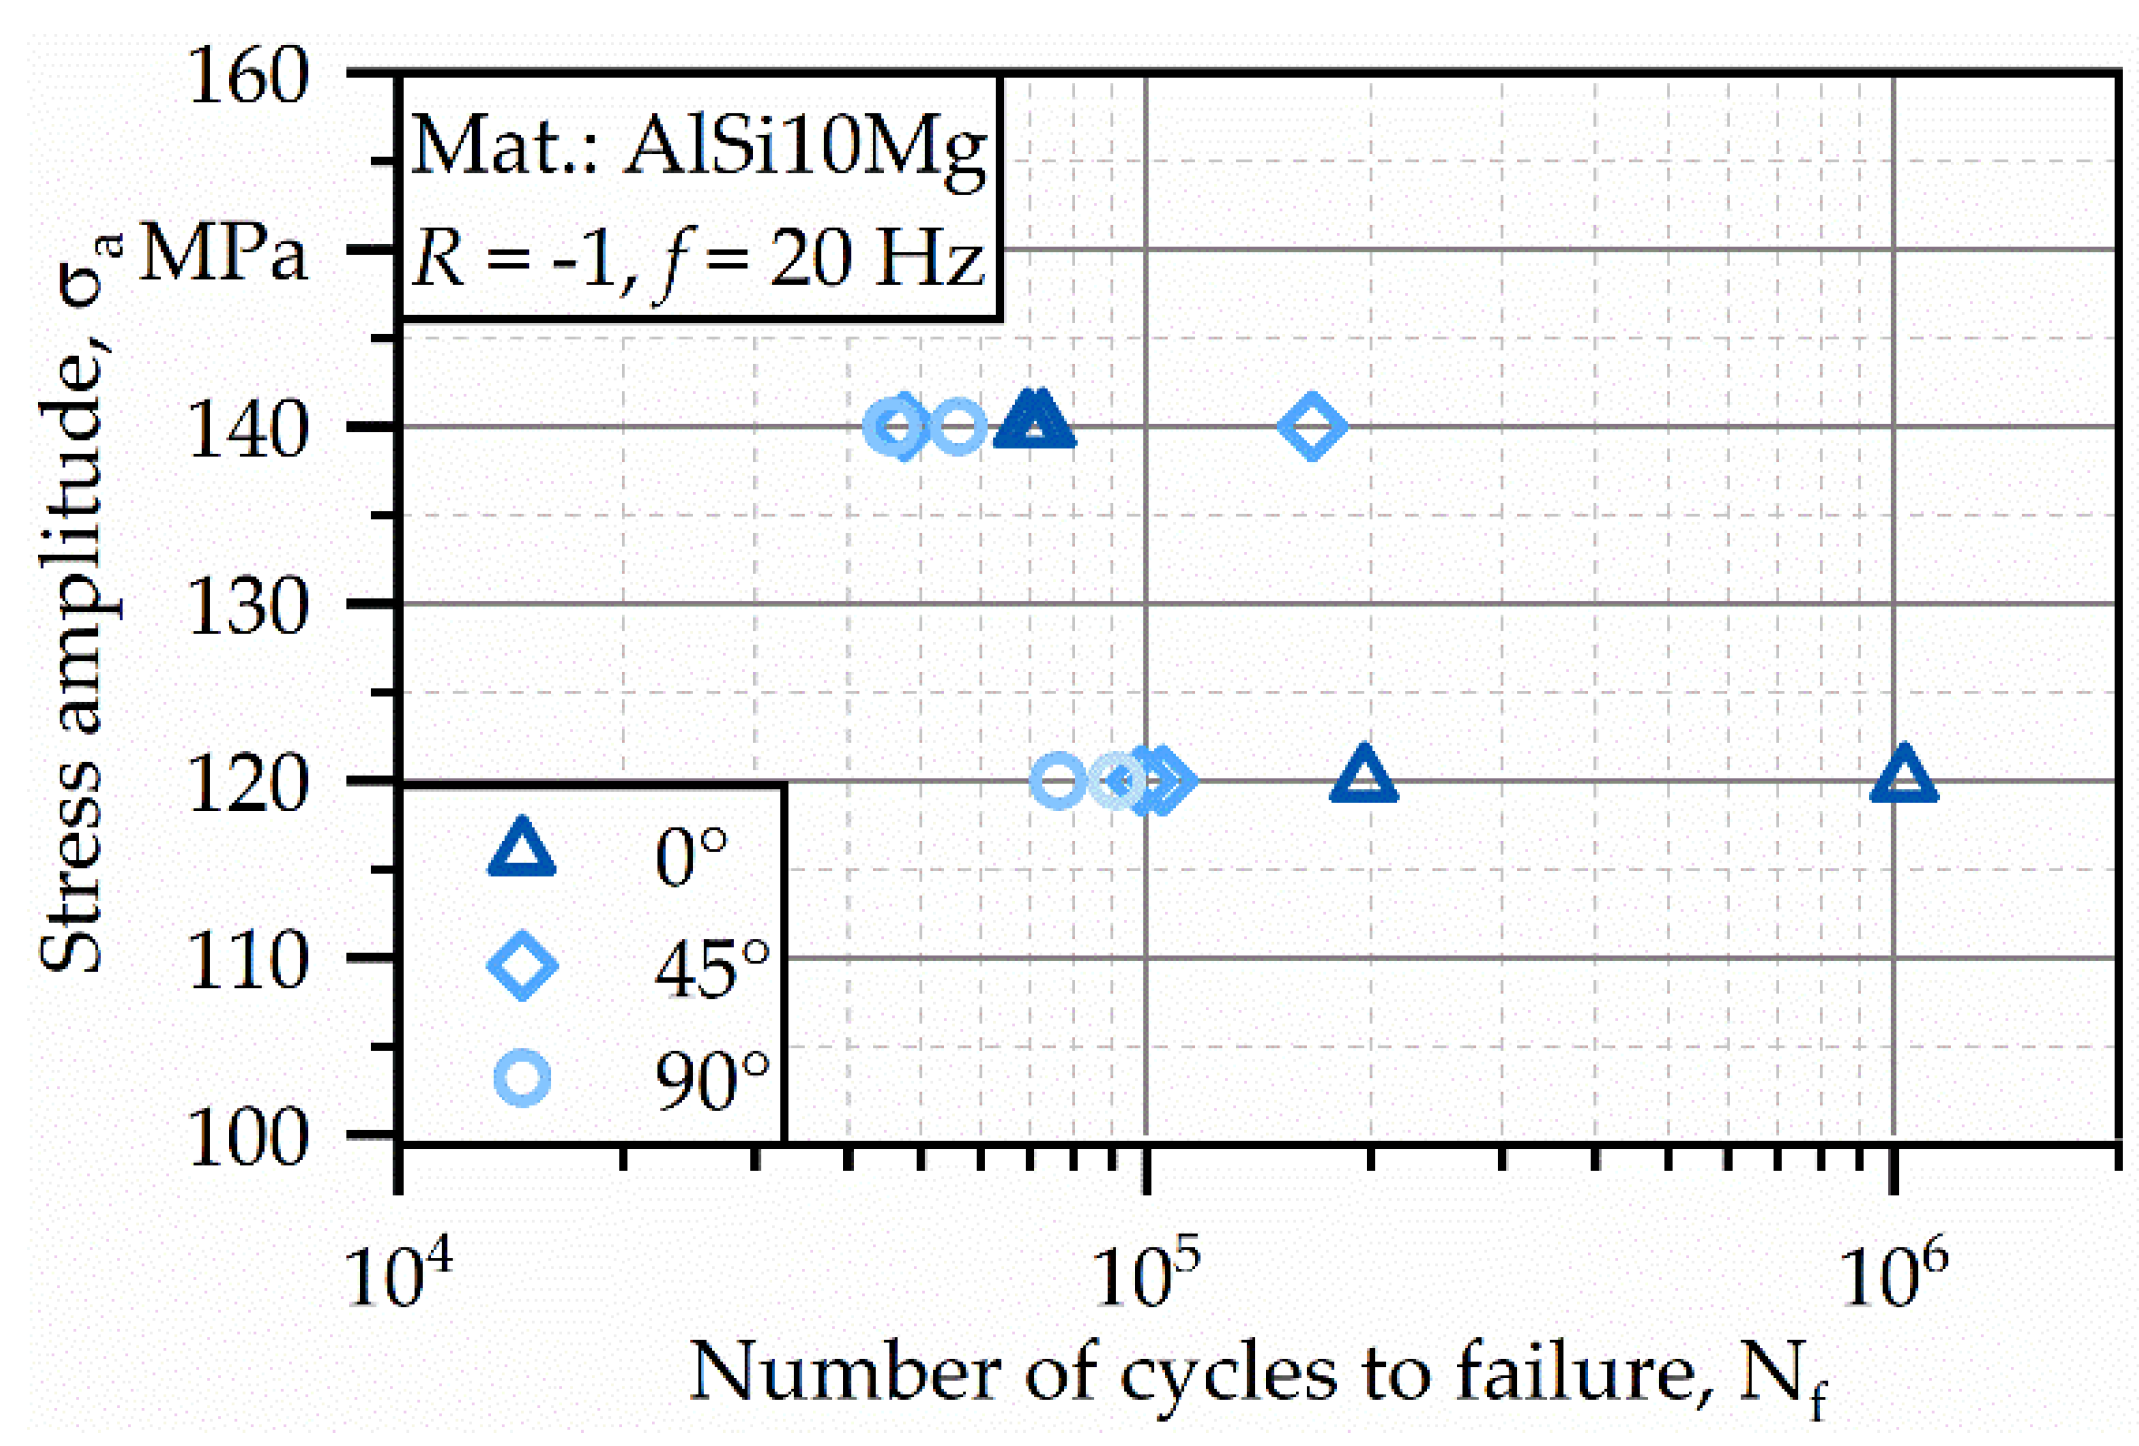
3.3. Fatigue Behavior

To achieve the first estimation of fatigue properties for the three building orientations, LIT was performed. Additionally to the σa-N-curves, εa,p-N- and Es-N-curves were obtained. The points of onset of change of the measured material reactions from a linear to a non-linear (exponential) increase are selected as the stress amplitudes σa in the constant amplitude testing. As depicted in Figure 8, the change in the material reaction can be seen in the plastic strain amplitude εa,p as well as in the secant modulus Es of the σ-ε-recorded hysteresis. Two different stress amplitudes were identified in which an increase of plastic strain amplitude and a decrease in secant modulus can be found. For the vertical and horizontal specimen, this stress amplitude is almost the same (115 MPa for 90°-specimen and 120 MPa for 0°-specimen). The specimen that was built under 45° first showed a change in plastic strain amplitude at approx. 140 MPa. Similar behavior can be found in the change of the secant modulus of the stress-strain hysteresis, which is starting to decrease from a comparable stress amplitude. Although the 0°-specimen exhibits a lower stress amplitude for the first material reaction, the number of cycles until failure Nf and the corresponding stress amplitude are almost the same as for the 45°-specimen which can also be seen in the slower increase of plastic strain amplitude compared to 45°- and also 90°-specimen. Similar findings for 0° and 45° specimens were reported for 316L SS by Fergani et al. [32].
For every building orientation constant amplitude tests were performed at the stress amplitudes of 120 and 140 MPa based on the results in the load increase tests. The results can be found in Figure 9. Although it was expected that 45°-specimens show the best fatigue behavior not only on 120 MPa but also on 140 MPa, the 0°-specimen had the highest number of cycles until failure (lifetime) Nf at the lower stress amplitude of 120 MPa. The CAT for 45°-specimens at 140 MPa showed high scatter and, overall, only had a slightly better fatigue life than the 90° specimen at both stress amplitudes.
The weaker fatigue behavior of the 90° specimen can be explained by two complementary mechanisms: the first one is the effect of defects and the resulting stress concentration by the notch effect [21]. As the 90° and 45° specimens have a higher pore density this effect decreases fatigue life in CAT at the tested stress levels, although higher fatigue life was expected for the 45° specimens with regard to the results of LIT. The other mechanism is a possible weak bonding between layers, which was reported for 90° specimens made of 316L SS by Suryawanshi et al. [33]. Since these layers are perpendicular to the load direction for the 90° specimens and the resistance against crack growth along these layers is decreased, the fatigue life is reduced at the same time. Brandl et al. [22] investigated similar fatigue behavior with regard to the building orientation with the 0° orientation having better fatigue behavior compared to 45° and 90° specimens. They stated that anisotropic behavior under cyclic loading can be reduced by using a heated build platform and T6-heat treating.

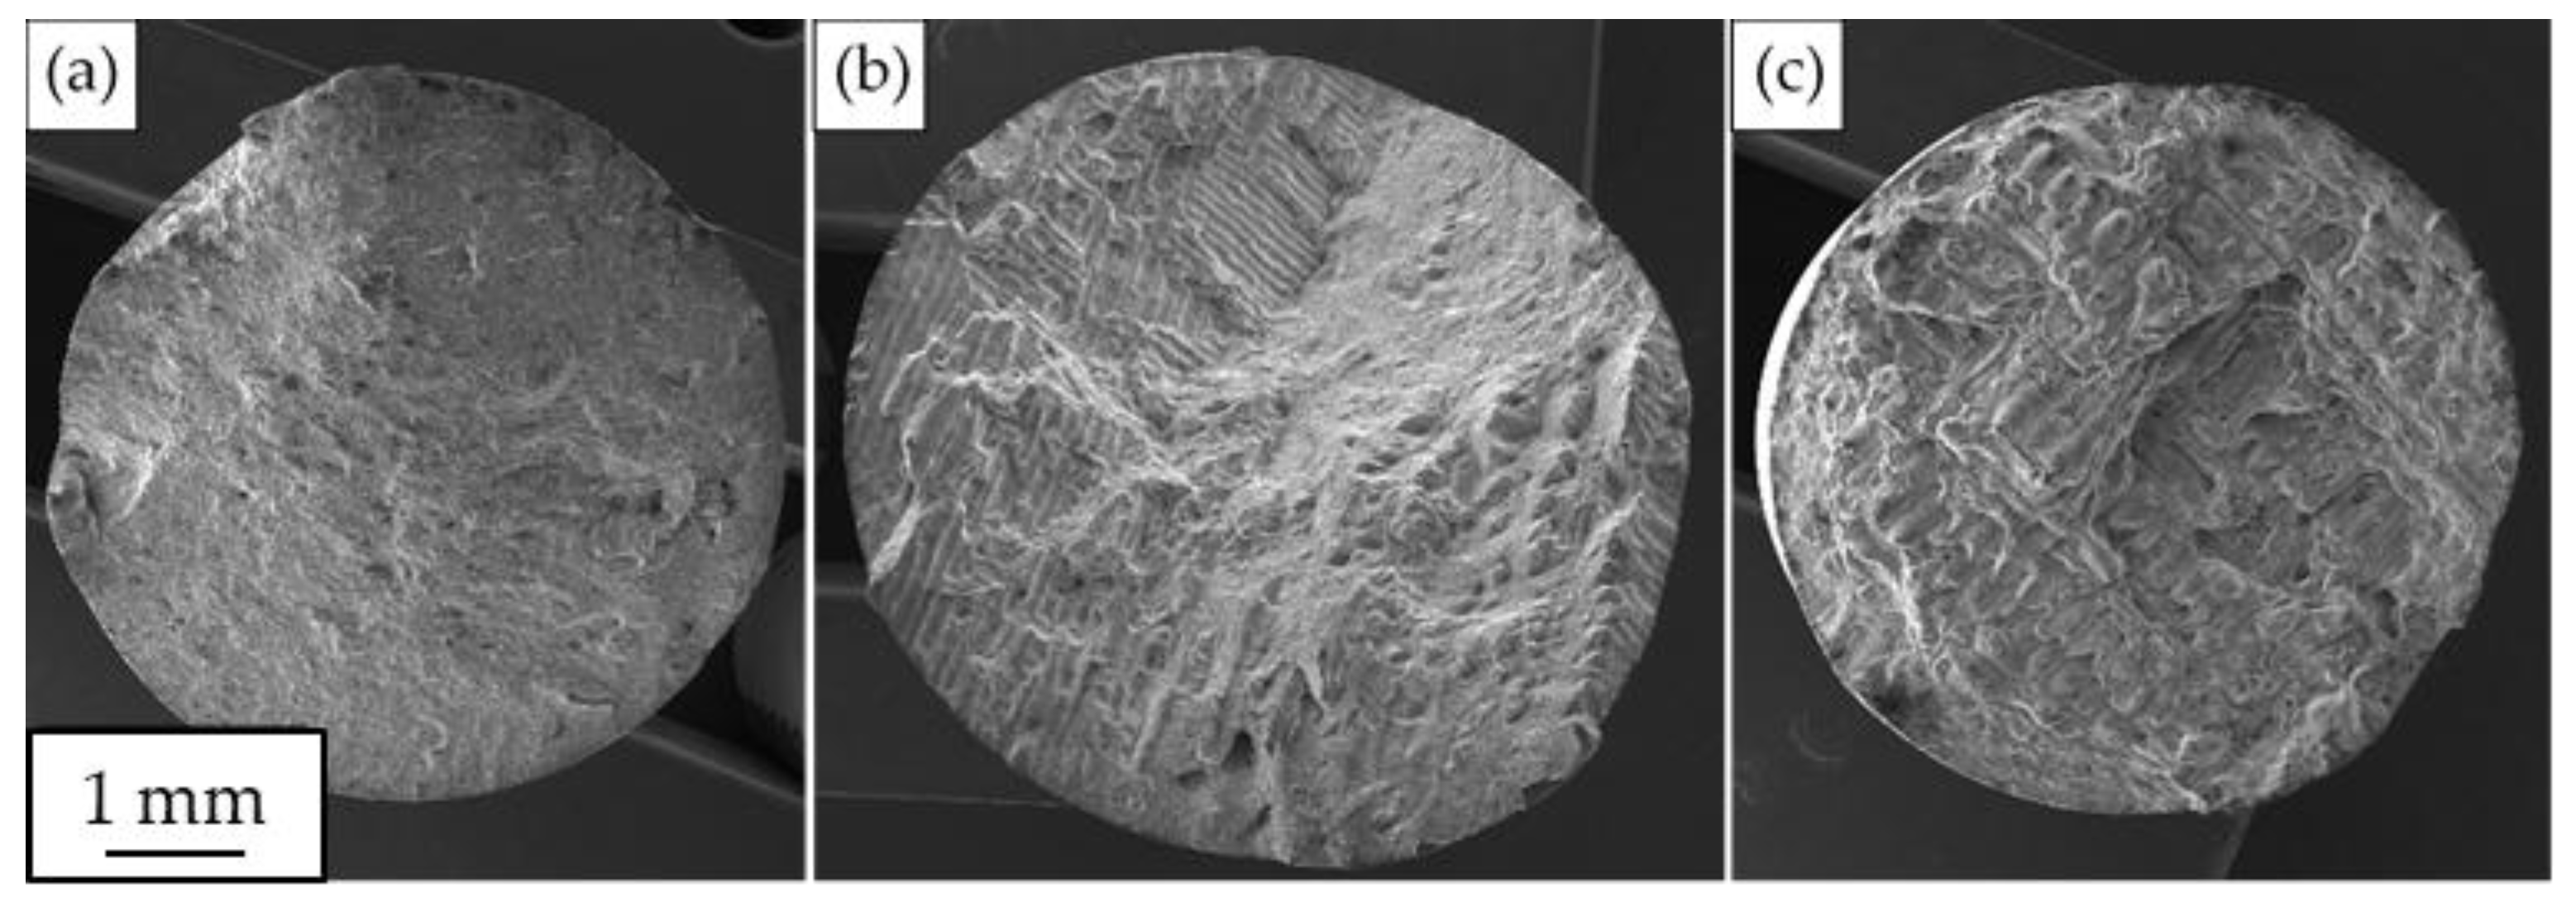
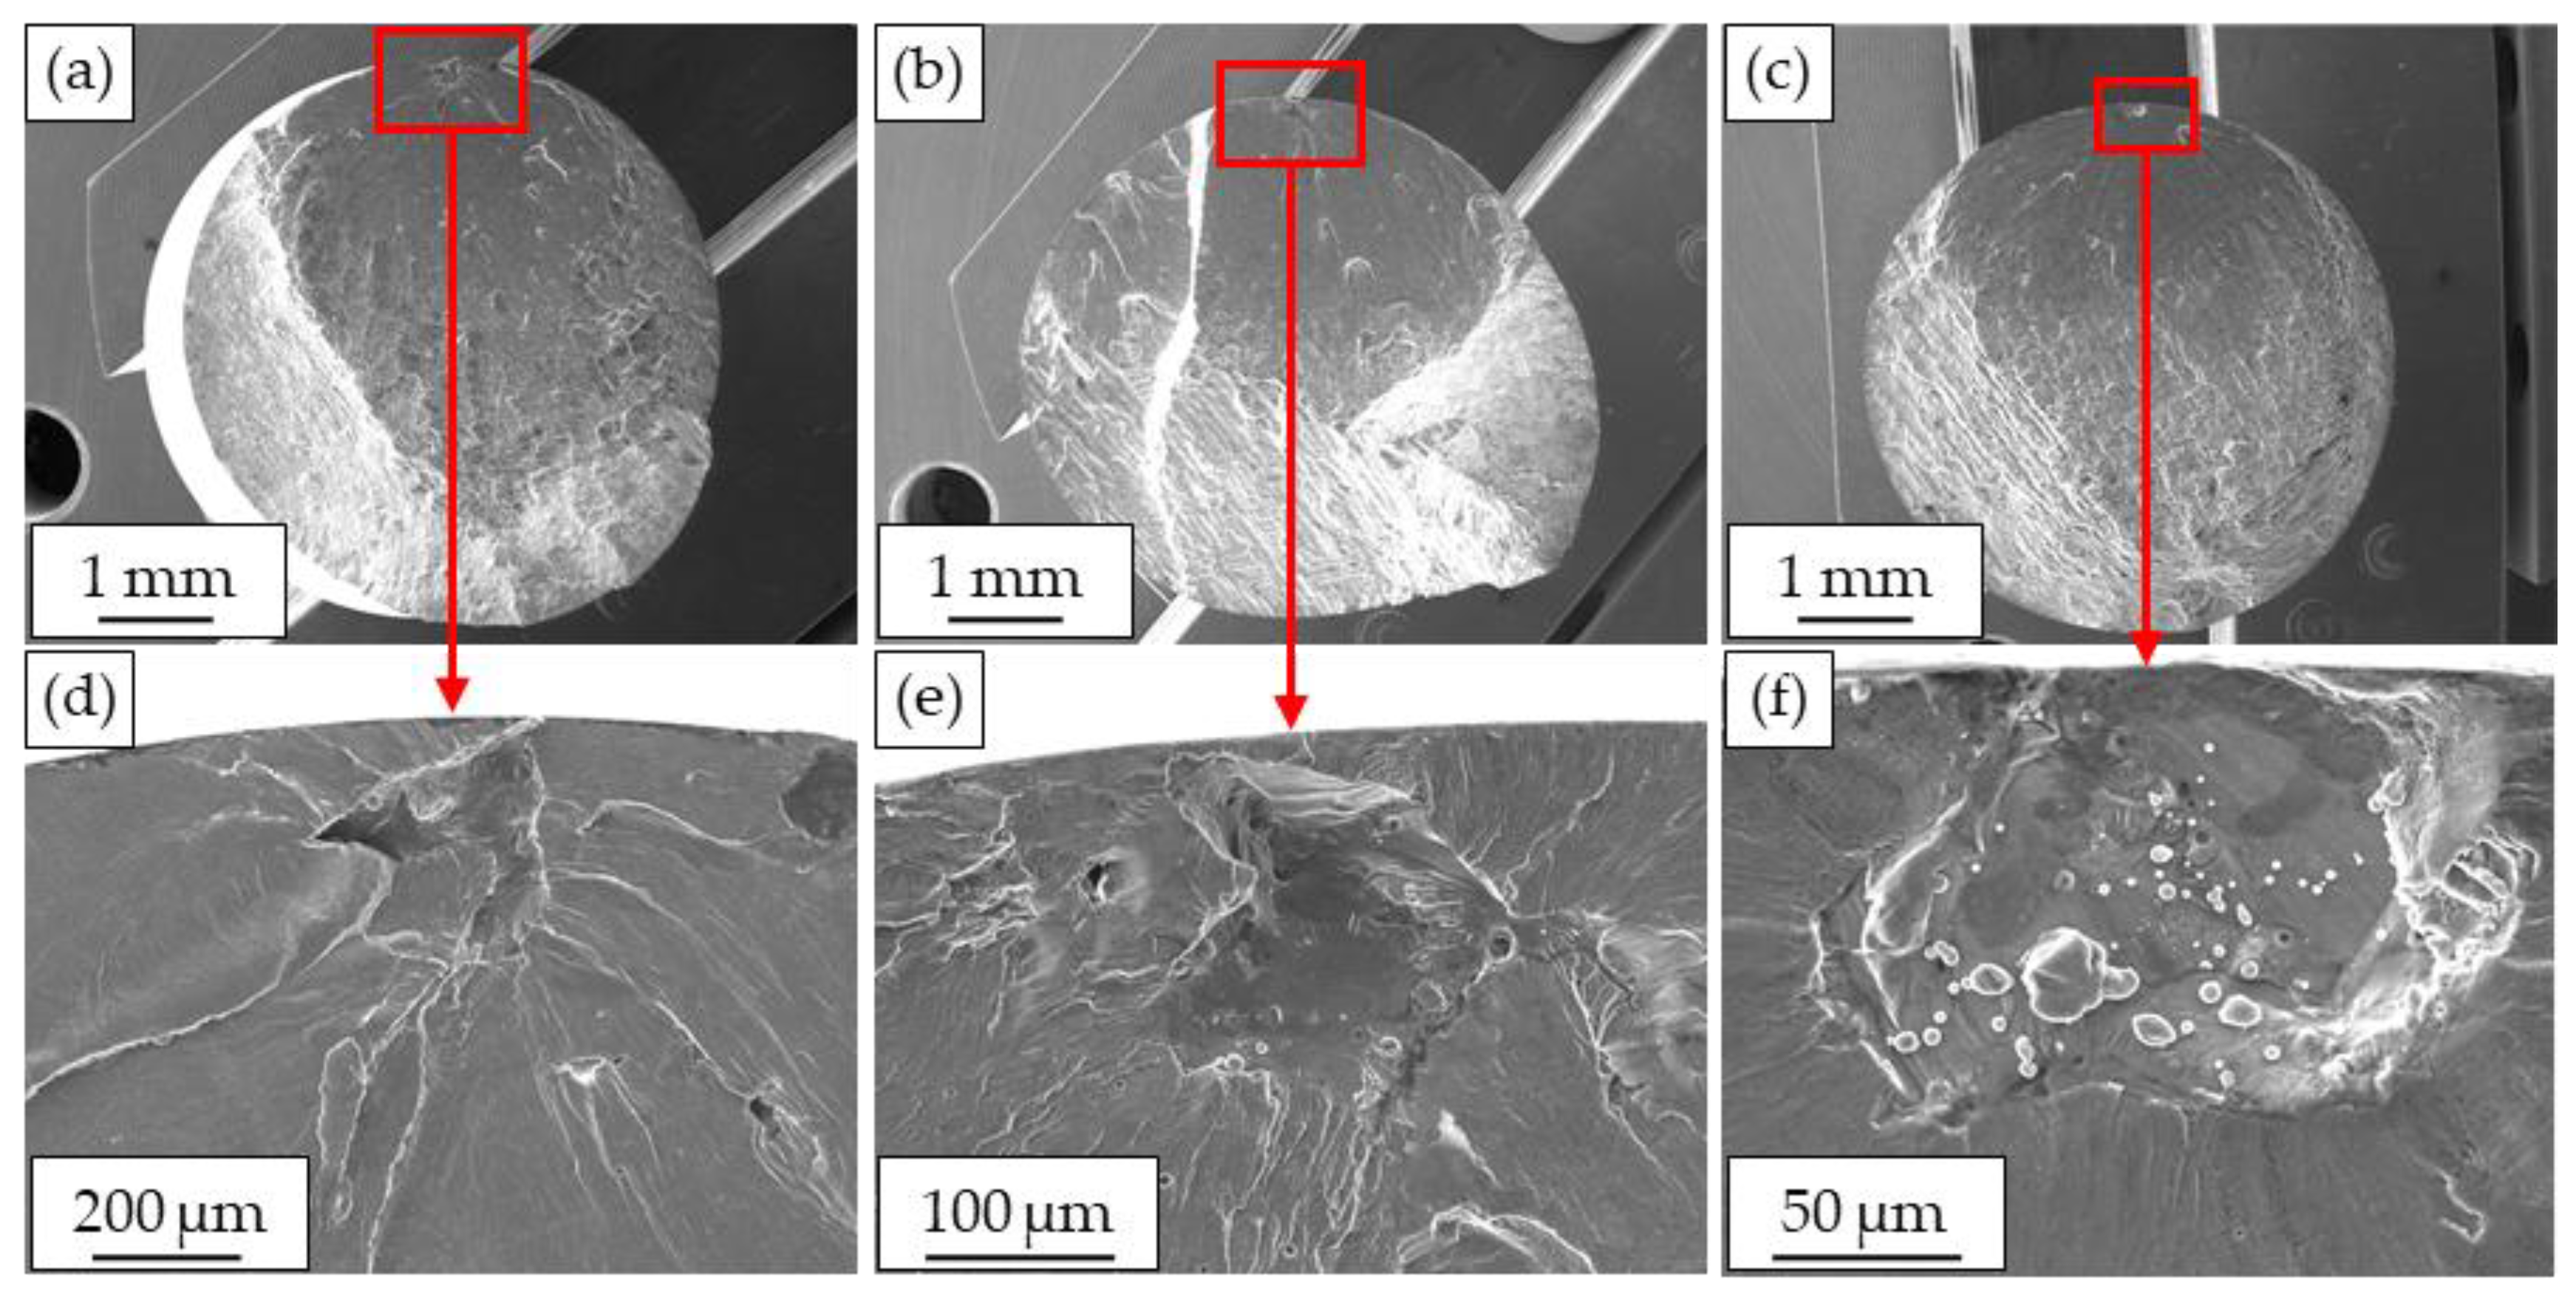
3.4. Fractographic Analysis after Tensile and Fatigue Tests

The different building orientations of the additively manufactured AlSi10Mg specimens have a clearly visible influence not only on the mechanical behavior, but also on the fractured surface of the tested tensile and fatigue specimens. As can be seen in Figure 10, mainly the 45°- and the 90°-specimens show a process- and manufacturing-related surface. The 0°-specimen, where the layers of the manufacturing process are parallel aligned along the loading direction, only shows a relatively smooth surface. However, the 45°- and 90°-specimens fracture surfaces have clearly identifiable laser scan tracks. These scan tracks correspond to the different layers of the processed powder. The fracture under quasi-static load grows for these building orientations along those layers and, in some areas, perpendicular to the single layers, which can be an explanation for the higher fracture strain compared to the literature [28]. By that, it is possible to explain the lower fracture strain of the 45°-specimens, as the maximum shear stress occurs under 45° leading to the different mechanical behavior and the bonding between the layers seems to be crucial under shear load.
For the fatigue specimens specific and characteristic fracture surfaces are depicted for every building orientation in Figure 11a–f. Almost every specimen failed from pores and defects near or in contact with the surface. Whilst the surface of the 0°- (a) and 90°-specimen (c) are very alike, the 45°-specimen shows an area of stable crack growth around the pore and later crack propagation along the building layers that are oriented under 45° in relation to the load direction. This leads to an angle of 45° on the fracture surface, which can be seen in Figure 11b.
At higher magnification in Figure 11d–f the process-induced pores that were already detected via µ-CT are the main cause of failure under fatigue load. Even powder particles that were insufficiently molten by the laser (lack of fusion) can be seen in Figure 11f. Similar findings were published by Brandl et al. [22], showing that defects, i.e., pores or regions of non-melted powder, reduce effective load-bearing area and cause stress concentration, which results in reduced fatigue strength.

4. Conclusions and Outlook

The influence of building orientation on defects, microstructure, and mechanical properties of selective laser melted AlSi10Mg was investigated. Morphology of melt tracks was analyzed using light microscopy on Barker-etched specimens. Application of the island scanning strategy was clearly visible in the micrographs perpendicular to the build direction. On the other plane, single melt pools were observable, and the overlaps of the scan lines were sound that no interlayer binding defects were detected. For the 45°-specimens, the morphology shows no characteristic pattern the sections were cut at an angle of 45°. SEM micrographs displayed the characteristic hypoeutectic micro-structure of SLM AlSi10Mg. Characterization of defects by µ-CT showed an inner defect structure following the pattern of the scanning islands for 90° orientation. The pattern was not as clearly observable at the 0° orientation. The influence on relative density was that 0° orientation had the highest relative density among the three orientations 0°, 45°, and 90°.
The quasi-static tensile strength, considering the stated standard deviation, can be summarized as constant yield strength and ultimate tensile strength with minor influence on the specimen manufacturing orientation. Specimens manufactured at 0° showed highest tensile strength while 90° experienced the lowest. The fracture strain was similar. In the cyclic load increase test, the fracture stress of 45°-specimens was the highest which was against the finding of the quasi-static tensile test. The secant modulus degradation did not show significant differences between the different orientations except that the 45°-specimen also had the highest secant modulus. In the constant amplitude testing, 45°-specimens showed the highest scatter but also moderate to high strength. The specimens of 90° have low strength but also very low relative scatter which means they are the most reliable among the three orientations. The findings of this study are used as a base to investigate the feasibility of additive manufacturing of functionally-graded lightweight metallic components.
The followup work focuses on the influence of build height and multi-exposure techniques. It has to be proved how far the obtained know-how is transferrable to other alloying systems, such as Ti-6Al-4V taking into account the metallurgy differences between the systems.

Author Contributions

M.A., F.S., A.K., D.K., and J.T. made equal contributions to the study and the publication of this work under the close scientific supervision of F.W.

Funding

The authors thank the Deutsche Forschungsgemeinschaft (DFG, German Research Foundation) for its financial support within the research project “Mechanism-based understanding of functional grading focused on fatigue behavior of additively processed Ti-6Al-4V and Al-12Si alloys” (WA 1672/25-1).

Acknowledgments

The authors acknowledge financial support by Deutsche Forschungsgemeinschaft (DFG, German Research Foundation) and Technische Universität Dortmund/TU Dortmund Technical University within the funding program Open Access Publishing.

Conflicts of Interest

The authors declare no conflict of interest.

References

  1. Moriaux, F. Additive manufacturing for space application. In Proceedings of the Altair technology conference 2015, Paris, France, 1 October 2018. [Google Scholar]
  2. FAA Advisory Circular 25. 1309-1A System Design and Analysis; U.S. Department of Transportation: Des Moines, WA, USA, 21 June 1988.
  3. Standard for Additively Manufactured Spaceflight Hardware by Laser Powder Bed Fusion in Metals; (MSFC-STD-3716) National Aeronautics and Space Administration: Washington, DC, USA, 18 October 2017.
  4. Zhang, D.; Sun, S.; Qiu, D.; Gibson, M.; Dargusch, M.; Brandt, M.; Qian, M.; Easton, M. Metal alloys for fusion-based additive manufacturing. Adv. Eng. Mater. 2018, 20, 1700952. [Google Scholar] [CrossRef]
  5. Dutta, B.; Froes, F.H.S. The additive manufacturing (AM) of titanium alloys. Met. Powder Rep. 2017, 72, 96–106. [Google Scholar] [CrossRef]
  6. Frazier, E. Metal additive manufacturing: A review. J. Mater. Eng. Perform. 2014, 23, 1917–1928. [Google Scholar] [CrossRef]
  7. Mika, S.; Huuki, J.; Ituarte, I. The ultrasonic burnishing of cobalt-chrome and stainless steel surface made by additive manufacturing. Prog. Addit. Manuf. 2017, 2, 31–41. [Google Scholar]
  8. Uhlmann, E.; Kersting, R.; Klein, T.B.; Cruz, M.F.; Borille, A.V. Additive manufacturing of titanium alloy for aircraft components. Procedia CIRP 2015, 35, 55–60. [Google Scholar] [CrossRef]
  9. Qiu, C.; Panwisawas, C.; Ward, M.; Basoalto, H.; Brooks, J.; Attallah, M. On the role of melt flow into the surface structure and porosity development during selective laser melting. Acta Mater. 2015, 96, 72–79. [Google Scholar] [CrossRef]
  10. Kok, Y.; Tan, X.; Wang, P.; Nai, M.; Loh, N.; Liu, E.; Tor, S. Anisotropy and heterogeneity of microstructure and mechanical properties in metal additive manufacturing: A critical review. Mater. Des. 2018, 139, 565–586. [Google Scholar] [CrossRef]
  11. Simonelli, M.; Tse, Y.; Tuck, C. Effect of the build orientation on the mechanical properties and fracture modes of SLM Ti–6Al–4V. Mater. Sci. Eng. A 2014, 616, 1–11. [Google Scholar] [CrossRef] [Green Version]
  12. Prashanth, K.; Scudino, S.; Klauss, H.; Surreddi, K.; Löber, L.; Wang, Z.; Chaubey, A.; Kühn, U.; Eckert, J. Microstructure and mechanical properties of Al-12Si produced by selective laser melting: effect of heat treatment. Mater. Sci. Eng. A 2014, 590, 153–160. [Google Scholar] [CrossRef]
  13. Aboulkhair, N.T.; Everitt, N.M.; Ashcroft, I.; Tuck, C. Reducing porosity in AlSi10Mg parts processed by selective laser melting. Addit. Manuf. 2014, 1, 77–86. [Google Scholar] [CrossRef]
  14. Awd, M.; Tenkamp, J.; Hirtler, M.; Siddique, S.; Bambach, M.; Walther, F. Comparison of microstructure and mechanical properties of Scalmalloy® produced by selective laser melting and laser metal deposition. Materials 2018, 11, 17. [Google Scholar] [CrossRef] [PubMed]
  15. Kaufmann, N.; Imran, M.; Wischeropp, T.M.; Emmelmann, C.; Siddique, S.; Walther, F. Influence of process parameters on the quality of aluminium alloy EN AW 7075 using selective laser melting (SLM). Phys. Procedia 2016, 83, 918–926. [Google Scholar] [CrossRef]
  16. Sistiaga, M.L.; Mertens, R.; Vrancken, B.; Wang, X.; van Hooreweder, B.; Kruth, J.-P.; van Humbeeck, J. Changing the alloy composition of Al7075 for better processability by selective laser melting. J. Mater. Process. Technol. 2016, 238, 437–445. [Google Scholar] [CrossRef]
  17. Yang, K.; Rometsch, P.; Jarvis, T.; Rao, J.; Cao, S.; Davies, C.; Wu, X. Porosity formation mechanisms and fatigue response in Al-Si-Mg alloys made by selective laser melting. Mater. Sci. Eng. A 2018, 712, 166–174. [Google Scholar] [CrossRef]
  18. Read, N.; Wang, W.; Essa, K.; Attallah, M.M. Selective laser melting of AlSi10Mg alloy: Process optimization and mechanical properties development. Mater. Des. 2015, 65, 417–424. [Google Scholar] [CrossRef]
  19. Tradowsky, U.; White, J.; Ward, R.; Read, N.; Reimers, W.; Attallah, M. Selective laser melting of AlSi10Mg: Influence of post-processing on the microstructural and tensile properties development. Mater. Des. 2016, 105, 212–222. [Google Scholar] [CrossRef]
  20. Dai, D.; Gu, D.; Zhang, H.; Xiong, J.; Ma, C.; Hong, C.; Poprawe, R. Influence of scan strategy and molten pool configuration on microstructures and tensile properties of selective laser melting additive manufactured aluminum based parts. Opt. Laser Technol. 2018, 99, 91–100. [Google Scholar] [CrossRef]
  21. Siddique, S.; Imran, M.; Wycisk, E.; Emmelmann, C.; Walther, F. Influence of process-induced microstructure and imperfections on mechanical properties of AlSi12 processed by selective laser melting. J. Mater. Process. Technol. 2015, 221, 205–213. [Google Scholar] [CrossRef]
  22. Brandl, E.; Heckenberger, U.; Holzinger, V.; Buchbinder, D. Additive manufactured AlSi10Mg samples using selective laser melting (SLM): Microstructure, high cycle fatigue, and fracture behavior. Mater. Des. 2012, 34, 159–169. [Google Scholar] [CrossRef]
  23. Aboulkhair, N.T.; Maskery, I.; Tuck, C.; Ashcroft, I.; Everitt, N.M. Improving the fatigue behavior of a selectively laser melted aluminum alloy: Influence of heat treatment and surface quality. Mater. Des. 2016, 104, 174–182. [Google Scholar] [CrossRef]
  24. Siddique, S.; Imran, M.; Rauer, M.; Kaloudis, M.; Wycisk, E.; Emmelmann, C.; Walther, F. Computed tomography for characterization of fatigue performance of selective laser melted parts. Mater. Des. 2015, 83, 661–669. [Google Scholar] [CrossRef]
  25. Siddique, S.; Imran, M.; Walther, F. Very high cycle fatigue and fatigue crack propagation behavior of selective laser melted AlSi12 alloy. Int. J. Fatigue 2017, 94, 246–254. [Google Scholar] [CrossRef]
  26. Siddique, S.; Awd, M.; Tenkamp, J.; Walther, F. Development of a stochastic approach for fatigue life prediction of AlSi12 alloy processed by selective laser melting. Eng. Fail. Anal. 2017, 79, 34–50. [Google Scholar] [CrossRef]
  27. Awd, M.; Siddique, S.; Hajavifard, R.; Walther, F. Comparative Study of Defect-Based and Plastic Damage-Based Approaches for Fatigue Lifetime Calculation of Selective Laser-Melted AlSi12. In Proceedings of the 7th International Conference on Fracture, Fatigue and Wear, Ghent University, Ghent, Belgium, 9–10 July 2018. [Google Scholar]
  28. Kempen, K.; Thijs, L.; van Humbeeck, J.; Kruth, J.-P. Mechanical Properties of AlSi10Mg Produced by Selective Laser Melting. Phys. Procedia 2012, 39, 439–446. [Google Scholar] [CrossRef]
  29. Ziółkowski, G.; Chlebus, E.; Szymczyk, P.; Kurzac, J. Application of X-ray CT method for discontinuity and porosity detection in 316L stainless steel parts produced with SLM technology. Arch. Civ. Mech. Eng. 2014, 14, 608–614. [Google Scholar] [CrossRef]
  30. Thijs, L.; Kempen, K.; Kruth, J.-P.; van Humbeeck, J. Fine-structured aluminium products with controllable texture by selective laser melting of pre-alloyed AlSi10Mg powder. Acta Mater. 2013, 61, 1809–1819. [Google Scholar] [CrossRef] [Green Version]
  31. Wu, J.; Wang, X.Q.; Wang, W.; Attallah, M.M.; Loretto, M.H. Microstructure and strength of selectively laser melted AlSi10Mg. Acta Mater. 2016, 117, 311–320. [Google Scholar] [CrossRef]
  32. Fergani, O.; Bratli Wold, A.; Berto, F.; Brotan, V.; Bambach, M. Study of the effect of heat treatment on fatigue crack growth behaviour of 316L stainless steel produced by selective laser melting. Fatigue Fract. Eng. Mater. Struct. 2018, 41, 1102–1119. [Google Scholar] [CrossRef]
  33. Suryawanshi, J.; Prashanth, K.G.; Ramamurty, U. Mechanical behavior of selective laser melted 316L stainless steel. Mater. Sci. Eng. A 2017, 696, 113–121. [Google Scholar] [CrossRef]
Figure 1. (a) Building orientations for SLM AlSi10Mg samples; and (b) specimen geometry for tensile and fatigue tests (dimensions in mm).
Metals 08 00825 g001
Figure 2. Barker etched microstructure of the horizontal 0° specimen: (a,c): top view and corresponding magnification; (b,d): side view and corresponding magnification.
Metals 08 00825 g002
Figure 3. Columnar and cellular substructure of α-aluminum (dark) and eutectic phase (bright) for the 0°-orientation: (a) in the building orientation; and (b) perpendicular to the build platform.
Metals 08 00825 g003
Figure 4. 3D pore analysis with related top views of material: (a) 0° specimen; (b) 45° specimen; and (c) 90° specimen.
Metals 08 00825 g004
Figure 5. Comparison of defect status of the different orientations: (a) pore density; sphericity of (b) 0° specimen; (c) 45° specimen; and (d) 90° specimen.
Metals 08 00825 g005
Figure 6. Relative frequency of sphericity for the AlSi10Mg building orientations 0°, 45°, and 90°.
Metals 08 00825 g006
Figure 7. Averaged results of tensile tests for the AlSi10Mg building orientations 0°, 45°, and 90°.
Metals 08 00825 g007
Figure 8. Results of load increase tests for the AlSi10Mg building orientations 0°, 45°, and 90°.
Metals 08 00825 g008
Figure 9. Results of constant amplitude tests for the AlSi10Mg building orientations 0°, 45°, and 90°.
Metals 08 00825 g009
Figure 10. Fracture surfaces after tensile test in scanning electron microscope: (a) 0°-specimen; (b) 45°-specimen; and (c) 90°-specimen.
Metals 08 00825 g010
Figure 11. Fractographic analysis after fatigue tests in scanning electron microscope: (a,d) 0°-specimen; (b,e) 45°-specimen; (c,f) 90°-specimen.
Metals 08 00825 g011
Table 1. Scanning parameters of µ-CT scans.
Beam EnergyBeam CurrentPowerEffective Pixel SizeExposure
133 kV100 µA13.3 W17.5 µm4 fps250 ms
Table 2. Total number of tested specimens for fatigue testing.
Fatigue TestOrientation
45°90°
LIT111
CAT444
Table 3. Results of the quasi-static tensile tests of AlSi10Mg specimens.
Parameter45°90°
σy (MPa)241.2 ± 1.0239.1 ± 6.2236.8 ± 6.2
UTS (MPa)379.6 ± 4.5367.8 ± 4.4351.8 ± 6.5
εf (%)8.1 ± 0.45.7 ± 0.88.3 ± 0.3

