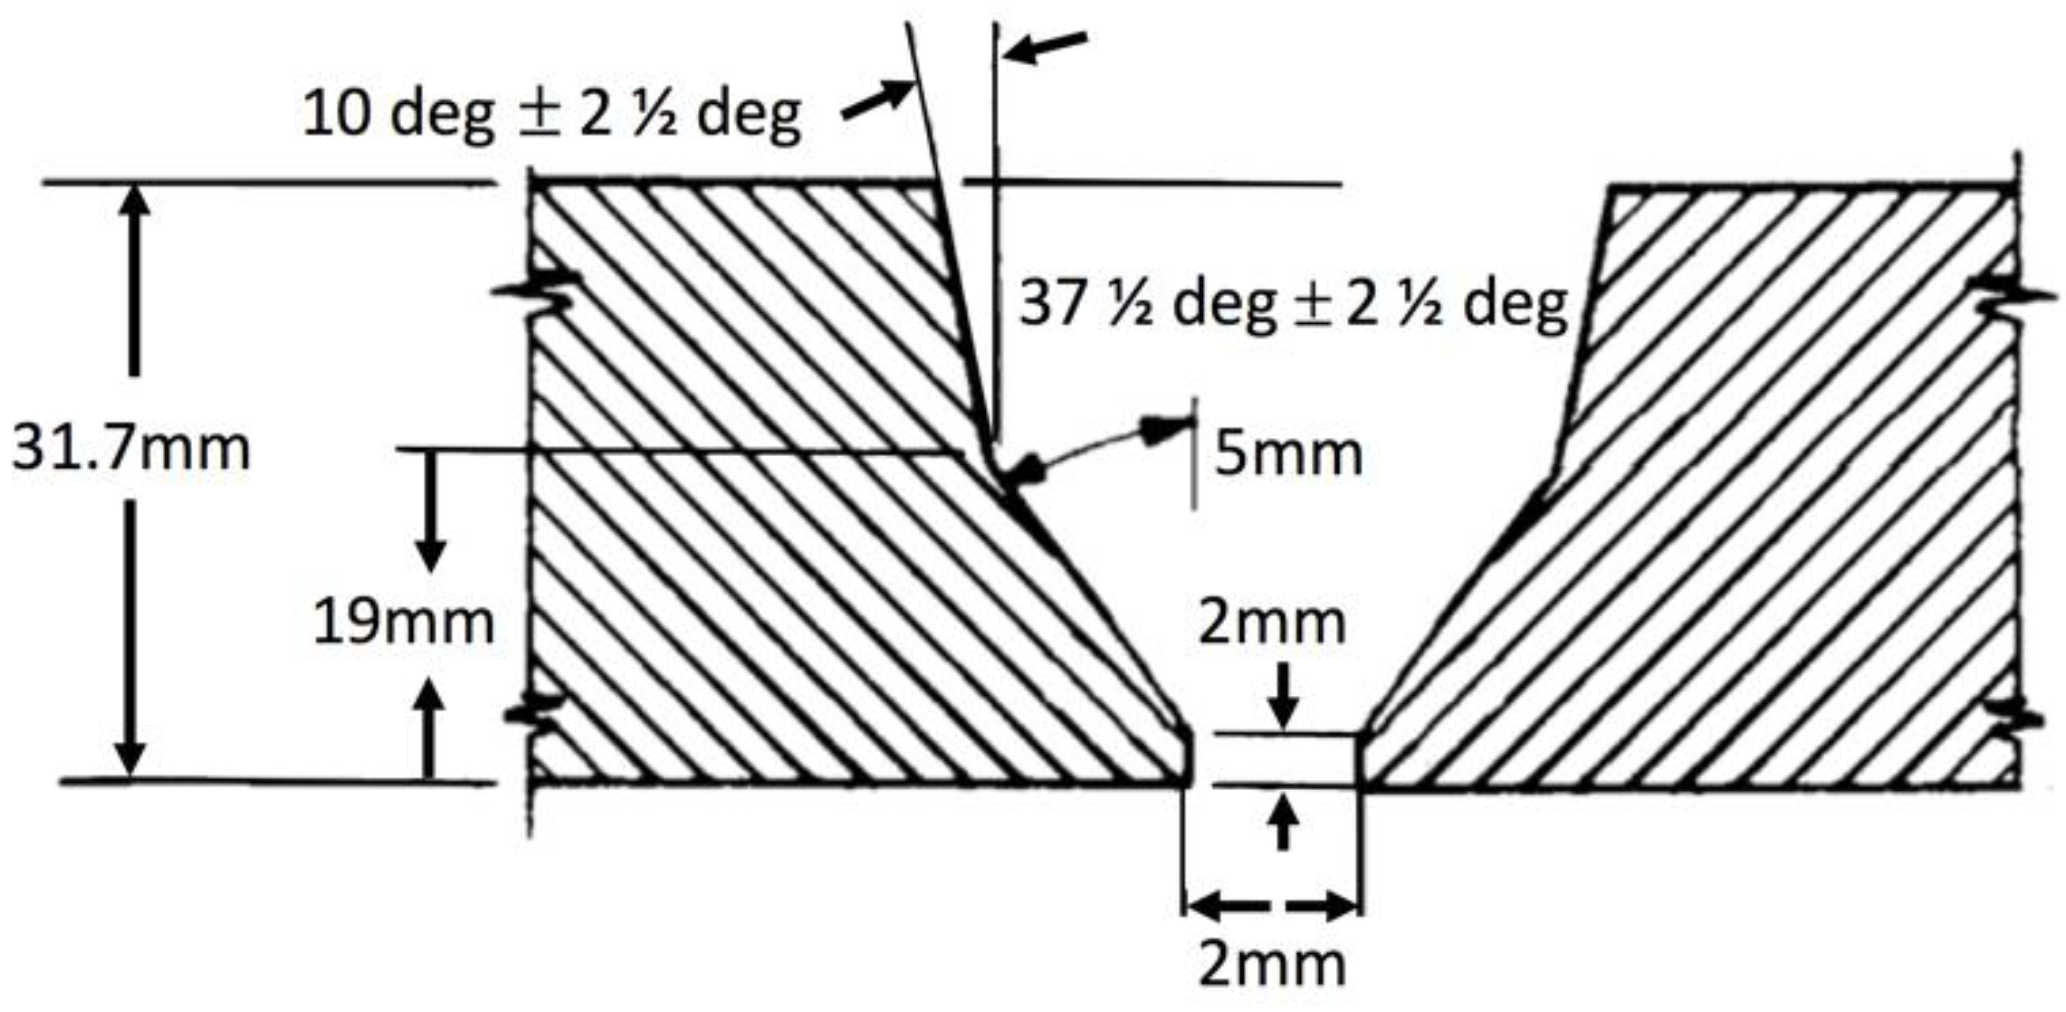
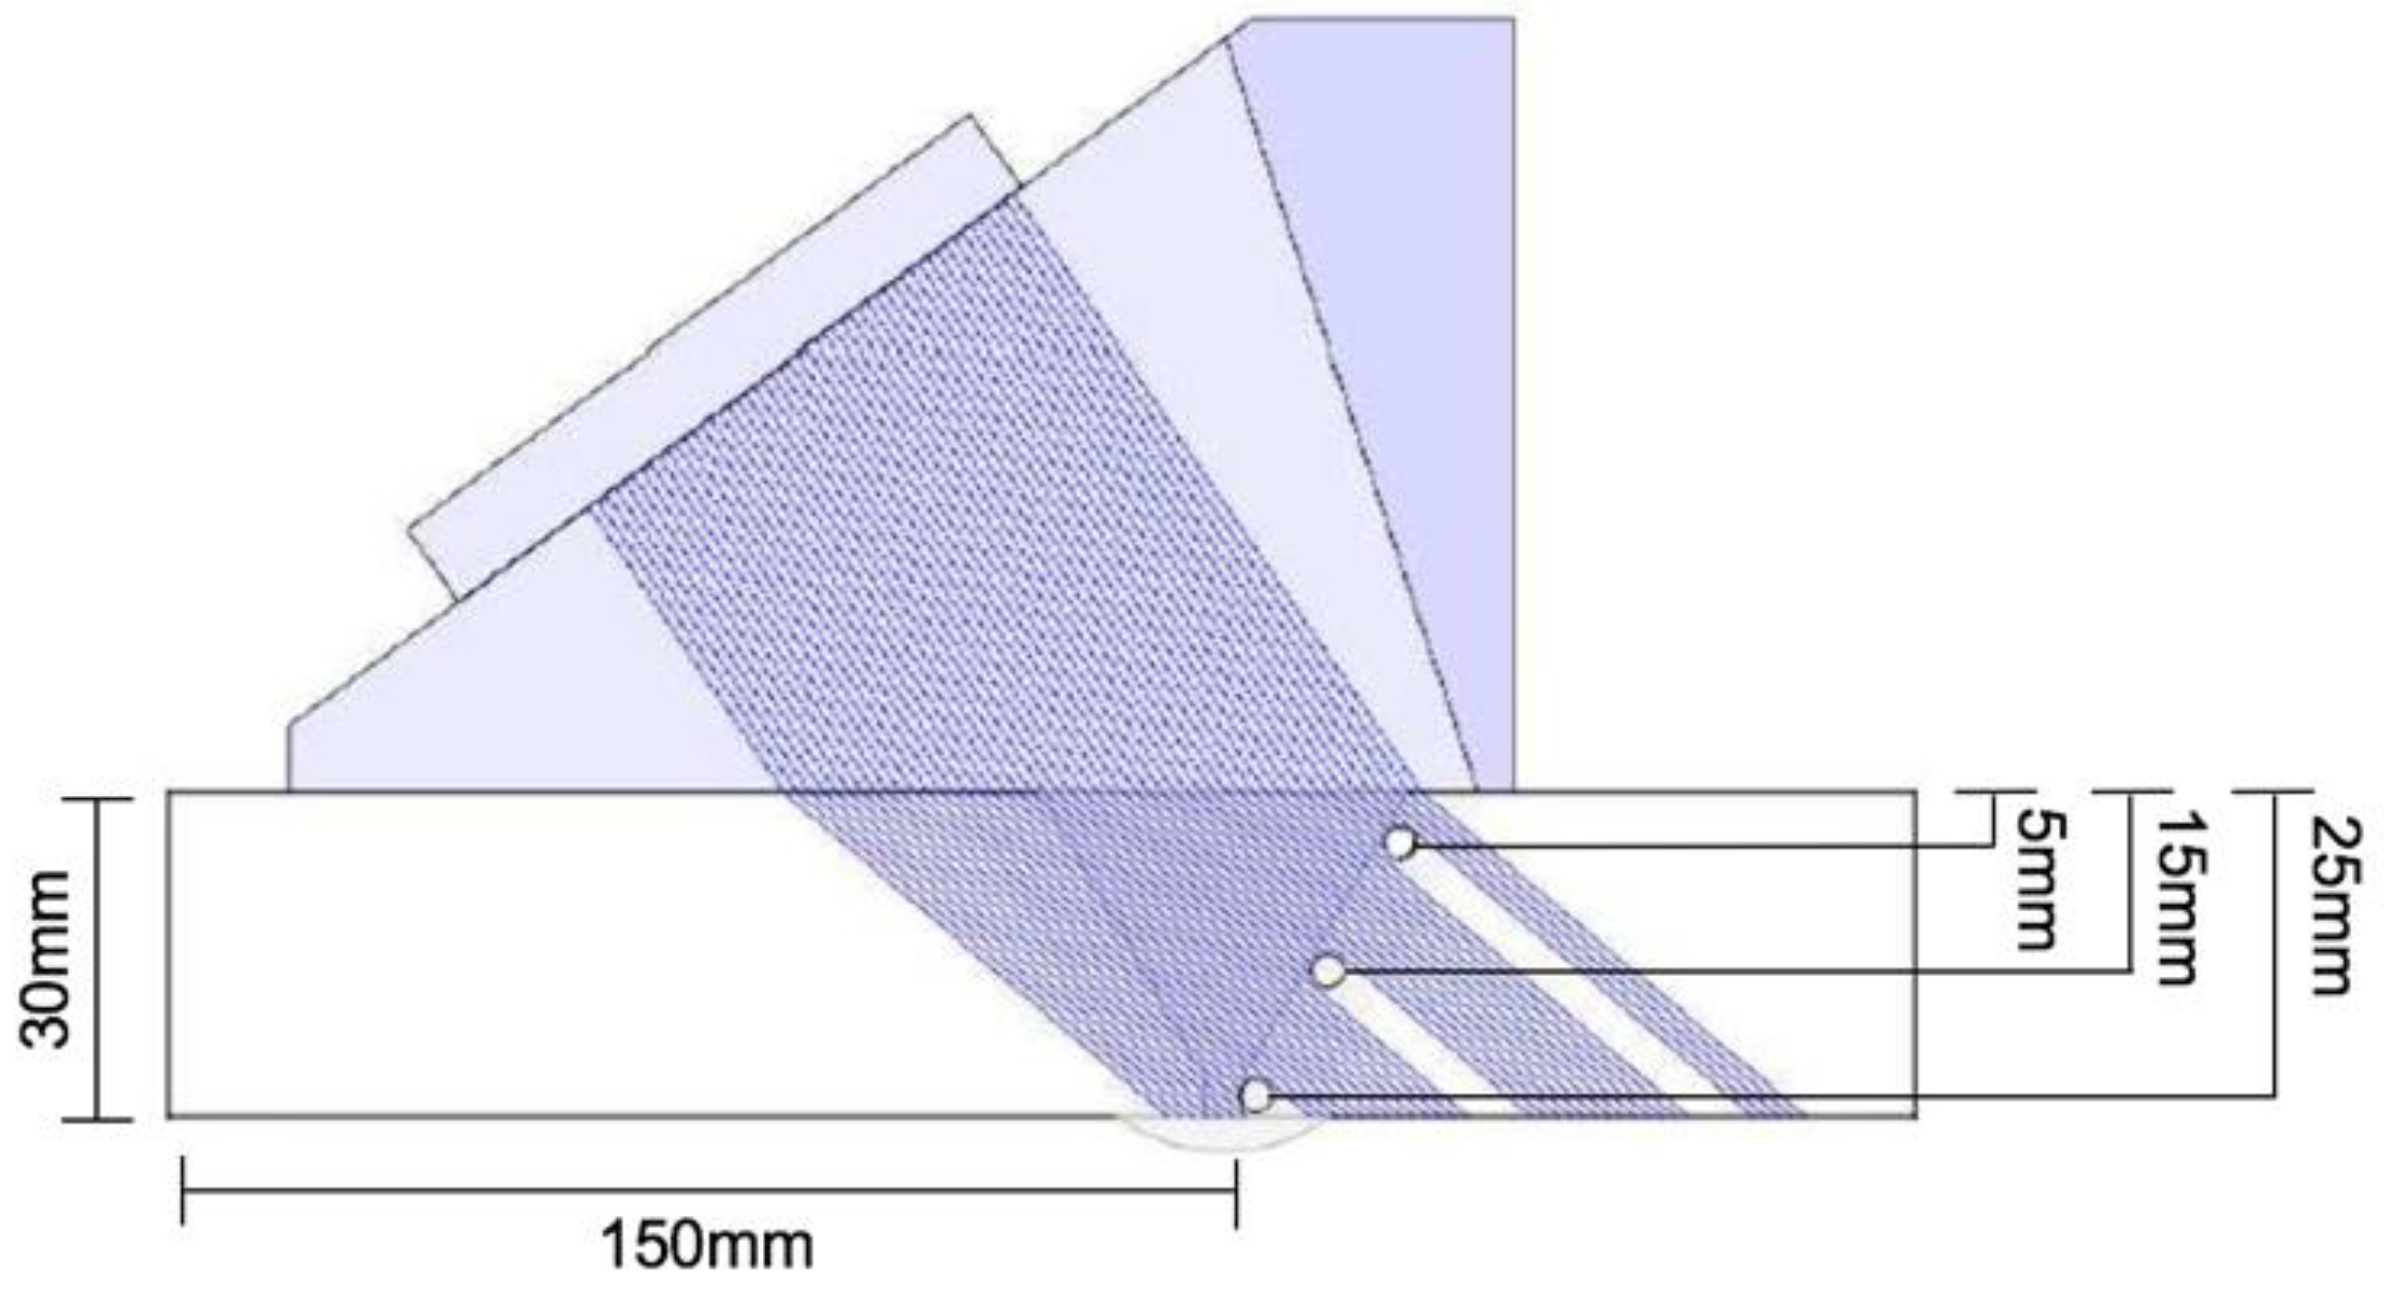
Article

Ultrasonic Inspection of a 9% Ni Steel Joint Welded with Ni-based Superalloy 625: Simulation and Experimentation

by
João Da Cruz Payão Filho
1,
Elisa Kimus Dias Passos
1,*,
Rodrigo Stohler Gonzaga
1,
Ramon Fonseca Ferreira
2,
Daniel Drumond Santos
2 and
Diego Russo Juliano
3
1
Programa de Engenharia Metalúrgica e de Materiais, Instituto Alberto Luiz Coimbra de Pós-Graduação e Pesquisa de Engenharia, Universidade Federal do Rio de Janeiro (PEMM/COPPE/UFRJ), Cidade Universitária, Ilha do Fundão, Caixa Postal 68505, CEP 21941-972 Rio de Janeiro-RJ, Brazil
2
Serviço Nacional de Aprendizagem Industrial do Rio de Janeiro, Instituto Senai de Tecnologia Solda (IST Solda), R.São Francisco Xavier, no 601, Maracanã, CEP 20550-011 Rio de Janeiro-RJ, Brazil
3
Shell Petróleo Brasil Ltda., Av. República do Chile, no 330, 25o andar, Torre Oeste, Centro, CEP 20031-170 Rio de Janeiro-RJ, Brazil
*
Author to whom correspondence should be addressed.
Metals 2018, 8(10), 787; https://doi.org/10.3390/met8100787
Submission received: 14 September 2018 / Revised: 28 September 2018 / Accepted: 29 September 2018 / Published: 2 October 2018
(This article belongs to the Special Issue Science, Characterization and Technology of Joining and Welding)

Abstract

:
The ultrasonic inspection of thick-walled welded joint with austenitic weld metal has proven to be a challenge due to its anisotropic microstructure that can promote ultrasonic waves attenuation. This work aimed to optimize the phased array ultrasonic inspection of the thick-walled joint of a 9% Ni steel pipe welded with Ni-based superalloy 625. The development was carried out by CIVA numeric simulation to preview the beam behavior during the inspection of GTAW (Gas Tungsten Arc Welding)/SMAW (Shielded Metal Arc Welding) joint with anisotropic weld metal. To validate the simulation results, experimental tests were performed with a phased array transducer using longitudinal waves on a calibration block withdrawn from the joint. The configuration of low frequency (2.25 MHz), 16 active elements and a scanning angle of 48° ensured the inspection of the entire joint and the computational simulation proved to be essential for the success of the inspection.

1. Introduction

Cryogenic 9% Ni steel has been used almost exclusively in the storage and transport of liquefied gases in the form of sheets of small and medium thicknesses. Nevertheless, at the beginning of the decade of 2010, 9% Ni steel found a new application as CO2 injection equipment in Brazil pre-salt oil and gas wells. Due to the high pressure in these wells (approximately 550 bar/55 MPa), thick 9% Ni steel pipes are being used for the first time in the world [1].
The ultrasonic inspection with phased array of the thick-walled girth welded joints with an austenitic weld metal, such as a 9% Ni steel pipe welded with nickel superalloy 625 as the filler metal, has been a huge challenge for the oil and gas industry. The weld metal of this type of dissimilar welded joint has an anisotropic structure, which attenuates the ultrasonic waves and diverts the beam, making the establishment of the best inspection conditions extremely difficult and laborious. Many research works [2,3,4,5,6] have been carried out to describe the influence of the solidification structures and its effect on the propagation of ultrasonic wave. Since the critical defects in this type of joint are mainly found in the root of the weld, due to the corrosive fluid contact in the inner surface of the pipe, it is very important for the ultrasonic inspection to ensure the sizing of defects in this region.
Faced by this situation, our research team began an investigation using numerical simulation to preview the ultrasonic behavior during the inspection of welded joints of 9% Ni high thickness steel pipes with austenitic alloy as the filler metal. The major aim of this work is to establish the best conditions in which to optimize the phased array ultrasonic inspection of welded dissimilar steel tubular joints by drawing up an ultrasonic numeric simulation study and using ES Beam Tool software 4th version from the Eclipse Scientific Company (Canada) and the 11th version of CIVA from the Extende® Company (France). The simulation was essential, since it would be difficult, costly and time-consuming to obtain the best ultrasonic inspection technique with only experimental procedures. To validate the simulation results and ensure the effectiveness and precision of the inspection, experimental tests were performed using a phased array transducer with longitudinal linear waves on a calibration block, withdrawn from a joint fabricated by GTAW/SMAW welding processes.
The grains in austenitic weld metals grow parallel to the direction of the heat flow, thus forming a dendritic microstructure during cooling. In spite of the heat promoted by the successive welding passes deposition, it is not sufficient to ensure a modification in the structure of the elongated and crystallography-oriented grains formed in the previous welding pass deposition. These grains are approximately vertical along the center of the weld metal and are perpendicular to the fusion line, giving this region an anisotropic structure and a particular symmetry of long austenitic columnar grains [6].
During welding thermal cycles, austenitic weld metals alloys, such as nickel superalloy 625, do not experience phase transformation, which promotes the extensive growth of columnar grain. These anisotropic grains of the weld metal may promote beam deflection and consequently interfere with defect detection. There are many works [7,8,9] that tried to model the deflection that the austenitic weld metal can promote in the propagation of ultrasonic waves. Hirsekorn [10] compared the effect of ultrasonic longitudinal and transversal waves in austenitic weld metals and concluded that the sonic speed and the beam deflection are different according to the scanning incidence angle. For longitudinal waves, the scanning incidence angles, which represent the minimum beam deflection, are between 45° and 52°.
The attenuation coefficient α is a parameter composed by the sum of the absorption coefficient αa and the scattering coefficient αs. The energy absorption is affected by the interaction of the ultrasonic wave with the imperfections of the material lattice, while the scattering relies on the grain structure of the material [11].
The relation between the grain size and wavelength of the weld metal is an important feature that influences the ultrasonic attenuating effect. According to this relation, the beam scattering may be divided into three regimes: Rayleigh (λ >> D), Stochastic (λ ≈ D) and Diffusive (λ << D), where λ is the wavelength and D the grain size. As will be shown in the Results and Discussions, for the settings used in this work, the Rayleigh regime was the best fit. The scattering in a Rayleigh regime is described by Equation (1) [12]:
s(f) = aD3f4
where a = scattering coefficient; f = frequency.
As the attenuation is directly proportional to the frequency of the four powers, decreasing the frequency results in a decrease of the attenuation effect. Flotté and Bittendiebel [13] suggested the use of a frequency that would guarantee the defect sensibility without compromising the attenuation necessary for the inspection. In his work, a 2.25 MHz transducer was used.
In an anisotropic material, the average diameter of the grain will depend on the wave propagation direction and Equation (1) cannot be generalized for all directions in anisotropic media. This observation was also cited by Hirsekorn [10], who said that the scattering coefficient is also dependent on the beam to grain angle.
In addition to the scattering, the inspection might also be affected by reflection and refraction. When the weld metal fiber texture is anisotropic and the base metal has an isotropic fine grain, beam reflections, beam refractions and mode conversion may occur at the fusion line. Volkov et al. [14] described that for scanning incidence angles larger than ~30°, the reflection coefficient of the longitudinal waves is smaller than 0.05, while for vertically polarized transverse waves, this value of reflection was only obtained for angles larger than ~60°.
Increasing the sound pressure is a way to improve the beam response. In this case, it is necessary to provide more energy to promote deeper penetration and a higher reliability of detection. Sound pressure, when the phased array technique is used, relies on the number of active elements, focal distance, propagation angle, ultrasonic speed and transducer frequency. As the number of active elements grows, the sound pressure increases, although it is important to take into consideration the signal-to-noise ratio coming from the inspection of austenitic metals [15]. When the number of active elements decreases, the beam focusing gets diffused and the sonic pressure is reduced, promoting a lower concentration at the analyzed point. On the other hand, when the number of elements is very big, the noise also increases and can hide real defects.
The directivity of the sonic beam and the angle of incidence can be adjusted to maximize the beam convergence (focusing). Lee and Choi [16] described the focalization can reduce the area of dispersion while the echo of discontinuities remains constant, thus resulting in a higher sound pressure and signal-to-noise ratio. The directivity relies on the probe design, which is composed of the number and width of active elements, pitch, frequency and bandwidth.
The results showed that with the proper combination of phased array ultrasonic parameters, it is possible to inspect the HAZ (Heat Affected Zone) and the whole weld metal of thick-walled 9% Ni welded joints, thus providing security for this new application in the Brazilian pre-salt industry.

2. Materials and Methods

2.1. Materials

To develop this work, a 9% Ni steel pipe was used with an 8” (203.2 mm) nominal internal diameter and 1¼” (31. 5 mm) thickness, quenched and tempered as recommended by ASTM A333 grade 8. The pipe was gas tungsten arc welded (GTAW) for root and hot passes and shielded metal arc welded (SMAW) for fill and cap passes. The adopted filler metals were Ni-based superalloy 625 (ERNiCrMo-3/AWS A5.14 and ENiCrMo-3/AWS A5.11 for GTAW and SMAW, respectively). Table 1 shows the specified and analyzed mechanical properties of the base metal and typical values of the mechanical properties of the filler metals and Table 2 shows the specified and analyzed chemical compositions (wt.%) of the base, filler and weld metals, respectively.

2.2. Welding Procedure

The whole welding procedure was monitored by data acquisition equipment (IMC SAP 4.0 System). Figure 1 and Figure 2 show the joint design and the illustration of butt joint weld passes distribution, respectively; Table 3 shows the adopted welding parameters.

2.3. Simulation Procedure

The software CIVA 11th version (Extende®, Massy, France) was used to simulate the path of the ultrasonic beam through the welded joint. To perform the scanning simulations using linear longitudinal waves, the weld reinforcement was removed to allow direct incidence promoted by the wedge passing over the weld metal, since longitudinal waves work only with a half skip because most of the energy of the incident sonic beam is lost to a converted transverse wave after reflection.
The geometry made in the software was based on a cross-sectional macrograph of the weld joint. Figure 3 shows the weld passes, grouped by blocks with the same characteristic cooling directions and highlighted by a CAD (Computer-Aided Design) drawing overlap. The arrow directions represent the average growth of the dendrites of the weld metal and the arrow senses represent the direction of the temperature gradient. This information is important to define the scanning incidence angles that allow for the least attenuation effect. The root region presented a refined microstructure and it was considered isotropic similar to the base metal. The weld metal was set with the assumption of an orthotropic symmetry and the elastic constant was extracted from the software database, which is presented in Table 4. Figure 3 also shows a SEM (Scanning Electron Microscope) micrograph of the HAZ near to the fusion line.
After determining the scanning angles (45°, 48° and 52°), the software ES Beam Tool was to used preview the ultrasonic beam scanning with different indexes and number of elements, aiming to verify whether these parameters would ensure the coverage of the whole target region (weld metal). The beam opening was projected through the transversal welded joint section. The scanning previews for 45°, 16 active elements and indexes 10, 23, 35 and 48 mm are presented in Figure 4. The same analysis was made for angles of 48° and 52°.
The final definition of the scanning incidence angles, number of active elements and indexes used in the CIVA simulation are described in the Table 5.

2.4. Inspection Procedure

For inspection procedures, a phased array device, Omniscan MX2 32-128 (Olympus, Tokyo, Japan) [20], a wedge SA32-N60L-IHC (Olympus, Tokyo, Japan) and a phased array transducer 2.25L32-A32 with frequency of 2.25 MHz and 32 active elements (maximum capacity) (Olympus, Tokyo, Japan) were used. The sonic speed and the sonic attenuation of the material were obtained through the calibration blocks. The transducer was positioned over the analyzed region and the speed was adjusted until the material’s real thickness was found. For attenuation, the gain between two consecutive echoes was measured. The speed and the attenuation were evaluated in the middle of the weld metal and in the base metal. These values were obtained using a standard ultrasound transducer with no angulation (0°).
Since the CIVA simulation highlighted the best results for 16 active elements, taking into consideration the attenuation and the beam coverage, the other conditions (24 and 32 active elements) were dismissed. Table 6 presents the final configurations used in the experimental tests.

3. Results and Discussions

3.1. Beam Attenuation

When the grains of the weld metal are randomly oriented and small enough when compared to the wavelength, its microstructure does not interfere with its acoustic properties. However, when there are coarse crystallography-oriented grains, the sound propagation is affected by the deviation of the ultrasonic beam, resulting in a worse signal-to-noise ratio. These factors cause an increase in the difficulty of the interpretation of the ultrasonic signal, which ends up being reflected in the loss of accuracy of the location and the dimensioning of the defects, thus making it difficult to distinguish between real defects and false indications [12].
In previews tests with longitudinal and transversal waves, the sonic attenuation and sonic speed were verified in the base metal and in the weld metal. Table 7 summarizes the values obtained. Due to the less attenuation, the longitudinal waves were chosen to develop this work.
For longitudinal waves with a sonic speed of 5840 m/s and a frequency of 2.25 MHz, the wavelength (λ) is approximately 2595 μm, which is considerably larger than the average grain size of the weld metal (94.6 μm) and the average grain size in the fusion line (158 μm), thus agreeing with Rayleigh beam scattering (λ >> D). Figure 5 shows the distribution, size and orientation of the grains, produced by EBSD (Electron Backscatter Diffraction) analysis in the center of the weld metal and near to the fusion boundary. These two regions were chosen to show the anisotropy along the metal and the epitaxial growth behavior of the grain next to the fusion line.
The EBSD is a microstructural and crystallographic characterization technique used to identify the grain morphology, grain orientation, phased, texture and deformation of polycrystalline materials. The analysis is conducted by an EBSD detector attached to SEM.

3.2. Simulation

The ultrasonic beam and its attenuation are represented by the pink color and the blue region depicts a collimated ultrasonic beam with high sonic pressure. The results of the linear scanning with longitudinal wave and scanning angle of 45°; the results for different active elements are presented in Figure 6.
Figure 6a shows the ultrasonic beam passing through the weld metal with little attenuation and concentration near the weld cap. As the number of active elements grows, the attenuation effect intensifies, as seen in Figure 6b,c, which used 24 and 32 elements, respectively.
As expressed in theory [15], as the number of active elements grows, the sound pressure increases. However, it is important to take into consideration the signal-to-noise ratio coming from the inspection of austenitic metal. The phased array ultrasonic generates a group of delayed waves, controlled by the focal law, which propagates a maximized wave front into the austenitic microstructure. The different microstructures, grain sizes and grain orientations between the base (9% Ni steel) and weld (Ni-based superalloy 625) metals might cause a deviation of the waves generated by each activated element, which causes backscattering signals from the microstructure noise. Thus, the relation between sonic pressure and the signal-to-noise ratio must be analyzed for each focal law.
The analysis of the simulation with 16 active elements for a linear 45° angled beam demonstrates a good sound pressure and low attenuation of the beam inside the welded joint. From these results, the scanning indexes were varied, aiming to cover the whole weld metal (Figure 7).
The results of Figure 7a show high coverage on the weld bevel with low divergence and the sonic beam extends to the root region. In Figure 7b, the beam covered most of the weld metal, demonstrating a low divergence at the index of 23 mm. To cover the welded joint, 2 more indexes were made, as shown in Figure 7c,d, where the beam does not show attenuation or divergence.
The results of linear scanning with a longitudinal wave and a scanning angle of 48° are presented in Figure 8.
Figure 8a shows the 16 active elements of ultrasonic beam passing through the weld metal with little attenuation. As the number of active elements grows, the attenuation effect intensifies, as seen in Figure 8b,c, the values of which were obtained with 24 and 32 elements, respectively. As made for the scanning angle of 45°, the indexes ware varied and aimed to cover the whole weld metal. The results are shown in Figure 9. For an index of 8 mm, the sonic beam has low divergence and shows high coverage of the fusion line in the root region (Figure 9a). In Figure 9b, the beam covers most of the welded joint with low divergence for an index of 22 mm. To cover all of the welded joint, more than two indexes were made (Figure 9c,d). Using scanning indexes of 8 mm, 22 mm, 35 mm and 49 mm, it was possible to cover the whole welded joint. It may also be noted that there is excessive collimation in Figure 9b–d, which can oversize the defects.
Another linear beam angle analyzed was 52°, which was observed for the same number of active elements. Even the result of the 16 active elements showed a good coverage and the image shows a divergence of the beam angle direction and attenuation of some areas near the root. The results of the linear scanning with angle 52° are presented in Figure 10.
As the number of active elements grows from 24 to 32 (Figure 10b,c), the attenuation effect intensifies. The same methodology was made for this angle by choosing 16 active elements for the different scanning index analyses (Figure 11). More points of attenuation are visible near the centerline of the welded joint and the beam shows a divergence with indexes of 3 and 18 mm (Figure 11a,b). To cover all of the welded joint, it was necessary to insert 2 more indexes: 32 mm and 46 mm. The first one expressed a good behavior of the ultrasonic beam (Figure 11c); the second one (Figure 11d) expressed low attenuation or divergence of the ultrasonic beam.
Angles outside the range of 40°–50° may promote significant beam attenuation, especially for austenitic metals, such as the Ni-based superalloy 625. In case of misunderstanding the metal microstructure, the scan parameters can be erroneously selected and because of that, the estimated discontinuity size detected by ultrasonic inspection may not coincide with its real size or real position in the weld metal. Table 8 shows the simulation results summarized.

3.3. Experimentation

The experimental tests were performed using the results obtained in the 16 active elements of CIVA simulation, so that the results of both techniques could be compared. The calibration block was withdrawn from the GTAW/SMAW welded joint. The weld reinforcement was removed and 3 through-holes with a 2.25 mm diameter were machined, as recommended by ASME Section V-article 4. The simulation of sensitivity calibration with longitudinal waves in the calibration block is shown in Figure 12.
The transducer wedge was positioned on the calibration block to allow the sonic beam to strike over the third hole, near the root of the welded joint. For ultrasonic scanning with an angle of 45° and 16 active elements, the gain from the third hole reflection was 50 dB (Figure 13).
The echo from the third hole was maximized to 80% of the screen height, as indicated in Figure 14. After tracing the TCG (Time Corrected Gain) in the extension, it was necessary to inspect the weld metal with 3 holes and the primary gain was 22.8 dB.
The TCG setting was performed according to ASME V [21] using the calibration block, which was withdrawn from the 9% Ni steel joint, to equalize the sensitivity of all focal laws for defects located in different depths from the surface of the inspected piece. The TCG is corrected in time so that the reflectors (defects) have equal amplitudes for all sonic path distances, which compensates for the attenuation inside the material and inside the wedge.
For the ultrasonic scanning with angle of 48° and 16 active elements, the gain from the third hole reflection was 40.1 dB and the primary gain was 22.6 dB, as shown in Figure 15 and Figure 16.
Finally, for ultrasonic scanning with an angle of 52° and 16 active elements, the gain from the third hole reflection was 40.8 dB and the primary gain was 27.2 dB, as shown in Figure 17 and Figure 18.
During the scanning procedure, the greater the material attenuation, the greater the gain added to the signal should be to allow for a proper inspection. From that point of view, the best scanning angle for the inspection of the 9% Ni steel pipe joint SMAW welded with Ni-based superalloy 625 is 48° because the primary gains from the third hole after the TCG adjustment were lowest when compared to 45° and 52°, as seen in Table 9. Very high gain can increase the noise, thus reducing the ratio signal-to-noise and an angle of 48° presented the best signal amplitude response.
Comparing the CIVA simulations and the experimentation tests with angles of 45°, 48° and 52°, the differences among the amplitudes are clear. Greater amplitude was necessary to correct the TCG for the angle 52° because of the beam deflection and attenuation. The angles of 45° and 48° promoted minimum beam deflection during propagation, which was confirmed by experiments in the block verification for these two focal laws, as shown in Figure 13 and Figure 15. In these figures, the maximizations of the echo to 80% show low noise levels and a clear definition of the whole amplitude.
The difference between simulations with 16, 24 and 32 active elements demonstrated that the number of active elements affects the sound pressure, the directivity, the signal-to-noise ratio and the beam attenuation, which meets the observations of Freitas [15]. The results for 16 active elements demonstrate a good sound pressure, low beam divergence and good coverage of the welded joint, which were caused by the better signal-to-noise ratio.
With respect to frequency, the experimental tests confirmed the CIVA simulations, showing that the frequency of 2.25 MHz allowed for a good penetration of the beam into the welded joint with minimal deviation, which matched the theory proposed by Neumann [3], who said that the noise generated by the grains increases with transducer frequency. The 2.25 MHz transducer used in this work has a design with a linear arrangement of 1.0 mm element pitch and 32 mm active aperture. This arrangement was reflected in a good wave front and guaranteed good sound pressure and great directivity.
As presented by Hirsekorn [10] to optimize the angle of inspection, we need to take into account the scattering of the wave in the weld metal for higher beam to grain angles. For lower angles, the effect of attenuation caused by reflection at the boundary between isotropic and anisotropic material is predominant. As the inspection was made using a longitudinal wave with the ultrasonic beam propagating directly in the weld metal, the scattering effect in attenuation has a major impact, which explains the worse results that were found when the angle of more elevated incidence was used.
As shown by Hirsekorn [10] to optimize the inspection angle, it is necessary to take into account 2 phenomena: Wave scattering in the weld metal and reflection of the wave in the fusion line. For larger angles, the scattering of the wave in the weld metal is more pronounced. For lower angles, the attenuation effect caused by the reflection at the border between isotropic and anisotropic materials is predominant. However, as the inspection was performed using a longitudinal wave with the ultrasonic beam propagating directly in the weld metal without passing through the fusion line, the scattering phenomenon has a greater effect in wave attenuation, which explains the worse results found when the greater angle of incidence was used.
In sum, the combination of the longitudinal wave, linear scanning, frequency of 2.25 MHz, transducer with 1.0 mm pitch, 16 active elements and angles of 45° or 48° made a viable austenitic metal inspection with minimum ultrasonic beam divergence and a good defect size measurement. However, the angle of 48° showed the best results. Lastly, the inspection of the welded joint between 9% Ni steel (ASTM A333 gr. 8) and Ni-based superalloy 625 is practicable but it is necessary to set up the appropriate phased array parameters.

4. Conclusions

  • For linear inspection simulations with longitudinal waves, scanning angles of 45° and 48° showed the best results, with minimum beam divergence and high sonic pressure along the welded region.
  • Numerical simulation presents high divergence and attenuation using an angle of 52°, for linear inspection simulations with longitudinal waves, evidencing regions where the sonic energy is absorbed by the austenitic weld metal.
  • The configuration with 16 active elements proved to be the most effective scanning technique, covering a large volume of the weld, including the root region, with the same scanning index and maintaining good sonic pressure and directivity of the beam.
  • According to the CIVA simulation, the optimized configuration showed that the configuration of low frequency (2.25 MHz), 16 active elements, linear scan and angles of 45° and 48° are recommended to inspect root and filler regions. In this case, at least three scanning indexes were necessary to ensure the inspection of the entire volume of the welded joint.
  • Experimental tests showed that inspection with longitudinal waves, using angles of 45° and 48°, allowed the detection of the 3 holes located in the fusion line of the calibration block. However, the scanning incidence angle of 48° showed better results, since the primary gains from the third hole and after the TCG adjustment were the lowest when compared to 45° and 52°.
  • The comparison between the simulation and the experimental tests demonstrated the potential of the simulation CIVA to establish the best conditions to optimize the phased array ultrasonic inspection of welded dissimilar steel tubular joints.
  • The most important outcome of this work is to enable the inspection of the HAZ and the whole weld metal of thick-walled 9% Ni welded joints by choosing the proper combination of phased array ultrasonic parameters. Because of the groundbreaking application, an ultrasonic inspection procedure had not been established before the one obtained in this work.

Author Contributions

Formal analysis, E.K.D.P., R.F.F. and D.D.S.; Funding acquisition, D.R.J.; Investigation, R.F.F. and D.D.S.; Methodology, R.F.F. and D.D.S.; Project administration, J.d.C.P.F.; Supervision, J.d.C.P.F.; Validation, D.R.J. and R.S.G.; Visualization, E.K.D.P.; Writing-original draft, E.K.D.P.; Writing-review & editing, J.d.C.P.F.

Funding

This research was funded by Empresa Brasileira de Pesquisa e Inovação Industrial-Embrapii, PCCOP1512.0004” and Shell Brasil Ltda., TO821.

Acknowledgments

This work has been conducted with financial support from Shell Brasil Petróleo Ltda. (Shell Brasil), Empresa Brasileira de Pesquisa e Inovação Industrial (Embrapii) and Agência Nacional de Petróleo, Gás Natural e Biocombustíveis (ANP) and was carried out in partnership with Vallourec Soluções Tubulares do Brasil S.A. (Vallourec) and Serviço Nacional de Aprendizagem Industrial do Rio de Janeiro (Senai-RJ). Special thanks to engineer Vinícius Pereira Maia.

Conflicts of Interest

The authors declare no conflict of interest. The founding sponsors had no role in the design of the study; in the collection, analyses, or interpretation of data; in the writing of the manuscript or in the decision to publish the results.

References

  1. Rodrigues, R.C. Avaliação das Transformações de Fase do Aço com 9% de Níquel e das Zonas Termicamente Afetadas Simuladas in situ com Difração de raios-X Síncrotron. Ph.D. Thesis, Universidade Federal Fluminense, Rio de Janeiro, Brasil, 2016. [Google Scholar]
  2. Hudgell, R.J.; Gray, B.S. The Ultrasonic Inspection of Austenitic Materials: State of the Art Report; United Kingdom Atomic Energy Authority, Northern Division: Abingdon-on-Thames, UK, 1985. [Google Scholar]
  3. Neumann, A.W.E. On the state of the art of the inspection of austenitic welds with ultrasound. Int. J. Press. Vessel. Pip. 1989, 39, 227–246. [Google Scholar] [CrossRef]
  4. Papadakis, E.P. Influence of preferred orientation on ultrasonic grain scattering. J. Appl. Phys. 1965, 36, 1738–1740. [Google Scholar] [CrossRef]
  5. Kupperman, D.S.; Reimann, K.J.; Yuhas, D. Visualization of ultrasonic beam distortion in anisotropic stainless steel. Quant. NDE Nucl. Ind. 1983, 18, 172–176. [Google Scholar]
  6. Wagner, S.; Dugan, S.; Stubenrauch, S.; Jacobs, O. Modification of the grain structure of austenitic welds for improved ultrasonic inspectability. Australas. Weld J. 2013, 58, 42–48. [Google Scholar]
  7. Ogilvy, J.A. Computerized ultrasonic ray tracing in austenitic steel. NDT Int. 1985, 18, 67–77. [Google Scholar] [CrossRef]
  8. Apfel, A.; Moysan, J.; Corneloup, G.; Fouquet, T.; Chassignole, B. Coupling an ultrasonic propagation code with a model of the heterogeneity of multipass welds to simulate ultrasonic testing. Ultrasonics 2005, 43, 447–456. [Google Scholar] [CrossRef] [PubMed]
  9. Moysan, J.; Apfel, A.; Corneloup, G.; Chassignole, B. Modelling the grain orientation of austenitic stainless steel multipass welds to improve ultrasonic assessment of structural integrity. Int. J. Press. Vessel. Pip. 2003, 80, 77–85. [Google Scholar] [CrossRef]
  10. Hirsekorn, S. Directional dependence of ultrasonic propagation in textured polycrystals. J. Acoust. Soc. Am. 1986, 79, 1269–1279. [Google Scholar] [CrossRef]
  11. Willems, H. A new method for the measurement of ultrasonic absorption in polycrystalline materials. In Review of Progress in Quantitative Nondestructive Evaluation; Springer: Boston, MA, USA, 1987; pp. 473–481. [Google Scholar]
  12. Bouda, A.b.; Lebaili, S.; Benchaala, A. Grain size influence on ultrasonic velocities and attenuation. NDT E Int. 2003, 36, 1–5. [Google Scholar] [CrossRef]
  13. Flotté, D.; Bittendiebel, S. A Phased Array Ultrasonic Testing of a Manual Thick Austenitic Weld-Feeedback. In Proceedings of the 19th World Conference on Nondestructive Testing 2016, Munich, Germany, 13–17 June 2016. [Google Scholar]
  14. Volkov, A.S.; Ermolov, I.N.; Basatskaya, L.V.; Vyatskov, I.A.; Grebennik, V.S. Ultrasonic transmission by the boundary in an austenitic weld. Sov. J. Nondestr. Test.-Ussr 1984, 20, 134–137. [Google Scholar]
  15. Freitas, M.I. Development of an ultrasonic Phased Array system to inspect welded joints of low thickness austenitic steel. Master’s Thesis, Universidade de Lisboa, Lisbon, Portugal, May 2016. [Google Scholar]
  16. Lee, J.H.; Choi, S.W. A parametric study of ultrasonic beam profiles for a linear phased array transducer. IEEE Trans. Ultrason. Ferroelectr. Freq. Control 2000, 47, 644–650. [Google Scholar] [PubMed]
  17. ASTM International. ASTM A333/A333M-16 Standard Specification for Seamless and Welded Steel Pipe for Low-Temperature Service and Other Applications with Required Notch Toughness; ASTM International: West Conshohocken, PA, USA, 2016. [Google Scholar]
  18. American Welding Society. A5.14/A5.14M:2018: Specification for Nickel and Nickel-Alloy Bare Welding Electrodes and Rods; American Welding Society, Inc. (AWS): Miami, FL, USA, 2018. [Google Scholar]
  19. American Welding Society. A5.11/A5.11M:2018: Specification for Nickel and Nickel-Alloy Welding Electrodes for Shielded Metal Arc Welding; American Welding Society, Inc. (AWS): Miami, FL, USA, 2018. [Google Scholar]
  20. Ultrasonic Transducers Technical Notes; Tech Broch Olympus NDT: Waltham, MA, USA, 2016.
  21. American Society of Mechanical Engineers. ASME Boiler and Pressure Vessel Code; American Society of Mechanical Engineers, Boiler and Pressure Vessel Committee: New York, NY, USA, 1900. [Google Scholar]
Figure 1. Design of the 9% Ni steel circumferential pipe butt joint.
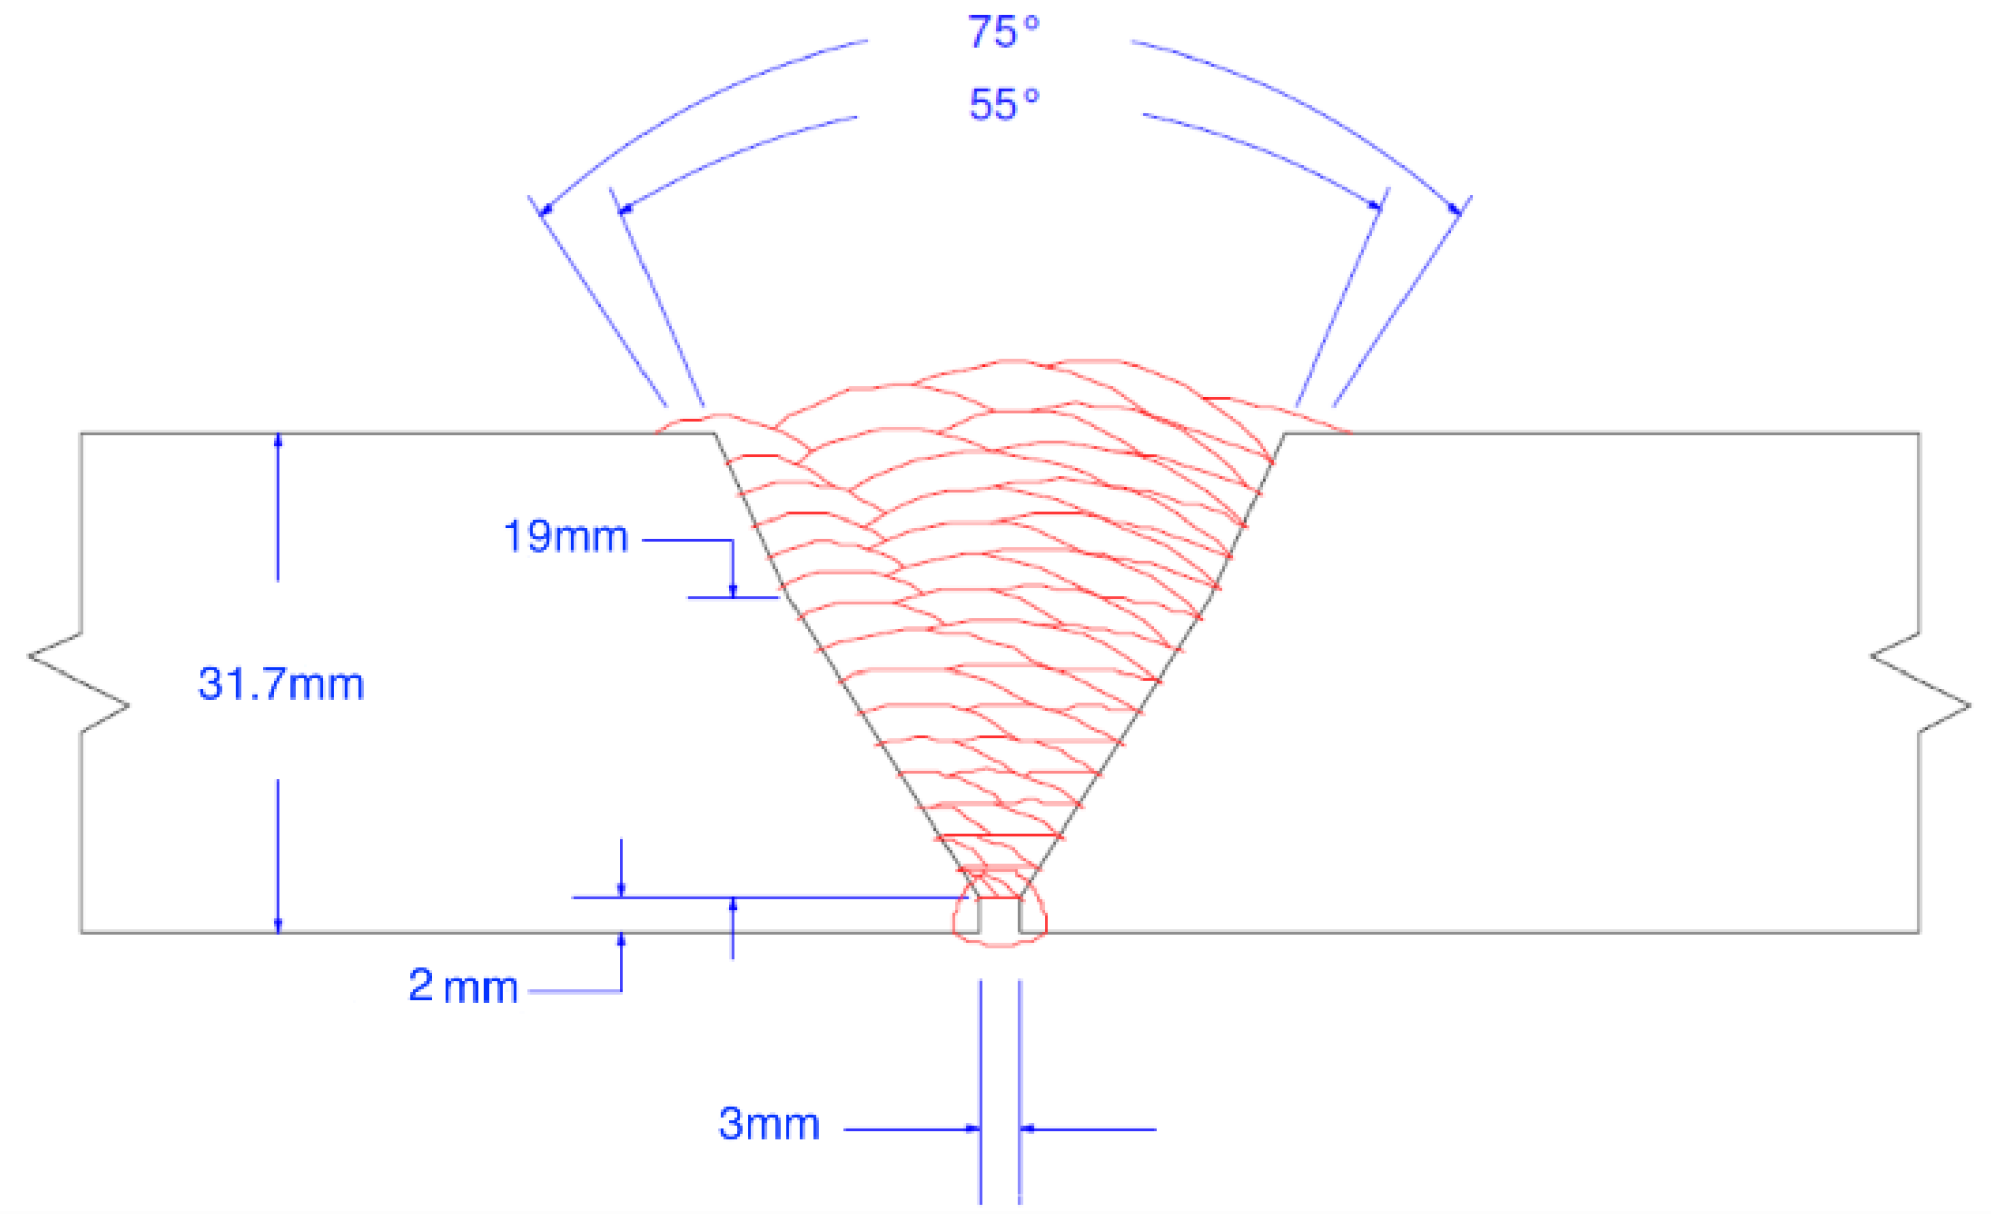
Metals 08 00787 g001
Figure 2. Illustration of the butt joint weld passes distribution.
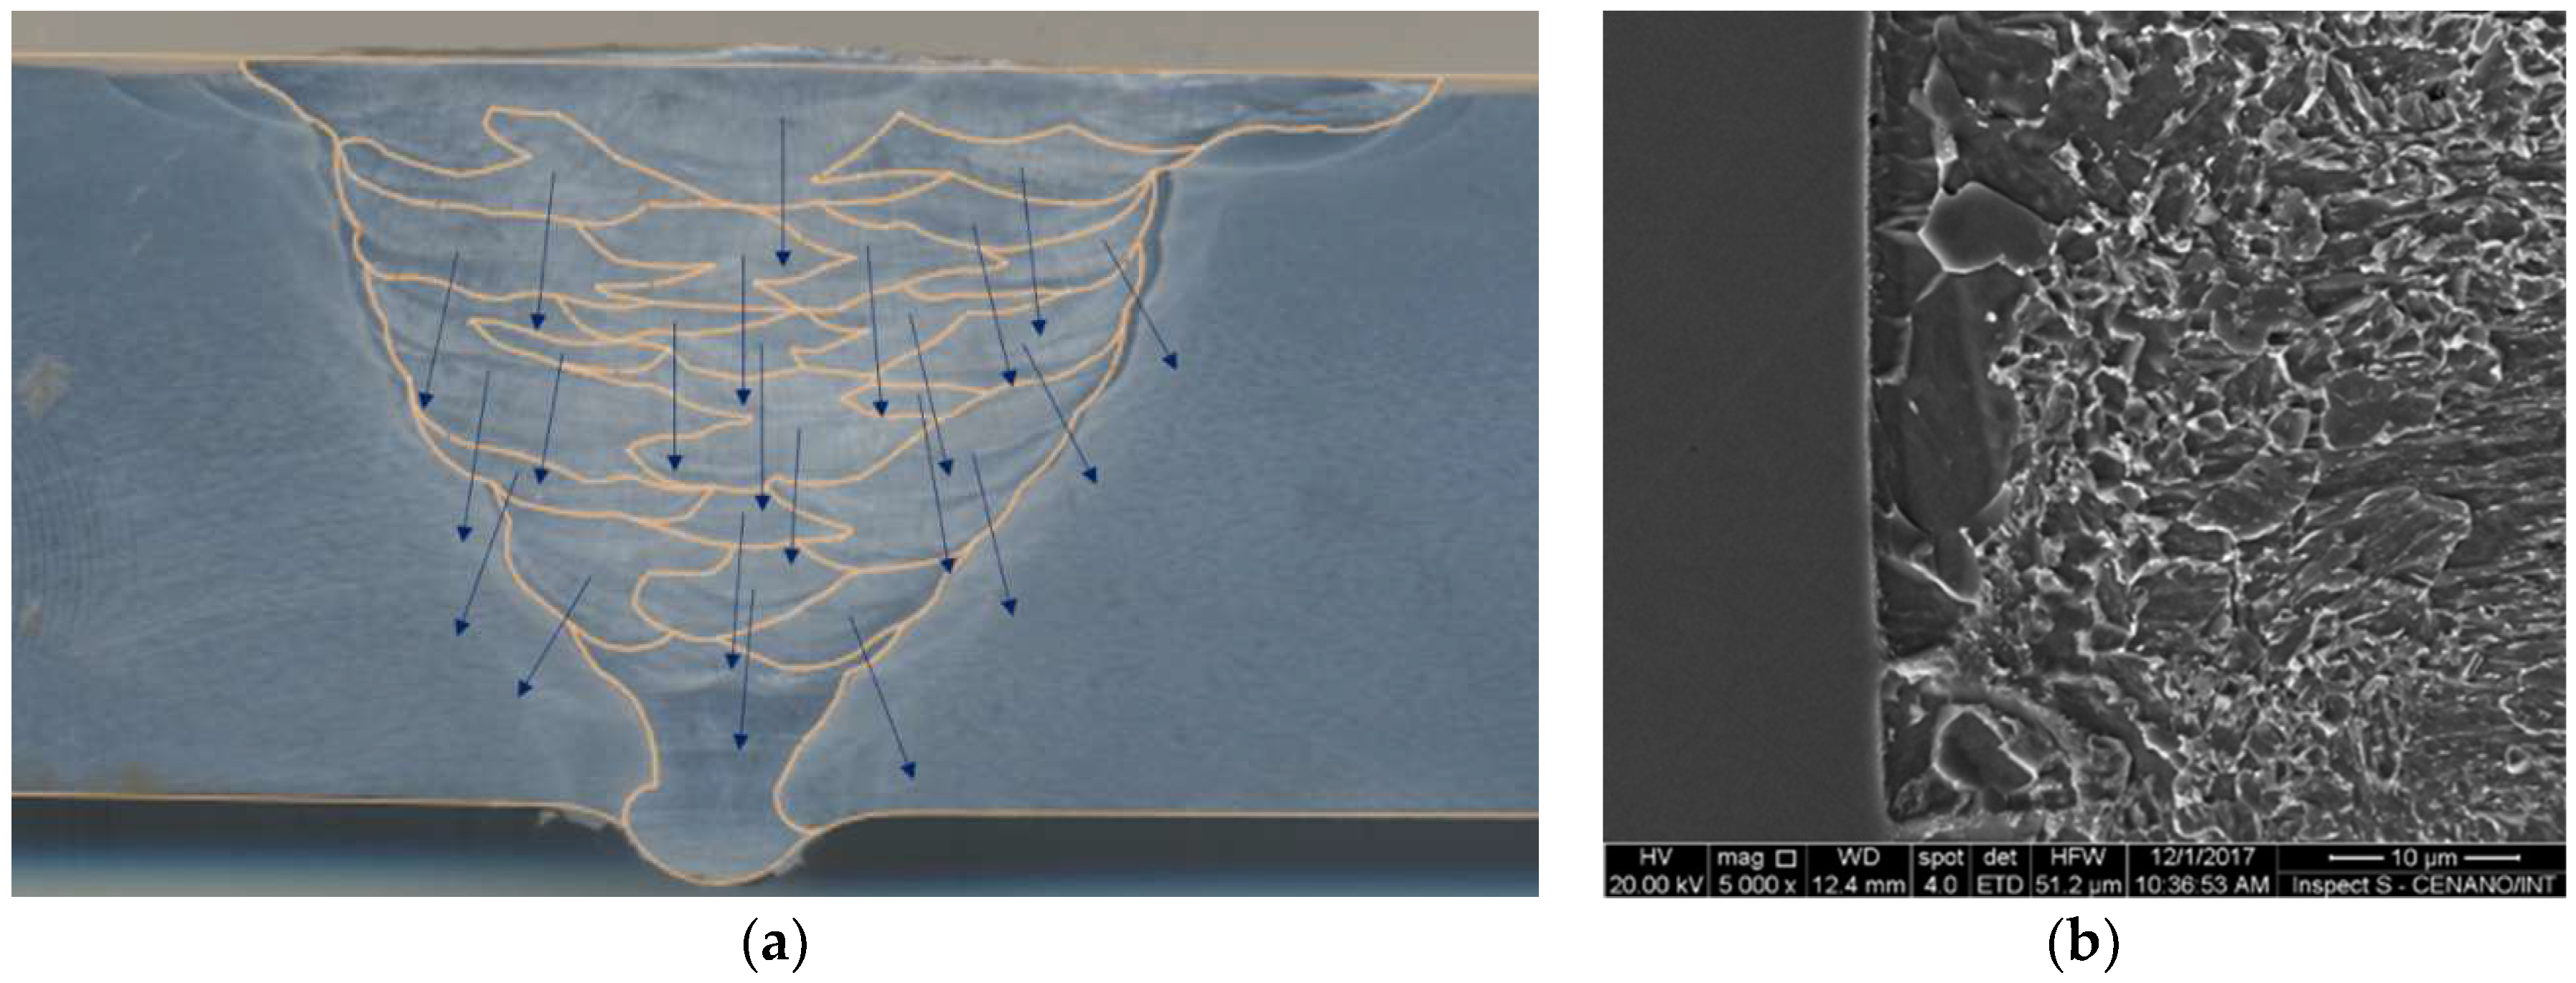
Metals 08 00787 g002
Figure 3. Macrograph of the 9% Ni steel pipe welded butt joint showing the weld passes highlighted by CAD drawing overlay and the directions of dendrite growth ((a), arrows) and SEM micrograph of the HAZ near the fusion line (b).
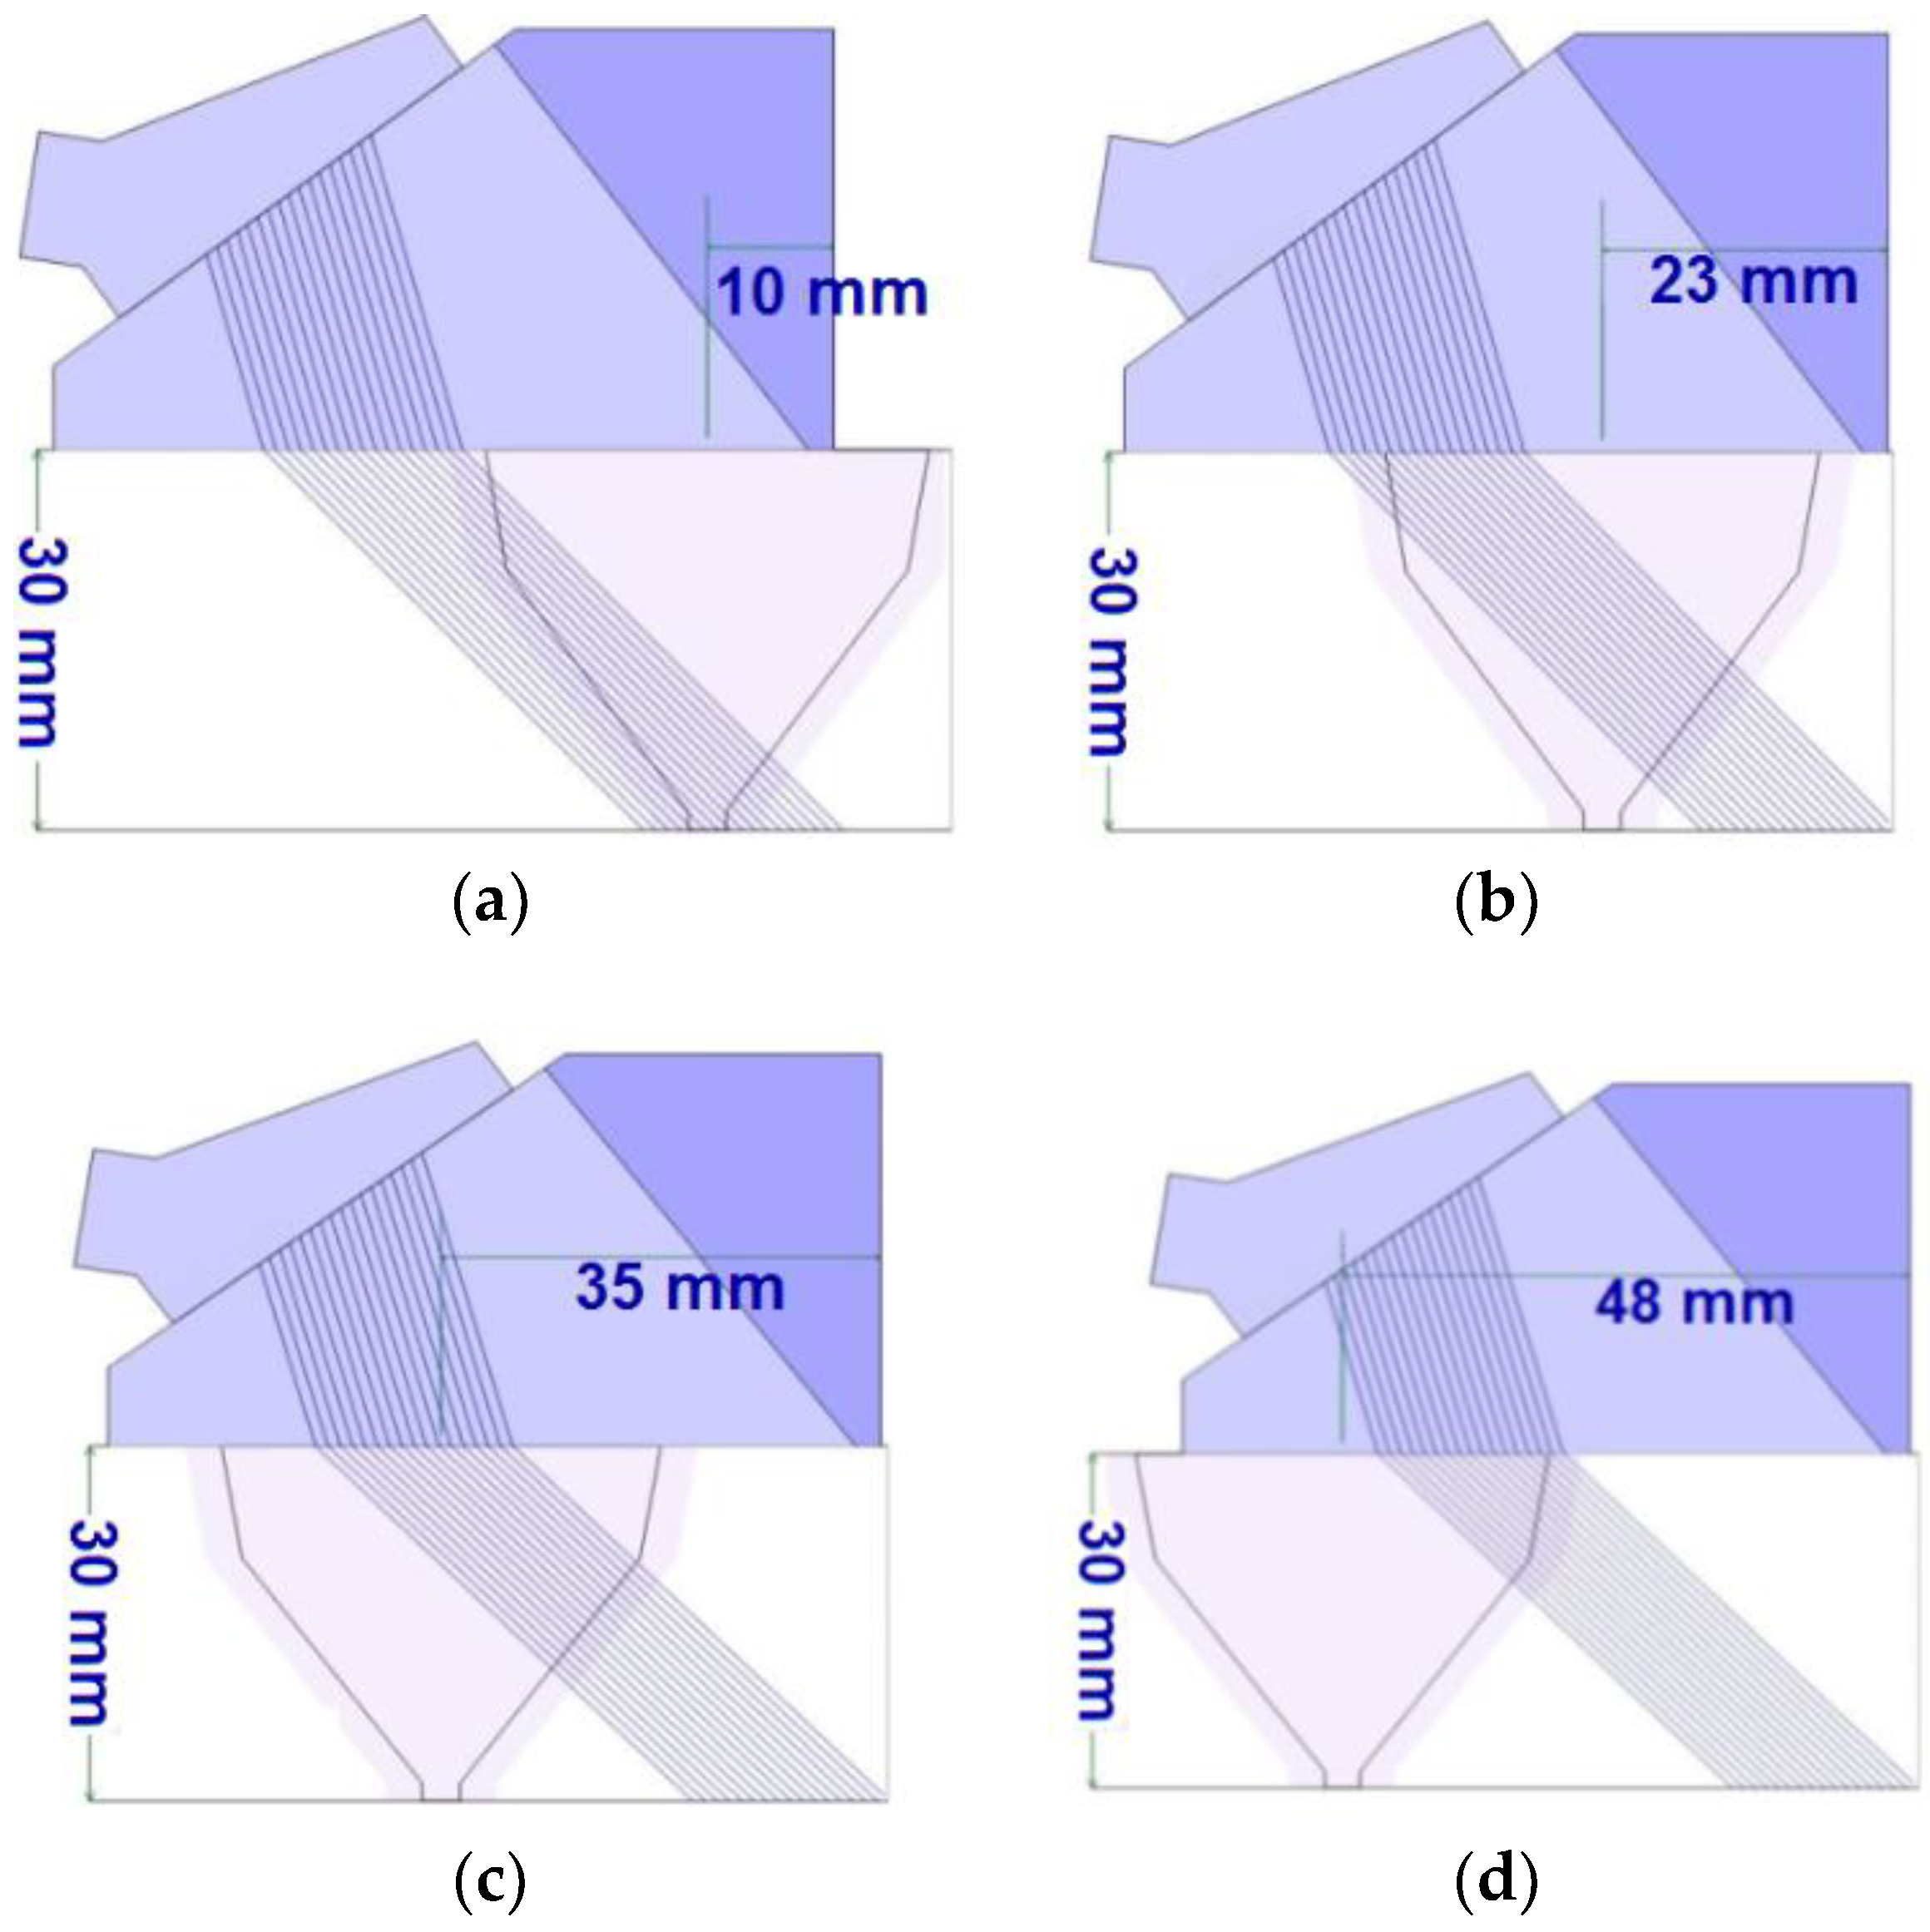
Metals 08 00787 g003
Figure 4. Simulation of inspection with scanning angle of 45° and 16 active elements. Indexes: (a) 10 mm, (b) 23 mm, (c) 35 mm and (d) 48 mm.
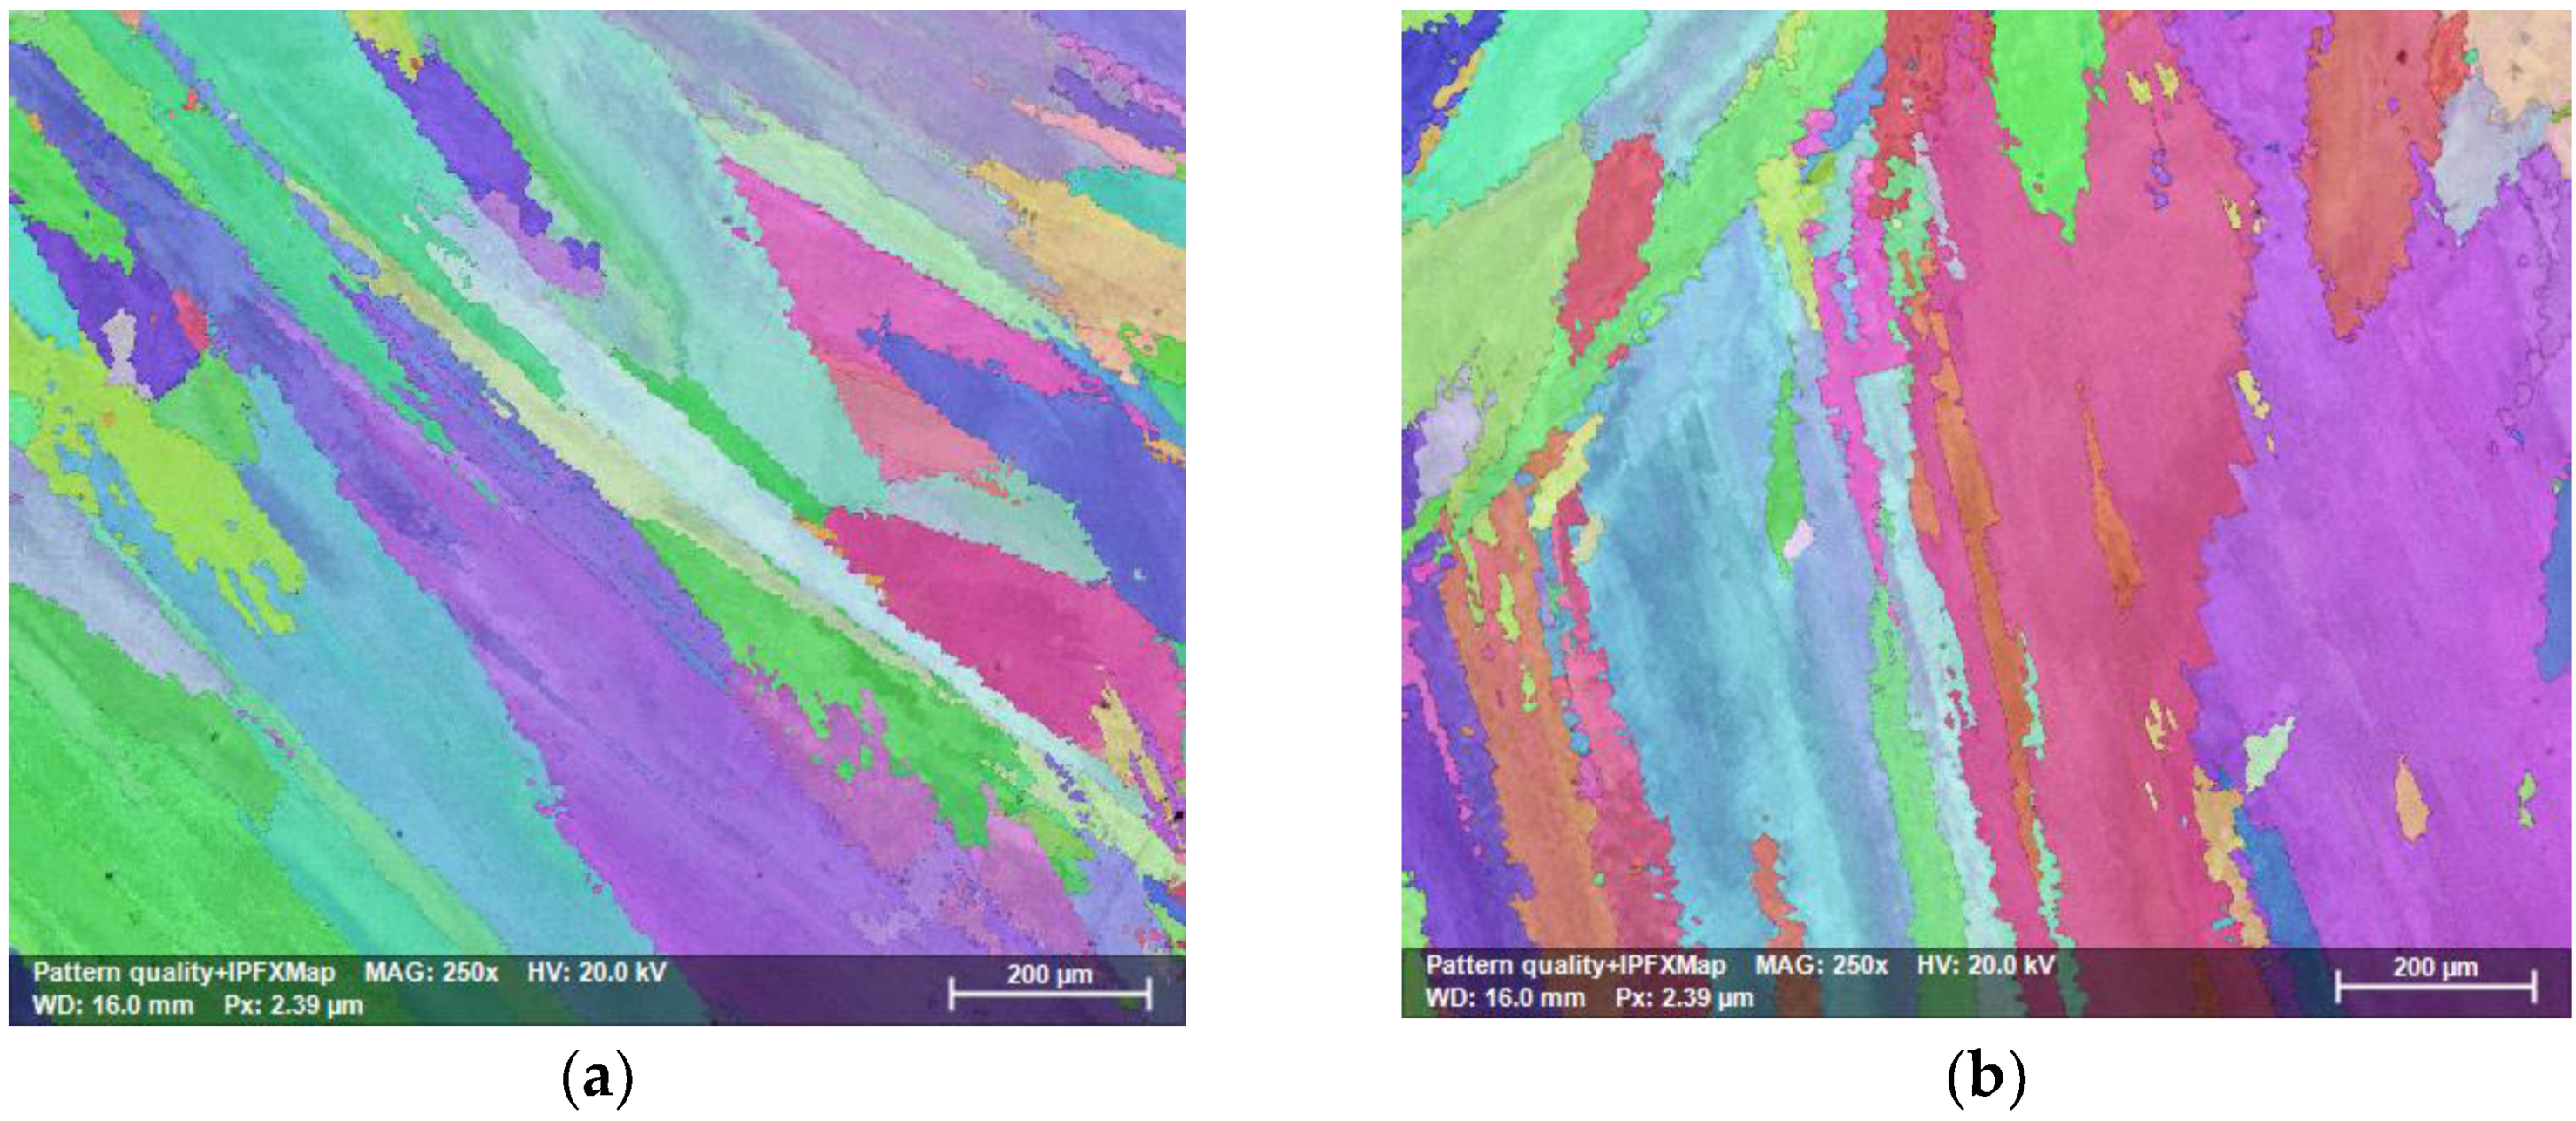
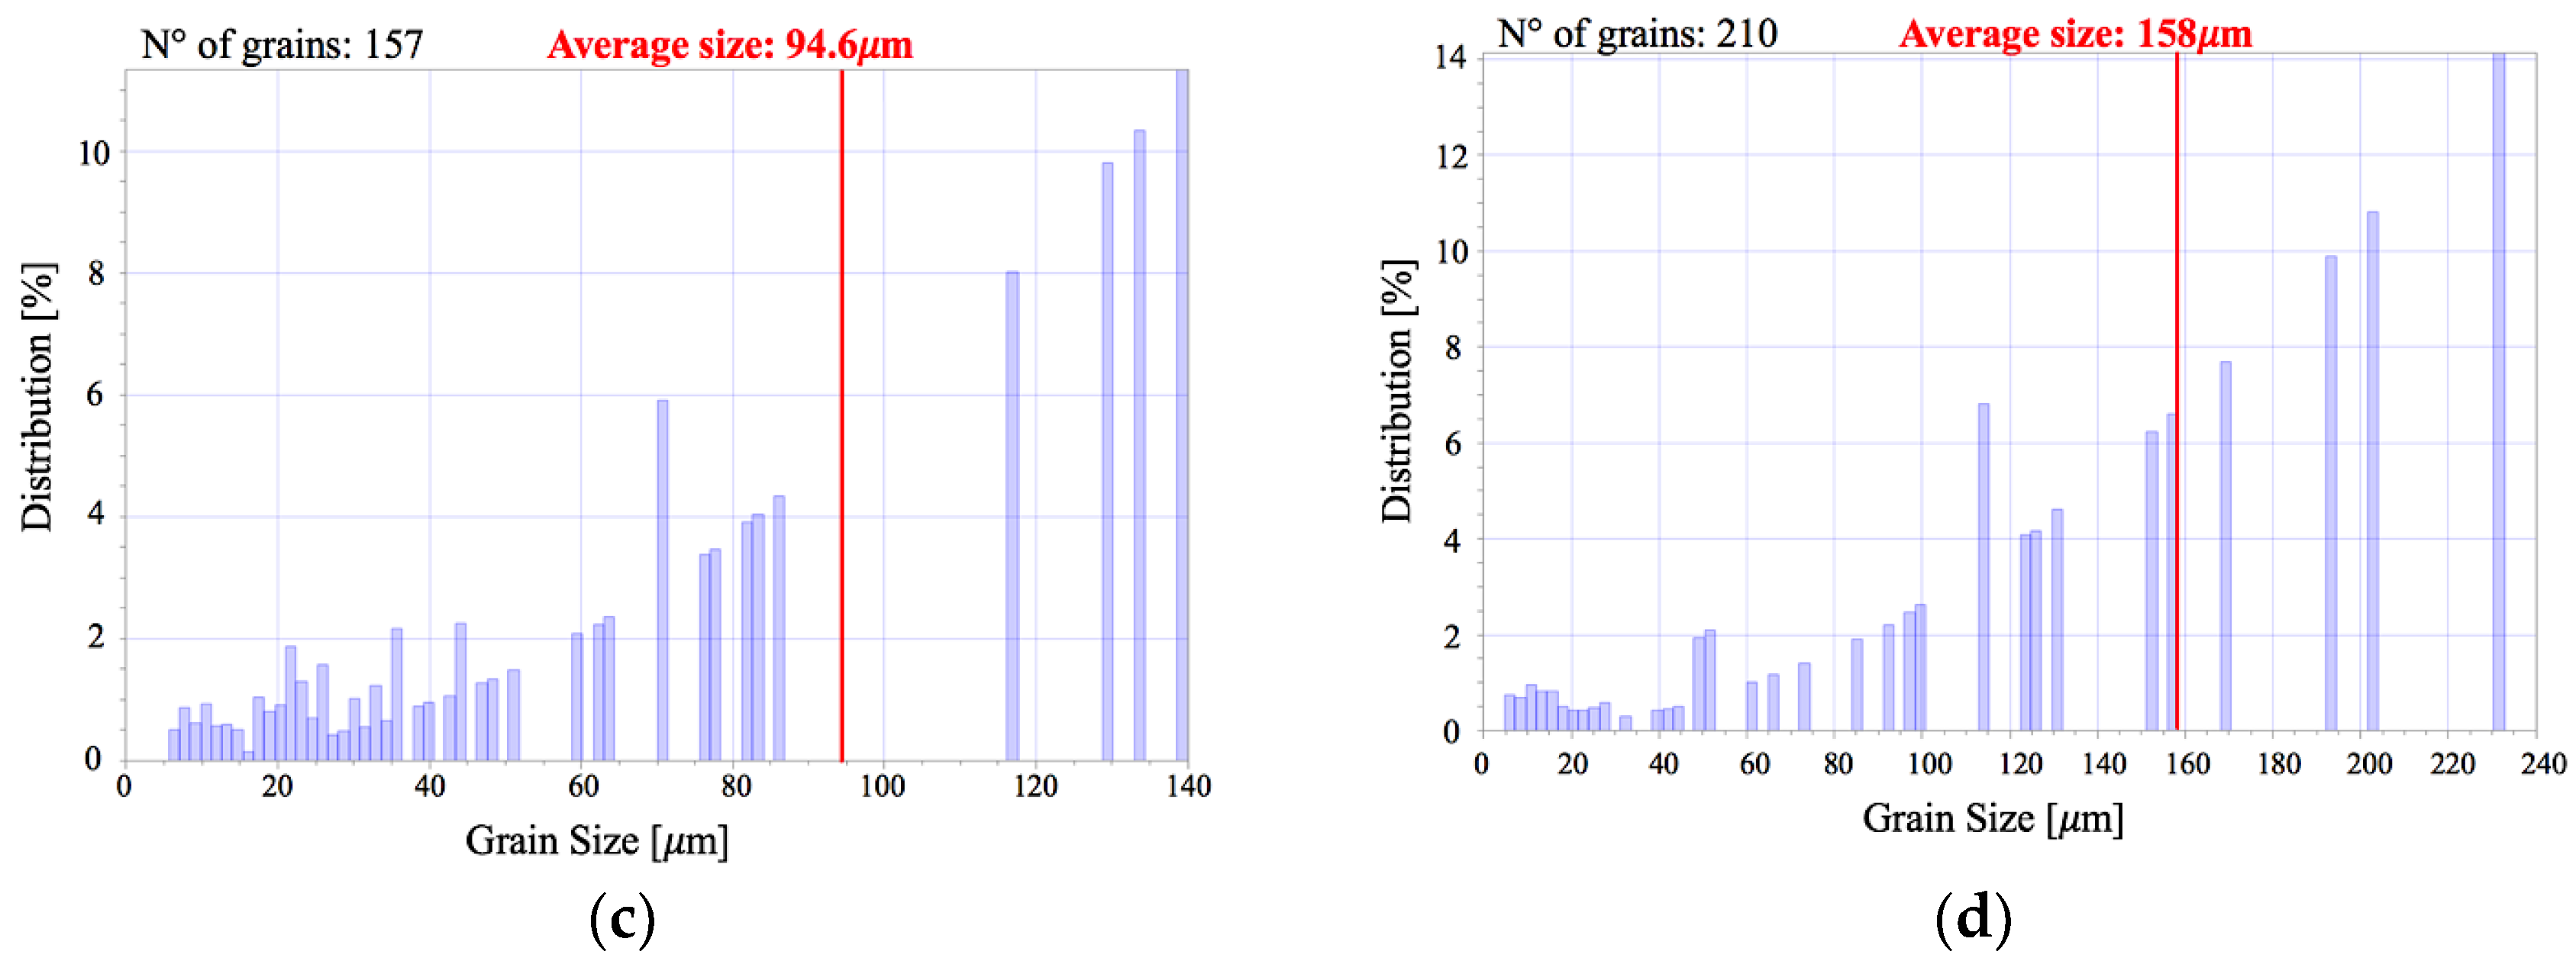
Metals 08 00787 g004
Figure 5. EBSD images of the (a) fusion line and the (b) weld metal. Below the EBSD images, are the distributions of grain size in the respective regions (c,d).
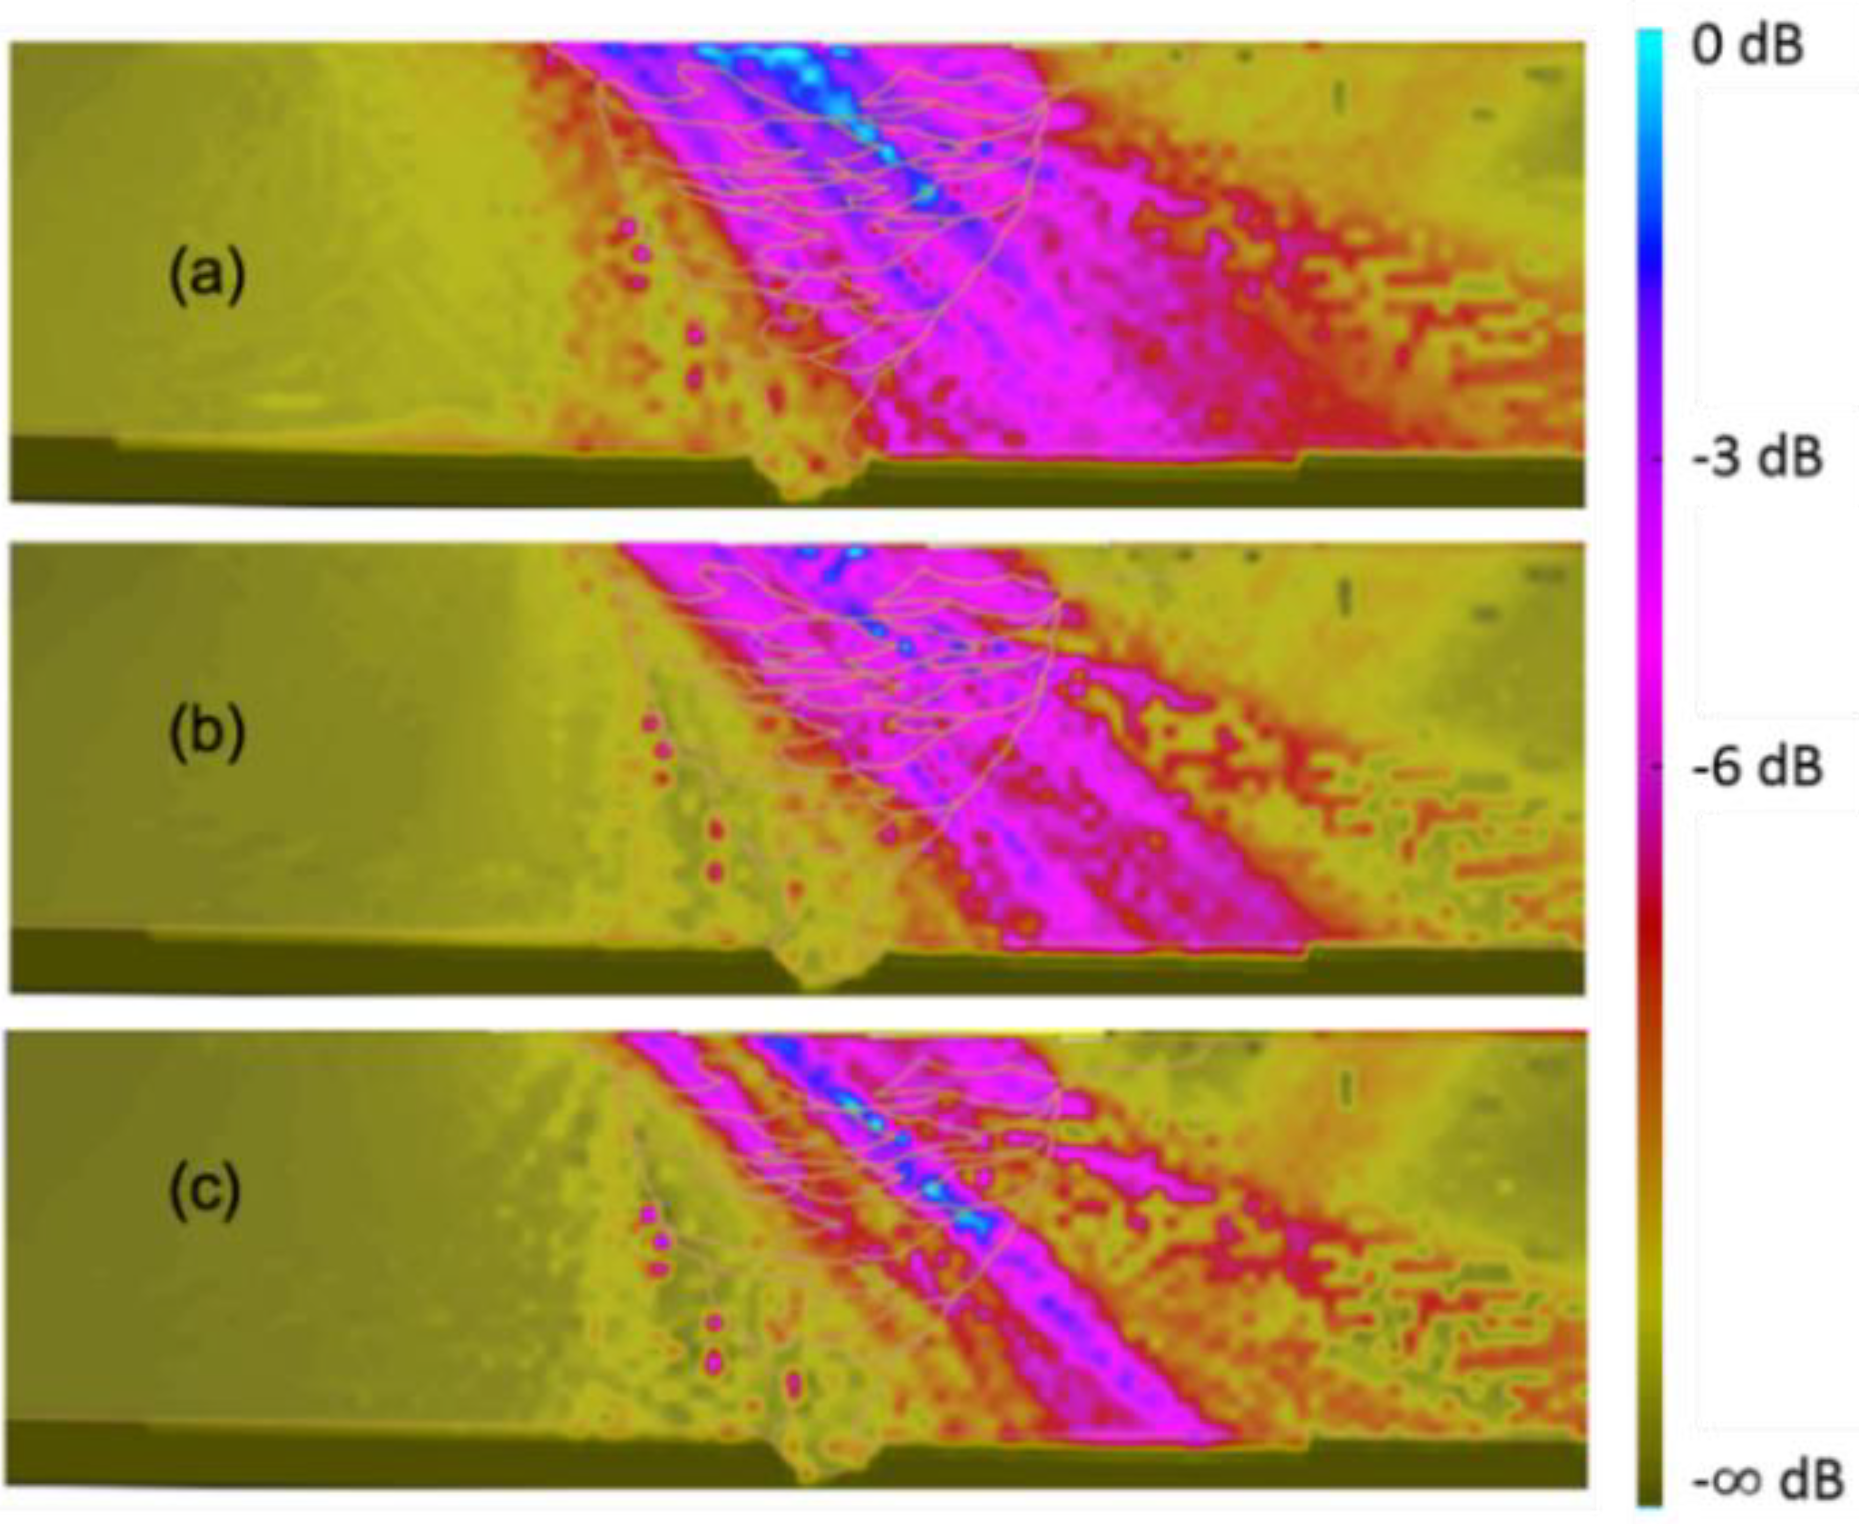
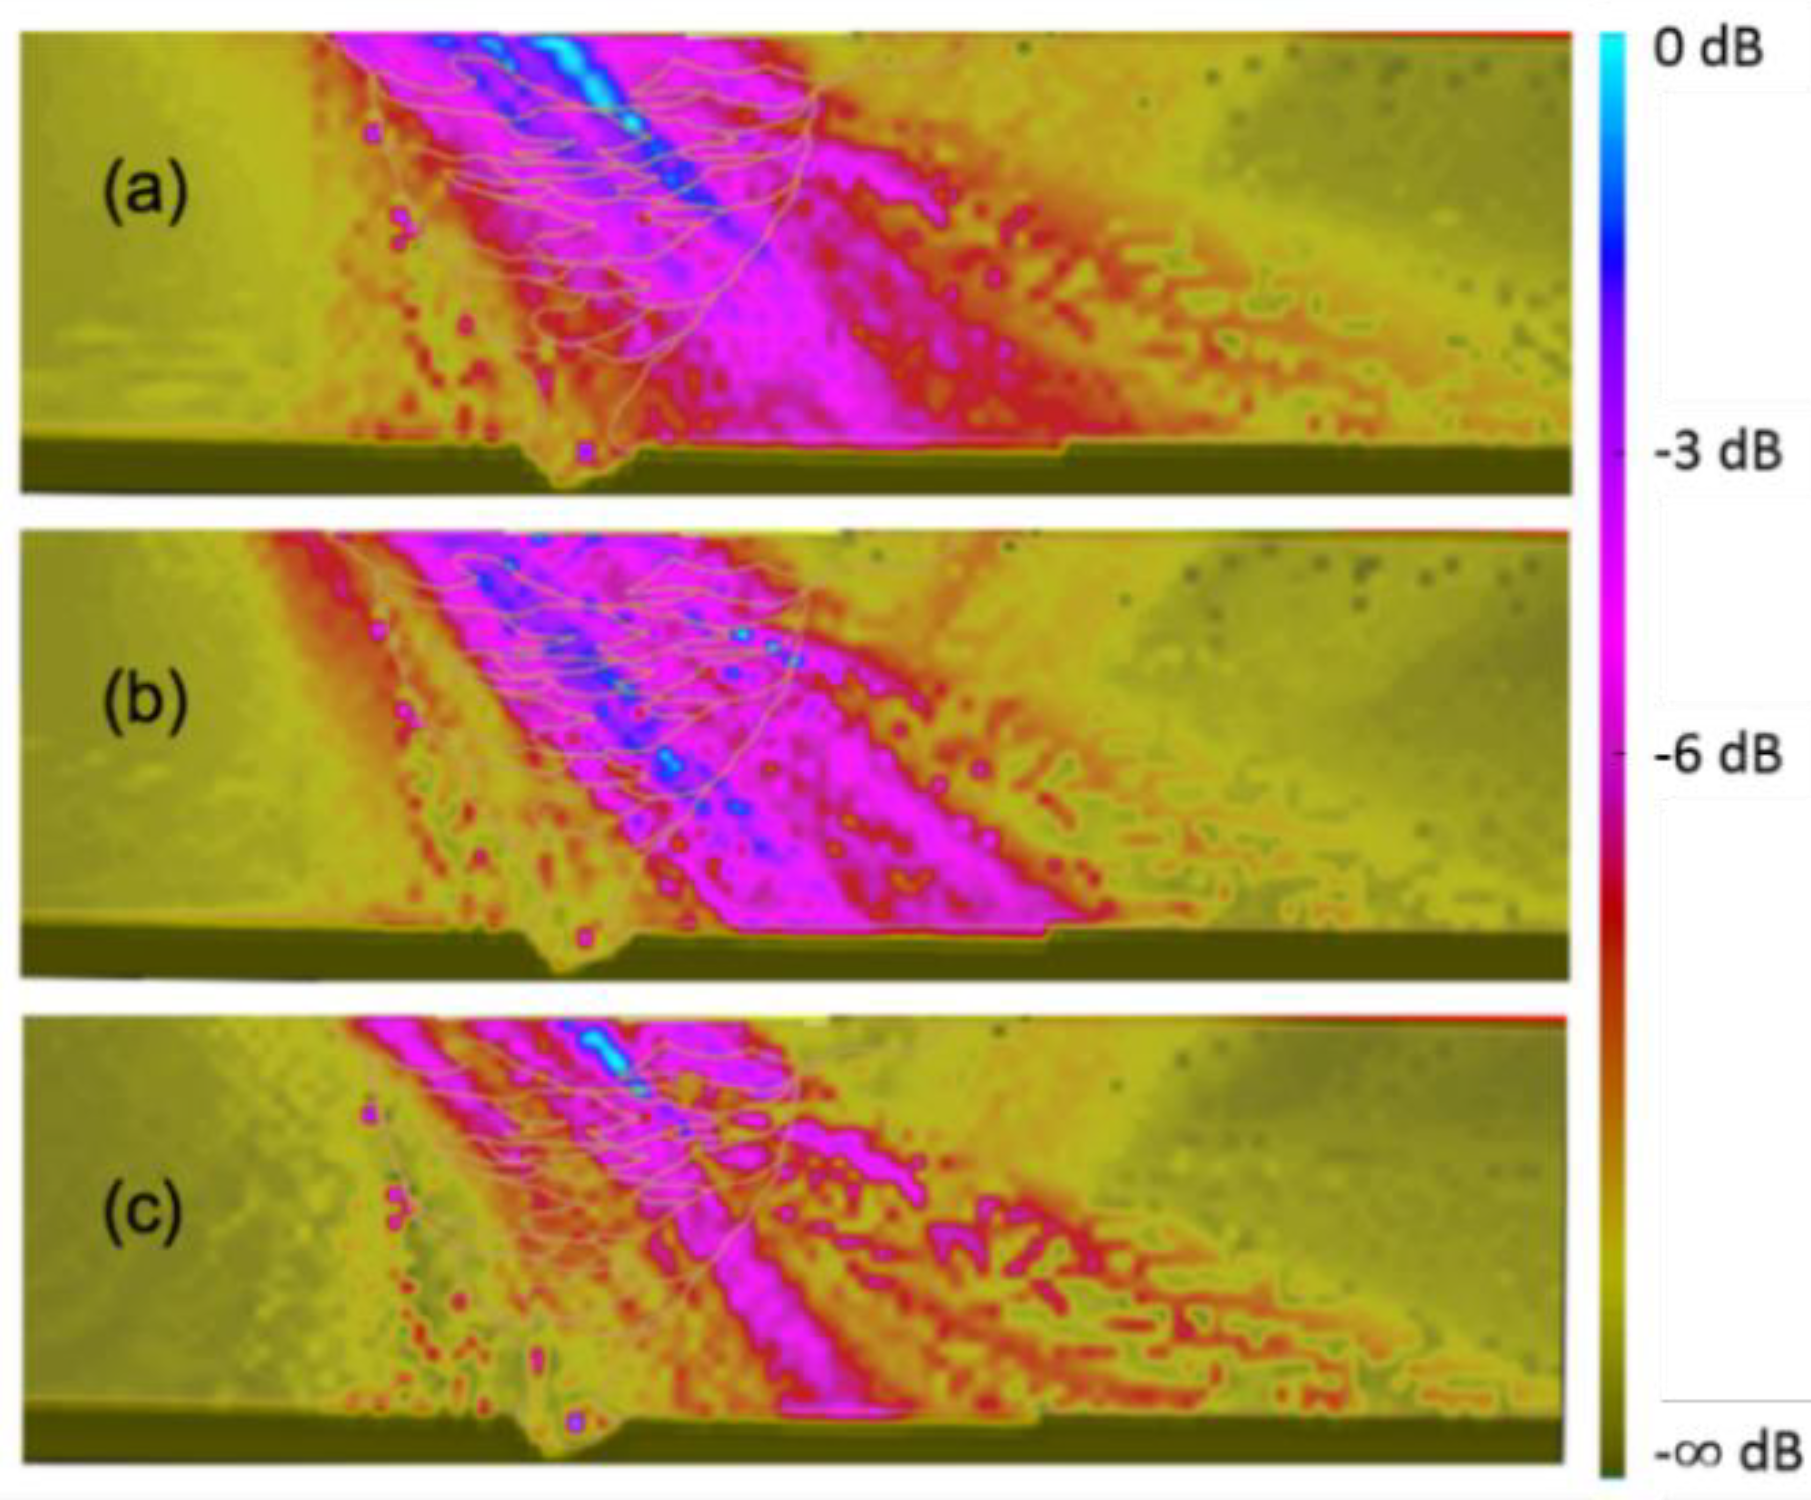
Metals 08 00787 g005aMetals 08 00787 g005b
Figure 6. Longitudinal wave inspection. Scanning angle of 45°, index 23 mm. Number of elements: (a) 16, (b) 24 and (c) 32.
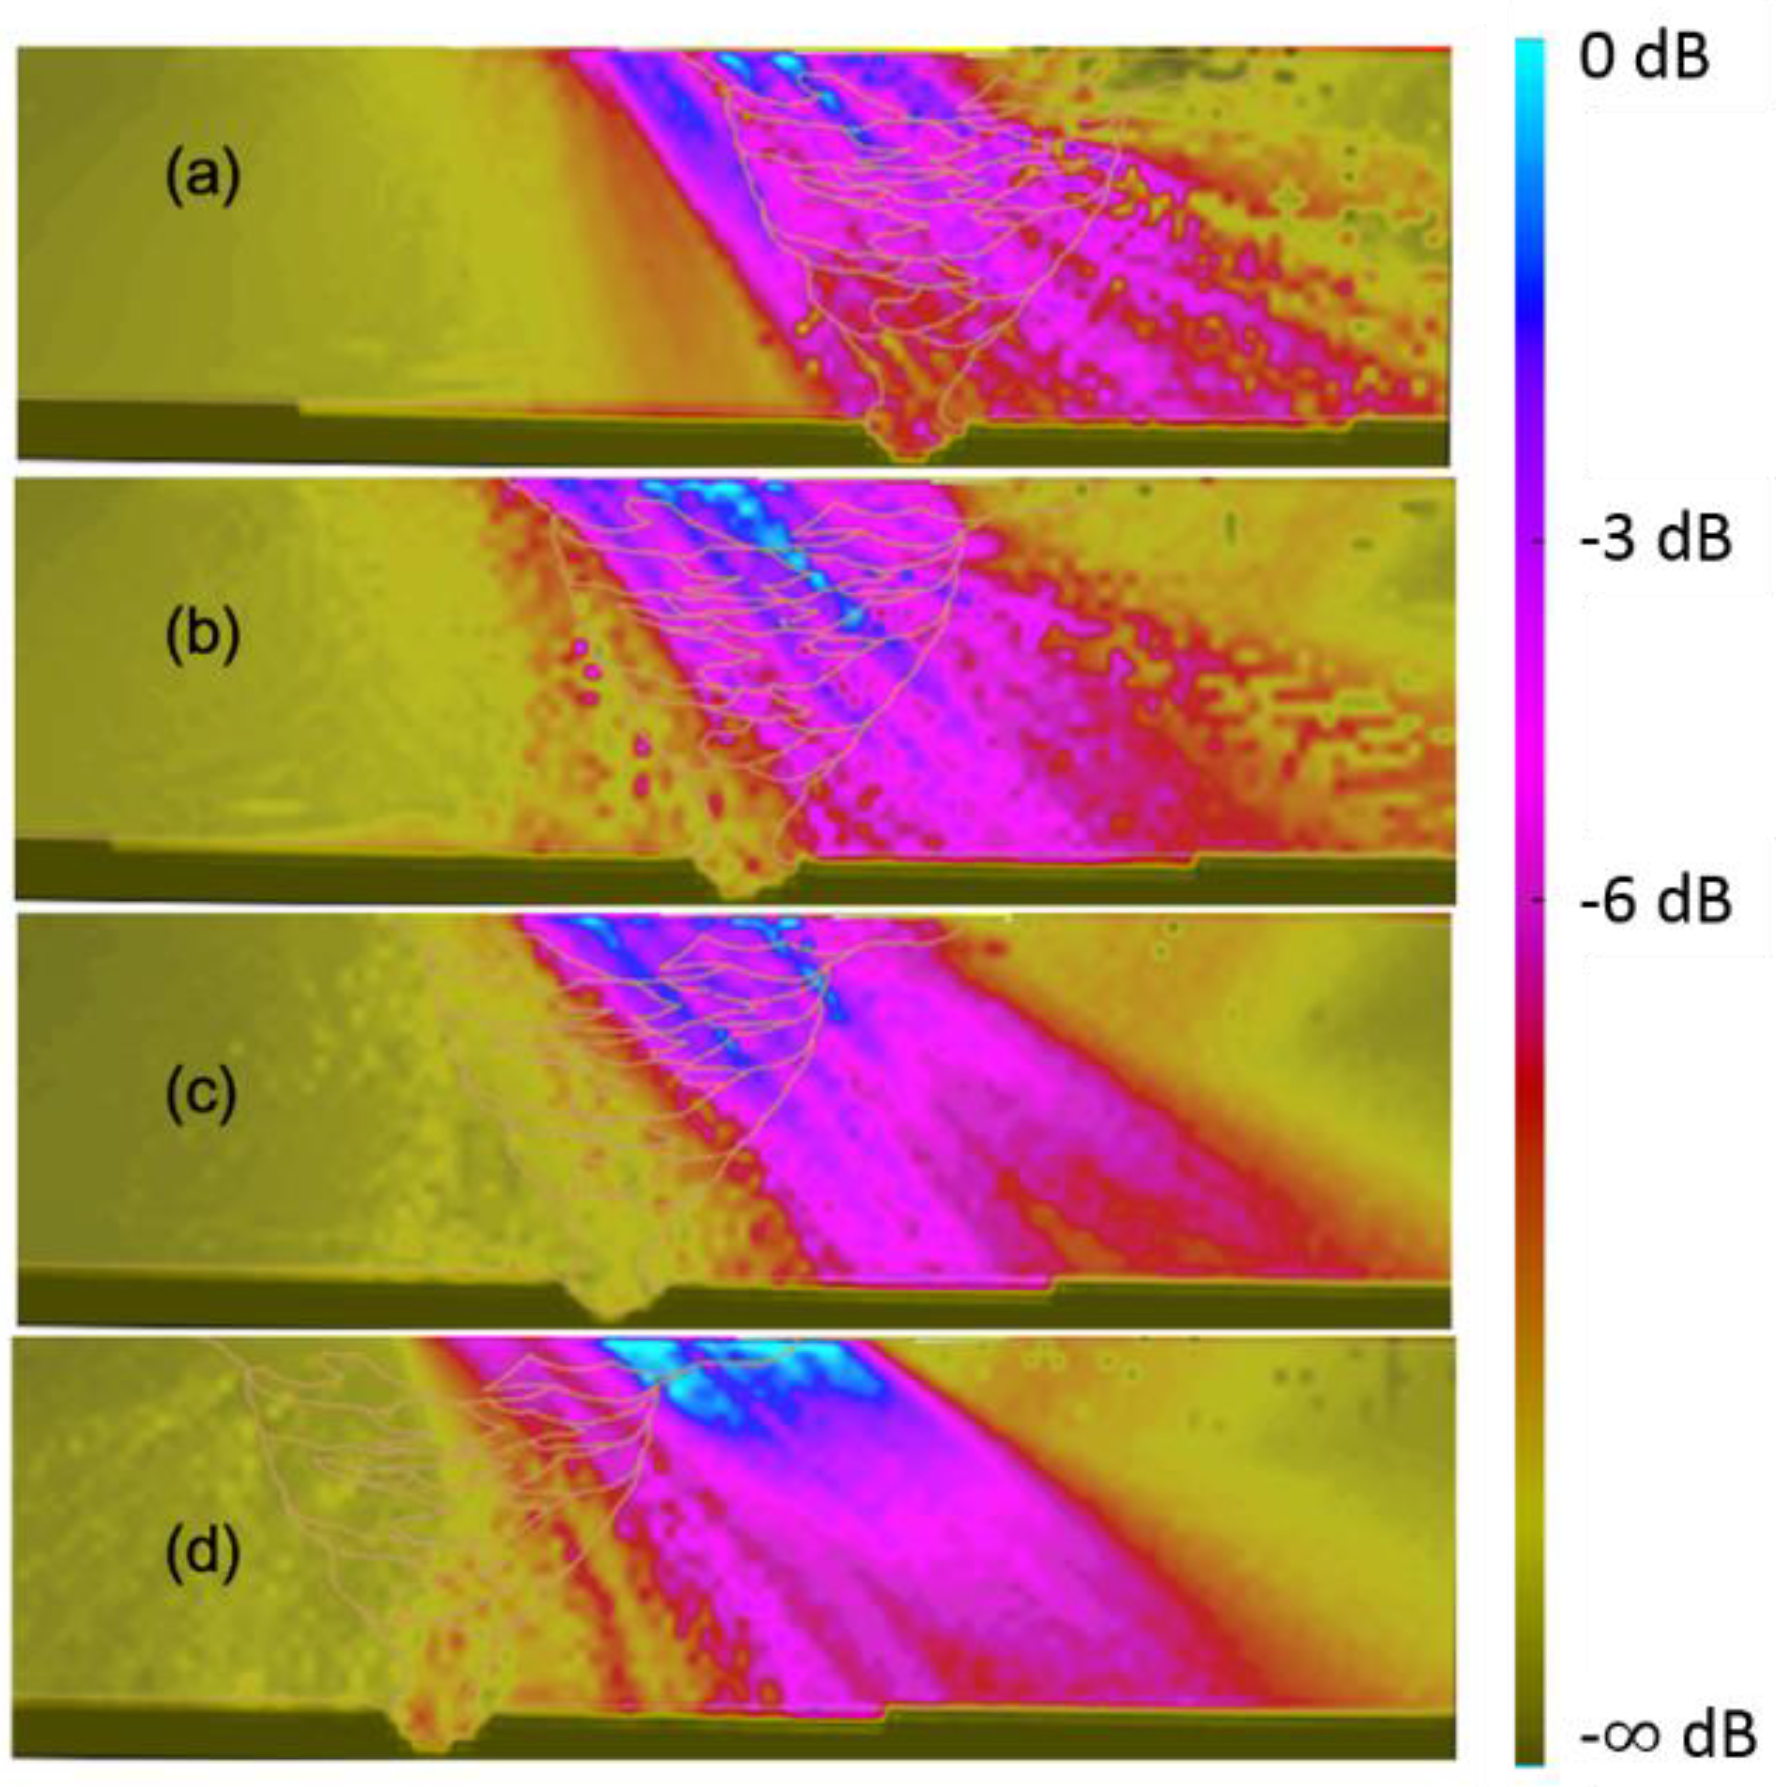
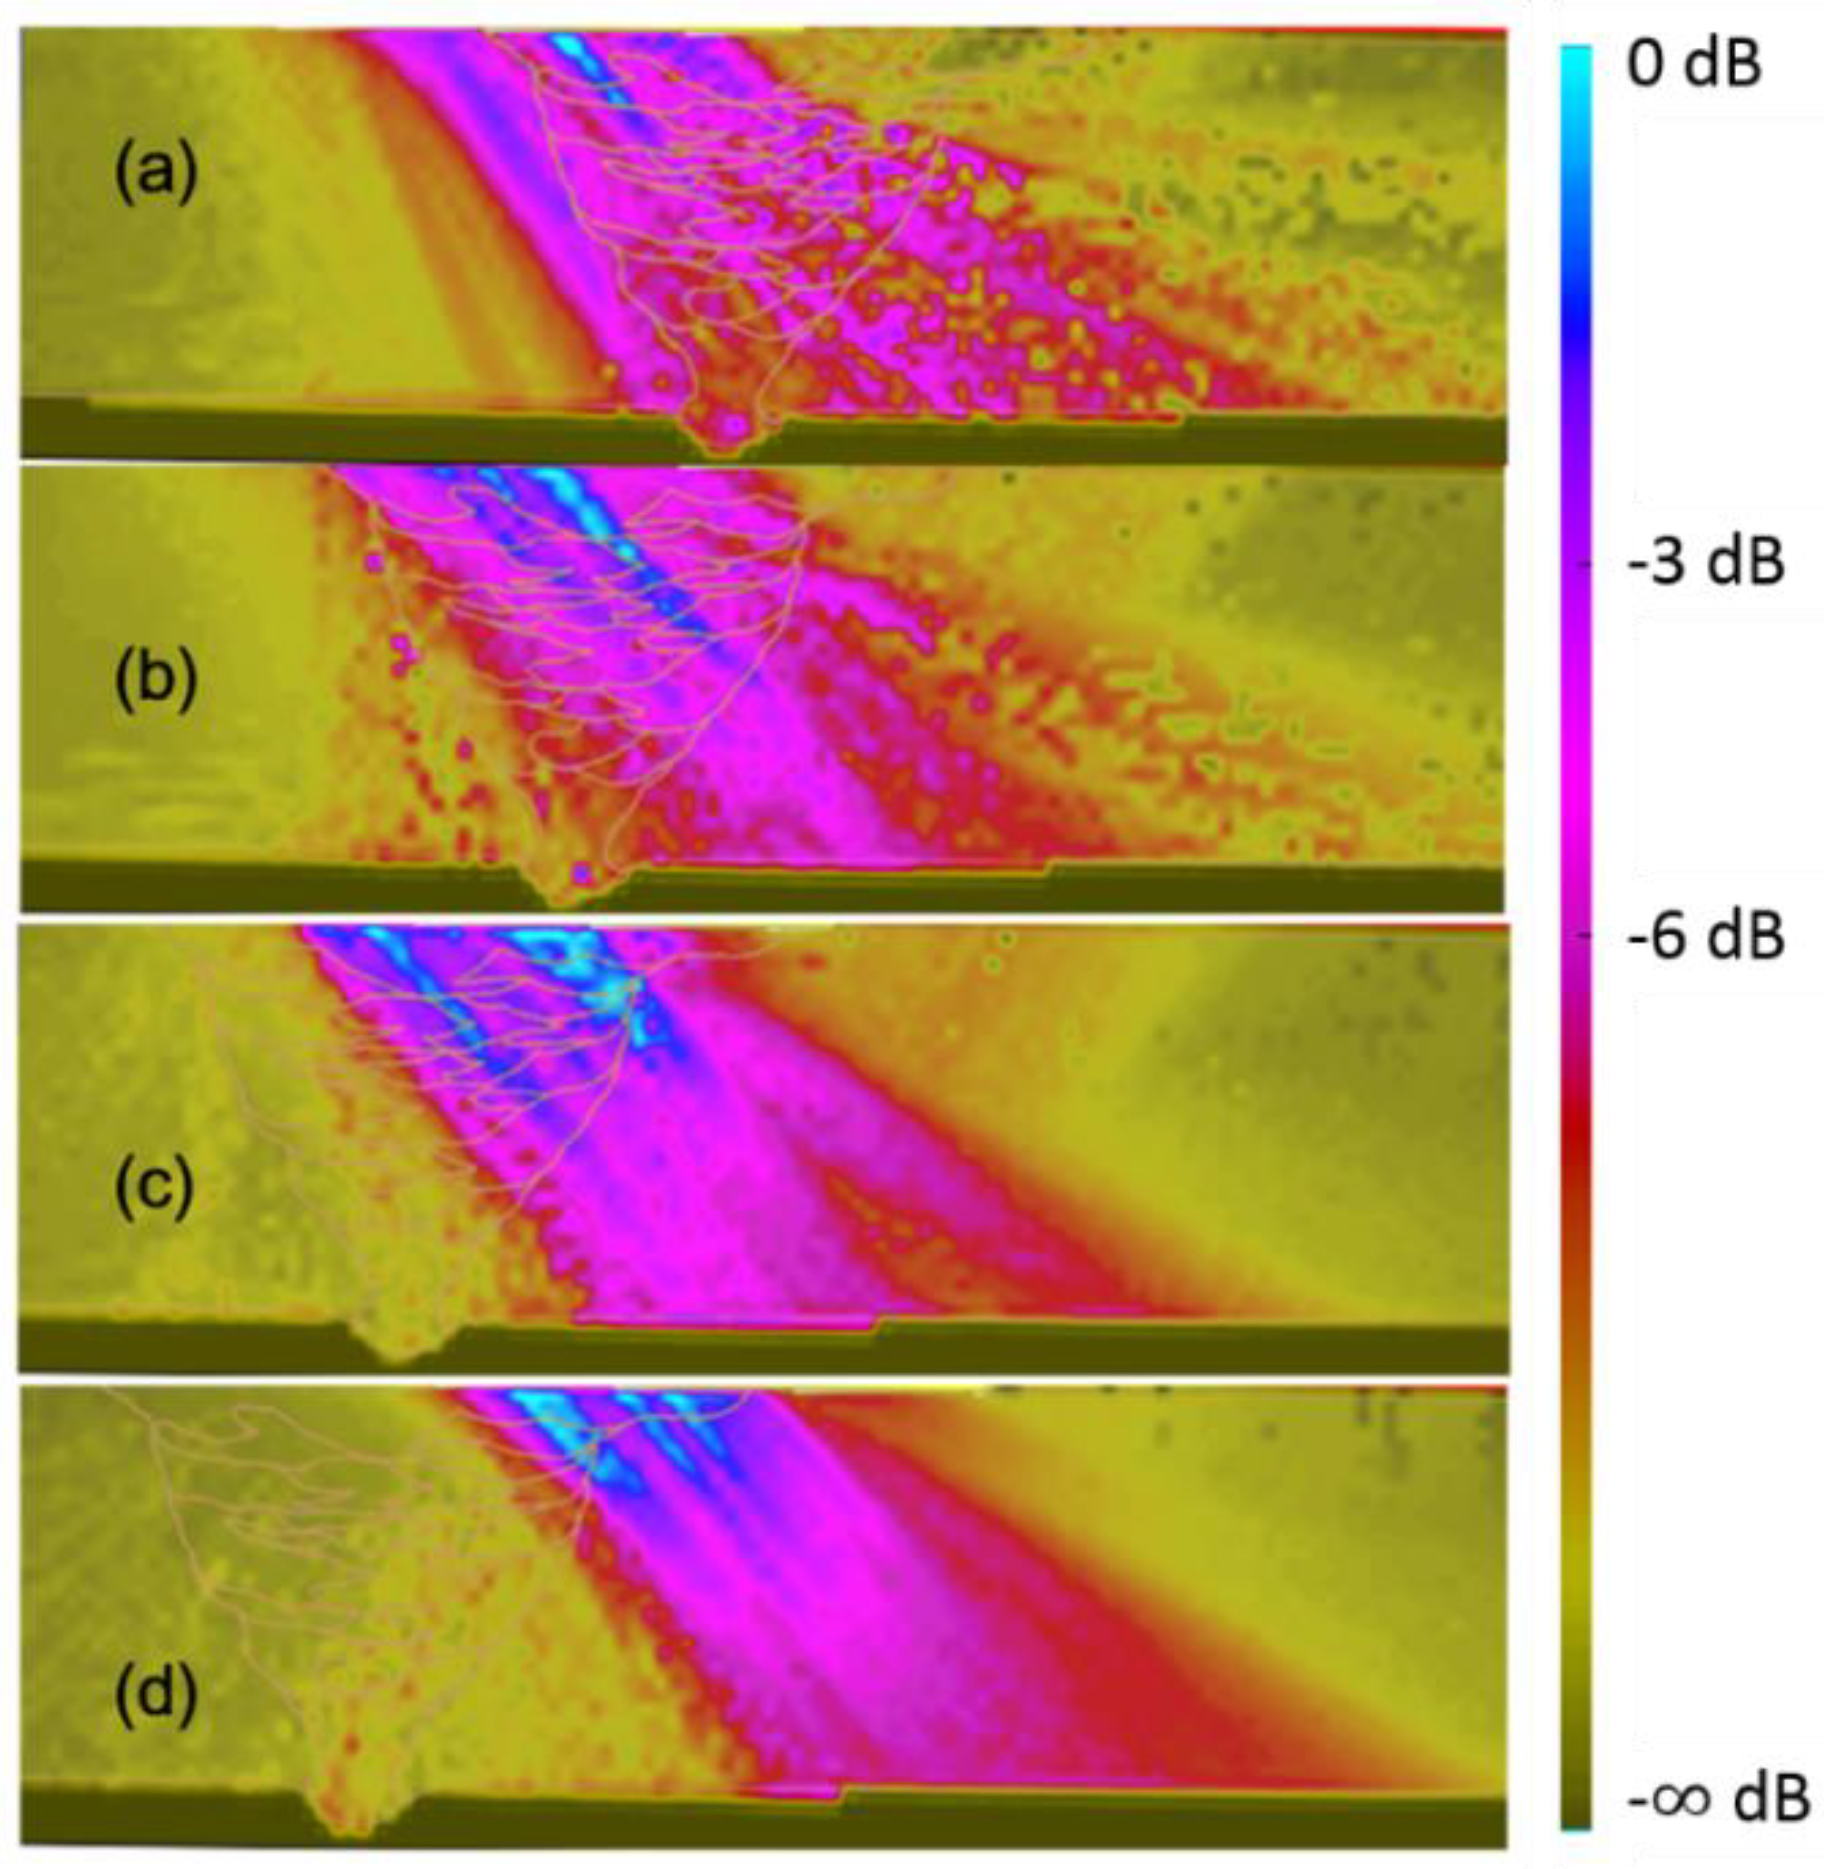
Metals 08 00787 g006
Figure 7. Longitudinal wave inspection. Scanning angle of 45° with 16 elements. Indexes: (a) 10 mm, (b) 23 mm, (c) 35 mm and (d) 48 mm.
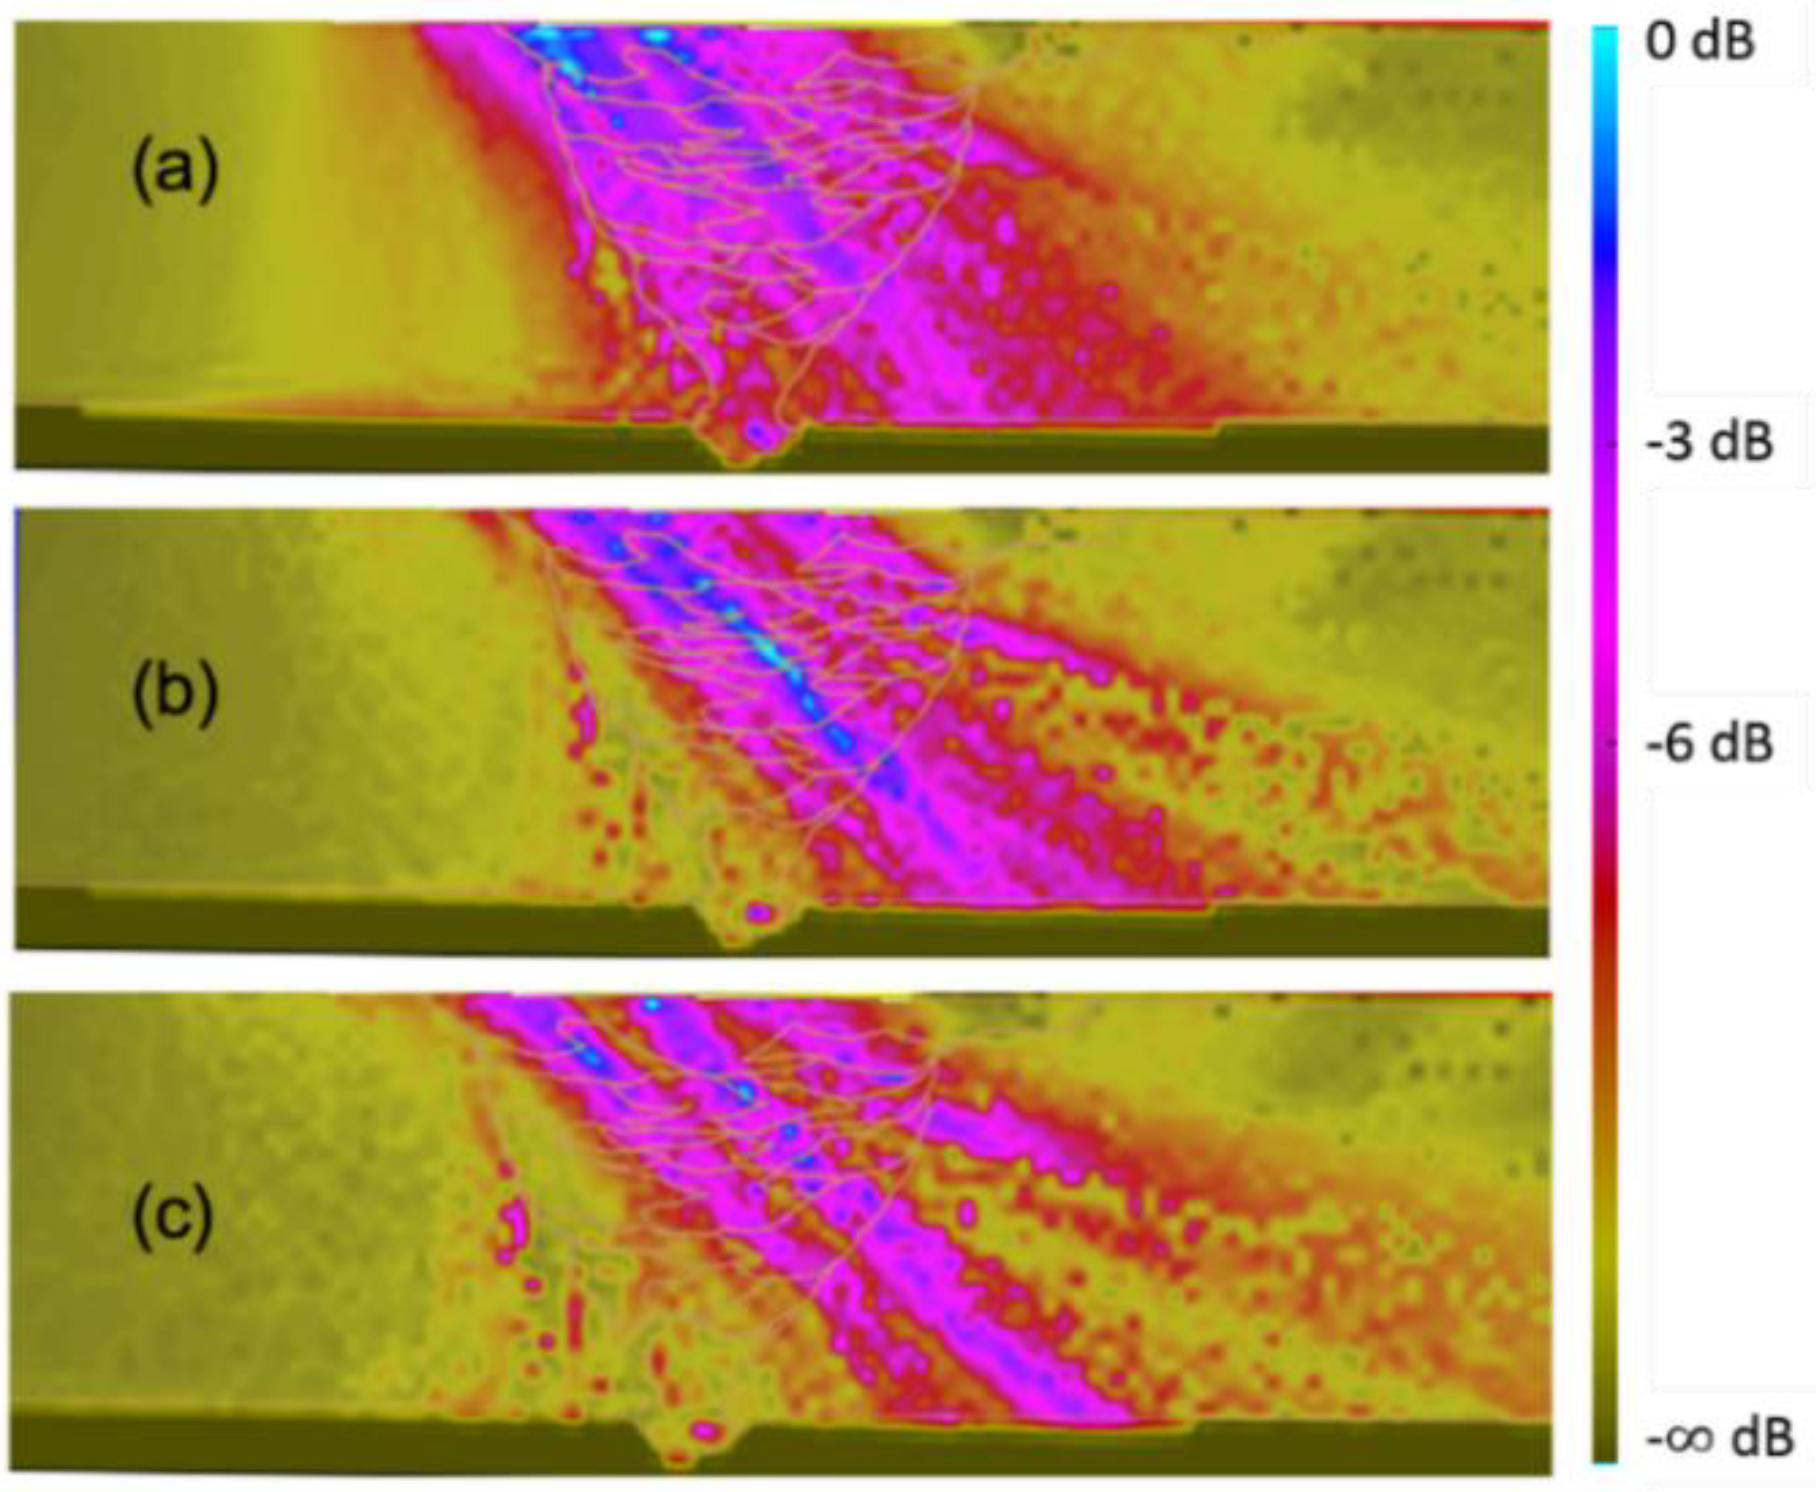
Metals 08 00787 g007
Figure 8. Longitudinal wave inspection. Scanning angle of 48°, index 22 mm. Number of elements: (a) 16, (b) 24 and (c) 32.
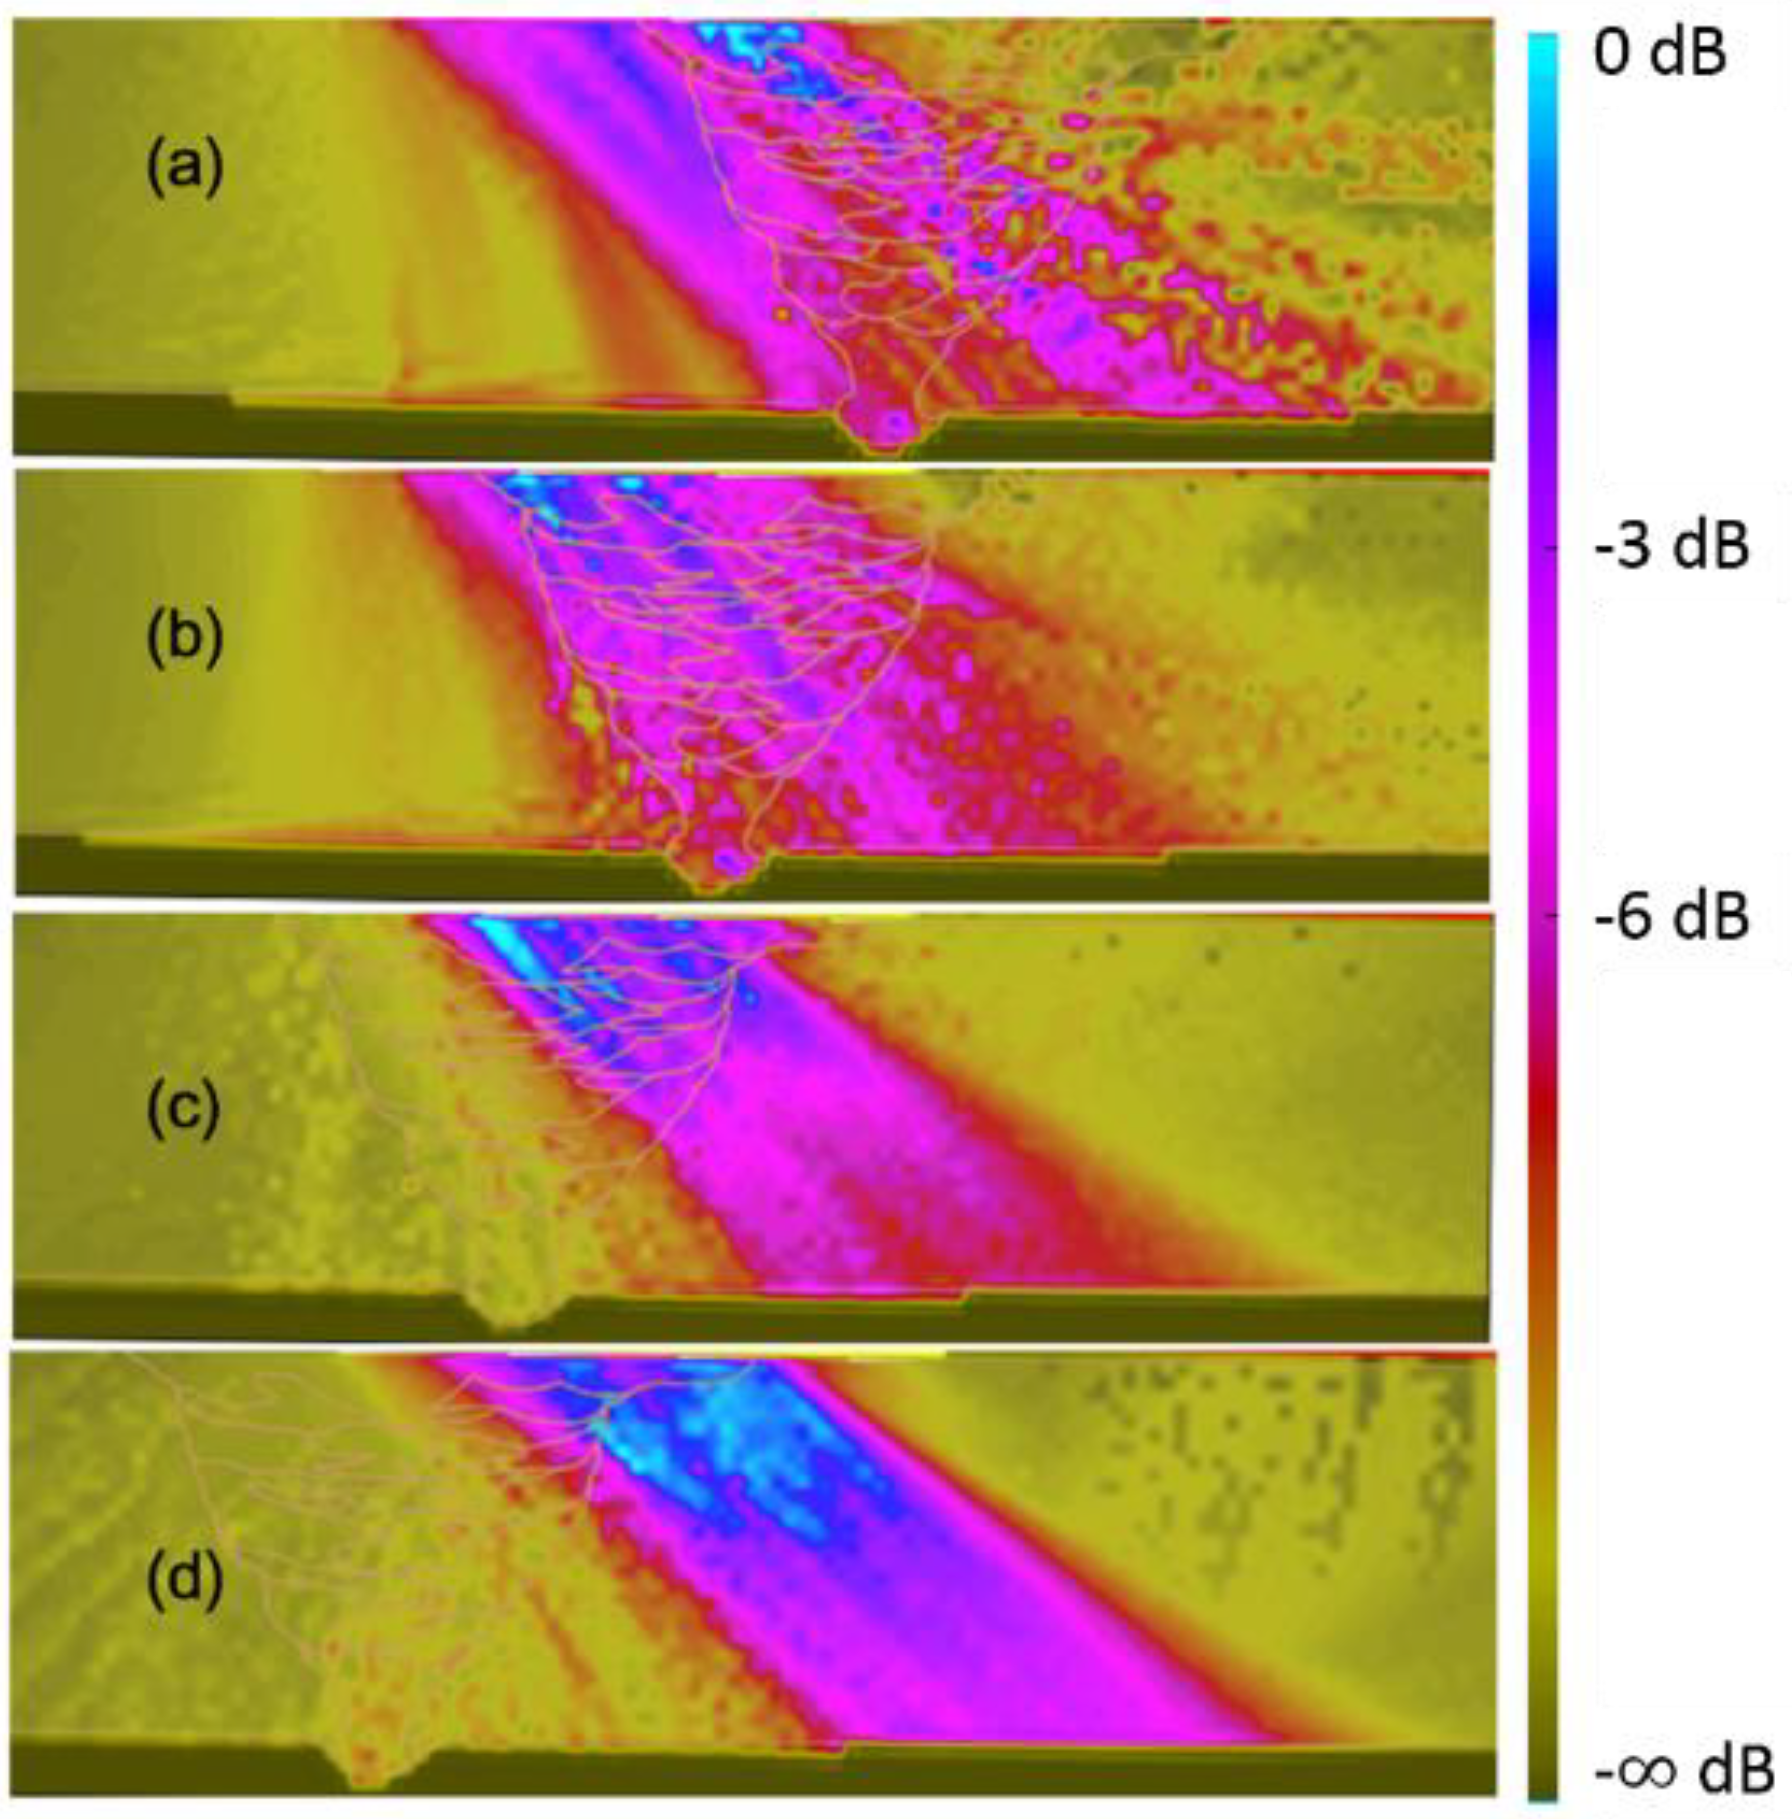
Metals 08 00787 g008
Figure 9. Longitudinal wave inspection. Scanning angle of 48° with 16 elements. Indexes: (a) 8 mm, (b) 22 mm, (c) 35 mm and (d) 49 mm.
Metals 08 00787 g009
Figure 10. Longitudinal wave inspection. Scanning angle of 52°, index 18 mm. Number of elements: (a) 16, (b) 24 and (c) 32.
Metals 08 00787 g010
Figure 11. Longitudinal wave inspection. Scanning angle of 52°, with 16 elements. Indexes: (a) 3 mm, (b) 18 mm, (c) 32 mm and (d) 46 mm.
Metals 08 00787 g011
Figure 12. Simulation of sensitivity calibration with longitudinal waves in the calibration block, withdrawn from the 9% Ni quenched and tempered steel pipe joint welded with GTAW and SMAW processes using Ni-based superalloy 625 as the filler metal.
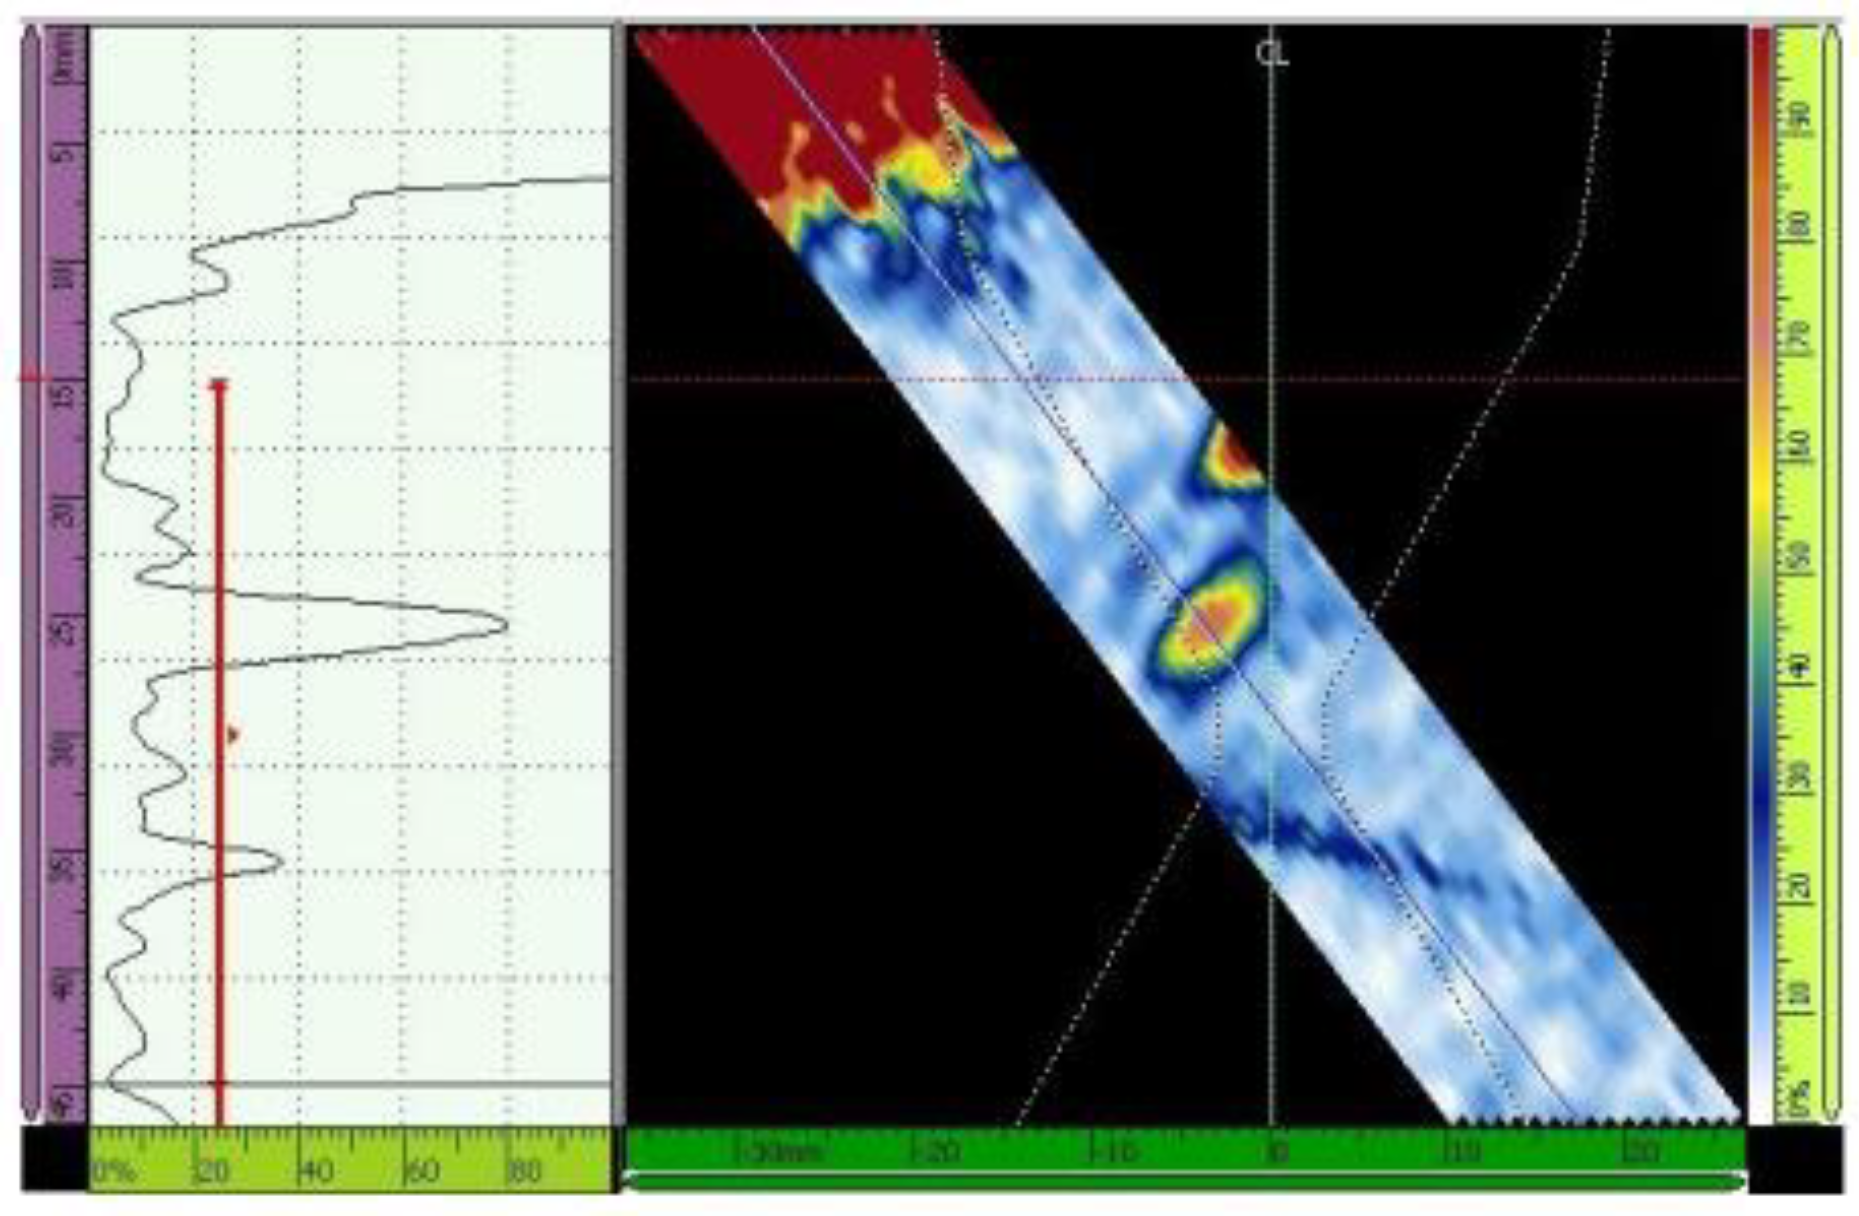
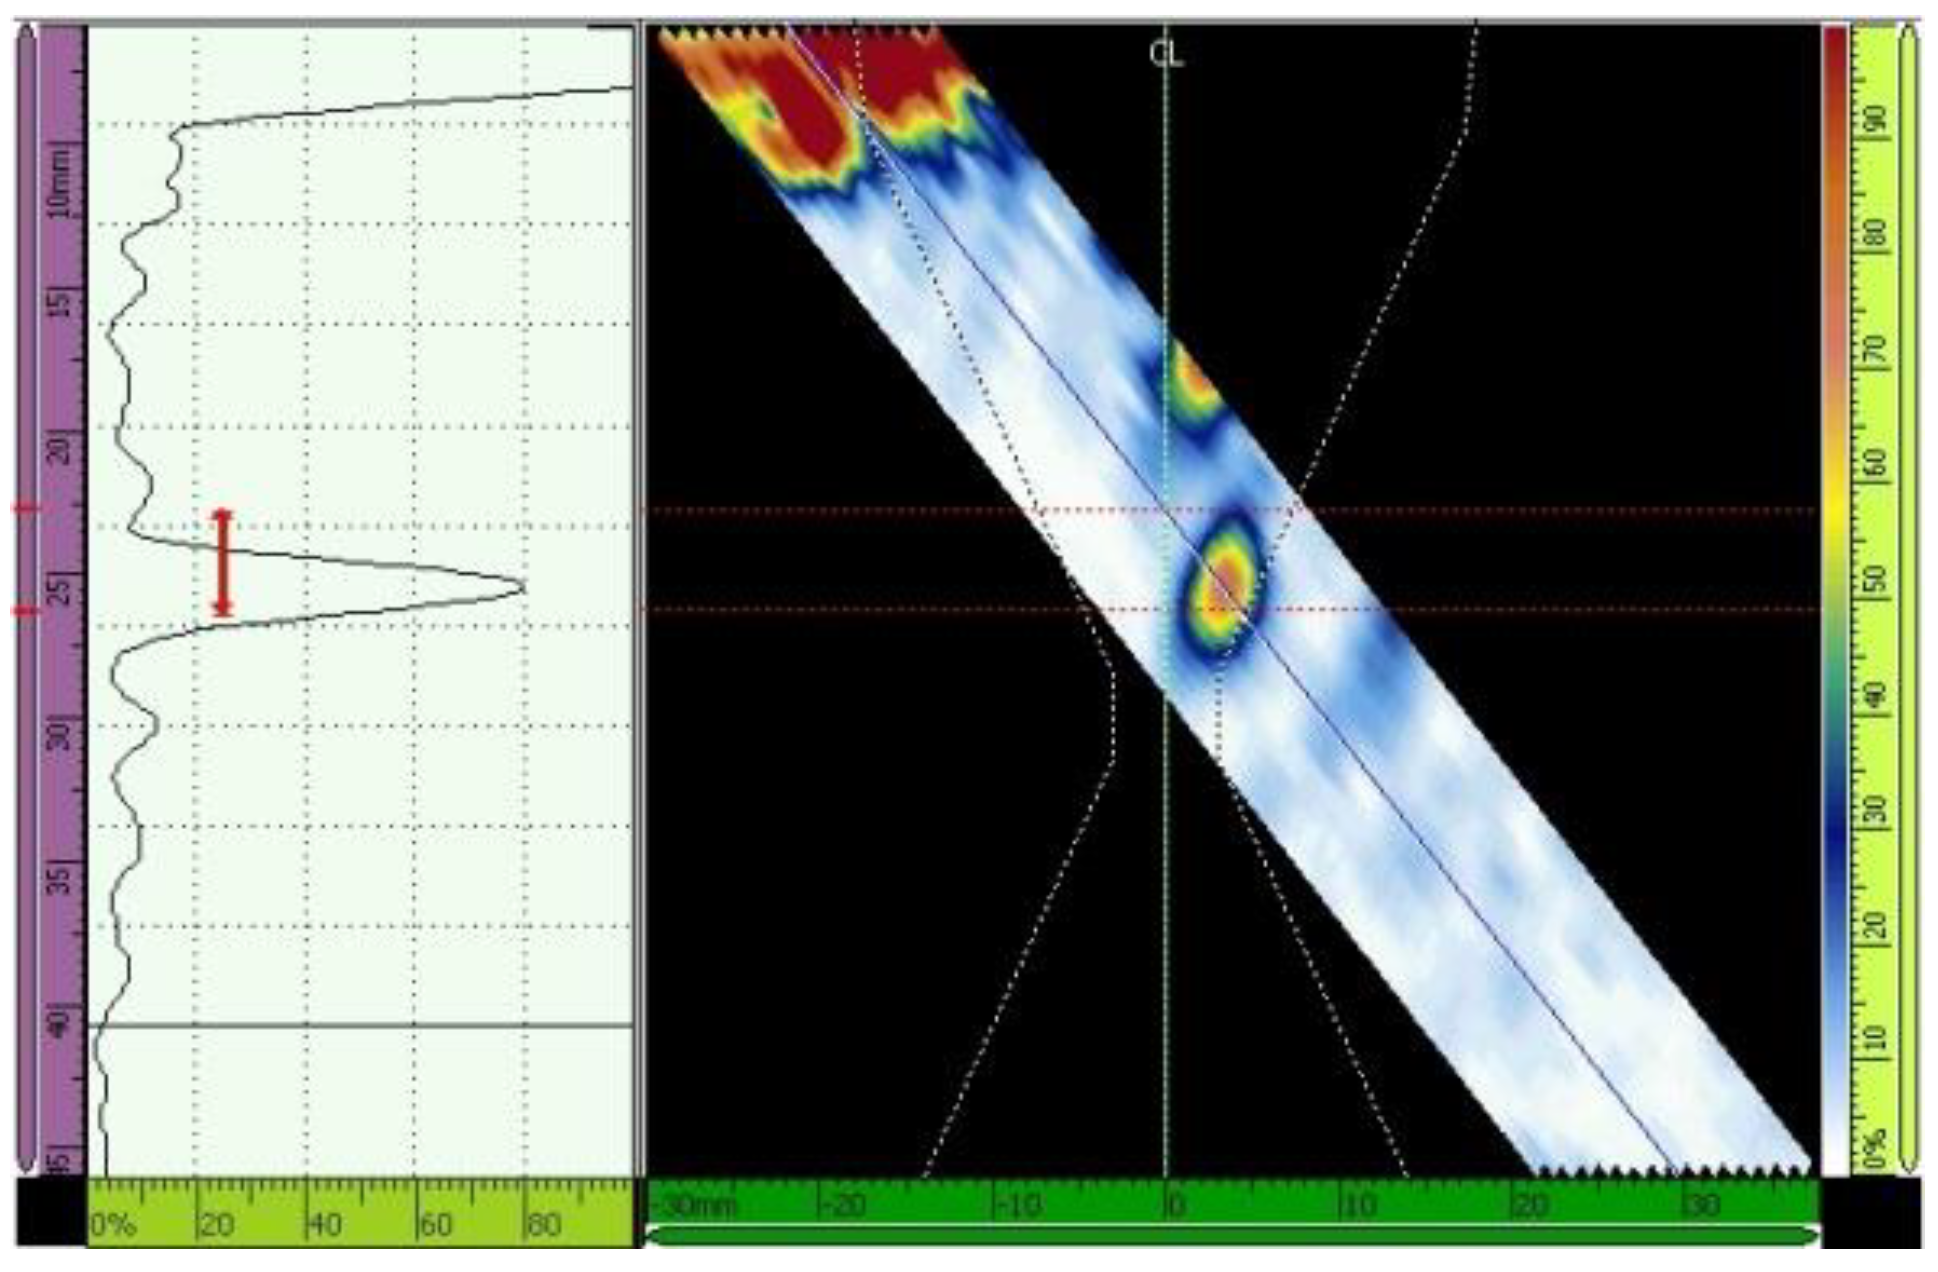
Metals 08 00787 g012
Figure 13. Echo (maximized to 80% of the screen height) from the third hole. Scanning angle of 45° and 16 active elements. Primary gain = 50 dB.
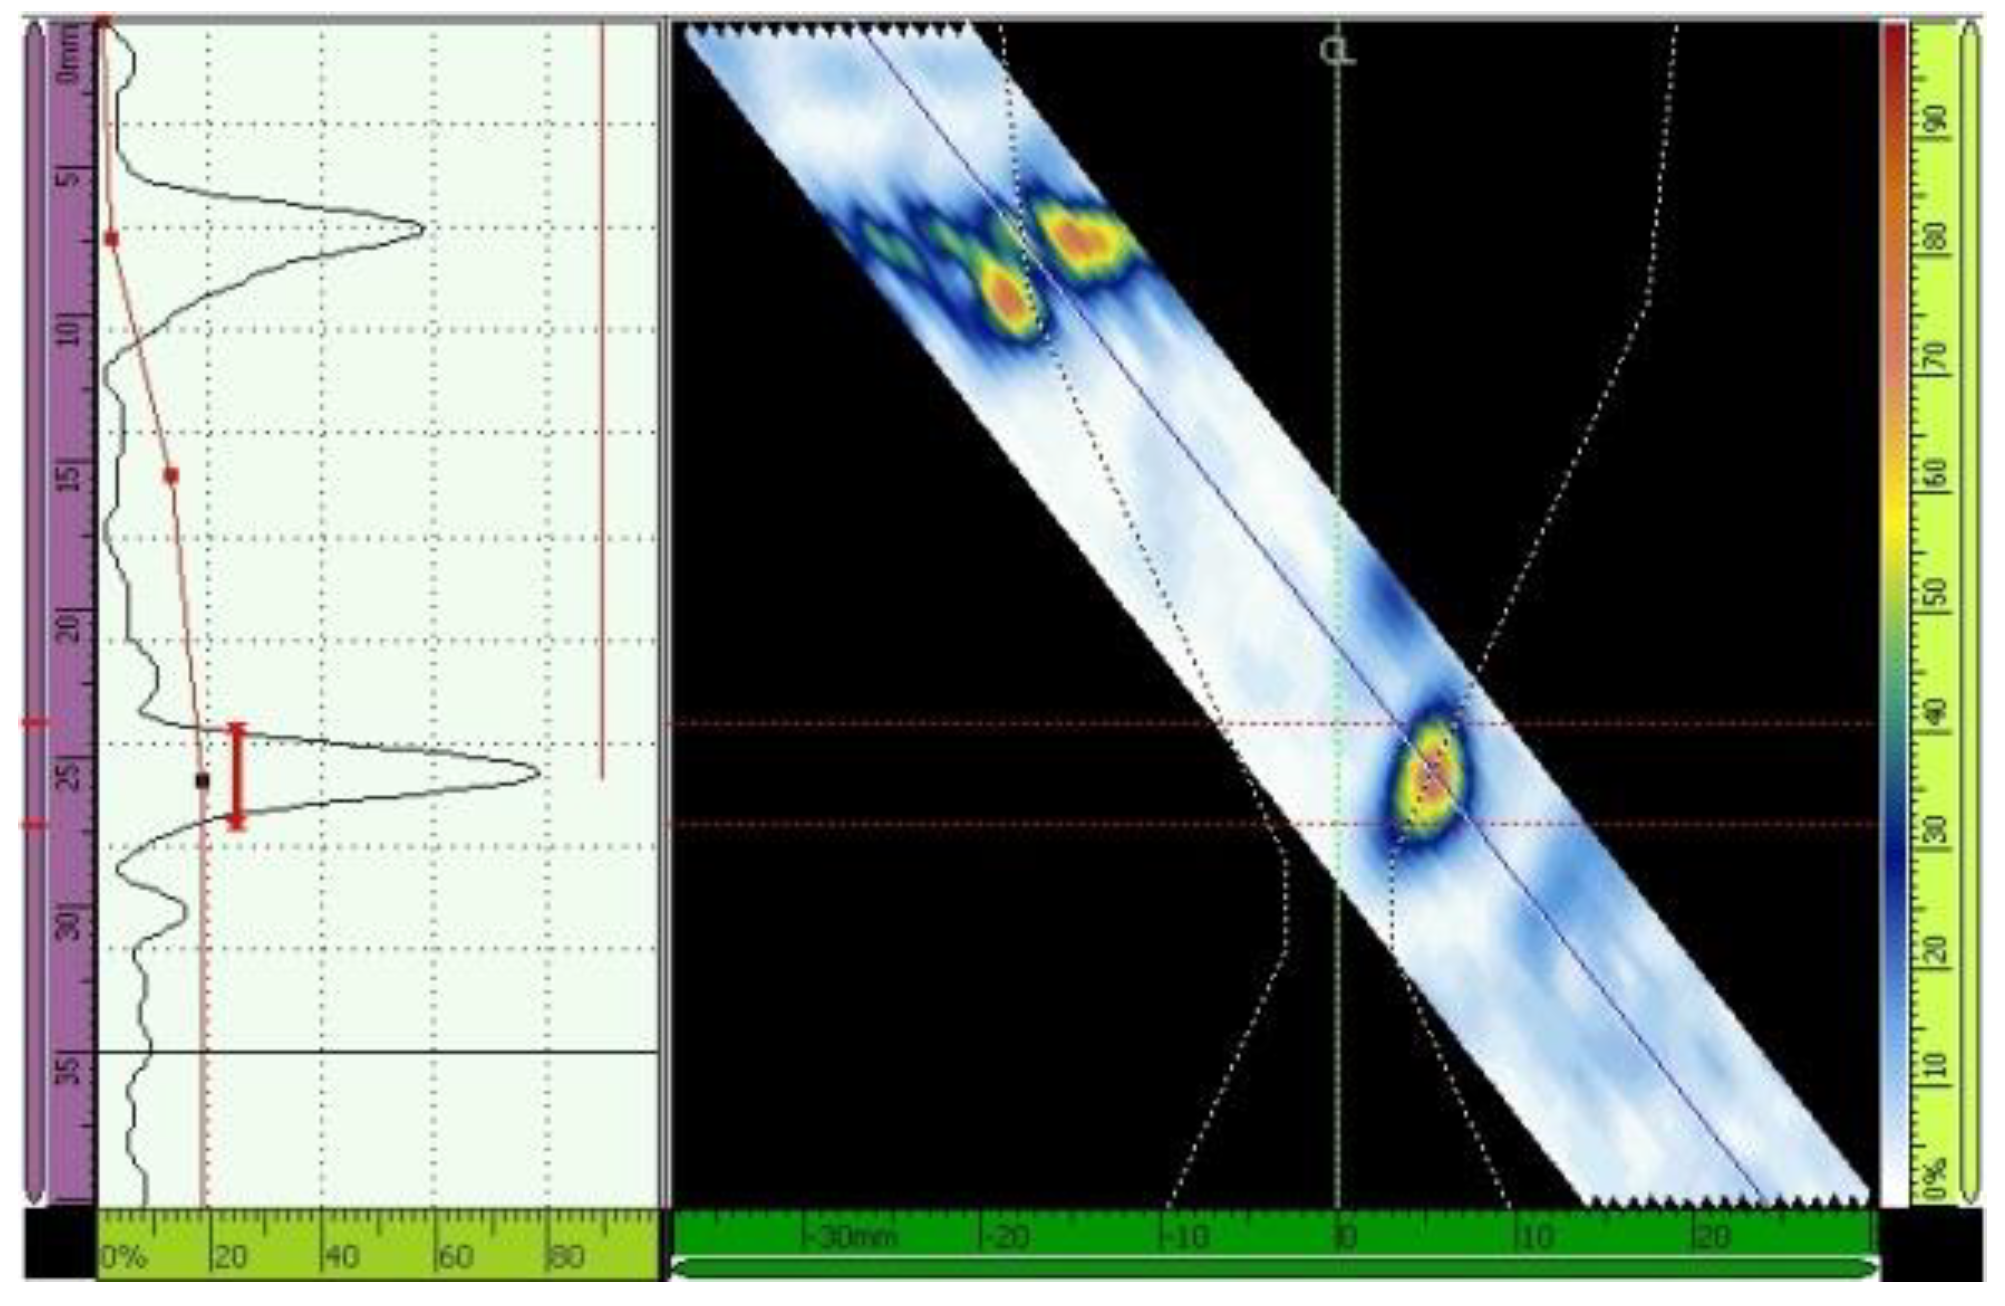
Metals 08 00787 g013
Figure 14. Time correct gain adjustment. Scanning angle of 45°, 16 active elements. Primary gain = 22.8 dB.
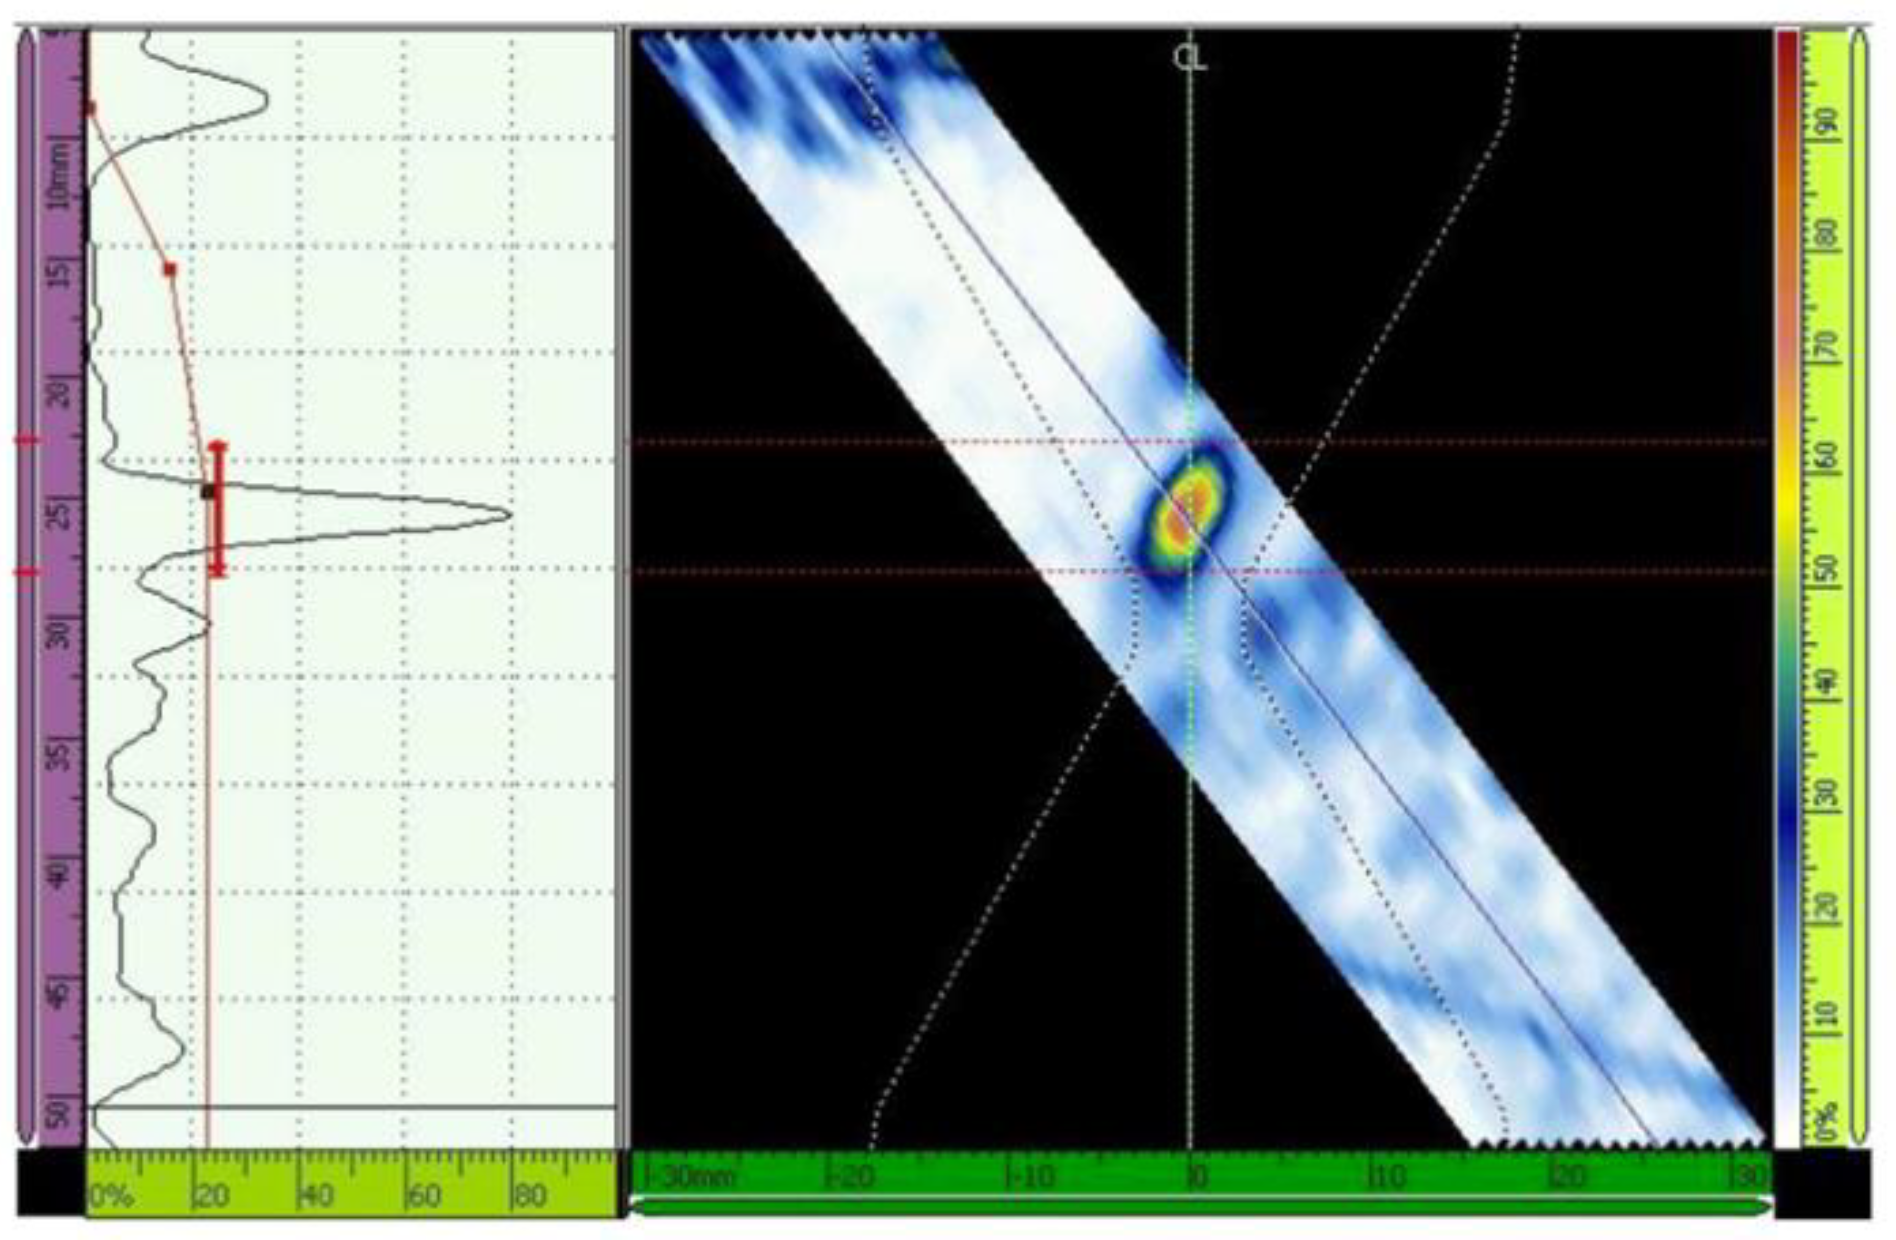
Metals 08 00787 g014
Figure 15. Echo (maximized to 80% of the screen height) from the third hole. Scanning angle of 48°, 16 active elements. Primary gain = 40.1 dB.
Metals 08 00787 g015
Figure 16. Time corrected gain adjustment. Scanning angle of 48°, 16 active elements. Primary gain = 22.6 dB.
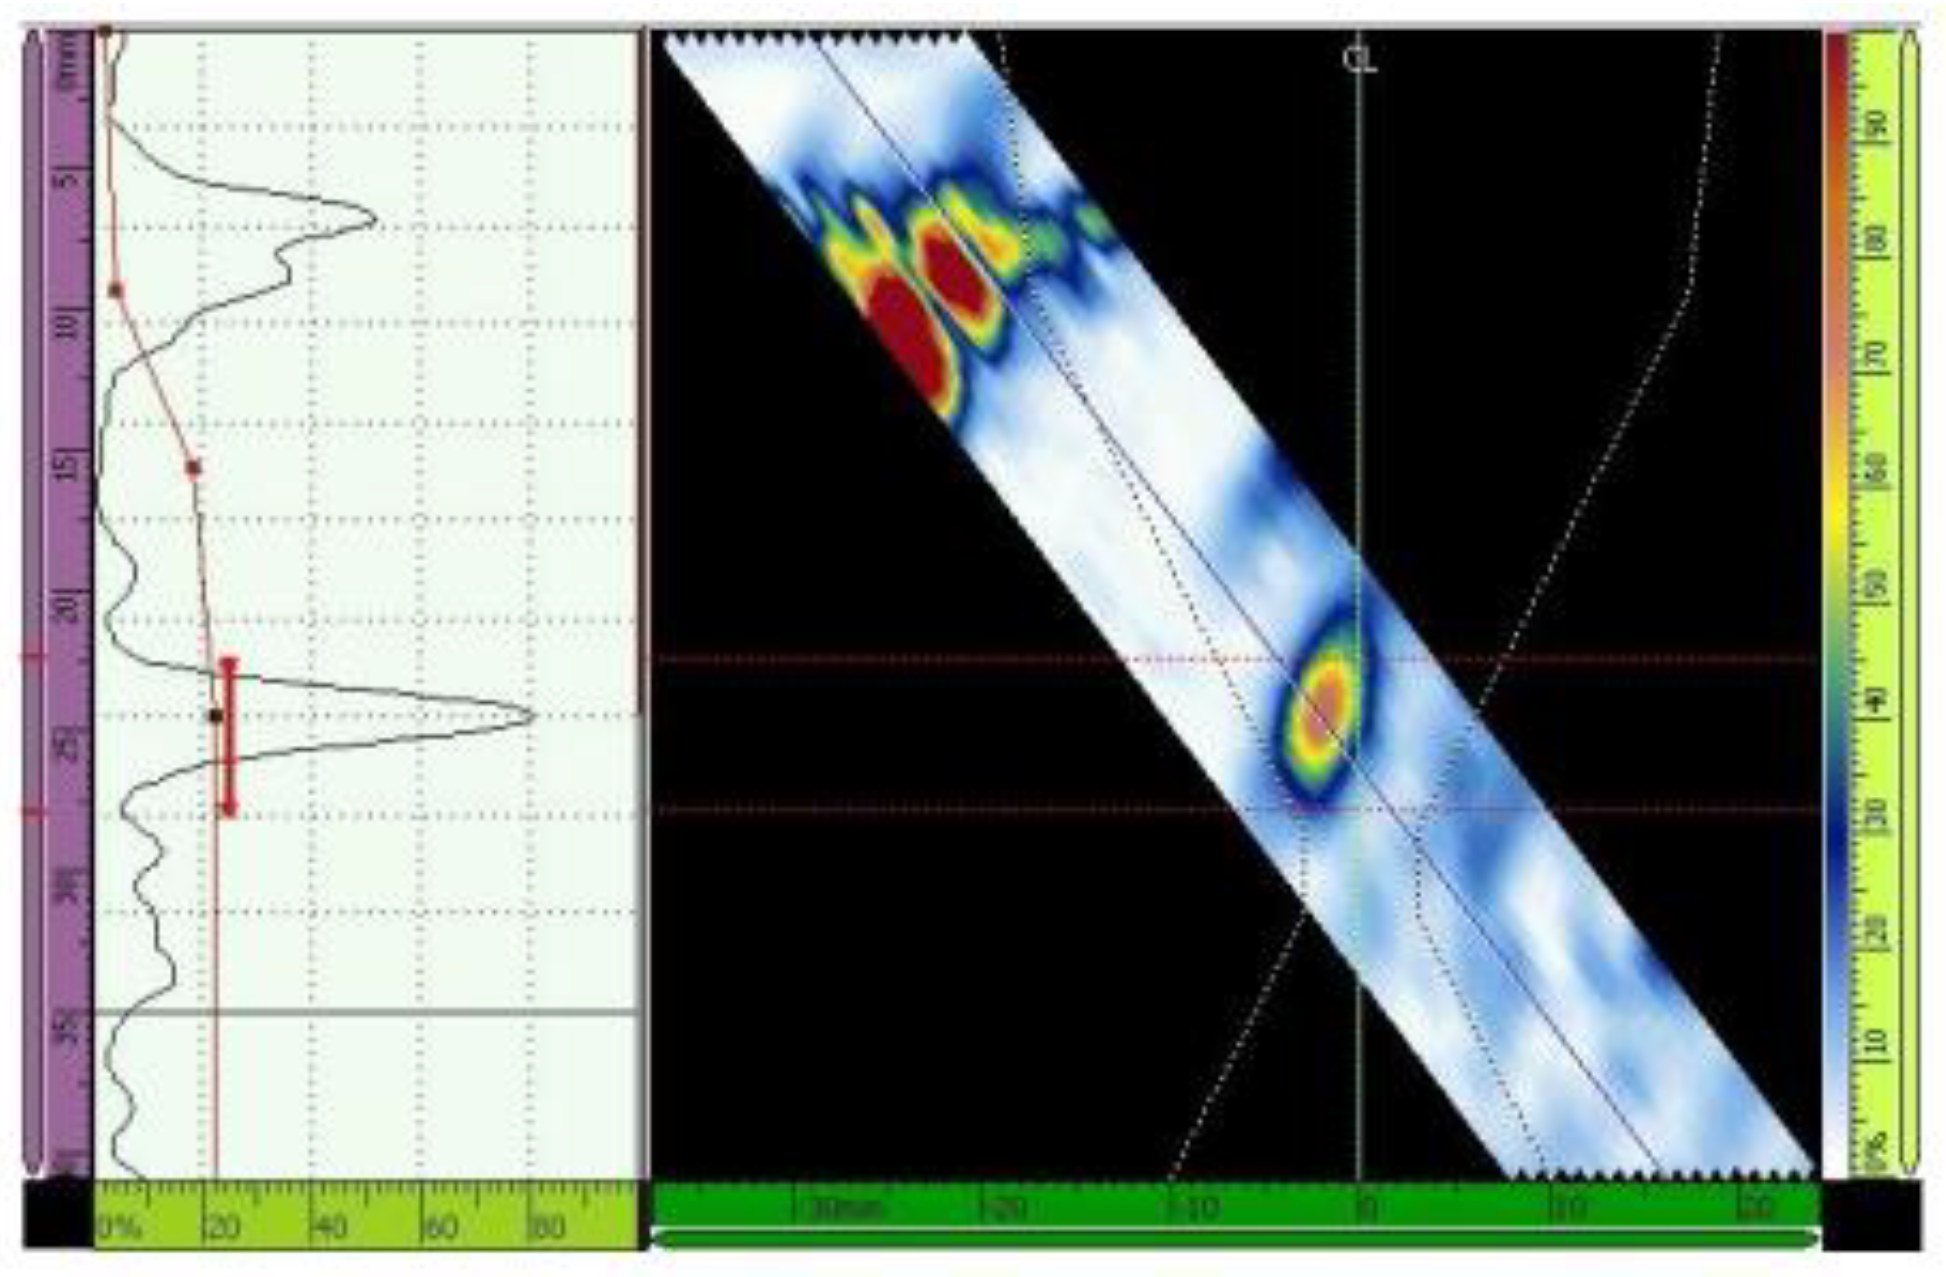
Metals 08 00787 g016
Figure 17. Echo (maximized to 80% of the screen height) from the third hole. Scanning angle of 52°, 16 active elements. Primary gain = 40.8 dB.
Metals 08 00787 g017
Figure 18. TCG adjustment. Scanning angle of 52°, 16 active elements. Primary gain = 27.2 dB.
Metals 08 00787 g018
Table 1. Specified and analyzed mechanical properties-yield strength (YS), ultimate tensile strength (UTS), elongation (El.) and Charpy V energy at −196 °C (CVEn) and lateral expansion (CVEx)-of the base metal and typical values of filler metals mechanical properties.
Mechanical PropertiesBase metal ATSM A333 Gr.8
(9% Ni Steel)
Filler Metal Ni-Based Superalloy 625
GTAWSMAW
Specified (min.) [17]Anal.Typical Values
YS (MPa)515693510530
UTS (MPa)690740770770
El. (%)22254230
CVEn (J)N.A.1467045
CVEx (mils/mm)14.96/0.3870/1.78N.A.N.A.
Where: N.A. means not applicable and Anal. means analyzed.
Table 2. Specified and analyzed chemical compositions (wt.%) of the base, filler and weld metals.
ElementChemical Composition (wt.%)
Base Metal (9% Ni)Filler Metal Ni-Based Superalloy 625Weld Metal
GTAWSMAW
Specified ASTM A333 (max.) [17]Anal.Specified AWS A5.14 [18]Anal.Specified AWS A5.11 [19]Anal.Anal.
C0.130.061<0.10.008<0.10.0340.0326
Mn0.90.607<0.50.02<1.00.680.887
Si0.13/0.320.279<0.50.05<0.750.350.494
P0.025<0.005<0.020.006<0.030.0100.0035
S0.025<0.005<0.0150.000<0.020.0030.0088
Ni8.4/9.69.70>5865.10>5562.863.1
CuN.A.<0.005<0.50.03<0.50.000.0061
TiN.A.0.0061<0.40.183N.A.0.050.0694
CrN.A.0.056520/2321.6620/2321.8320
MoN.A.0.01428/108.738/108.808.95
FeBalance89.200<0.50.430<7.01.842.49
PbN.A.<0.005<0.50.000N.A.N.A.0.0504
AlN.A.0.0218<0.40.140N.A.N.A.<0.0005
Nb + TaN.A.<0.0053.15/4.153.663.15/4.153.4973.478
CoN.A.N.A.N.A.N.A.0.12N.A.N.A.
Where: N.A. means not applicable and Anal. means analyze.
Table 3. Processes and parameters adopted to girth weld the 9% Ni quenched and tempered steel tubular butt joint with Ni-based superalloy 625 as the filler metal.
Welding
ParametersProcess
GTAWSMAW
RootHotFillCap
Amperage (A)1261269089
Voltage (V)11112626
Welding speed (cm/min)5.67.312.618
Heat input (kJ/mm)1.51.11.20.9
Gas type* and flow rate (l/min)ShieldAr/12Ar/12N.A.N.A.
PurgeAr/25Ar/25N.A.N.A.
* 99.995% purity. Where: N.A. means not applicable.
Table 4. Elastic constants (in GPA) for austenitic stainless steel extracted from the CIVA database.
C11C22C33C23C13C12C44C55C66
2502502501381801121179170
Table 5. Number of active elements, scanning angles and indexes of the CIVA simulation.
Scanning Angle (°)No. of Active ElementsIndex (mm)
4516, 24, 3223
1610, 35, 48
4816, 24, 3222
168, 35, 49
5216, 24, 3218
163, 32, 46
Table 6. Number of active elements, scanning angles and indexes of inspection procedures with an Olympus 2.25L-32-A32 transducer (2.25 MHz).
Scanning Angle (°)No. of Active ElementsIndex (mm)
451610, 23, 35, 48
488, 22, 35, 49
523, 18, 32, 46
Table 7. Sonic attenuation and sonic speed in the base metal and in the weld metal.
Wave TypeBase MetalWeld Metal
Sonic SpeedAttenuationSonic SpeedAttenuation
Longitudinal wave5820 m/s0.098 dB/mm5840 m/s0.186 dB/mm
Transversal wave3150 m/s0.131 dB/mm3075 m/s0.220 dB/mm
Table 8. Summary of the simulation results.
ObjectiveAngle (°)No. of Active ElementsIndex (mm)Simulation Results
Analyze the influence of varying the number of active elements in the ultrasonic beam propagation through the material.45°16/24/3223Attenuation grows as the number of active elements increases. For all the scanning angles the best results, that is, high coverage and low attenuation were the configuration of 16 elements.
48°22
52°18
Analysis of the ultrasonic beam coverage in the welded joint for different scanning indexes.45°1610/23/35/48All indexes showed high coverage and low attenuation on the weld bevel and on the weld metal.
48°168/22/35/49All indexes showed low divergence and high coverage on the fusion line and root region. Although, there was excessive beam collimation near the weld cap for the indexes of 22, 35 and 49 mm.
52°163/18/32/46Beam divergence was observed in the centerline of the weld for indexes of 3 and 18 mm. For 32 and 46 mm, the attenuation and divergence were low.
Table 9. Primary gain from the third hole after TCG adjustment for scanning angles of 45°, 48° and 52°.
Scanning AnglePrimary Gain from the Third HolePrimary Gain after Tracing the TCG
45°50.0 dB22.8 dB
48°40.1 dB22.6 dB
52°40.8 dB27.2 dB

