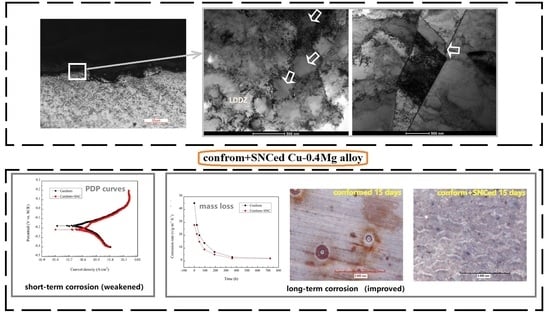
Effect of Surface Nanocrystallization on Corrosion Resistance of the Conformed Cu-0.4%Mg Alloy in NaCl Solution

 , and
, and
Abstract
:
1. Introduction
2. Experiment
3. Results
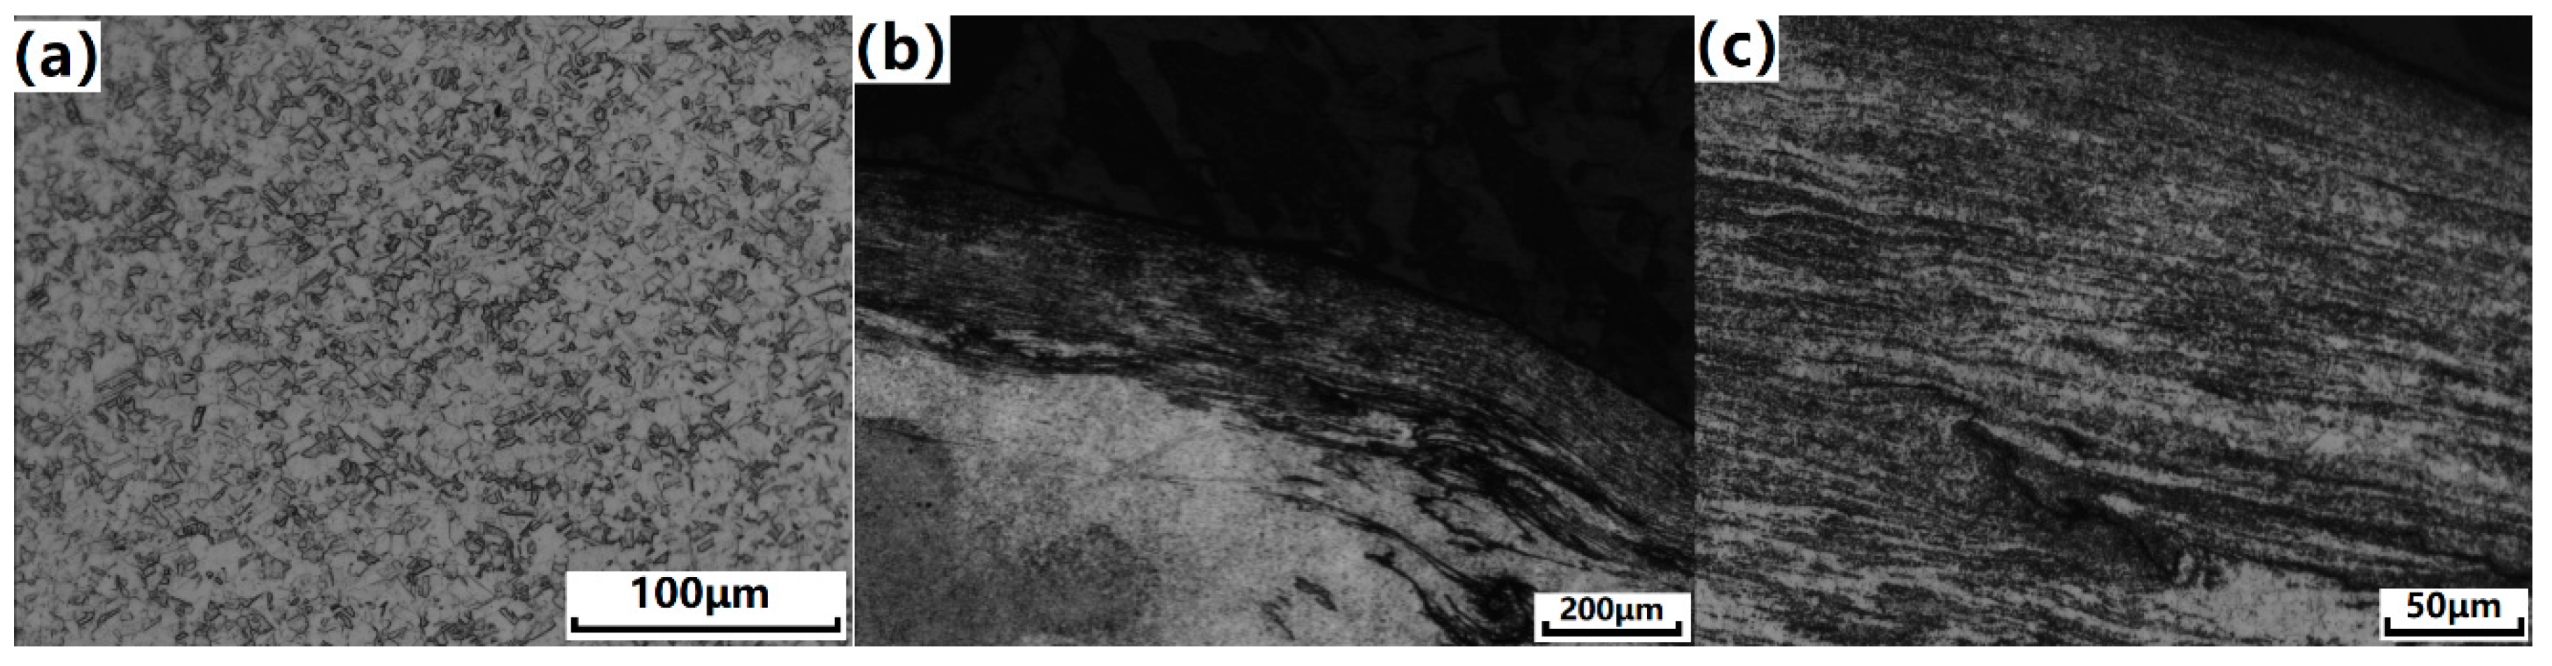
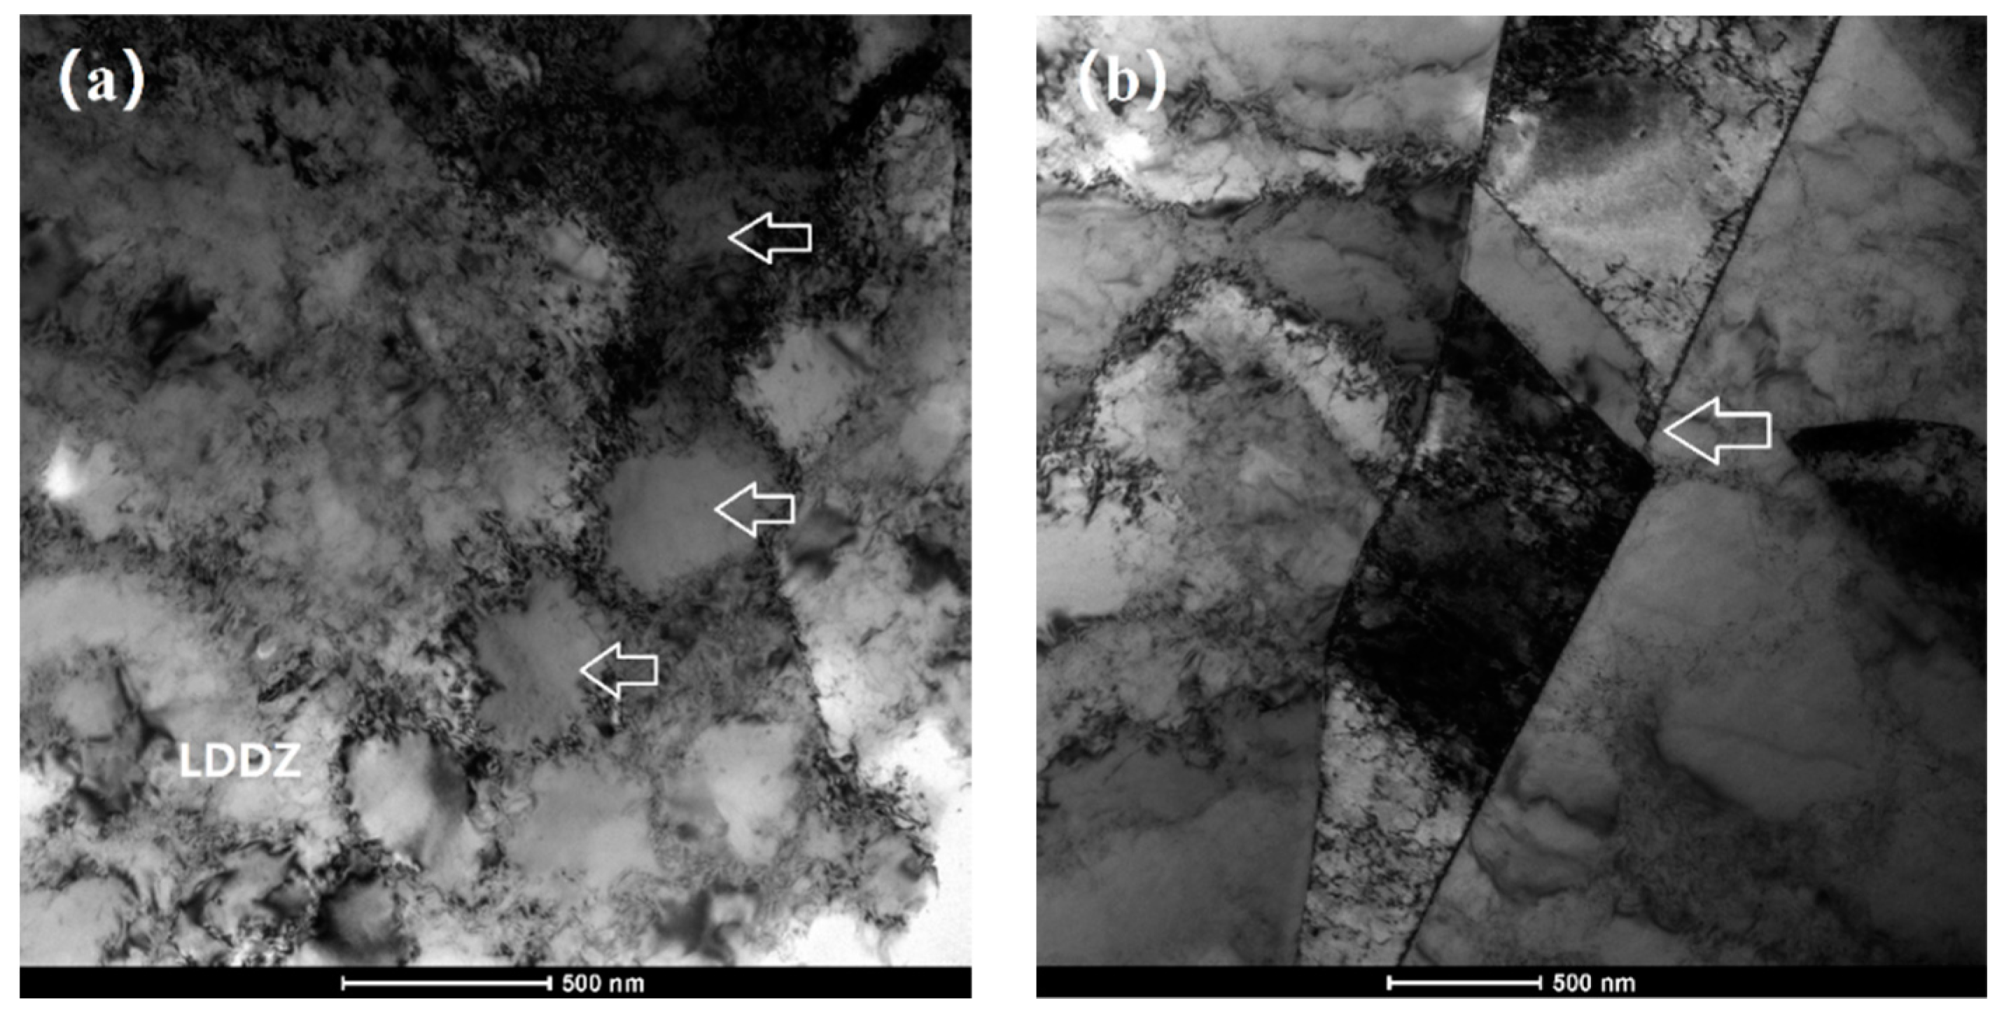
3.1. Microstructure Characterization of Cu-0.4%Mg Alloy
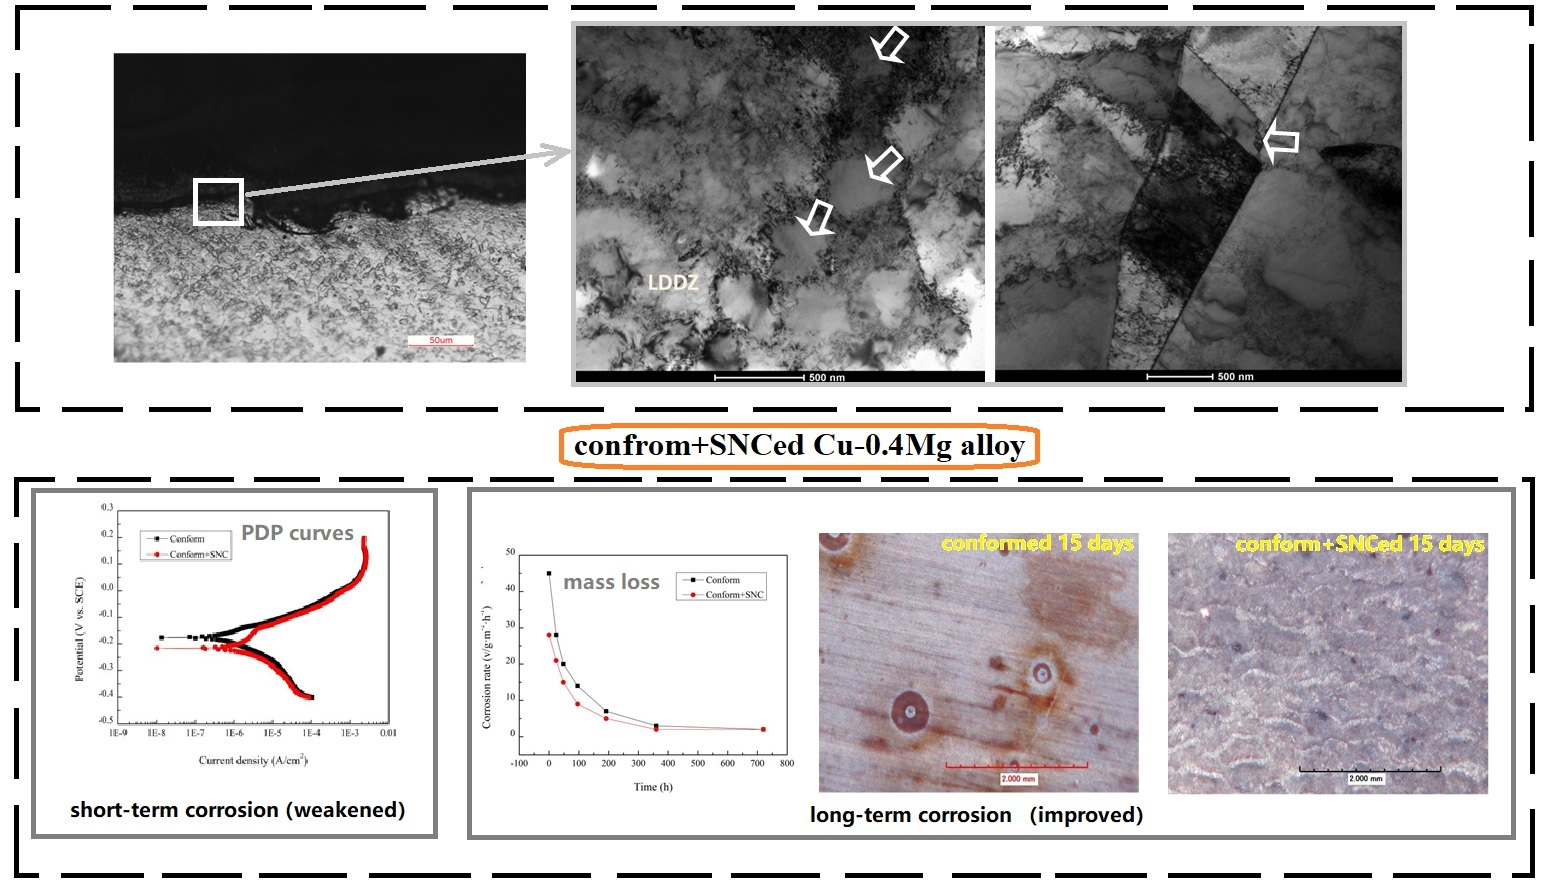
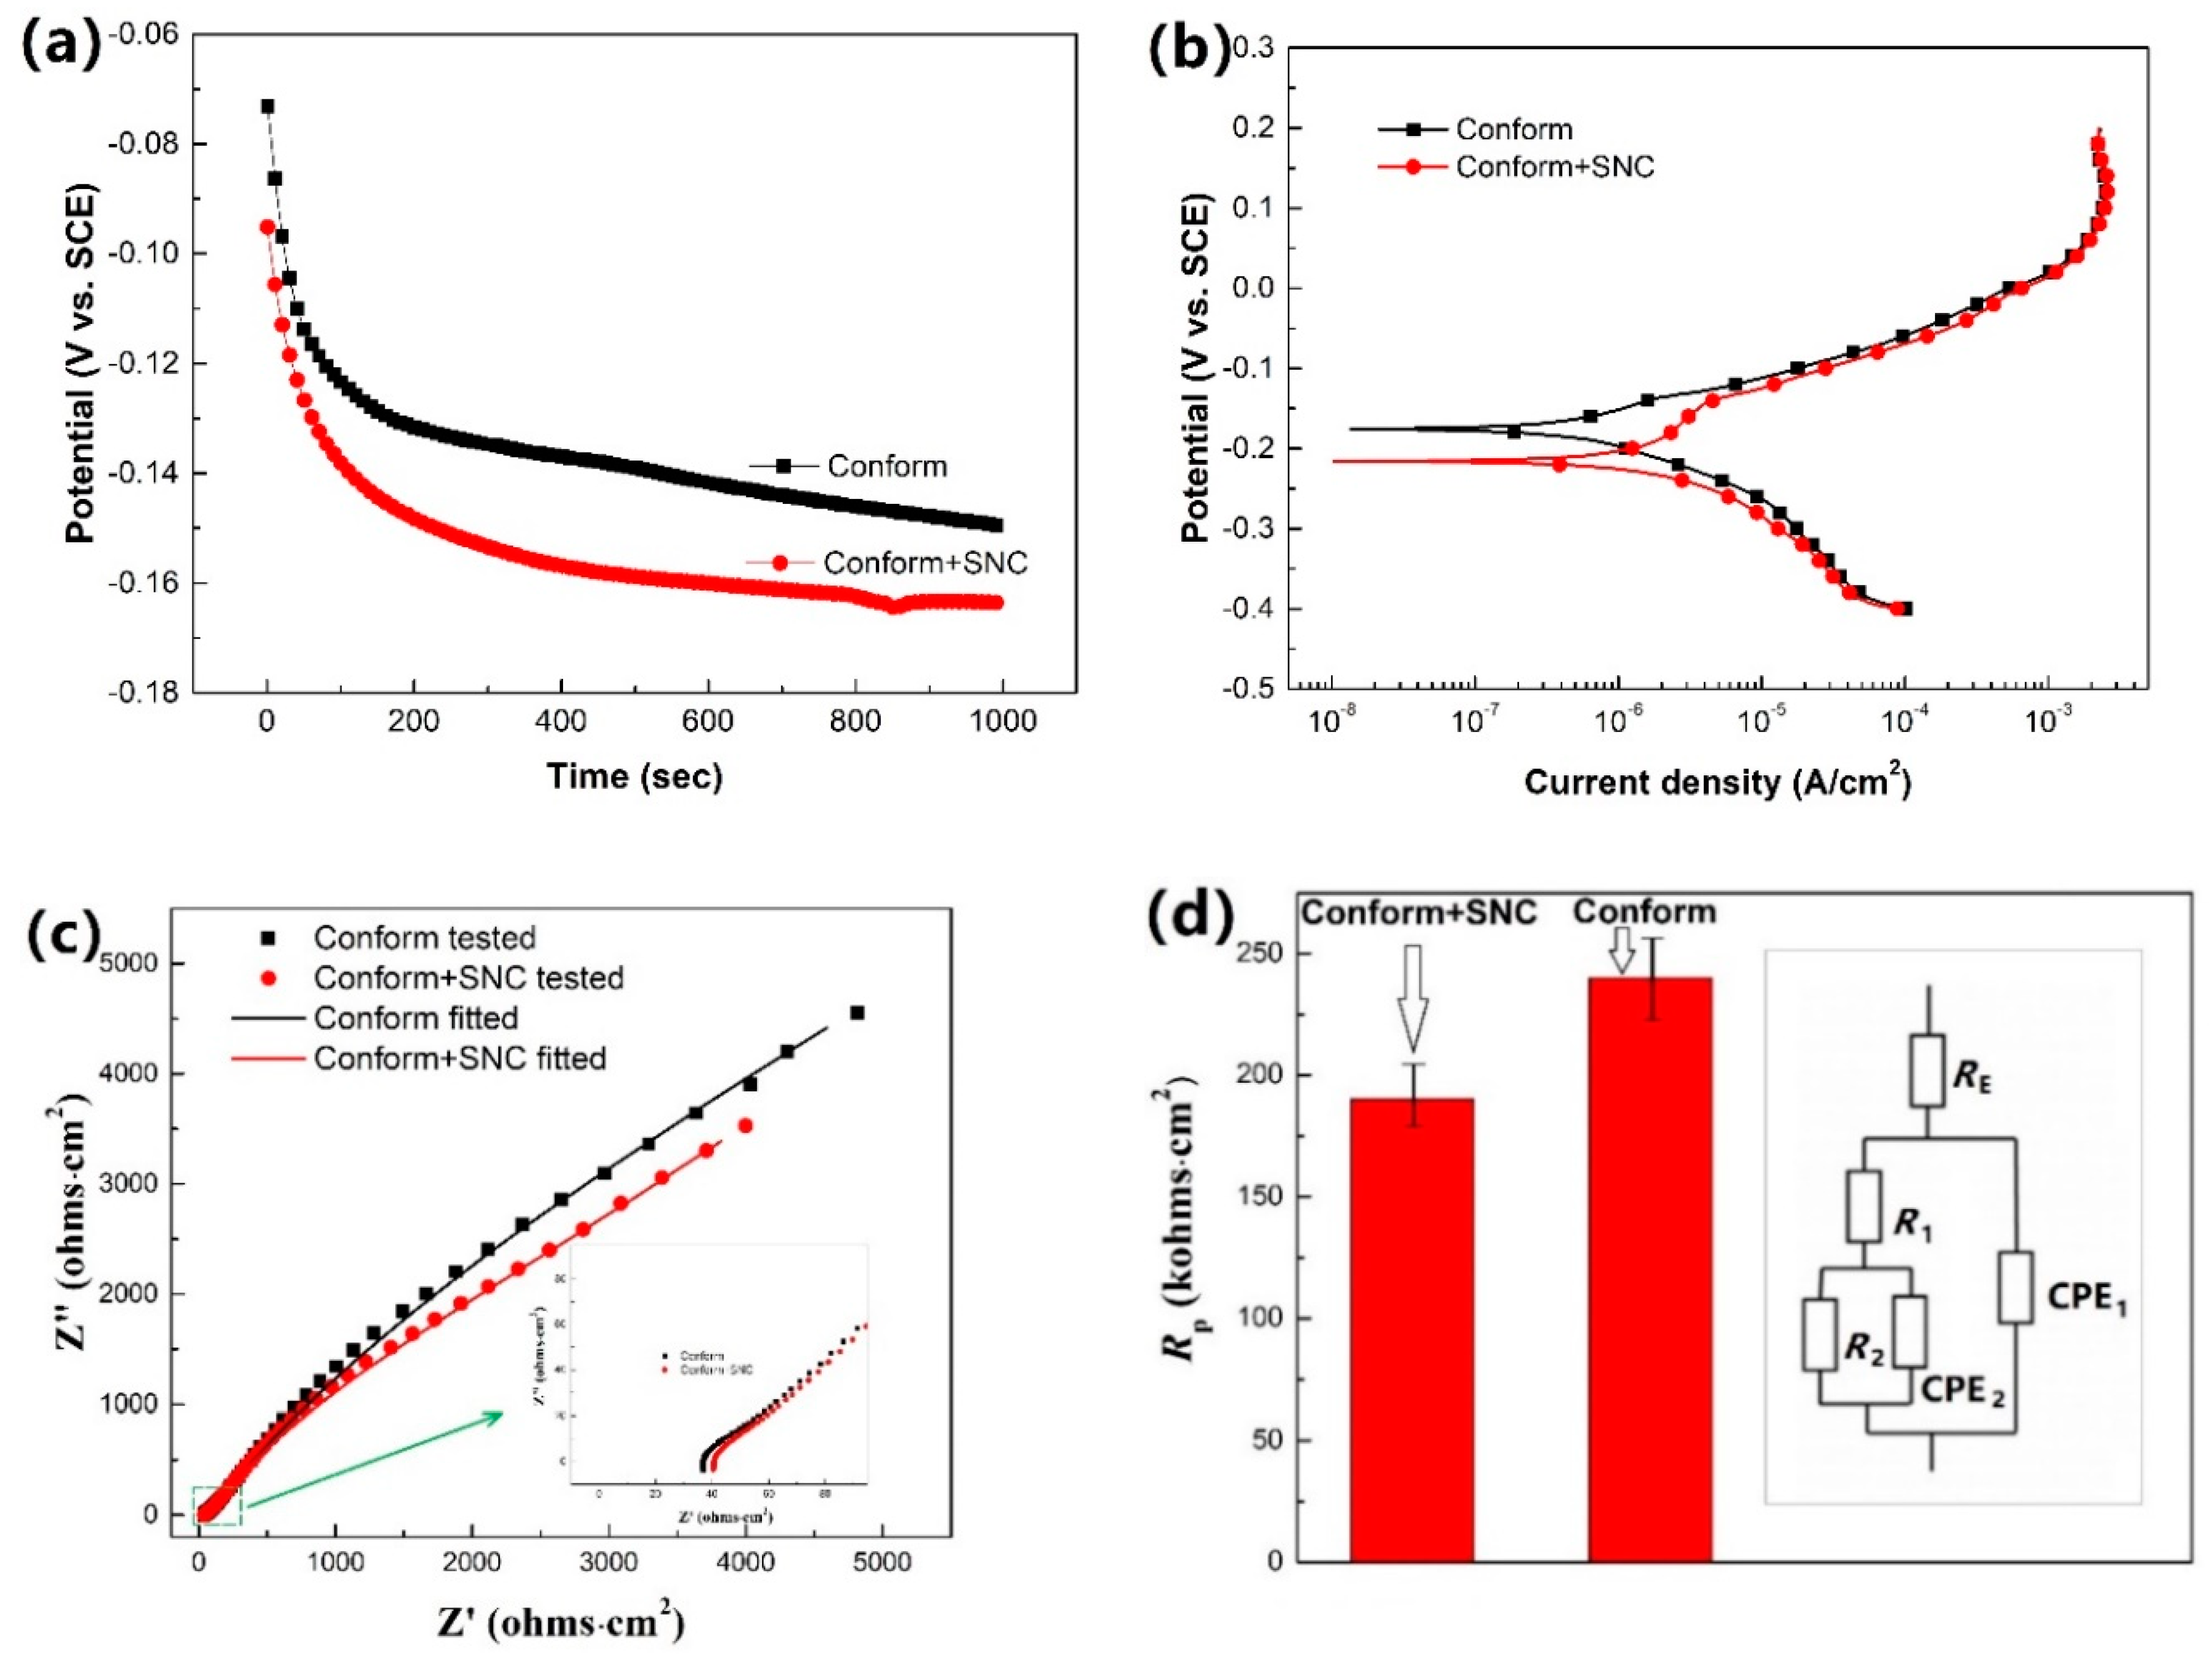
3.2. Electrochemical Results of Cu-0.4%Mg Alloy
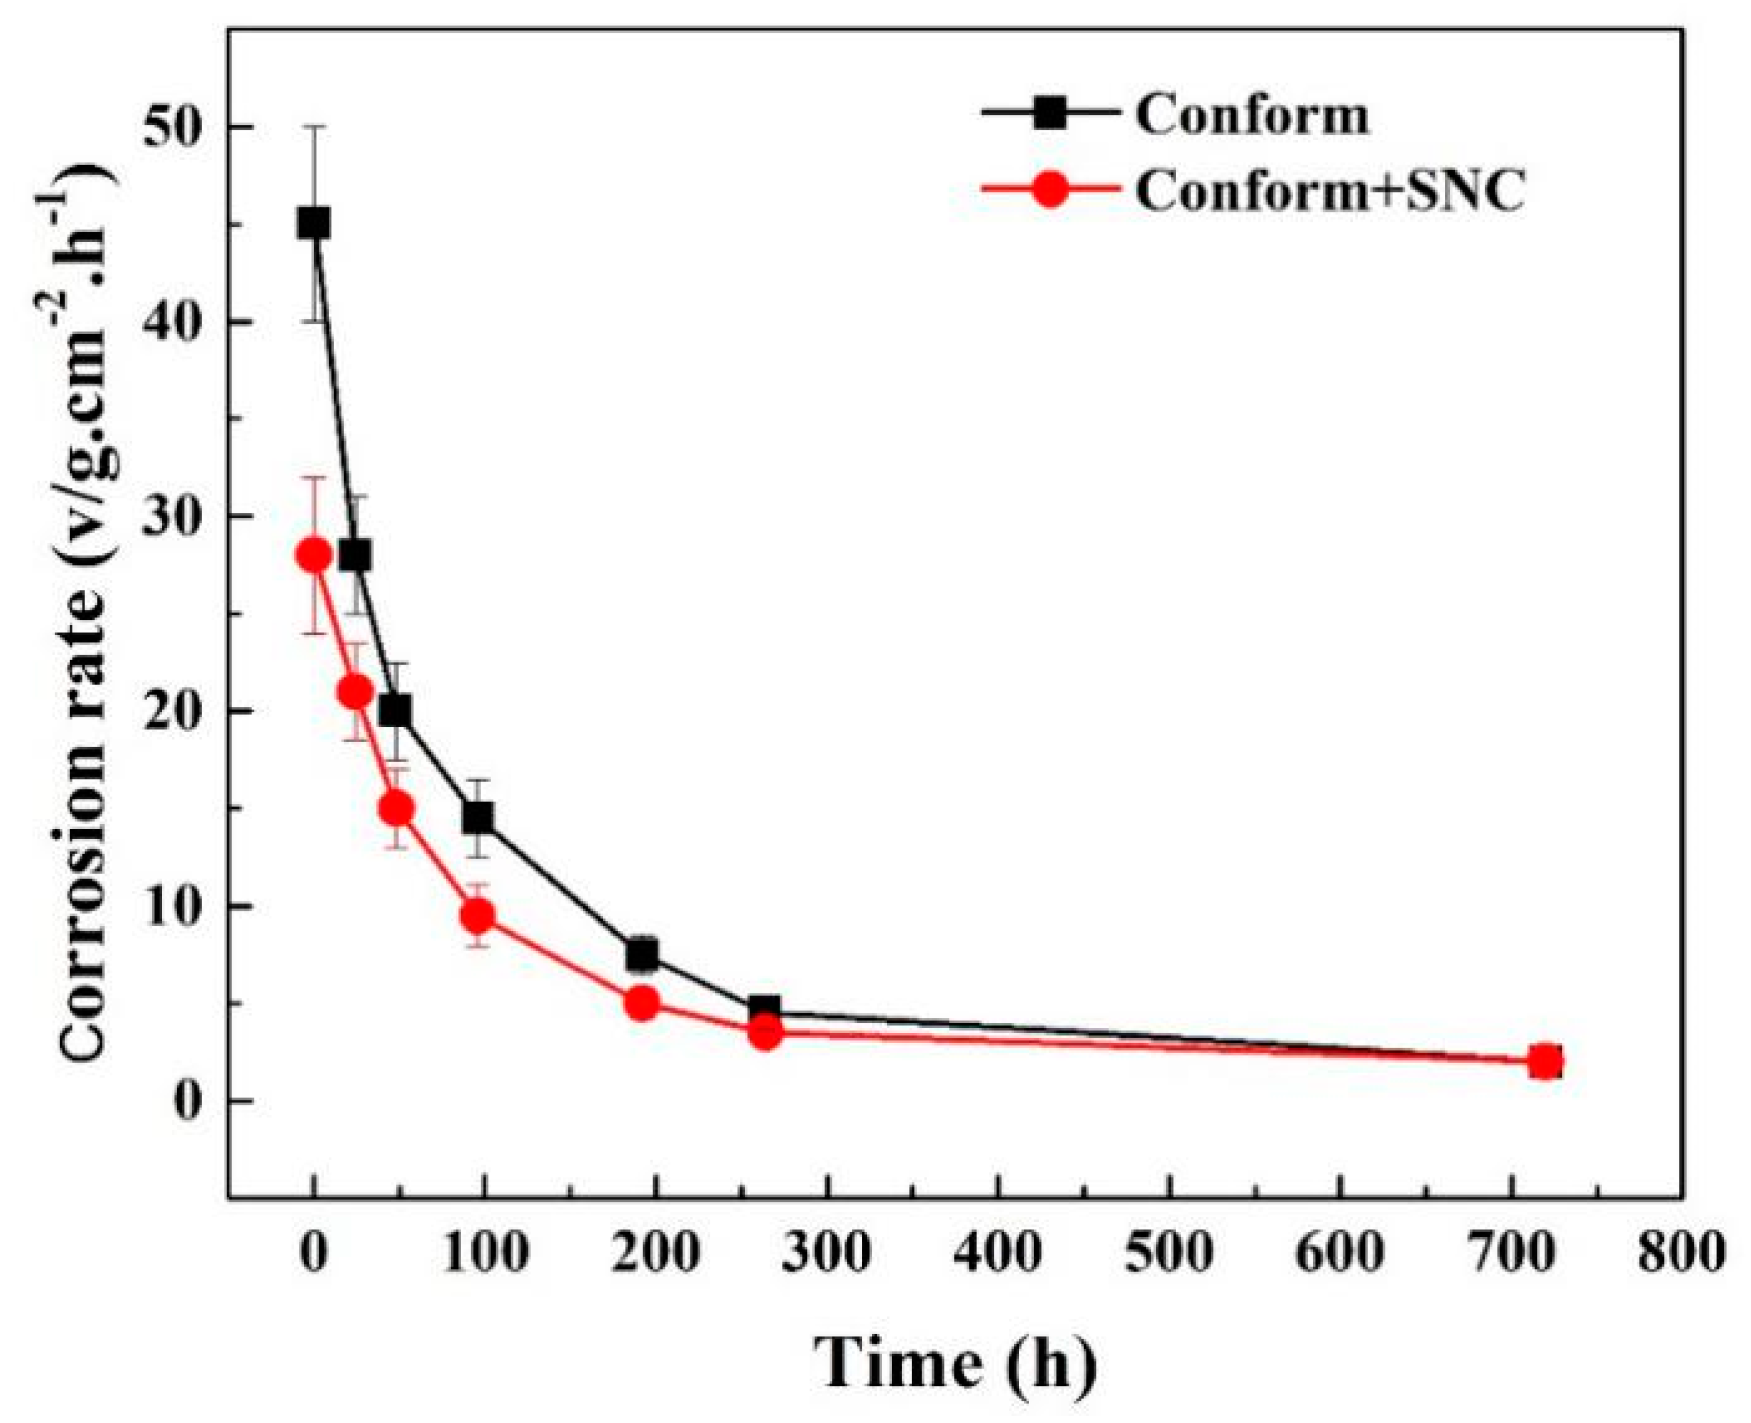
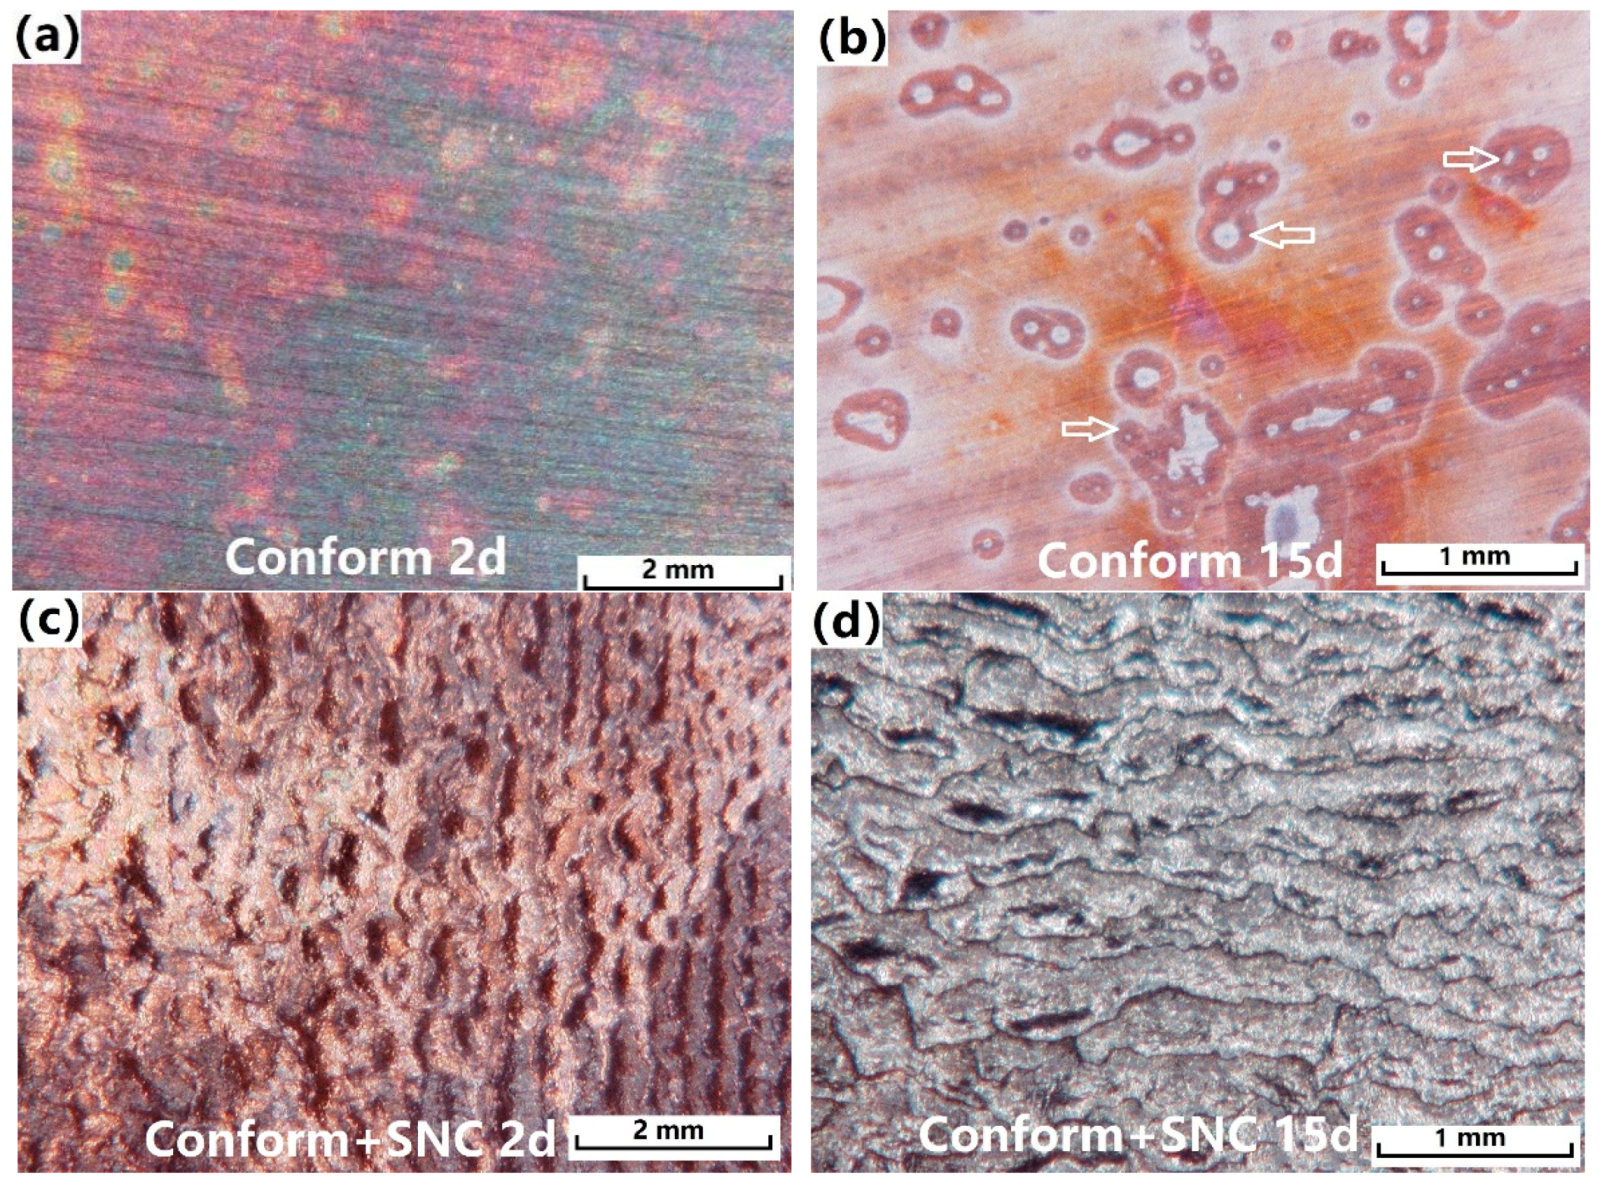
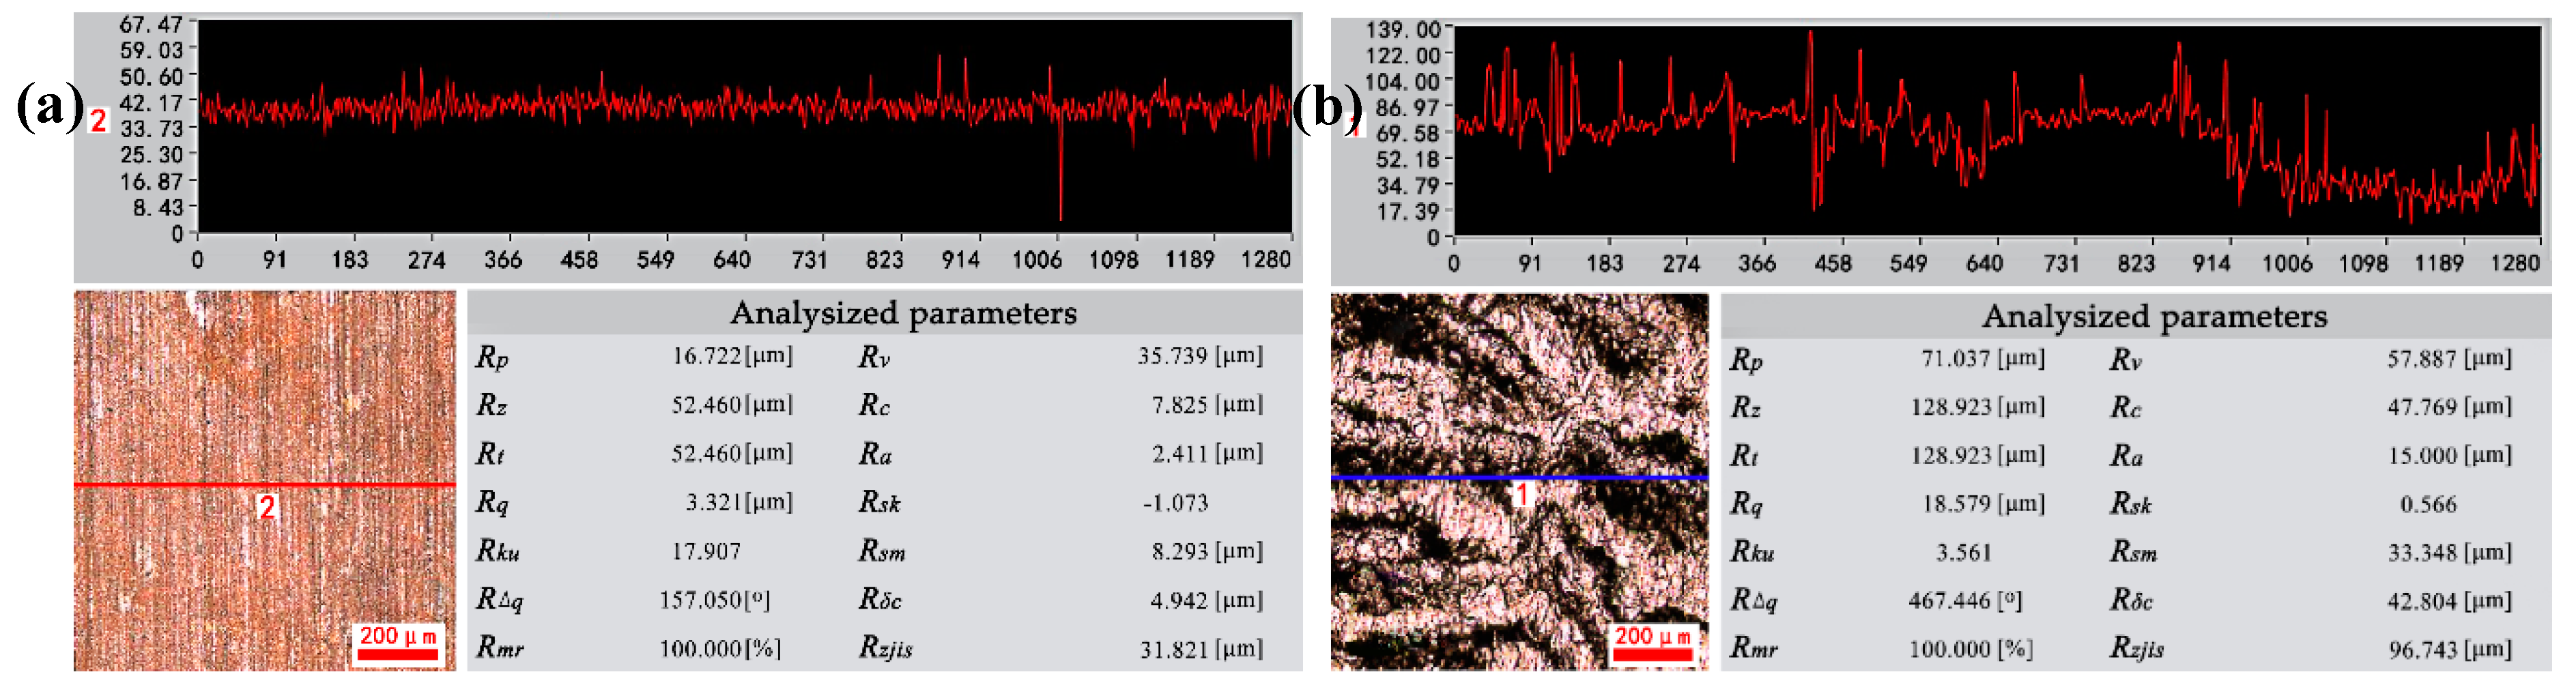
3.3. Immersion Corrosion Results
3.4. Influential Mechanism of SNC on the Corrosion Behavior of the Cu-0.4%Mg Alloy
4. Conclusions
Author Contributions
Funding
Acknowledgments
Conflicts of Interest
References
- Peng, L.M.; Mao, X.M.; Xu, K.D.; Ding, W.J. Property and thermal stability of in situ composite Cu-Cr alloy contact cable. J Mater. Process. Technol. 2005, 166, 193–198. [Google Scholar] [CrossRef]
- Zhang, L.; Meng, L.; Liu, J.B. Effects of Cr addition on the microstructural, mechanical and electrical characteristics of Cu-6wt.%Ag microcomposite. Scr. Mater. 2005, 52, 587–592. [Google Scholar] [CrossRef]
- Fernee, H.; Nairn, J.; Atrens, A. Precipitation hardening of Cu-Fe-Cr alloys. J. Mater. Sci. 2001, 36, 2721–2741. [Google Scholar] [CrossRef]
- Liu, J.B.; Zhang, L.; Dong, A.P.; Wang, L.T.; Zeng, Y.W.; Meng, L. Effects of Cr and Zr additions on the microstructure and properties of Cu-6wt.% Ag alloys. Mater. Sci. Eng. A 2012, 532, 331–338. [Google Scholar] [CrossRef]
- Suzuki, S.; Shibutani, N.; Mimura, K.; Isshiki, M.; Waseda, Y. Improvement in strength and electrical conductivity of Cu-Ni-Si alloys by aging and cold rolling. J. Alloys Compd. 2006, 417, 116–120. [Google Scholar] [CrossRef]
- Gao, H.; Wang, J.; Shu, D.; Sun, B. Microstructure and properties of Cu-11Fe-6Ag in situ composite after thermo-mechanical treatments. J. Alloys Compd. 2007, 438, 268–273. [Google Scholar] [CrossRef]
- Zhu, C.C.; Ma, A.B.; Jiang, J.J.; Li, X.B.; Song, D.; Yang, D.H.; Yuan, Y.; Chen, JQ. Effect of ECAP combined cold working on mechanical properties and electrical conductivity of Conform-produced Cu-Mg alloys. J. Alloys Compd. 2014, 582, 135–140. [Google Scholar] [CrossRef]
- Duan, Y.L.; Xu, G.F.; Tang, L.; Li, Z.; Yang, G. Microstructure and properties of the novel Cu-0.30Mg-0.05Ce alloy. processed by equal channel angular pressing. Mater. Sci. Eng. A 2015, 648, 252–259. [Google Scholar] [CrossRef]
- Valiev, R.Z.; Islamgaliev, R.K.; Alexandrov, I.V. Bulk nanostructured materials from severe plastic deformation. Prog. Mater. Sci. 2000, 45, 103–189. [Google Scholar] [CrossRef]
- Sehiotz, J.; Franceseo, D.D.T.; Jacobsen, K.W. Softening of nanocrystalline metals at very small grain sizes. Nature 1998, 391, 561. [Google Scholar] [CrossRef]
- McFadden, S.X.; Mishra, R.S.; Valiev, R.Z.; Zhilyaev, A.P.; Mukherjee, A.K. Low-temperature superplasticity in nanostructured nickel and metal alloys. Nature 1999, 398, 684–686. [Google Scholar] [CrossRef]
- Lu, K.; Lu, J. Nanostructured surface layer on metallic materials induced by surface mechanical attrition treatment. Mater. Sci. Eng. A 2004, 38, 375–377. [Google Scholar] [CrossRef]
- Balusamy, T.; Kumar, S.; Sankara Narayanan, T.S.N. Effect of surface nanocrystallization on the corrosion behaviour of AISI 409 stainless steel. Corros. Sci. 2010, 52, 3826–3834. [Google Scholar] [CrossRef]
- Li, Y.; Wang, F.; Liu, G. Grain Size Effect on the Electrochemical Corrosion Behavior of Surface Nanocrystallized Low-Carbon Steel. Corrosion 2004, 60, 891–896. [Google Scholar] [CrossRef]
- Li, N.N.; Shi, S.Q.; Luo, J.L.; Lu, J.; Wang, N. Effects of surface nanocrystallization on the corrosion behaviors of 316L and alloy 690. Surf. Coat. Technol. 2017, 309, 227–231. [Google Scholar] [CrossRef]
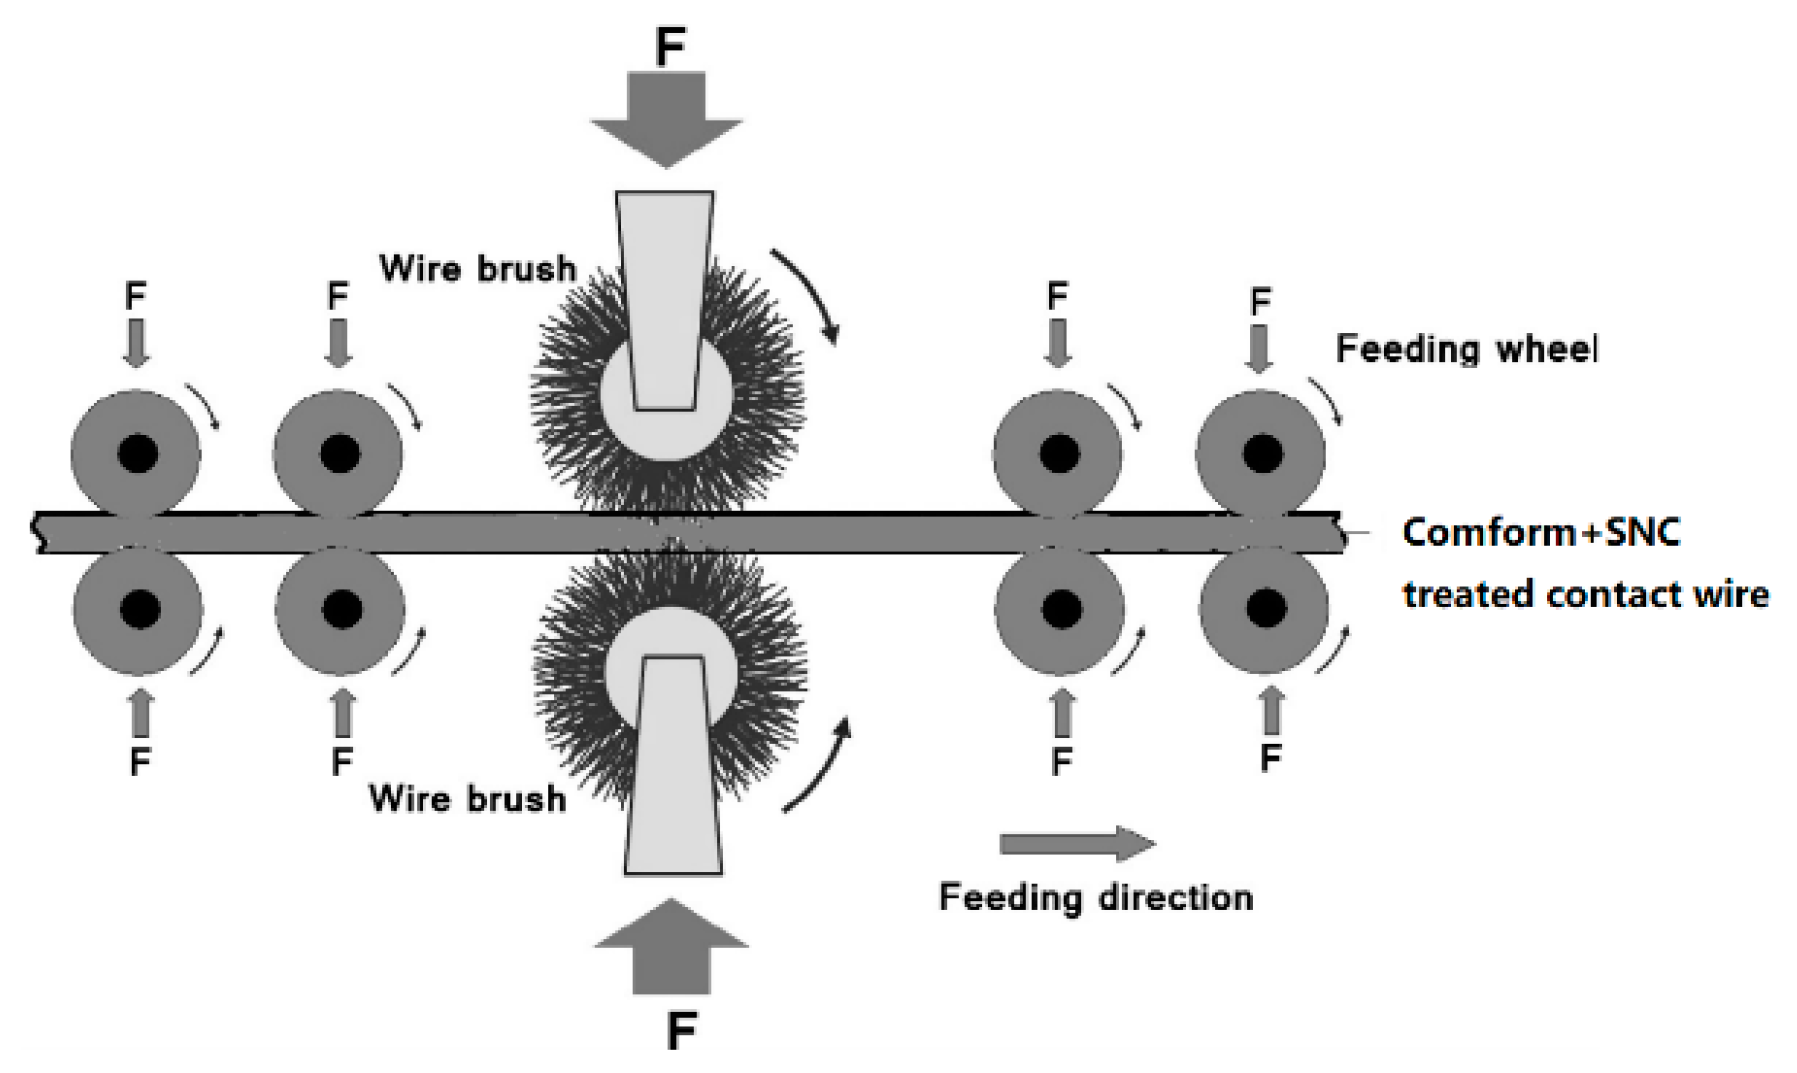
- Song, D.; Ma, A.B.; Sun, W.; Jiang, J.H.; Jiang, J.Y.; Yang, D.H.; Guo, G.H. Improved corrosion resistance in simulated concrete pore solution of surface nanocrystallized rebar fabricated by wire-brushing. Corros. Sci. 2014, 82, 437–441. [Google Scholar] [CrossRef]
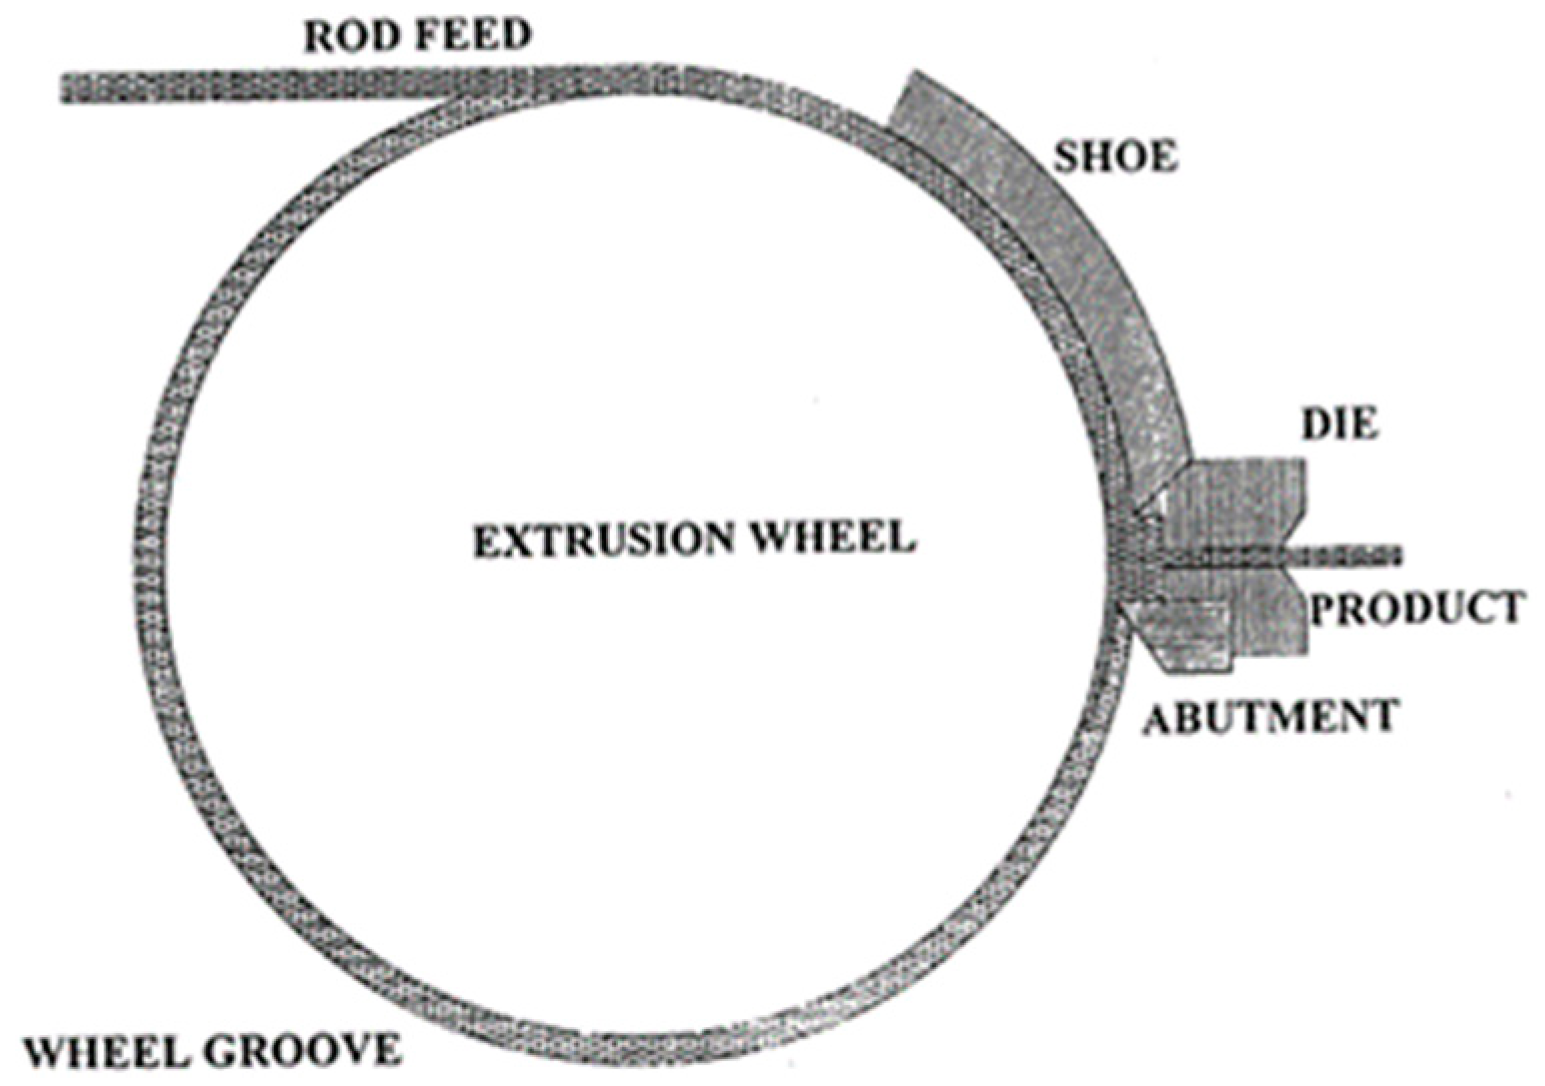
- Kim, Y.H.; Cho, J.R.; Jeong, H.S. A study on optimal design for CONFORM process. J. Mater. Process. Technol. 1998, 80, 671–675. [Google Scholar] [CrossRef]
- Gong, N.; Wu, H.B.; Yu, Z.C.; Niu, G.; Zhang, D. Studying Mechanical Properties and Micro Deformation of Ultrafine-Grained Structures in Austenitic Stainless Steel. Metals 2017, 7, 188. [Google Scholar] [CrossRef]
- Huang, J.Y.; Zhu, Y.T.; Jiang, H.; Lowe, T.C. Microstructures and dislocation configurations in nanostructured Cu processed by repetitive corrugation and straightening. Acta Mater. 2001, 49, 1497–1505. [Google Scholar] [CrossRef] [Green Version]
- Carlton, C.E.; Ferreira, P.J. What is behind the inverse Hall-Petch effect in nanocrystalline materials. Acta Mater. 2007, 55, 3749–3756. [Google Scholar] [CrossRef]
- Dalla, T.F.; Lapovok, R.; Sandlin, J.; Thomason, P.F.; Davies, C.H.J.; Pereloma, E.V. Microstructures and properties of copper processed by equal channel angular extrusion for 1–16 passes. Acta Mater. 2004, 52, 4819–4832. [Google Scholar] [CrossRef]
- Samaniego, A.; Llorente, I.; Feliu, S., Jr. Combined effect of composition and surface condition on corrosion behaviour of magnesium alloys AZ31 and AZ61. Corros. Sci. 2013, 68, 66–71. [Google Scholar] [CrossRef] [Green Version]
- Lee, S.M.; Lee, W.G.; Kim, Y.H.; Jang, H. Surface roughness and the corrosion resistance of 21Cr ferritic stainless steel. Corros. Sci. 2012, 63, 404–409. [Google Scholar] [CrossRef]
- Lin, Y.; Pan, J.; Zhou, H.F.; Gao, H.J.; Li, Y. Mechanical properties and optimal grain size distribution profile of gradient grained nickel. Acta Mater. 2018, 153, 279–289. [Google Scholar] [CrossRef]
- Rai, P.K.; Shekhar, S.; Mondal, K. Development of gradient microstructure in mild steel and grain size dependence of its electrochemical response. Corro. Sci. 2018, 138, 85–95. [Google Scholar] [CrossRef]
- Ghidelli, M.; Sebastiani, M.; Johanns, K.E.; Pharr, G.M. Effects of indenter angle on micro-scale fracture toughness measurement by pillar splitting. J. Am. Ceram. Soc. 2017, 100, 5731–5738. [Google Scholar] [CrossRef]


| Samples | Ecorr (VSCE) | Icorr (μA/cm2) |
|---|---|---|
| Conform | −0.176 ± 0.01 | 0.65 ± 0.05 |
| Conform + SNC | −0.216 ± 0.01 | 0.15 ± 0.03 |
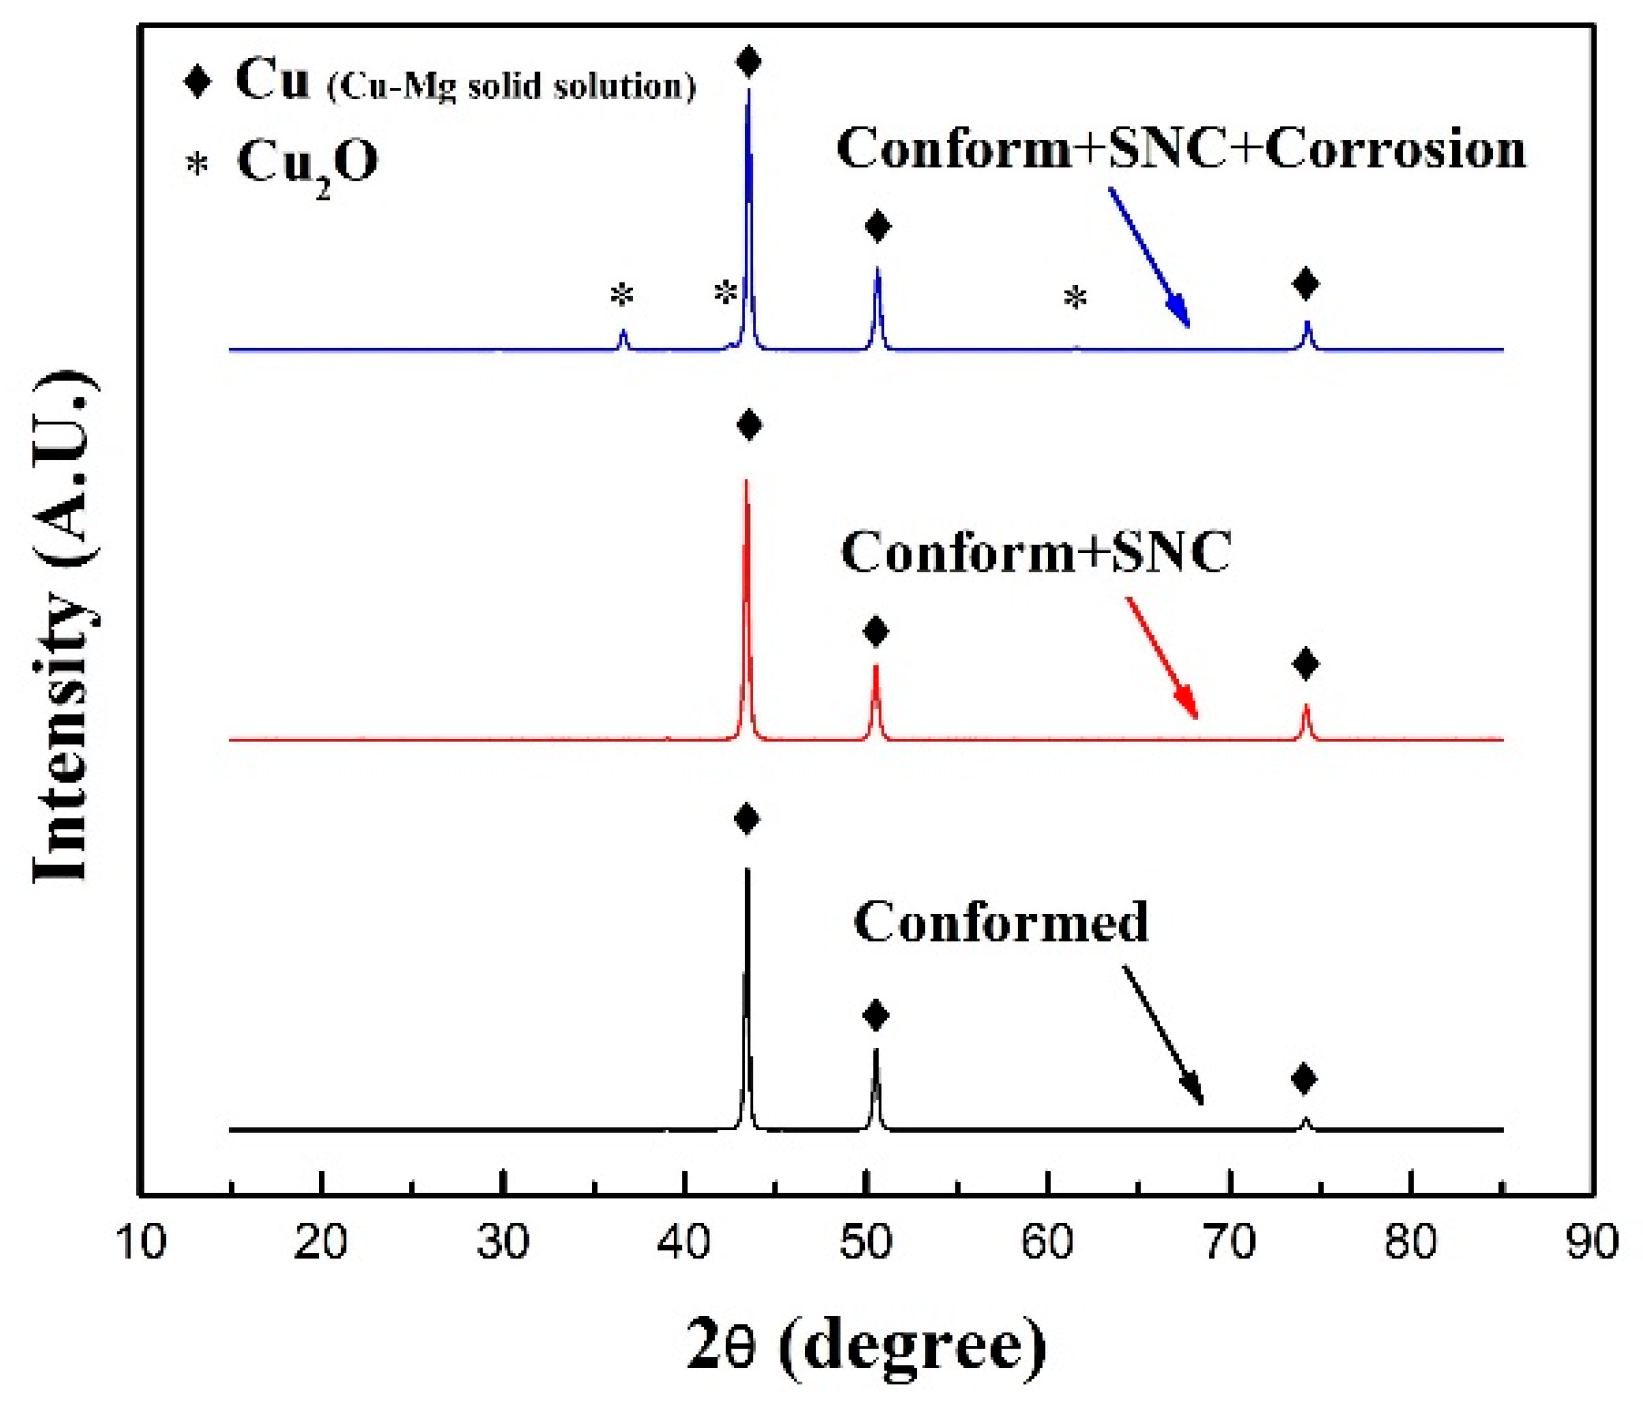
| Peak Angle | FWHM of Conform Alloy | FWHM of Conform + SNC Alloy | FWHM of Confrom + SNC + Corrosion alloy |
|---|---|---|---|
| First peak 43.4° | 0.248 | 0.272 | 0.269 |
| Second peak 50.5° | 0.309 | 0.339 | 0.338 |
| Third peak 74.2° | 0.347 | 0.389 |
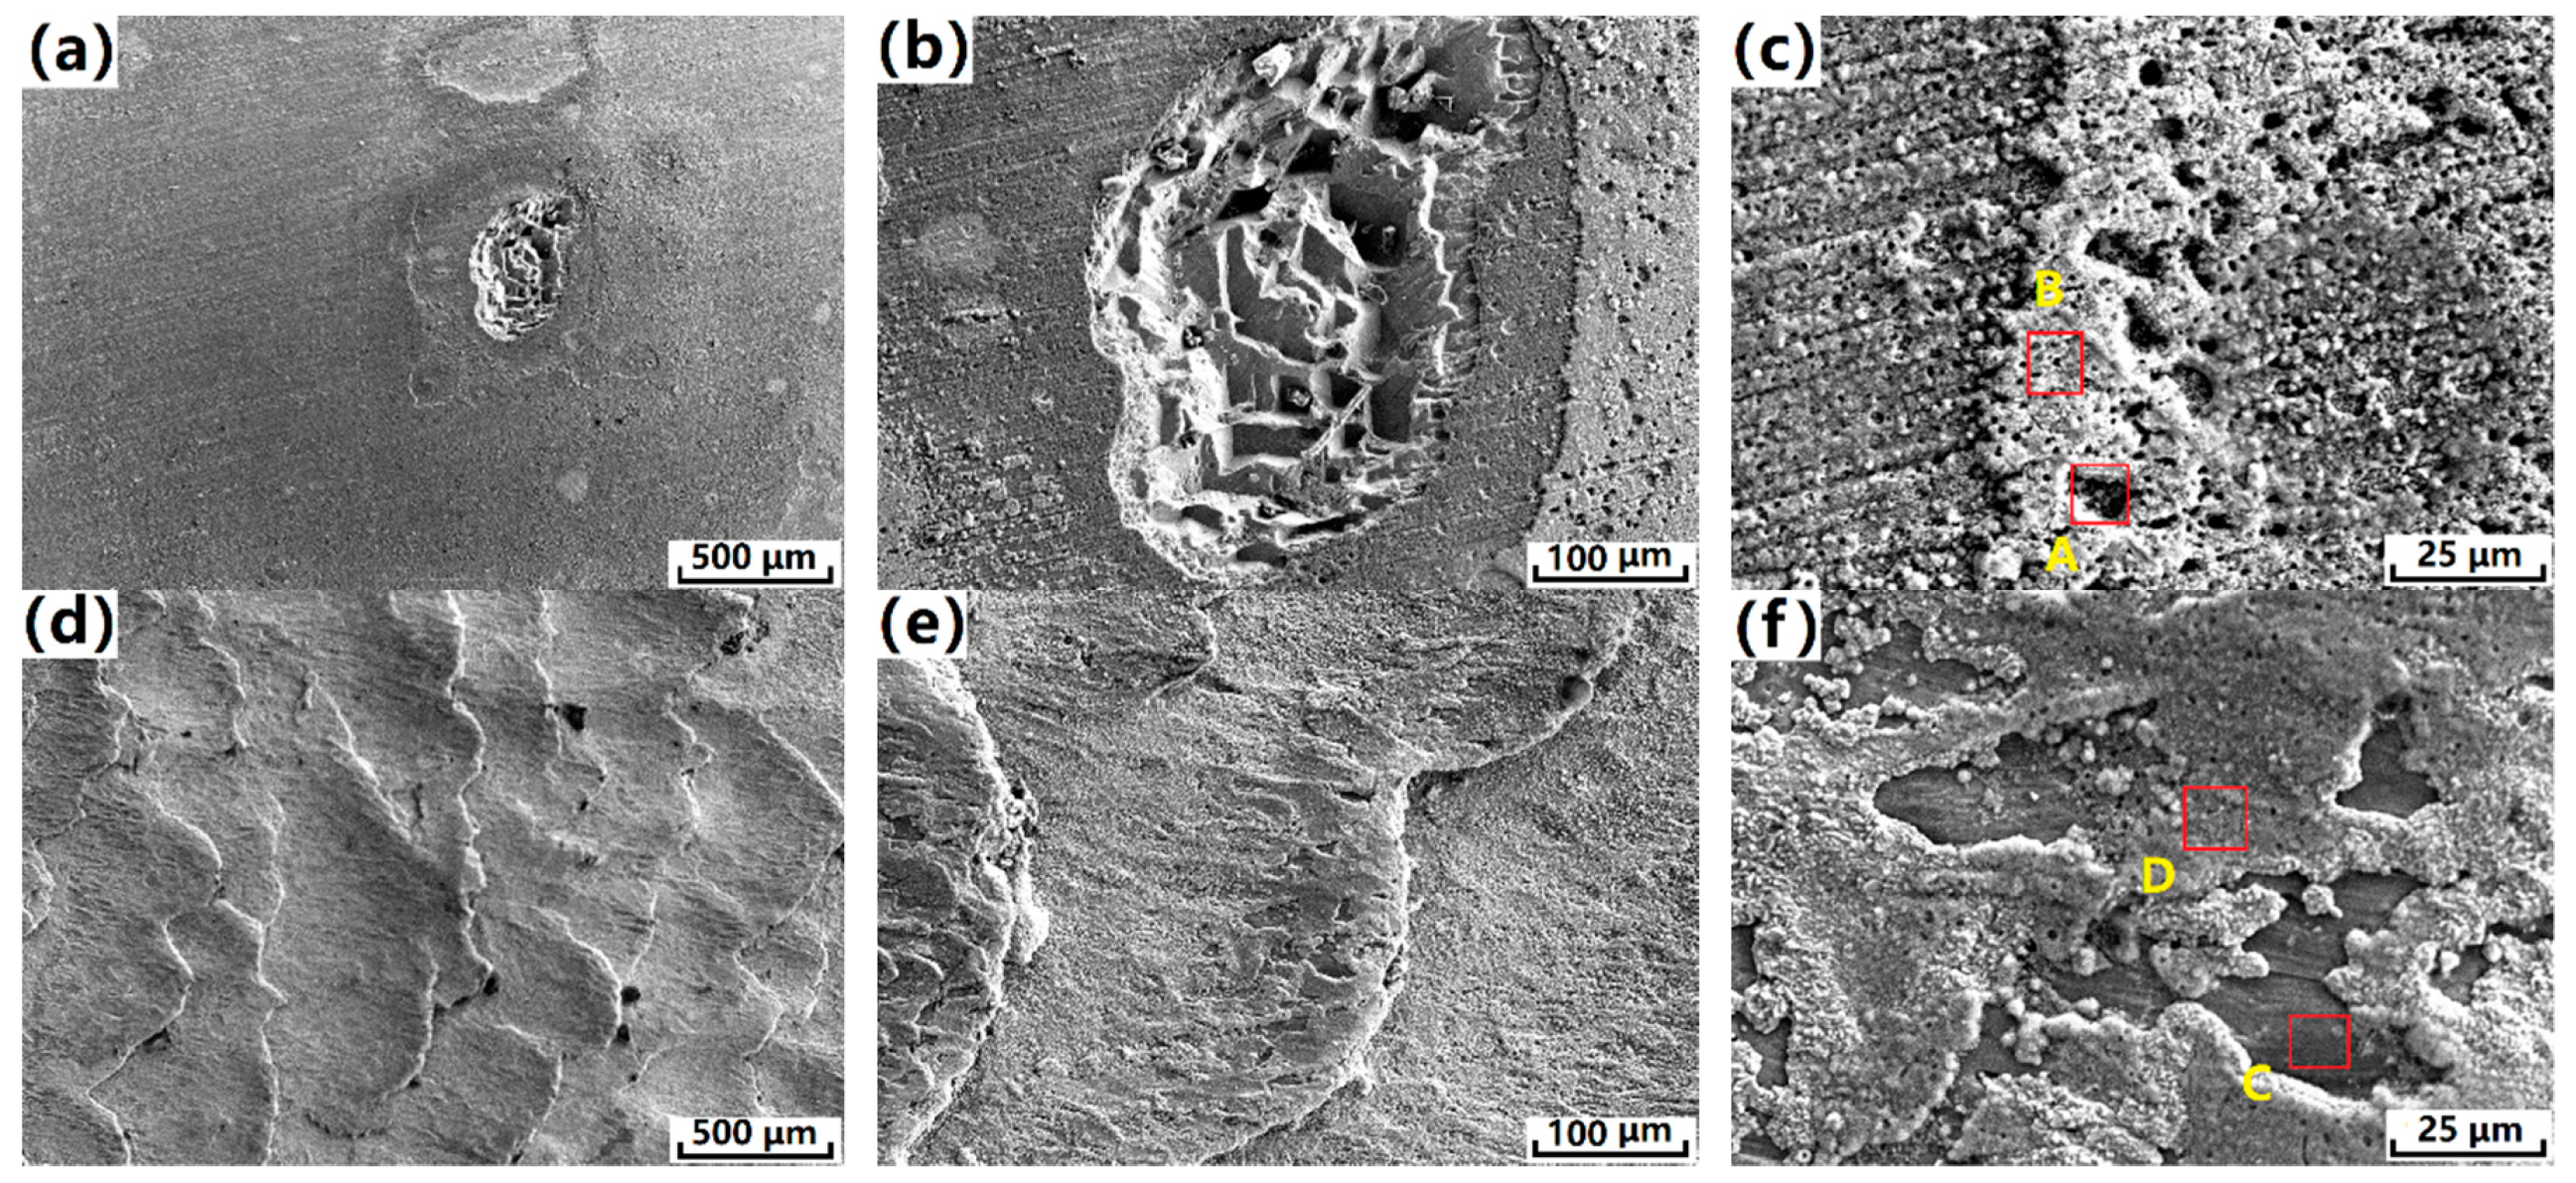
| Elements | Atomic Percent % | |||
|---|---|---|---|---|
| Conform Postion A | Conform Postion B | Conform + SNC Postion C | Conform + SNC Postion D | |
| O | 50.14 | 56.88 | 54.02 | 56.40 |
| Cl | 24.74 | 15.42 | 11.82 | 14.00 |
| Cu | 48.73 | 27.69 | 33.98 | 29.60 |
© 2018 by the authors. Licensee MDPI, Basel, Switzerland. This article is an open access article distributed under the terms and conditions of the Creative Commons Attribution (CC BY) license (http://creativecommons.org/licenses/by/4.0/).
Share and Cite
Song, D.; Jiang, J.; Guan, X.; Qiao, Y.; Li, X.; Chen, J.; Sun, J.; Ma, A. Effect of Surface Nanocrystallization on Corrosion Resistance of the Conformed Cu-0.4%Mg Alloy in NaCl Solution. Metals 2018, 8, 765. https://doi.org/10.3390/met8100765
Song D, Jiang J, Guan X, Qiao Y, Li X, Chen J, Sun J, Ma A. Effect of Surface Nanocrystallization on Corrosion Resistance of the Conformed Cu-0.4%Mg Alloy in NaCl Solution. Metals. 2018; 8(10):765. https://doi.org/10.3390/met8100765
Chicago/Turabian StyleSong, Dan, Jinghua Jiang, Xiaonan Guan, Yanxin Qiao, Xuebin Li, Jianqing Chen, Jiapeng Sun, and Aibin Ma. 2018. "Effect of Surface Nanocrystallization on Corrosion Resistance of the Conformed Cu-0.4%Mg Alloy in NaCl Solution" Metals 8, no. 10: 765. https://doi.org/10.3390/met8100765