Article

Dry Machining Aeronautical Aluminum Alloy AA2024-T351: Analysis of Cutting Forces, Chip Segmentation and Built-Up Edge Formation

1
LEMTA CNRS-UMR 7563, Lorraine University, Mines Albi, Mines Nancy, GIP-InSIC, 27 rue d’Hellieule, 88100 Saint-Dié-des-Vosges, France
2
LEM3 CNRS-UMR 7239, Lorraine University, Ile du Saulcy, 57045 Metz, France
*
Author to whom correspondence should be addressed.
Metals 2016, 6(9), 197; https://doi.org/10.3390/met6090197
Submission received: 10 June 2016 / Revised: 28 July 2016 / Accepted: 11 August 2016 / Published: 24 August 2016
(This article belongs to the Special Issue Aluminum Alloys)

Abstract

:
In this paper, machining aeronautical aluminum alloy AA2024-T351 in dry conditions was investigated. Cutting forces, chip segmentation, and built-up edge formation were analyzed. Machining tests revealed that the chip formation process depends on cutting conditions and tool geometry. So continuous and segmented chips are generated. Under some cutting conditions, built-up edge formation occurs. A predictive machining theory, based on a finite elements method (FEM), was applied to reproduce and explain these phenomena. Thermomechanical behaviors of the work material and the tool-work material interface were considered. Results of the proposed modelling were compared to experimental data for a wide range of cutting speed. It was shown that the feed force is well reproduced by the ALE-FE (arbitrary lagrangian-eulerian finite element) formulation and highly underestimated by the lagrangian finite element (LAG-FE) one. While, the periodic localized shear band, leading to a chip segmentation, is well reproduced with the Lagrangian FE formulation. It was found that the chip segmentation can be correlated to the cutting force evolution using the defined chip segmentation intensity parameter. For the built-up edge (BUE) phenomenon, it was shown that it depends on the contact/friction at the tool-chip interface, and this is possible to simulate by making the friction coefficient time-dependent.

Graphical Abstract

1. Introduction

Aluminum alloy AA2024-T351 has been used for over 30 years in the aeronautic and aerospace industries, especially for its good resistance to fatigue [1]. Also, this metal alloy has a low density in comparison to steels. Often, components made of aluminum alloy AA2024-T351 need machining, using various processes (turning, drilling, milling, etc.), to obtain required shape of the component and also to satisfied the high exigency on the surface quality (low roughness). When machining this alloy, considered as ductile material, several phenomena occur, depending on cutting conditions (cutting speed, feed rate, dry/wet cutting, etc.).
The first one is the chips segmentation which should promotes chips fragmentation, hence ease evacuation of chips. However, this alloy is difficult to fragment, due to its relative low ductility, in comparison with titanium alloy Ti-6Al-4V for example, also used widely in aeronautics. Mechanisms of chip formation have been widely studied by many researchers [2,3,4,5,6,7]. Komanduri and Brown [2] classified chips on four types, according to their morphology (wavy, discontinuous, segmented, and catastrophic shear chip), and gave the definition of each one. Globally, the origin of each type depends on cutting conditions, cutting tool geometry, cutting angles, and the machined material (thermo-mechanical characteristics: Soft or hard materials). To understand mechanisms of chip formation, micrographic analysis was conducted in several research works (e.g., [3,4], [2,5]). For example, Bayoumi and Xie [3] analyzed metallurgical aspects of the chip formation when cutting the usual titanium alloy Ti-6Al-4V.
The second one is the BUE formation, which may alter the surface quality, since the adhered work material can pass under the tool flank face and acts on the newly generated surface. Also, the BUE edge affects the chips morphology since the BUE changes the tool rake angle. The literature review shows that the analysis of the BUE formation during the cutting process was a subject of several theoretical and experimental studies. For experimental aspects, Ernst et al. [8] reported that the BUE can be often formed under high friction conditions at the tool-chip interface and its morphology is significantly influenced by the state of stress around the tool cutting edge. Shaw et al. [9] attribute the BUE formation to the temperature gradient across the chip and to the brittle behavior of the workpiece material. In addition, Philip [10] concluded that the BUE formation is the result of seizure and sub-layer flow at the tool-chip interface. The strain hardening of the work material promotes the formation of a stagnant build-up at the cutting edge.
In this paper, to analyze the machining process of AA2024–T351 (cutting forces, chip segmentation, and BUE formation), experimental and modelling studies were developed. In the experimental study, cutting speed, feed rate, and tool rake angle were varied to highlight there effect on the cutting process. The modelling study was performed to give more insight on revealed phenomena. This also allows simulating other cutting conditions not performed experimentally. Friction coefficient was varied in order to analyze the mechanism of BUE formation.

2. Experimental and Modelling Aspects

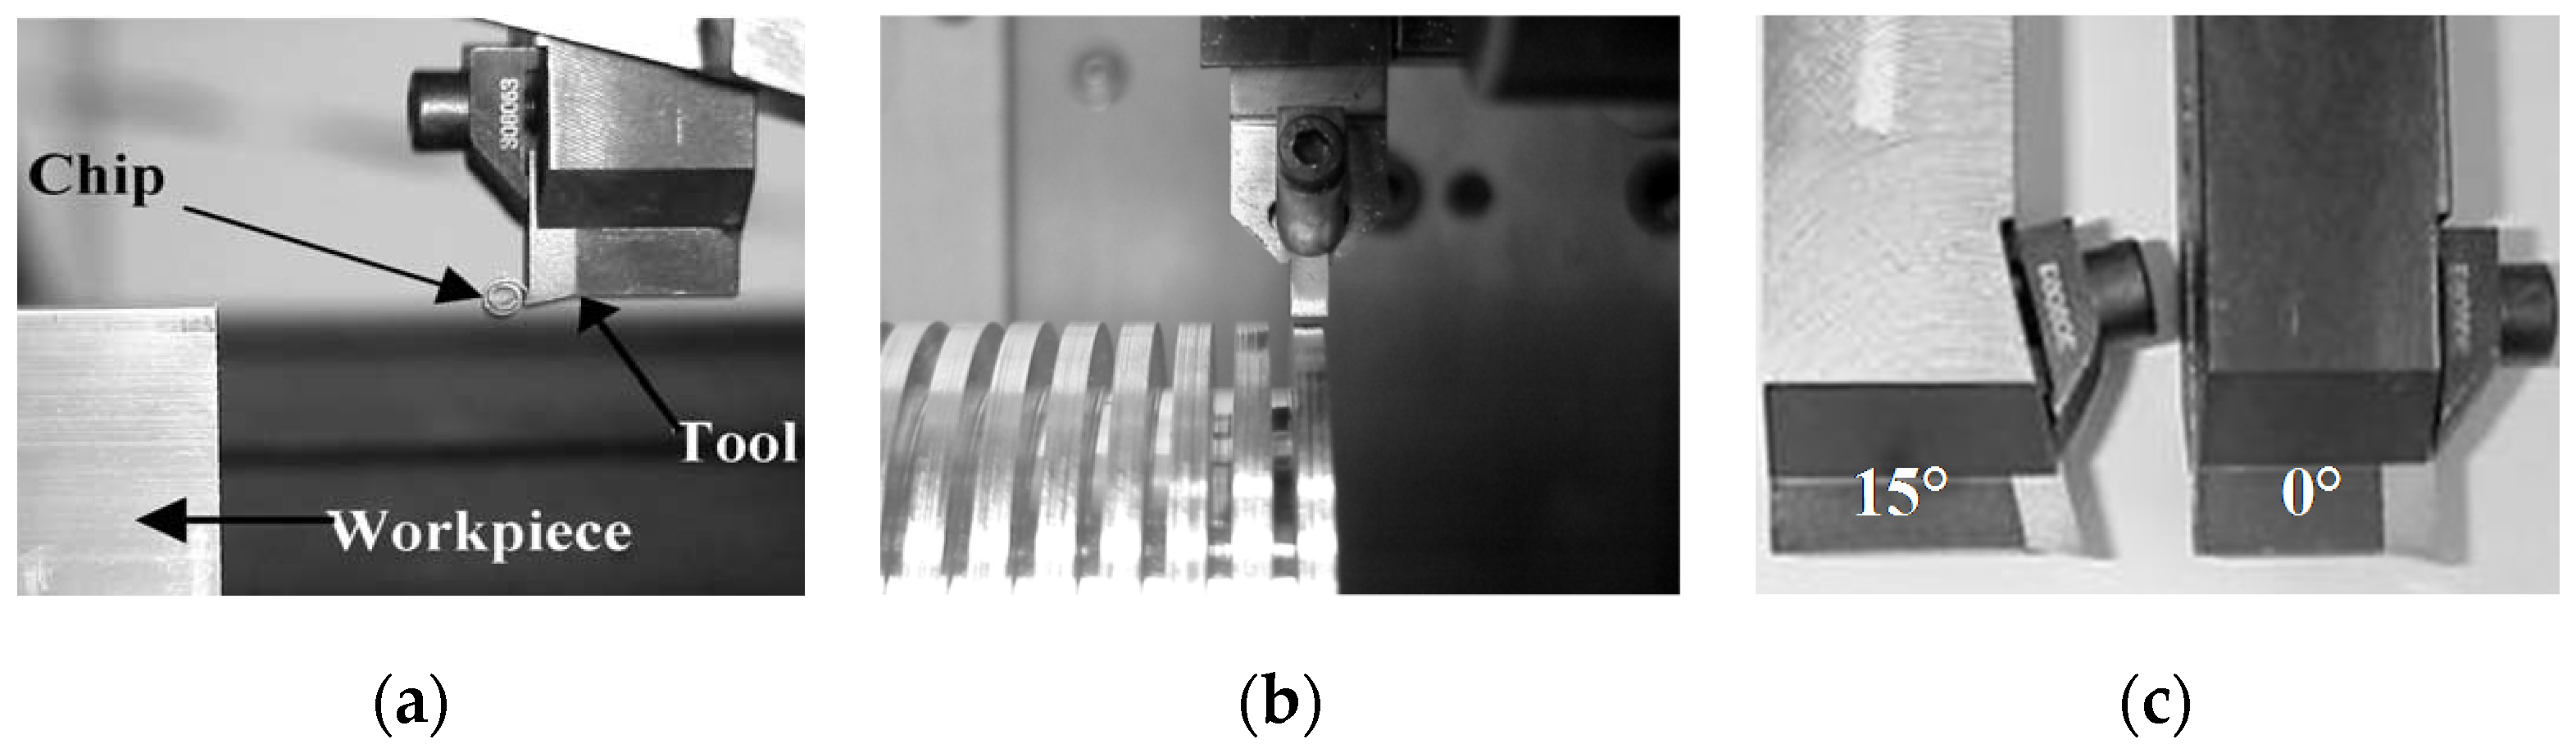
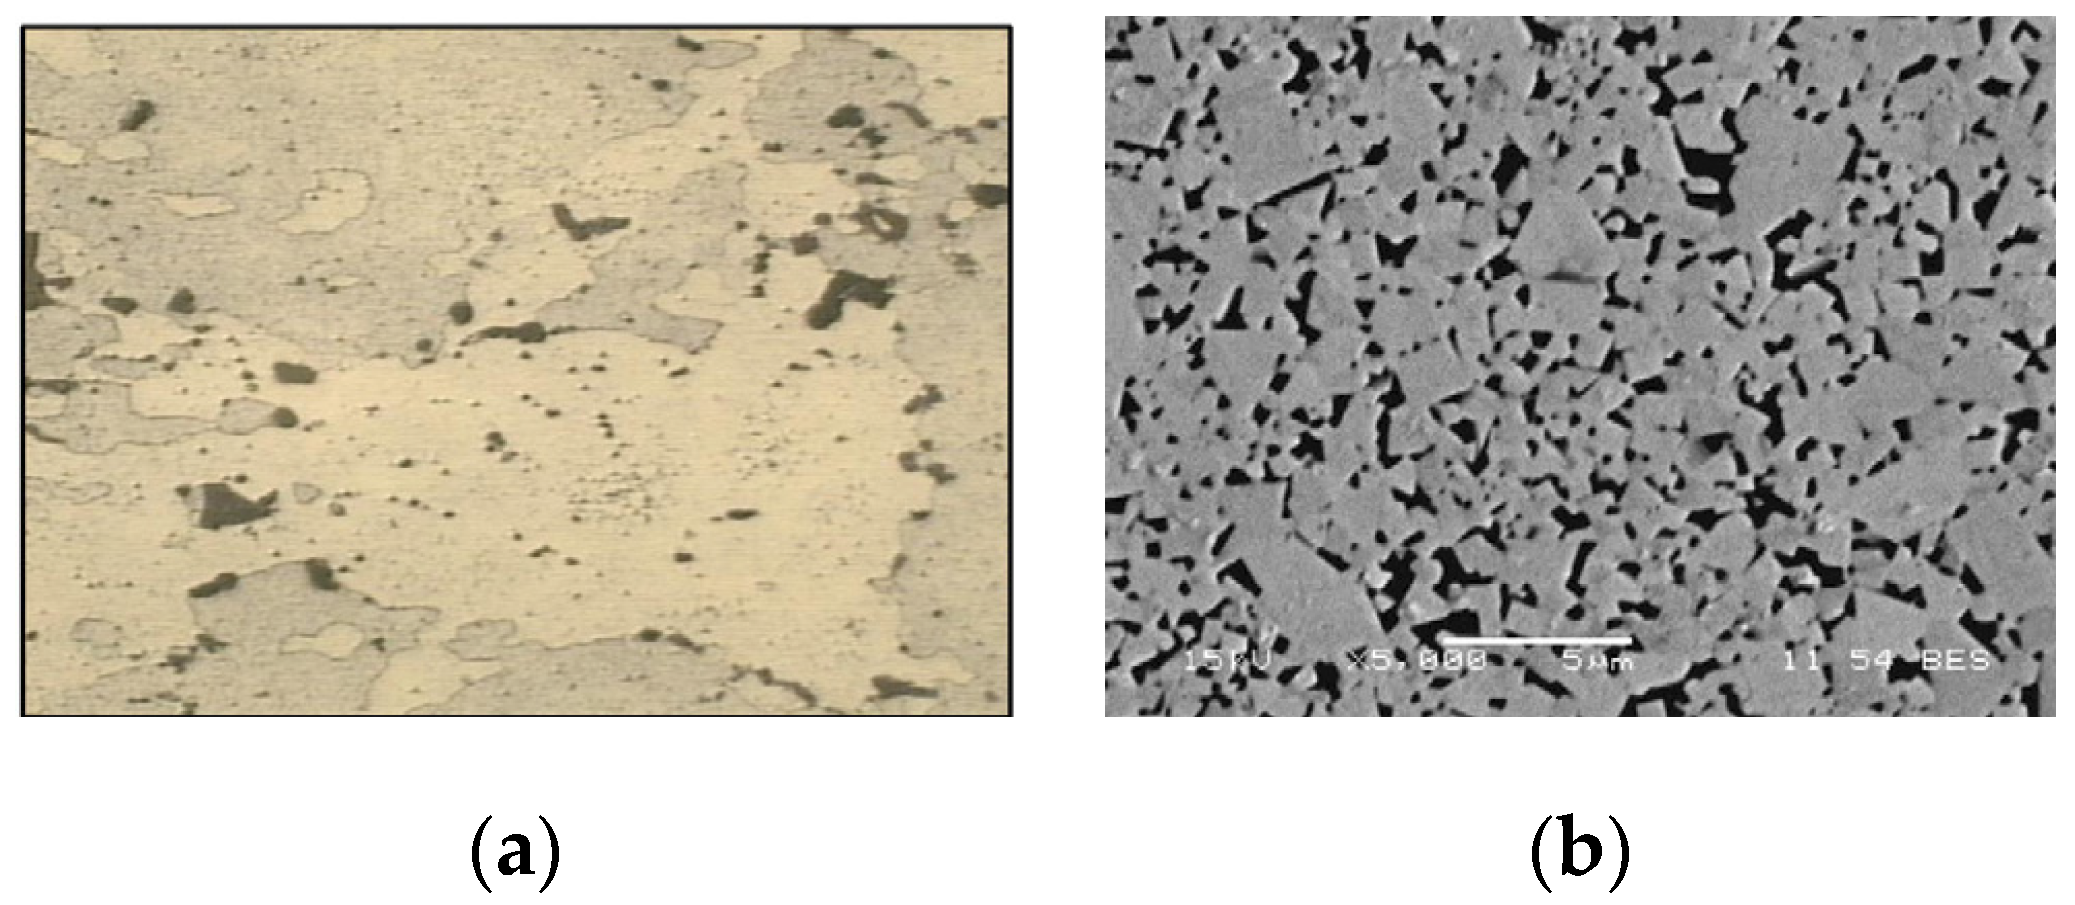
2.1. Experimental Aspects

To analyze the chip segmentation phenomenon, the experimental study previously done by one of the authors in [11] has been investigated. Orthogonal cutting tests, in dry conditions, were performed on a planer machine at low cutting speed to observe with CCD (charge-coupled device) camera the cutting process (chip formation), and on a CNC (computer numeric control) lathe to allow variation of the cutting speed in a large range, as shown in Figure 1a,b. Uncoated carbide inserts, of type K4, have been used as cutting tools with two rake angles (0° and 15°), see Figure 1c. The value of the clearance angle is kept constant (7°) for all tools and all cutting conditions. Each tool has a cutting edge radius of 0.01 mm. The depth of cut in both planing and turning processes is 4 mm for all cutting conditions.
The inserts material is a WC-Co cemented tungsten carbide with cobalt as binder phase. The chemical analysis on a polished surface inside the tool gives a composition with 6 wt. % of cobalt and no mixed carbides such as TiC, TaC, and NbC have been detected in the microstructure. The cobalt binder is uniformly distributed with WC grains (Figure 2b). The workpiece material is the usual aeronautical aluminum alloy AA2024-T351 (Figure 2a). Its chemical composition is given in Table 1.
Using a high speed camera and dynamometer table, instantaneous images of the cutting process and cutting forces were obtained. As shown in Figure 3, for a low feed (0.1 mm) a continuous chip was observed, while for a large feed (0.3 mm) segmented chip was obtained with the two tools (0° and 15°), but the chip segmentation is different. Average cutting forces (evaluated in stabilized range or steady state of cutting) and contact lengths (evaluated from instantaneous images of the cutting process) are reported in Table 2. The analysis of the results shows that there is a strong correlation between cutting conditions (cutting speed and feed), cutting parameters (rake angle), and the chip morphology.
The BUE occurs at particular cutting conditions when machining ductile metals, like aluminum alloy AA2024-T351. The effect of uncut chip thickness on the formation of the BUE was examined on an instrumented planar machine, where the tool rake angle was varied. Different sequences of the cutting process were recorded by the CCD camera and then analyzed. From instantaneous images of Figure 3, it can be observed that the BUE occurs for the low rake angle (i.e., 0°) and uncut chip thicknesses of 0.1 mm. Figure 4 highlights the BUE formation in the vicinity of the tool tip. Indeed, a low rake angle makes the work material flow difficult. This promotes the sticking contact at the tool tip, which results in accumulation of the work material in this zone and hence the BUE formation.
Additional experimental tests have been done under orthogonal turning to bring out the effect of cutting speed, with cutting tool angle of 0° and feed rate fixed to 0.1 mm/rev. The depth of cut is the same as in planing process (i.e., 4 mm). Results are reported in Table 2 and Figure 5. The apparent friction coefficient, reported in Figure 5, is determined as the ratio of feed force by cutting force in the case of considered rake angle (i.e., 0°).

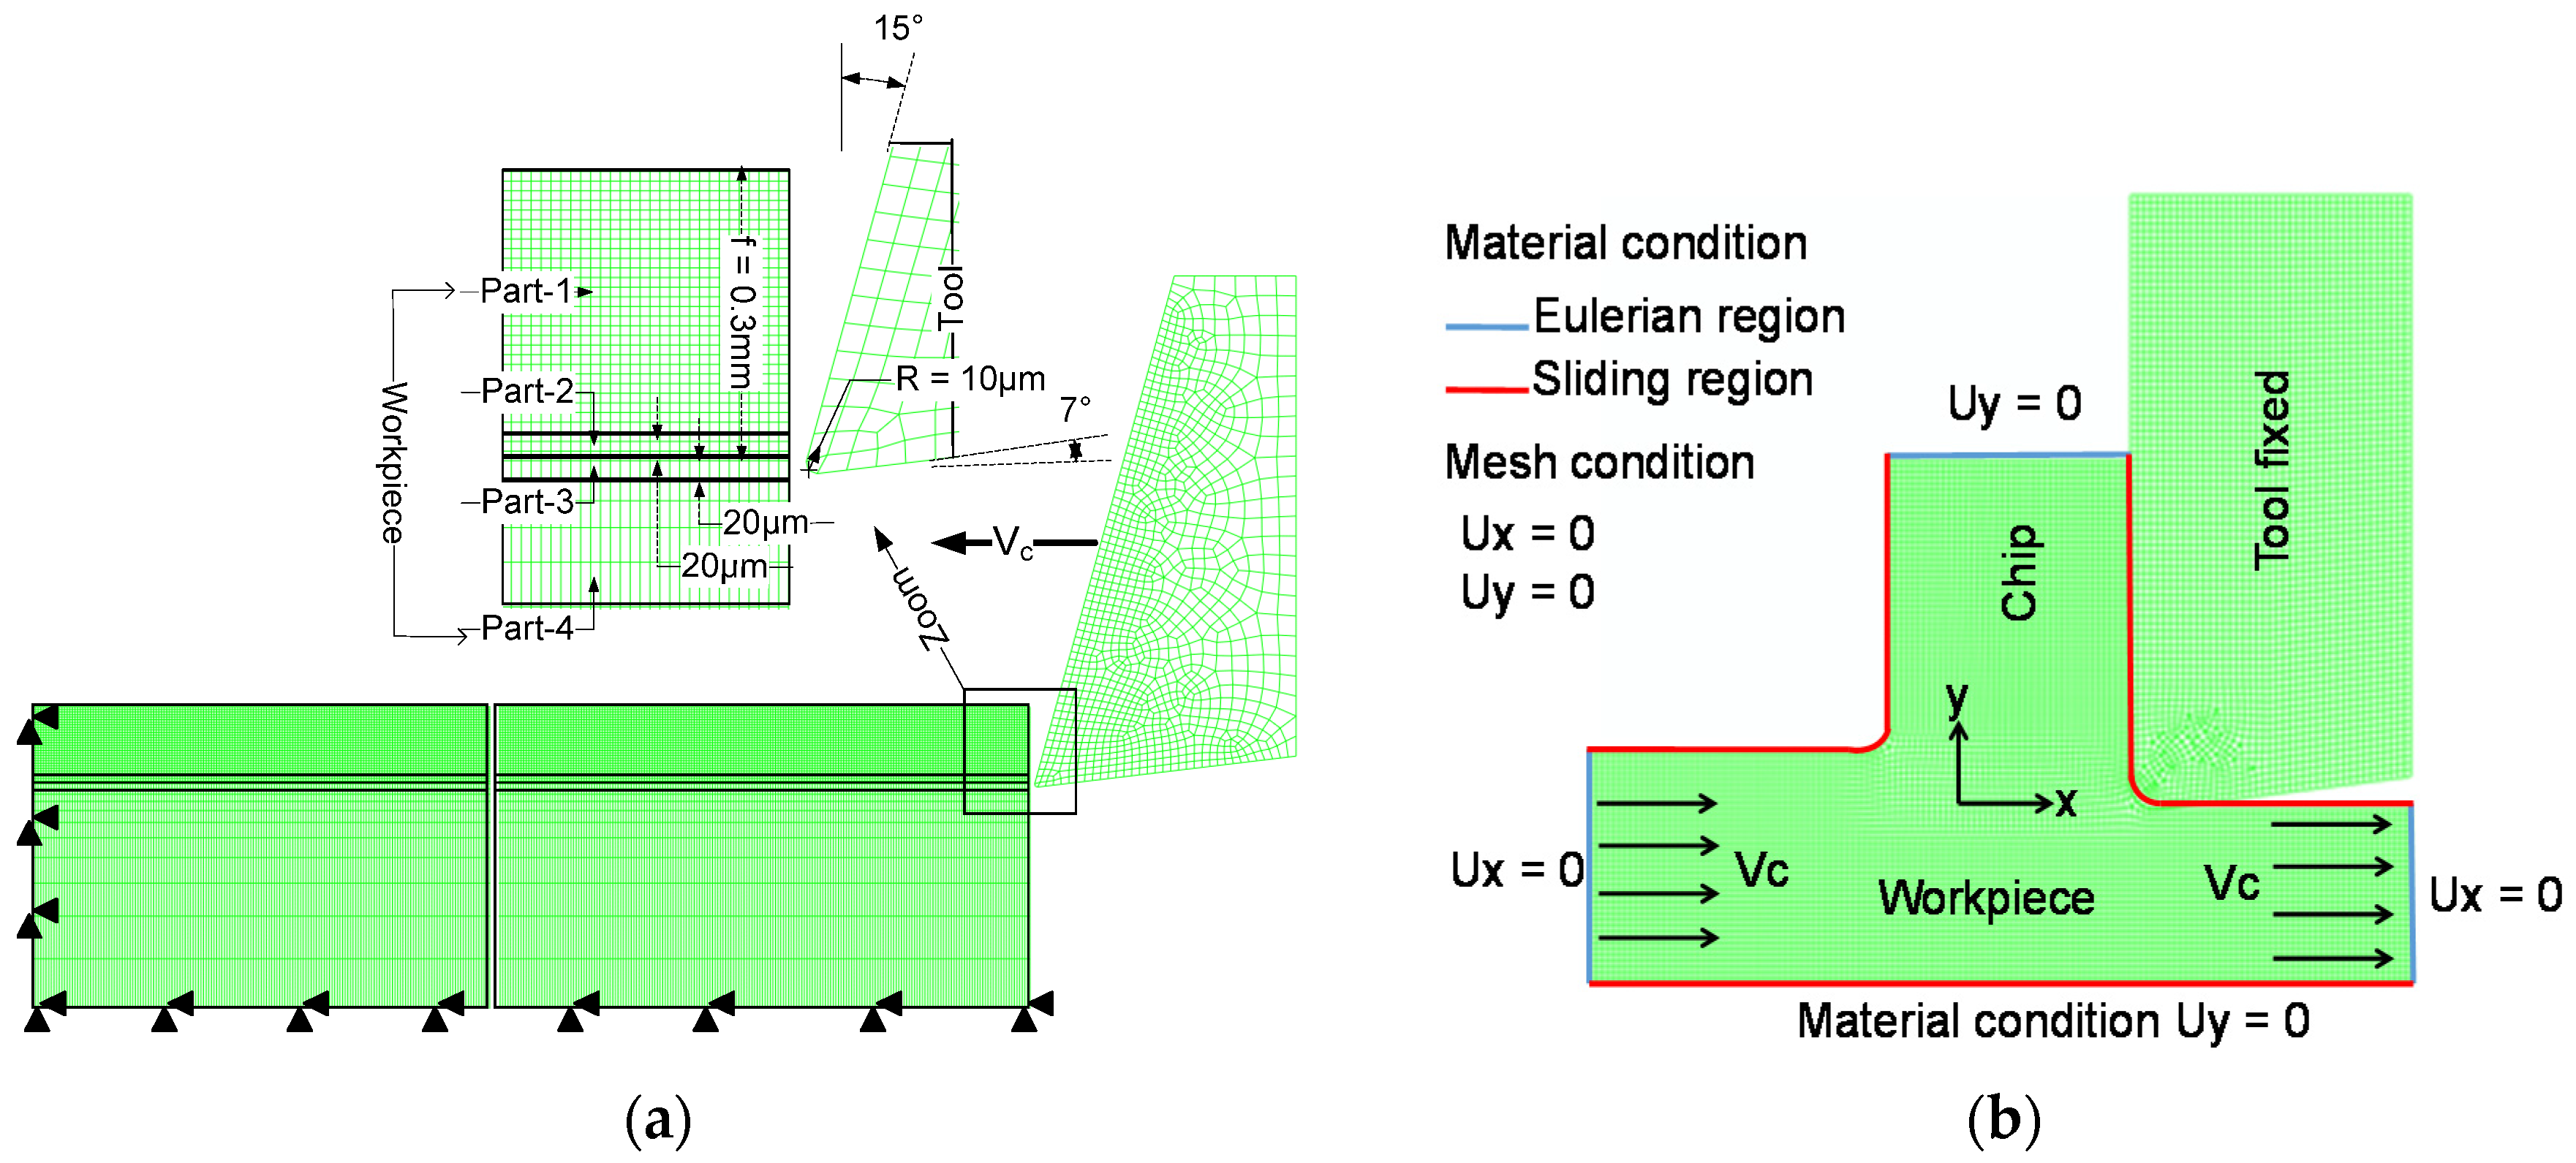
2.2. Modelling Aspects

In order to reproduce and then analyze observed cutting phenomena (cutting forces evolution, chips segmentation, and BUE formation), a predictive modelling theory, based on FEM, was developed. Two formulations (2D LAG-FE and 2D ALE-FE) were developed in Abaqus/Explicit FE code [13] to represent orthogonal cutting tests. The 2D LAG-FE was developed in order to reproduce the chips segmentation phenomenon. While the 2D ALE-FE was developed in order to reproduce the BUE phenomenon. Figure 6 illustrates the two FE models.
Physical properties of the workpiece and tool materials are given in Table 3.
To represent the of the workpiece material behavior during machining, a Johnson-Cook thermo-viscoplastic-damage model has been adopted. The flow stress is given as:
σ ¯ = [ A + B ( ε ¯ p ) n ] [ 1 + C ln ( ε ¯ ˙ p ε ¯ ˙ 0 ) ] [ 1 ( T T 0 T m T 0 ) m ]
The damage behavior is described by a damage initiation criterion and a damage evolution law up to fracture. The damage initiation criterion is given by:
ω d = d ε ¯ p ε ¯ d p   with   0 ω d 1 ε ¯ d p = [ d 1 + d 2 e ( d 3 P σ ¯ ) ] Stress triaxiality [ 1 + d 4 ln ε ¯ ˙ * ] Viscosity [ 1 d 5 T * ] Temperature
The damage evolution can be expressed by the following relationships:
d = { u ¯ p u ¯ f = L ε ¯ p u ¯ f = 2 G f L ε ¯ p σ ¯ linear evolution 1 exp ( 0 u ¯ p σ ¯ G f d u ¯ p ) exponential evolution
The true stress tensor is defined as:
σ = ( 1 d ) σ ˜
where σ ˜ is the effective stress, representing a stress state that would exist in the material if no damage occurs. The behavior parameters of the workpiece material are given in Table 4.
As the mechanical behavior is affected by temperature, the mechanical plastic work generates heat flux which results in temperature rise. The heat flux due to this phenomenon is described the following relation:
q ˙ p = η p σ ¯ : ε ¯ ˙ p
The contact behavior at the tool-workpiece interface is defined by the relationship between the normal friction stress σ n and the shear friction stress τ f , as follows:
τ f = min ( μ σ n , τ max )
The friction at the contact interface may generate a heat flux which is evaluated by the following relation:
q ˙ f = f f η f τ f V s
The mechanical plastic work of the chip may affect heat exchange at the tool-workpiece interface. To take account of this energy in the heating of the tool a heat conduction flux, q ˙ c , is introduced, so the heat balance at the interface can be written as follows:
q ˙ t o o l = f f q ˙ f + q ˙ c q ˙ w o r k p i e c e = ( 1 f f ) q ˙ f q ˙ c with  q ˙ c = h ( T i n t w T i n t t )
The tool-workpiece interface parameters depend on the adopted FE model (LAG-FE or ALE-FE). Particularly, the coefficient of friction (COF) is adjusted to better fit cutting forces.

3. Results and Discussion

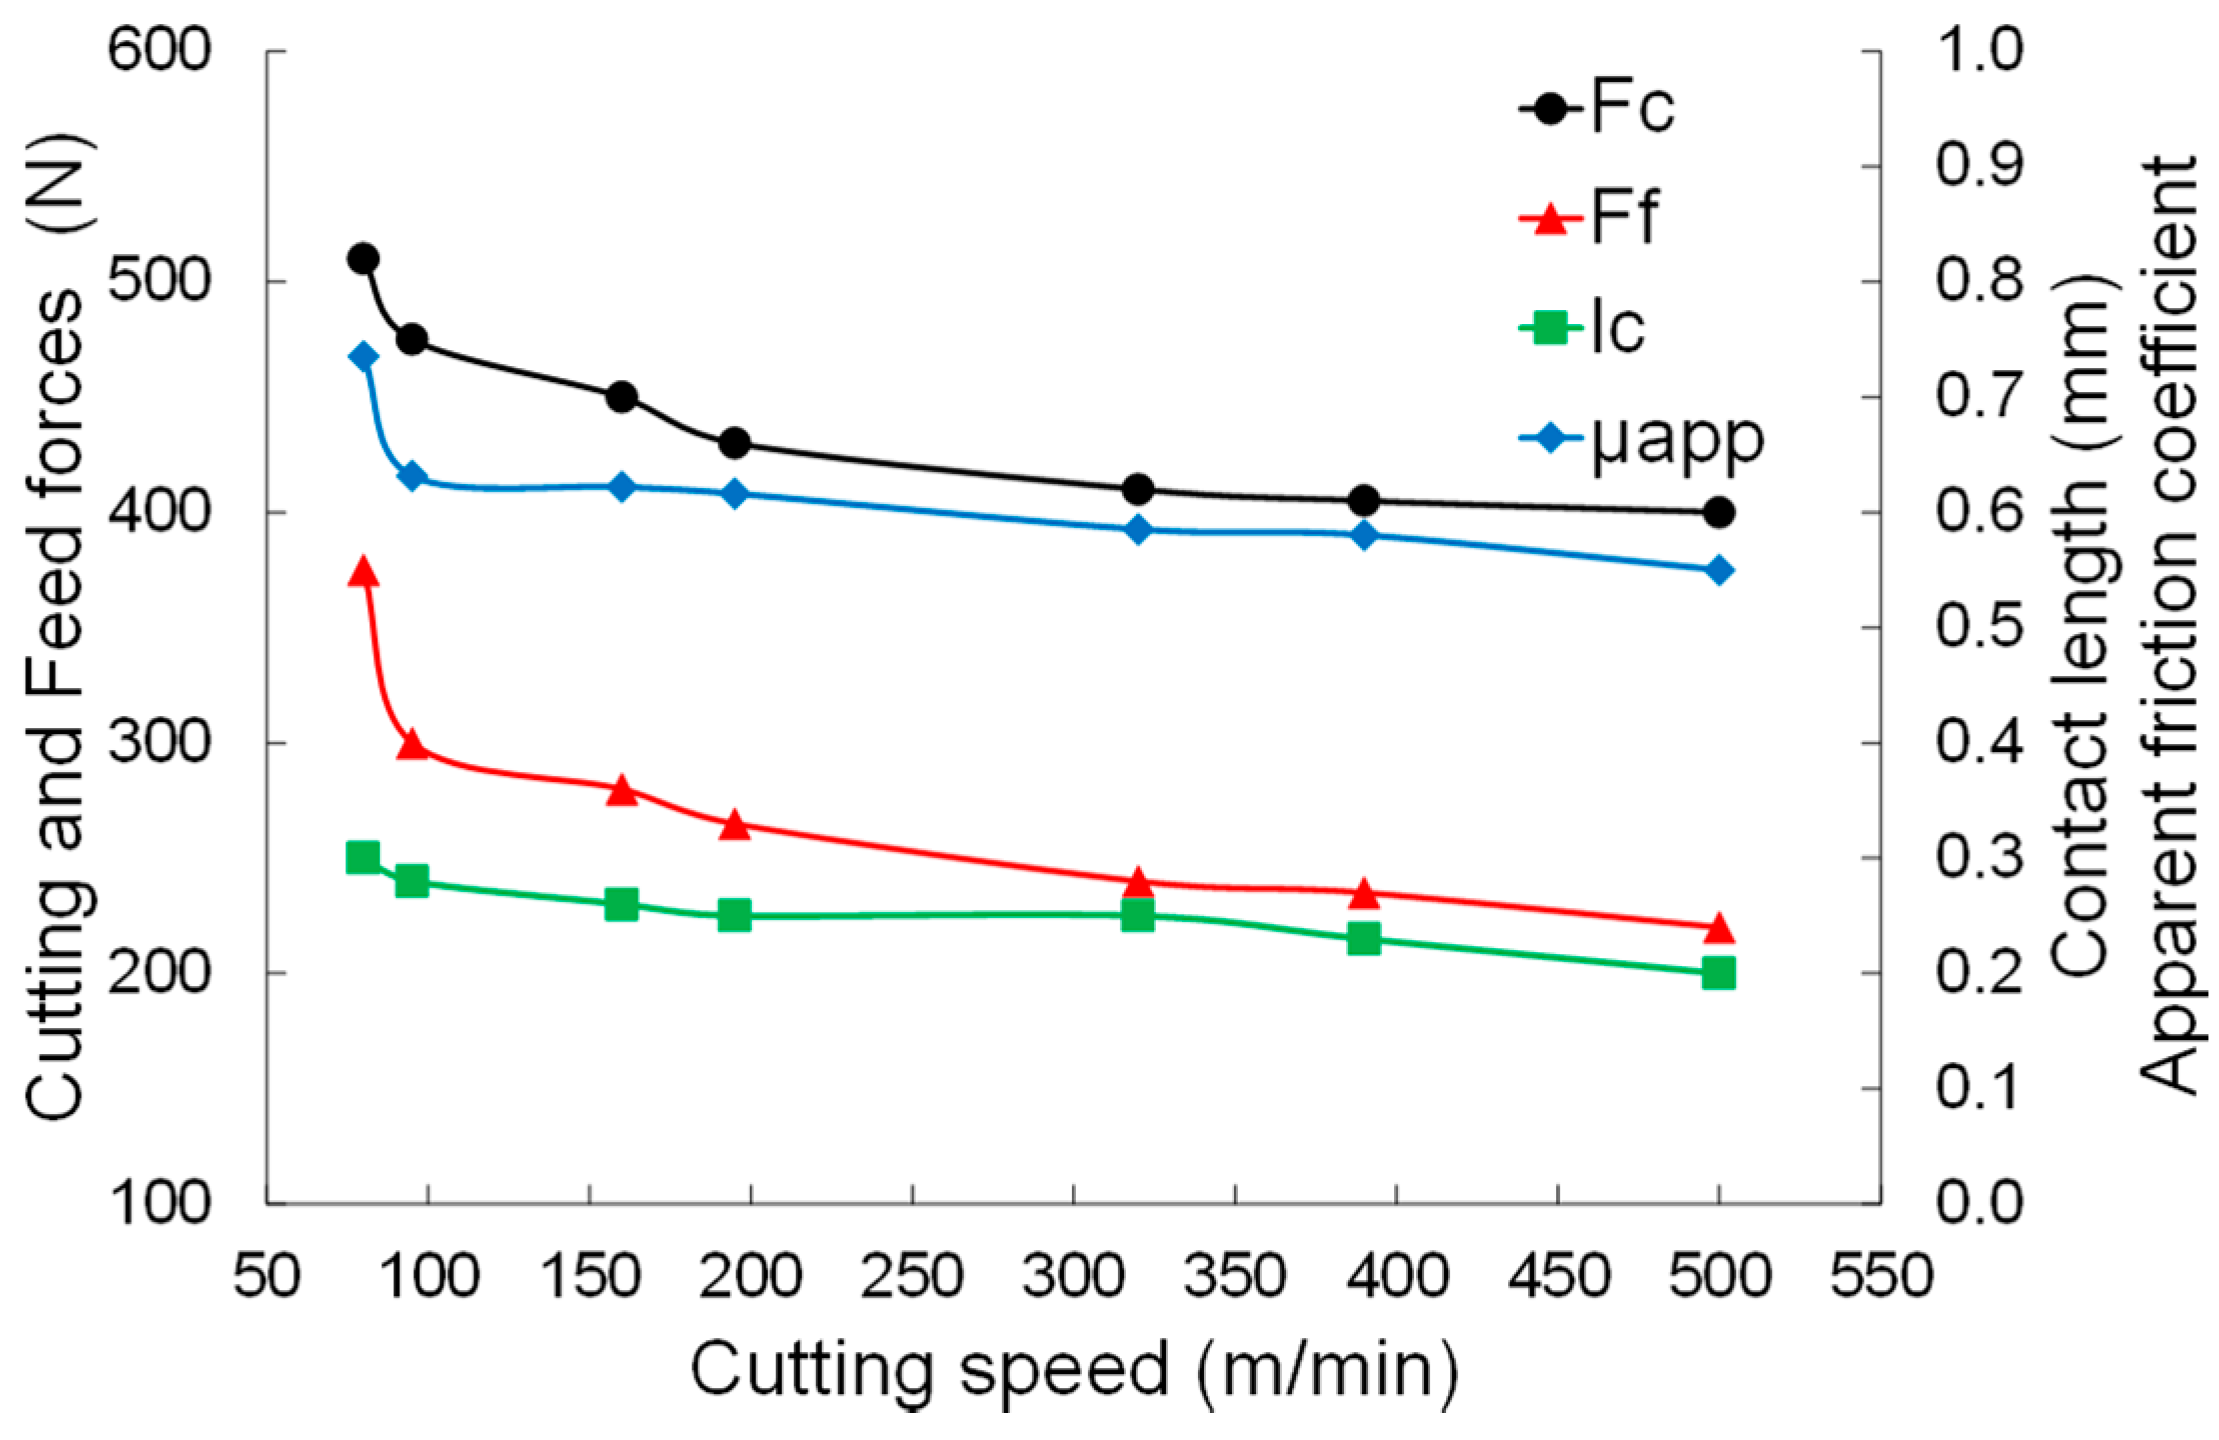
3.1. Cutting Forces Analysis

As illustrated in Figure 7, both FE models effectively predict cutting force and contact length (upper values with ALE-FE model and lower values with LAG-FE model). However, LAG-FE model highly underestimates feed force, due to the FE deletion in a thin layer defined between the chip and workpiece. Indeed, this induces a loss of contact at the flank face which, in turn, induces a loss of contact pressure acting in the feed direction. The apparent friction coefficient is globally well estimated by the ALE-FE model, except for the lower cutting speed (80 m/min). While since LAG-FE model fails to predict feed force, this impacts the apparent friction coefficient (recall that it is defined as a ratio of feed force by cutting force in the case of rake angle of 0°). Comparison between LAG-FE model, ALE-FE model and experimental data is reported in Table 5 and Table 6.
At first view, the ALE-FE gives better results, since it effectively predicts both cutting force and feed force. However, this is not sufficient, since the capability of each model should be analyzed regrading other phenomena, like reproducing continuous or segmented chips and BUE formation. This is what is developed in the two following sections.

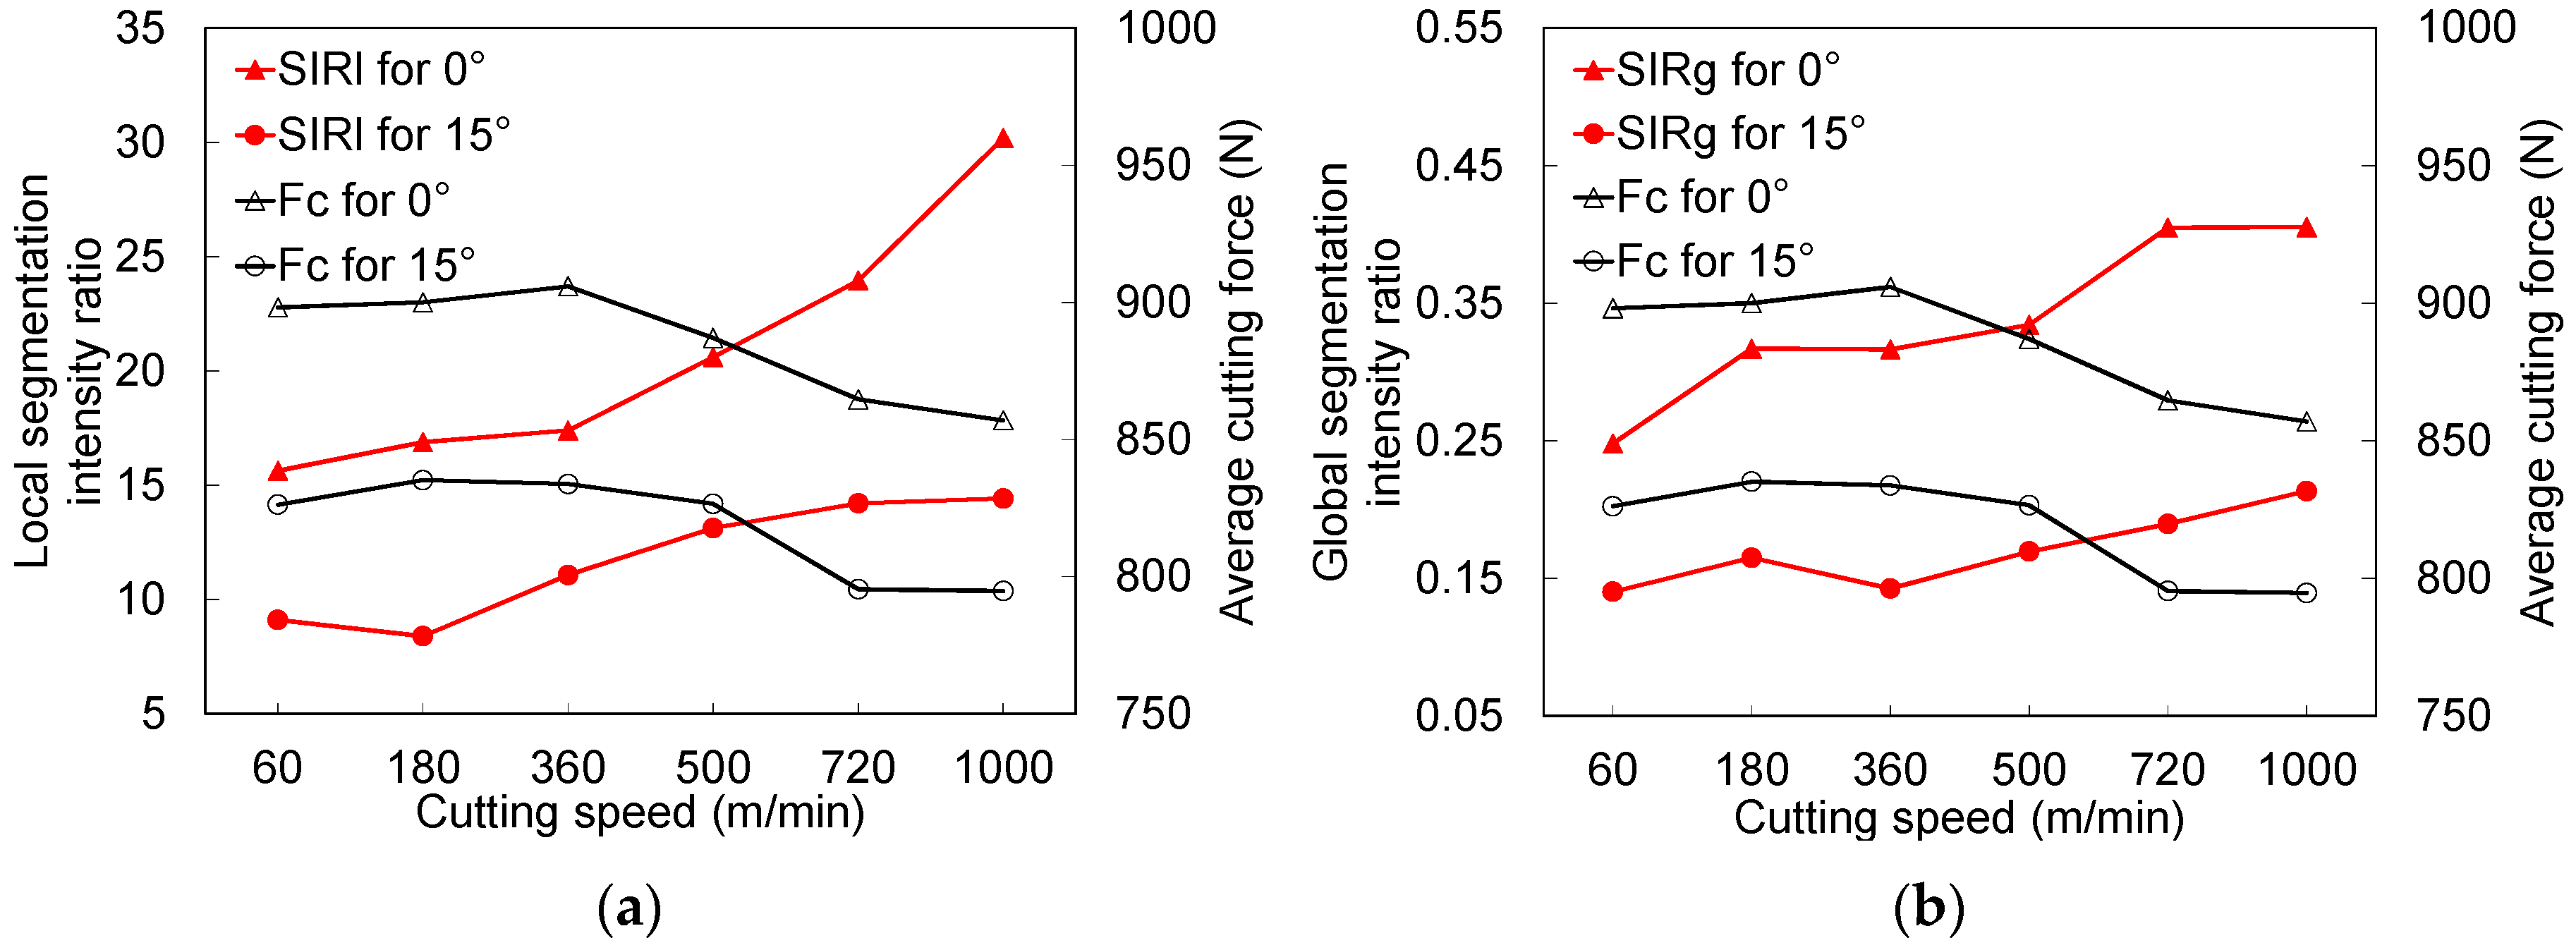
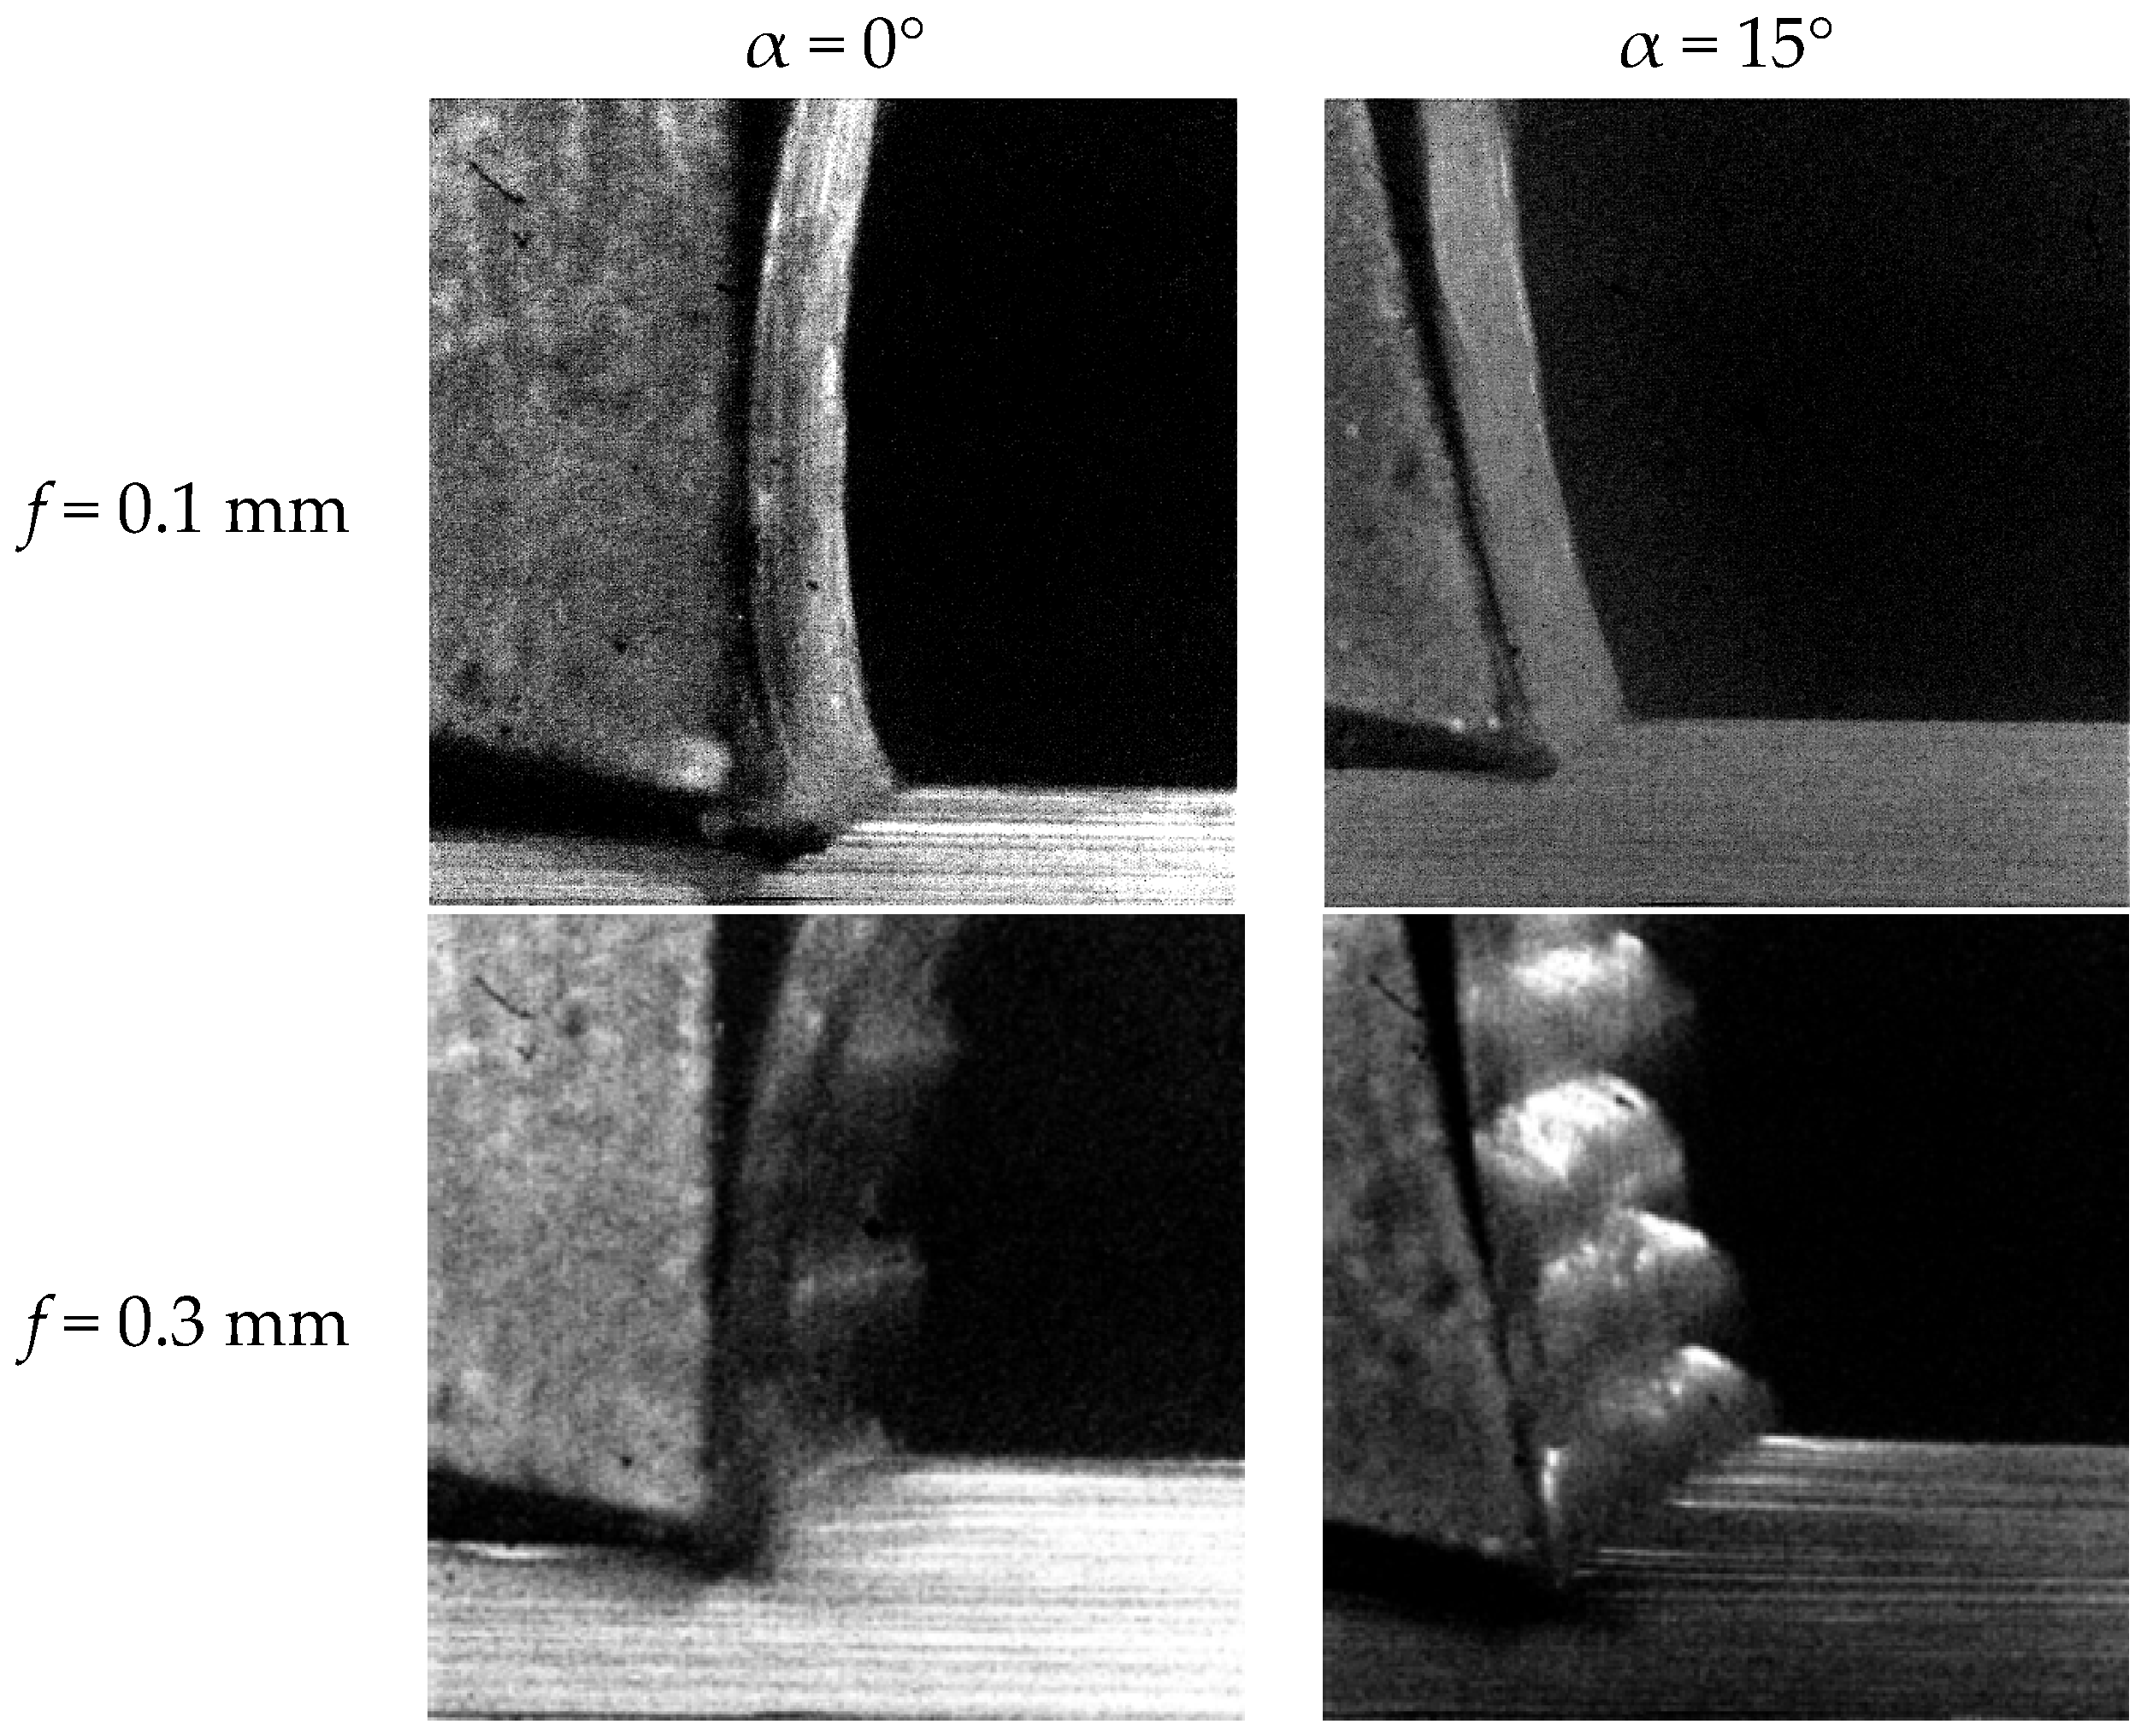
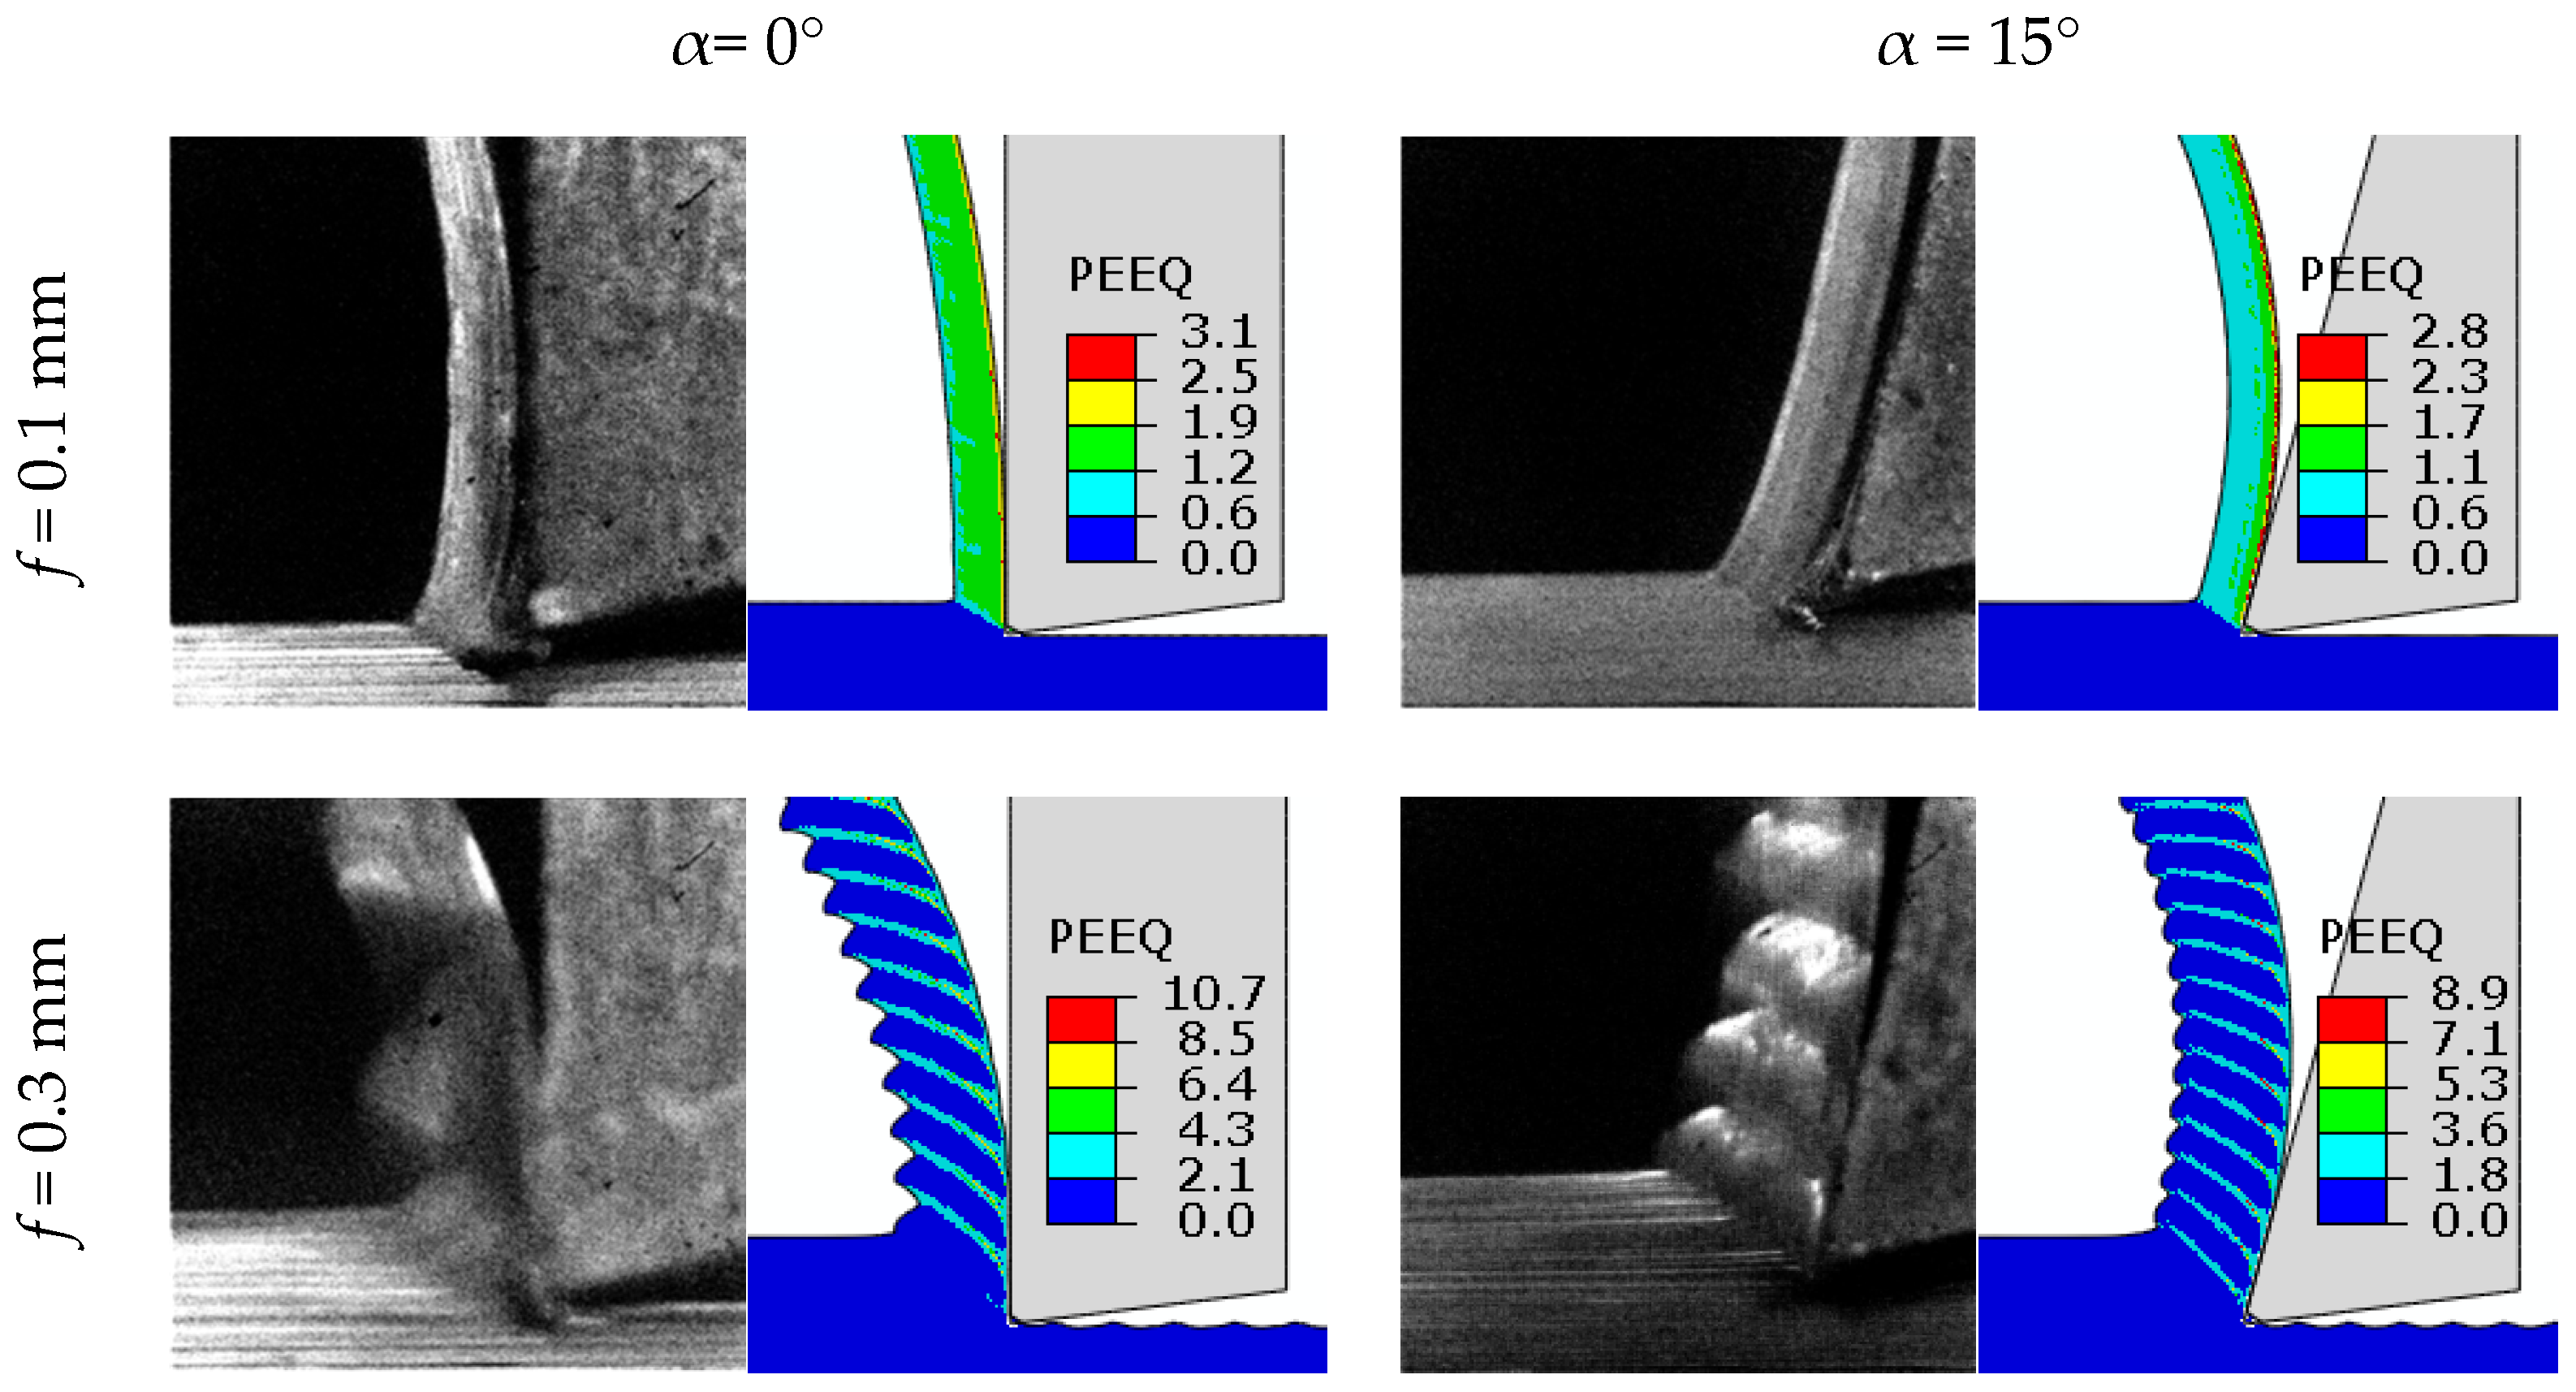
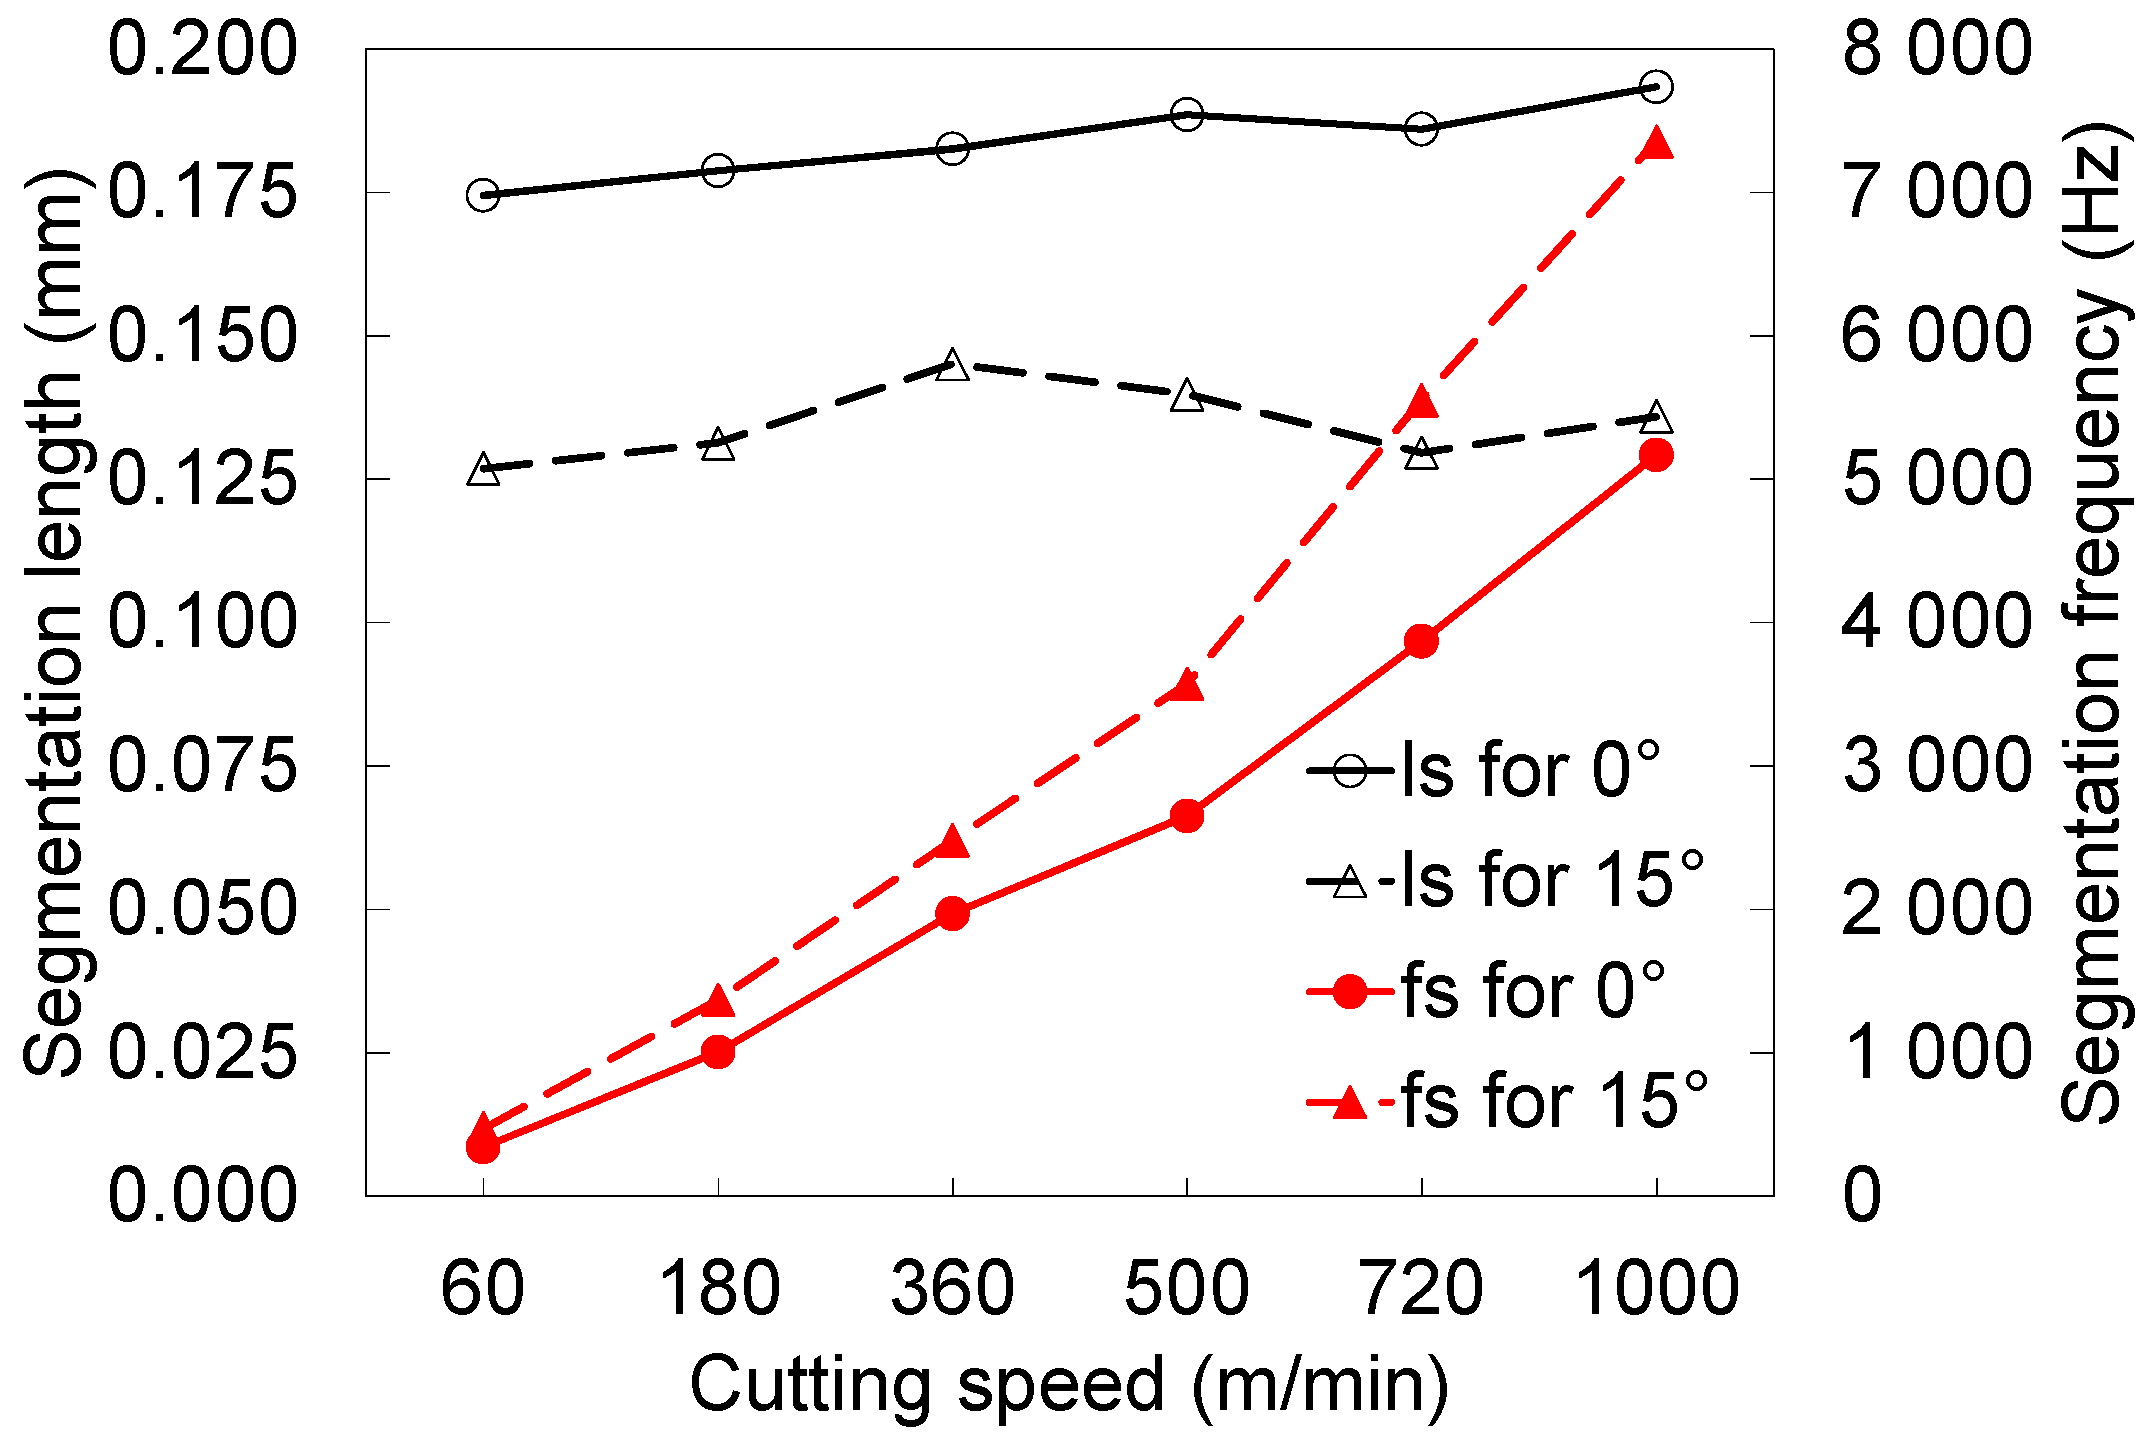
3.2. Chip Morphology-Segmented vs. Continuous Chip

To analyze finely the chip morphology, particularly chip segmentation phenomenon, orthogonal cutting tests performed on a planer machine (see Figure 1a and Figure 3) were firstly simulated with LAG-FE model. The model is able to reproduce non-continuous chip, like chip segmentation. This should highlight the effect of cutting conditions (cutting speed, feed, and tool-rake angle) on the chip morphology, especially on the chip segmentation phenomenon.
The chip morphology often carries the signature of correct behavior chosen in simulations. From Figure 8, it can be seen that simulated chips are in good agreement with what it is observed by CCD camera. For the small feed (0.1 mm) continuous shape is obtained regardless of rake angle. For the large feed (0.3 mm) segmented chips are well reproduced for both rake angles.
To quantify the chip morphology some parameters are introduced as follows:
f s = V c l s S I R g = Δ h f = h max h min f S I R l = ε ¯ i n p ε ¯ o u t p
where f s and l s are the chip segmentation frequency and the distance between two successive segments. Note that these are only indicators of the apparition of successive shear localization bands in the chip, but it does not give information about the intensity of the segmentation phenomenon. So for this purpose S I R g and S I R l parameters are defined. S I R g is the global segmentation intensity ratio and S I R l is the local segmentation intensity ratio. h max and h min are the maximum and minimum chip thickness, respectively. ε ¯ i n p and ε ¯ o u t p are the plastic equivalent strain in and out of the shear band, respectively. Geometric parameters for the assessment of defined chip morphology parameters are illustrated in Figure 9.
Figure 10 shows the evolution of classical chip segmentation parameters f s and l s with cutting speed. f s Increases quasi-linearly with cutting speed for each tool rake angle, while l s is quasi-insensitive to the cutting speed. However, effect of the rake angle is not negligible and influences both f s and l s Indeed, increasing the rake angle decreases the chip segmentation length, so the slope of f s curve as function of cutting speed increases when the rake angle increases. The consequence of this is that the gap Δ f s = f s ( 15 ° ) f s ( 0 ° ) increases when cutting speed increases. Globally, f s and l s give an indication on the number of shear bands within the same chip length, but these two quantities are not sufficient to quantify the chip segmentation, since they do not give an indication on the intensity of the phenomenon.
Hence, to quantify the intensity of chip segmentation phenomenon, introduced S I R g and S I R l parameters were assessed. As shown in Figure 11, these two parameters increase with cutting speed and tend to stagnate at high cutting speed. This confirms that increasing cutting speed promotes the chip segmentation, as was often observed in experimental tests. Hence, these parameters are adequate to quantify the intensity of chip segmentation phenomenon. In addition, Figure 11 brings out the close link between chip segmentation intensity and average cutting force. For each rake angle, as cutting speed increases, average cutting force decreases and S I R g and S I R l parameters increase. This confirms that the chip segmentation phenomenon is at the origin of the cutting force reduction when machining aluminum alloy AA2024-T351.

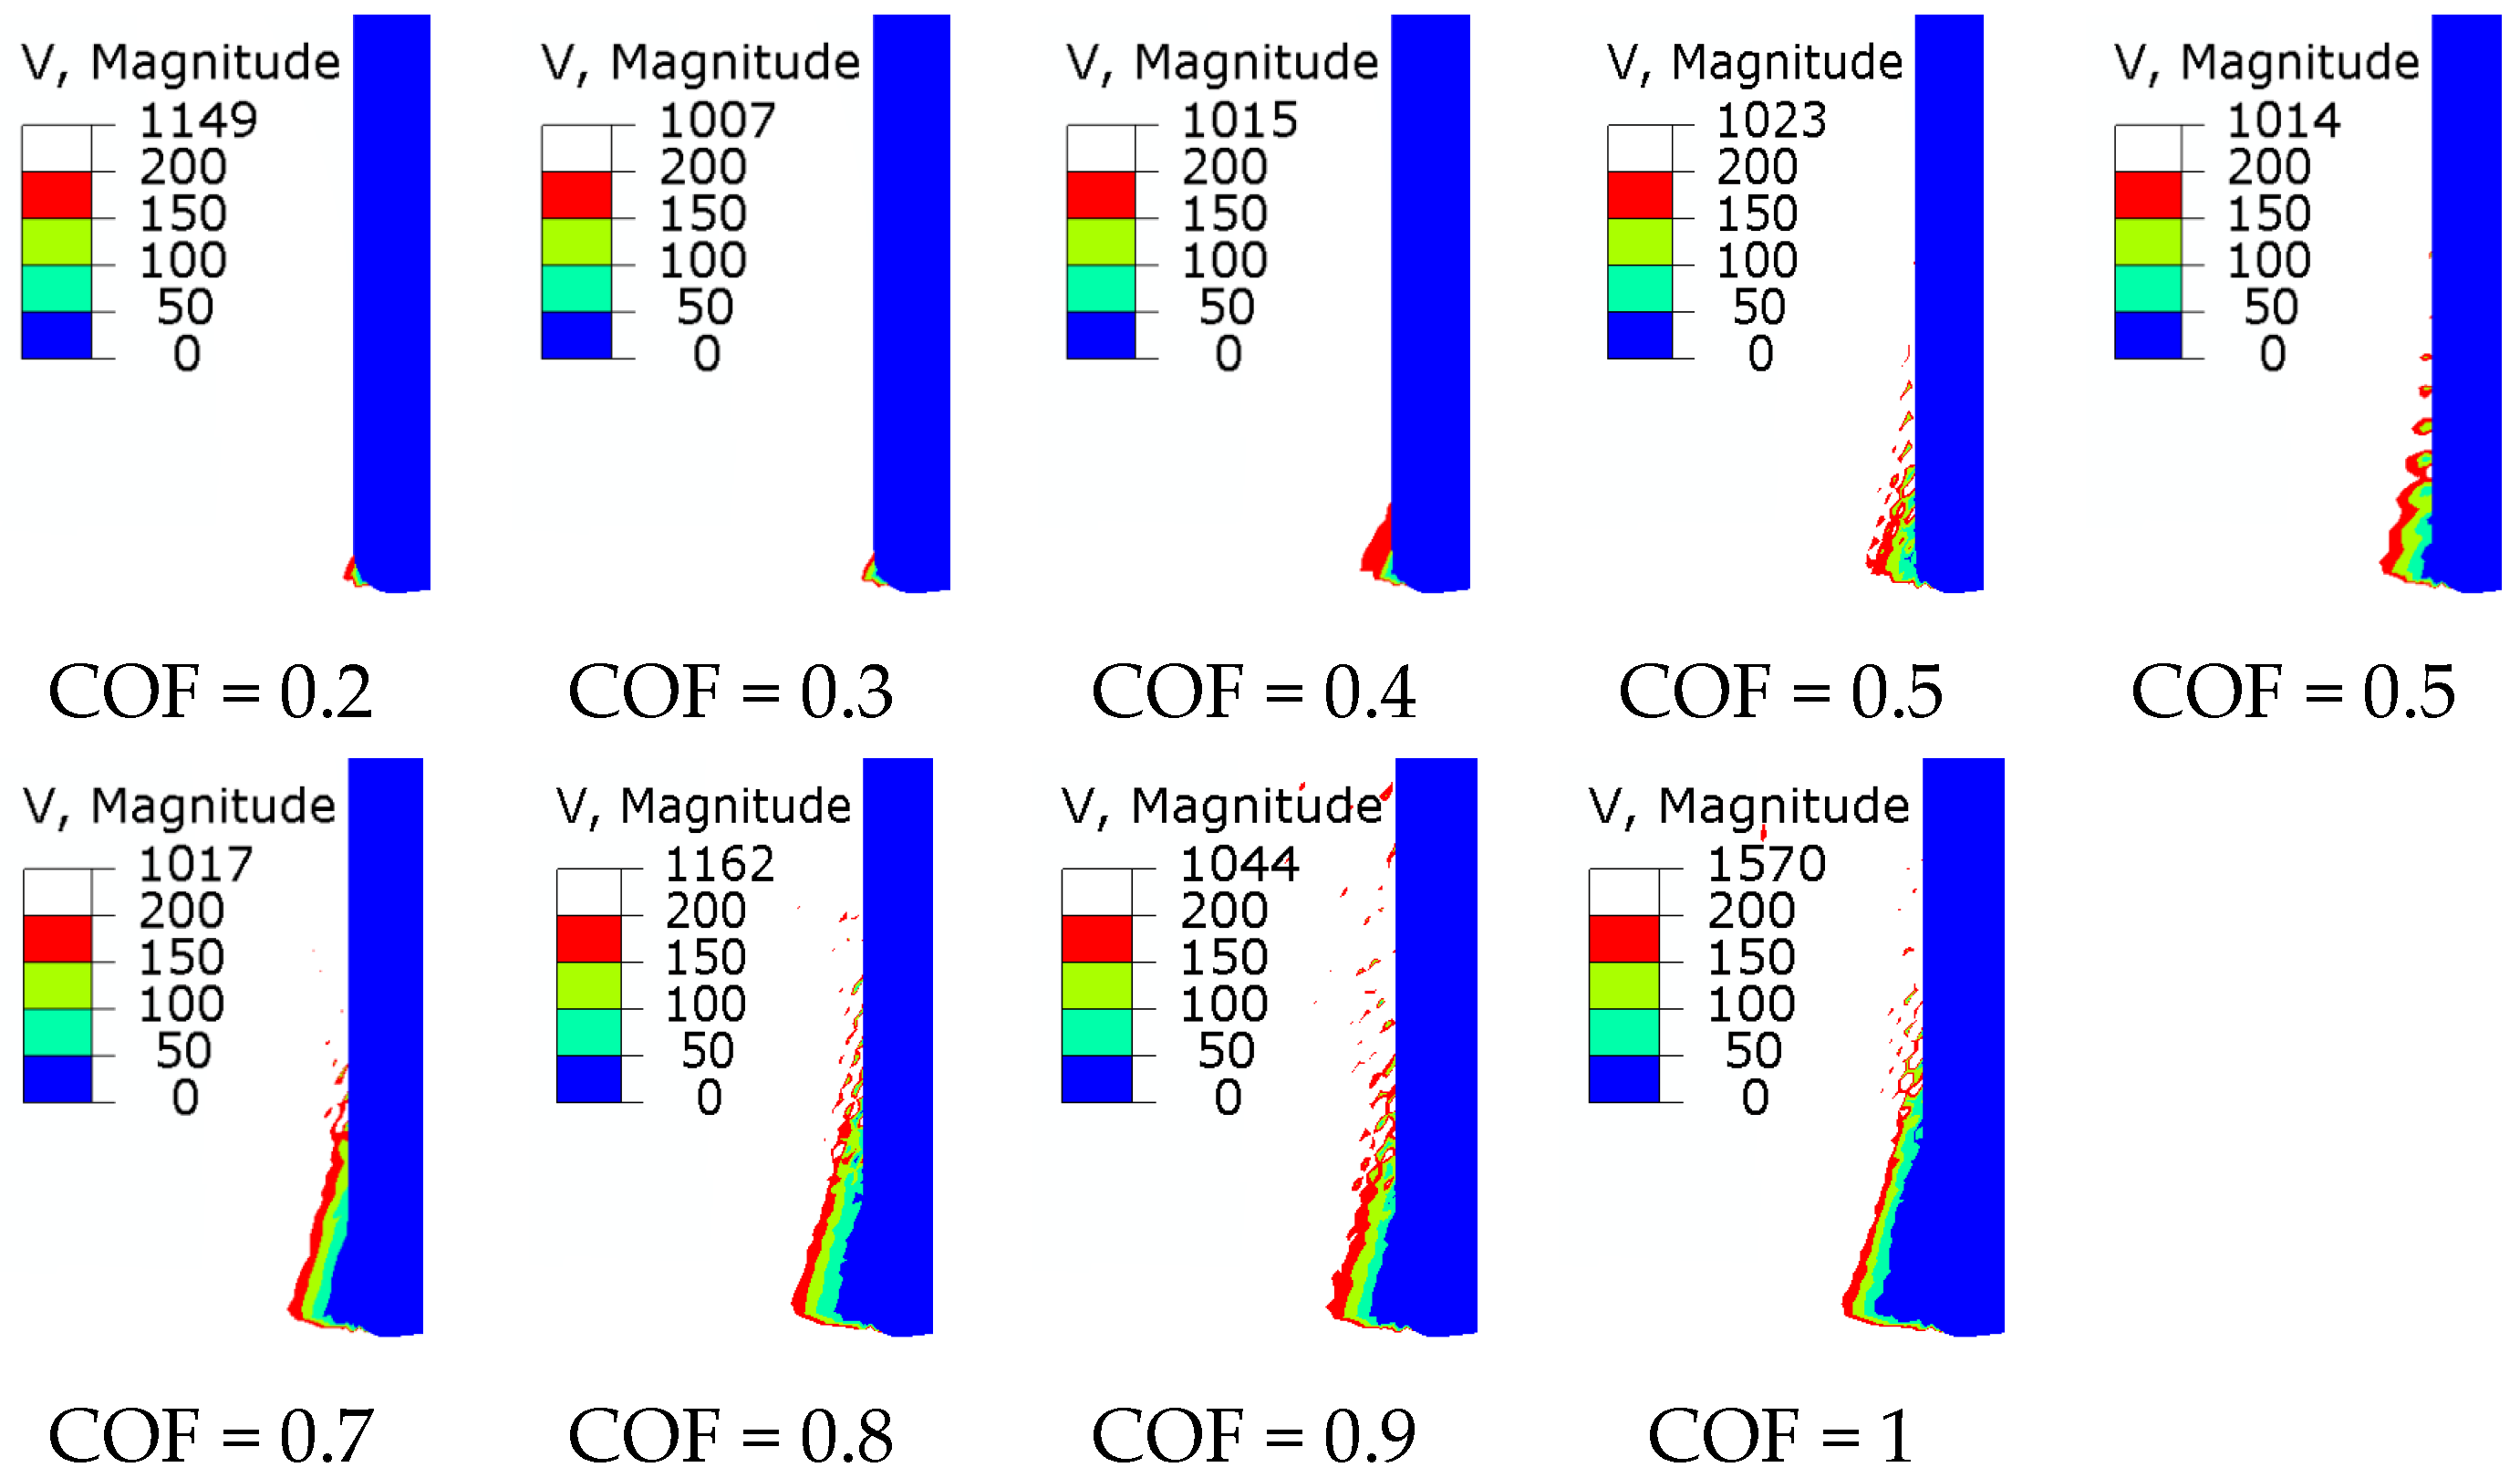
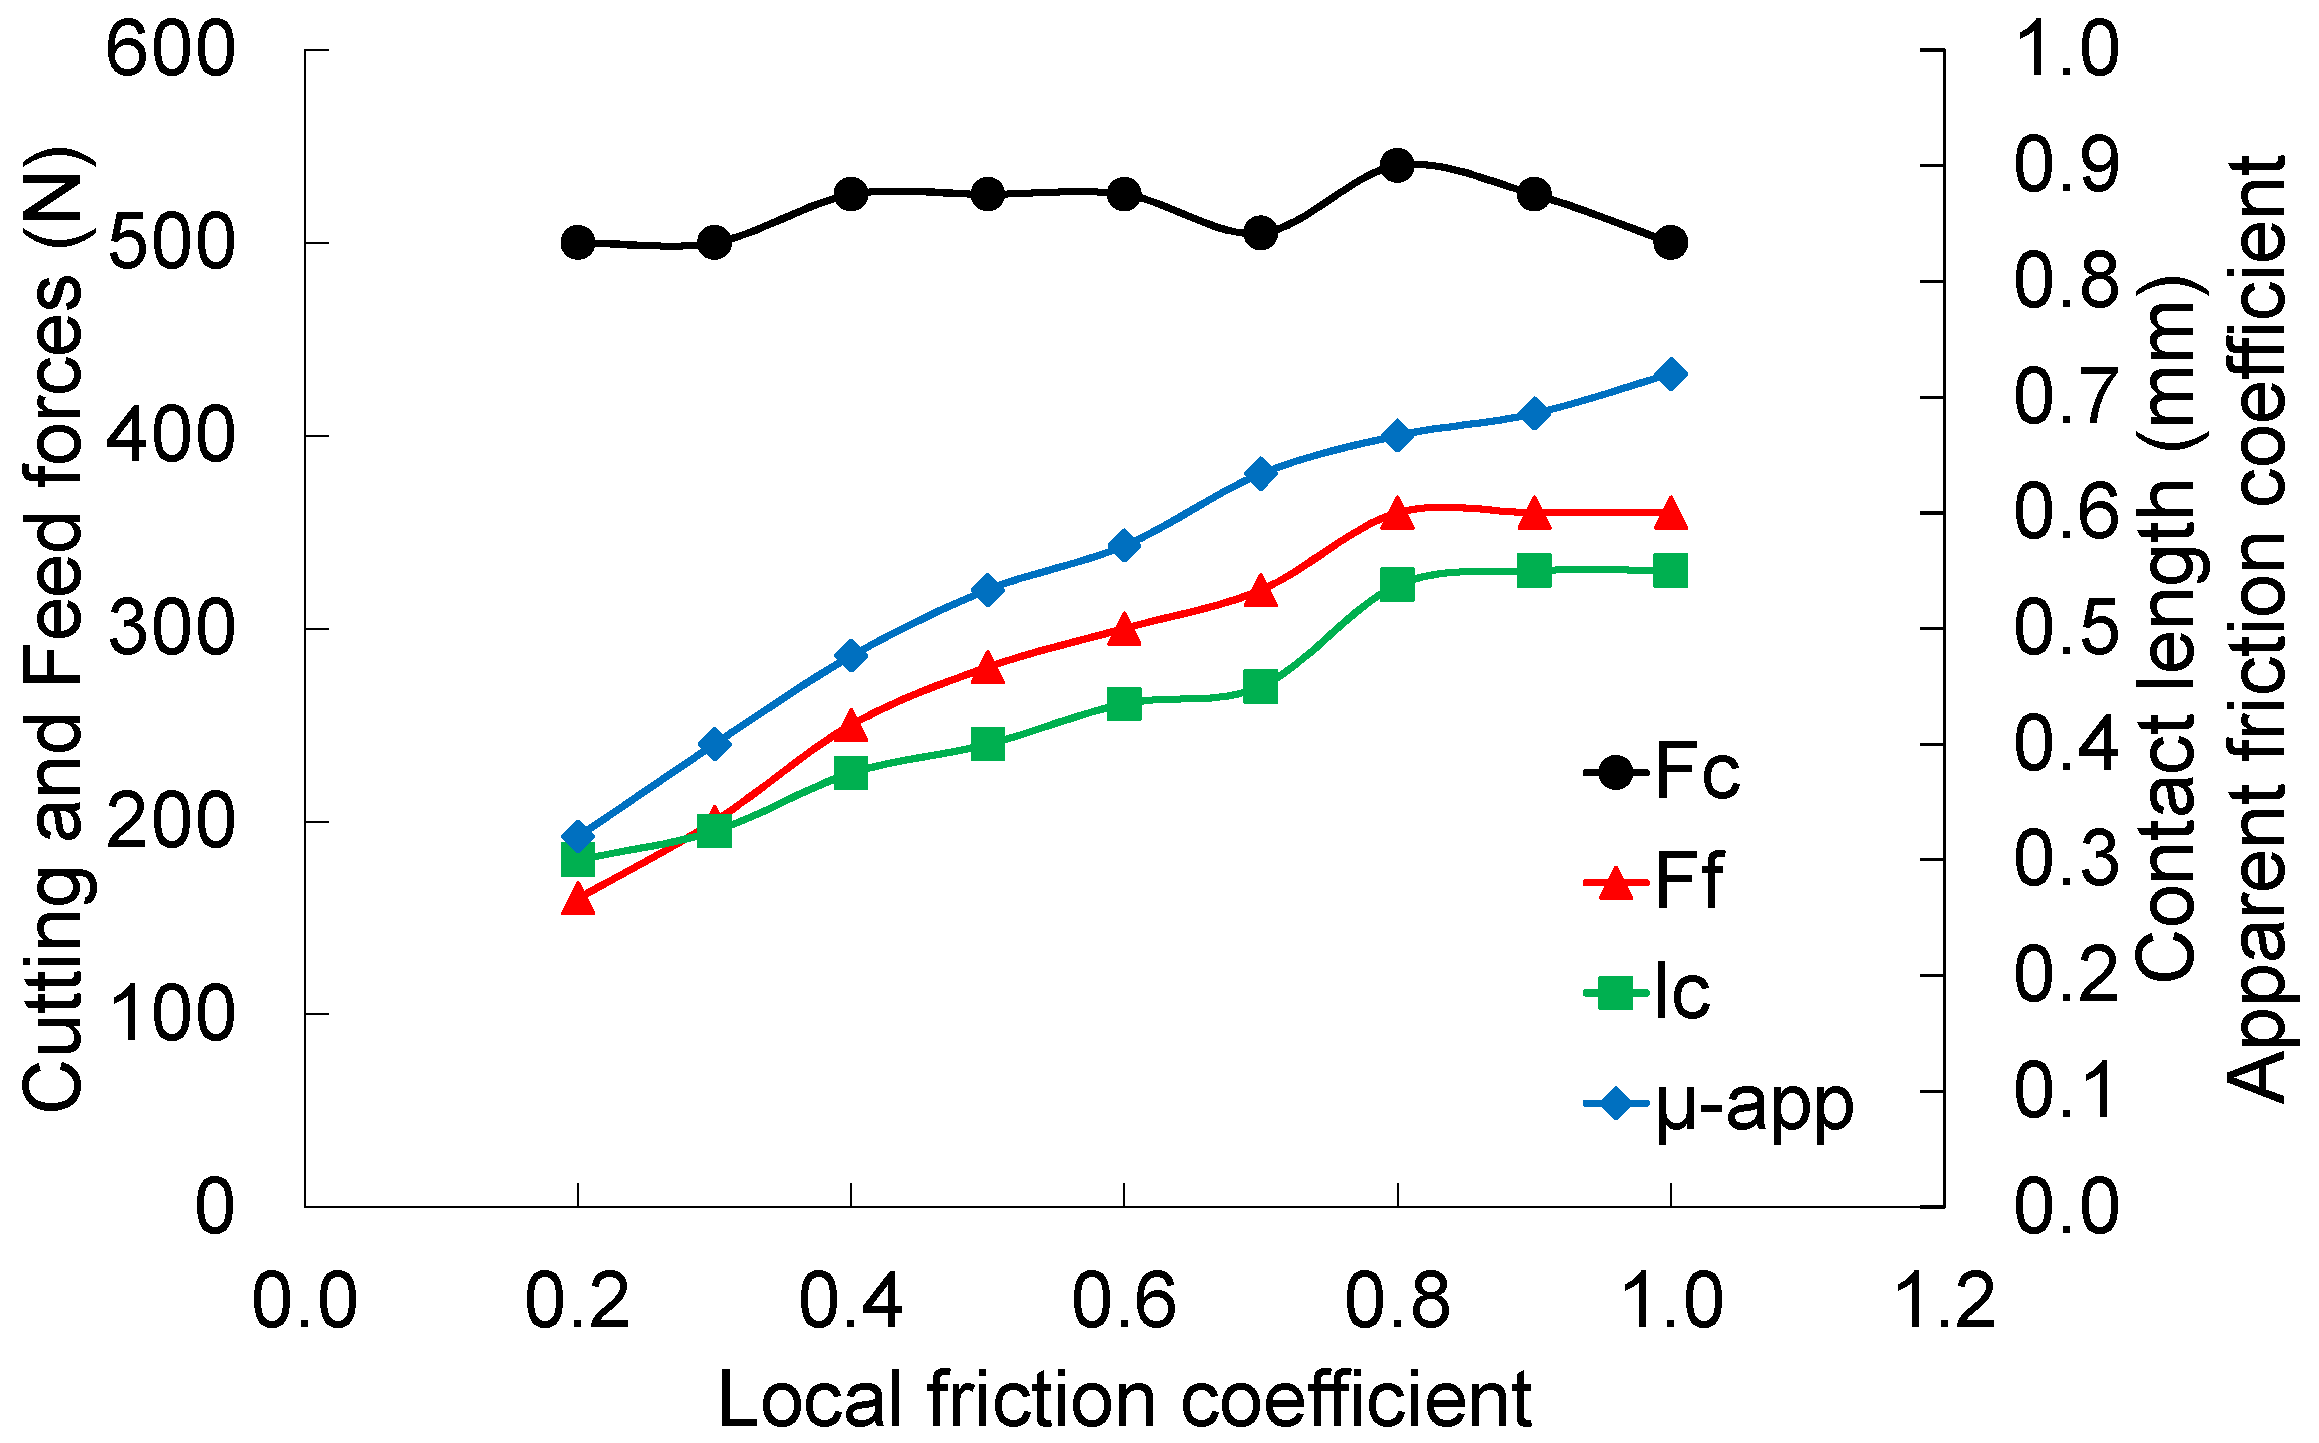
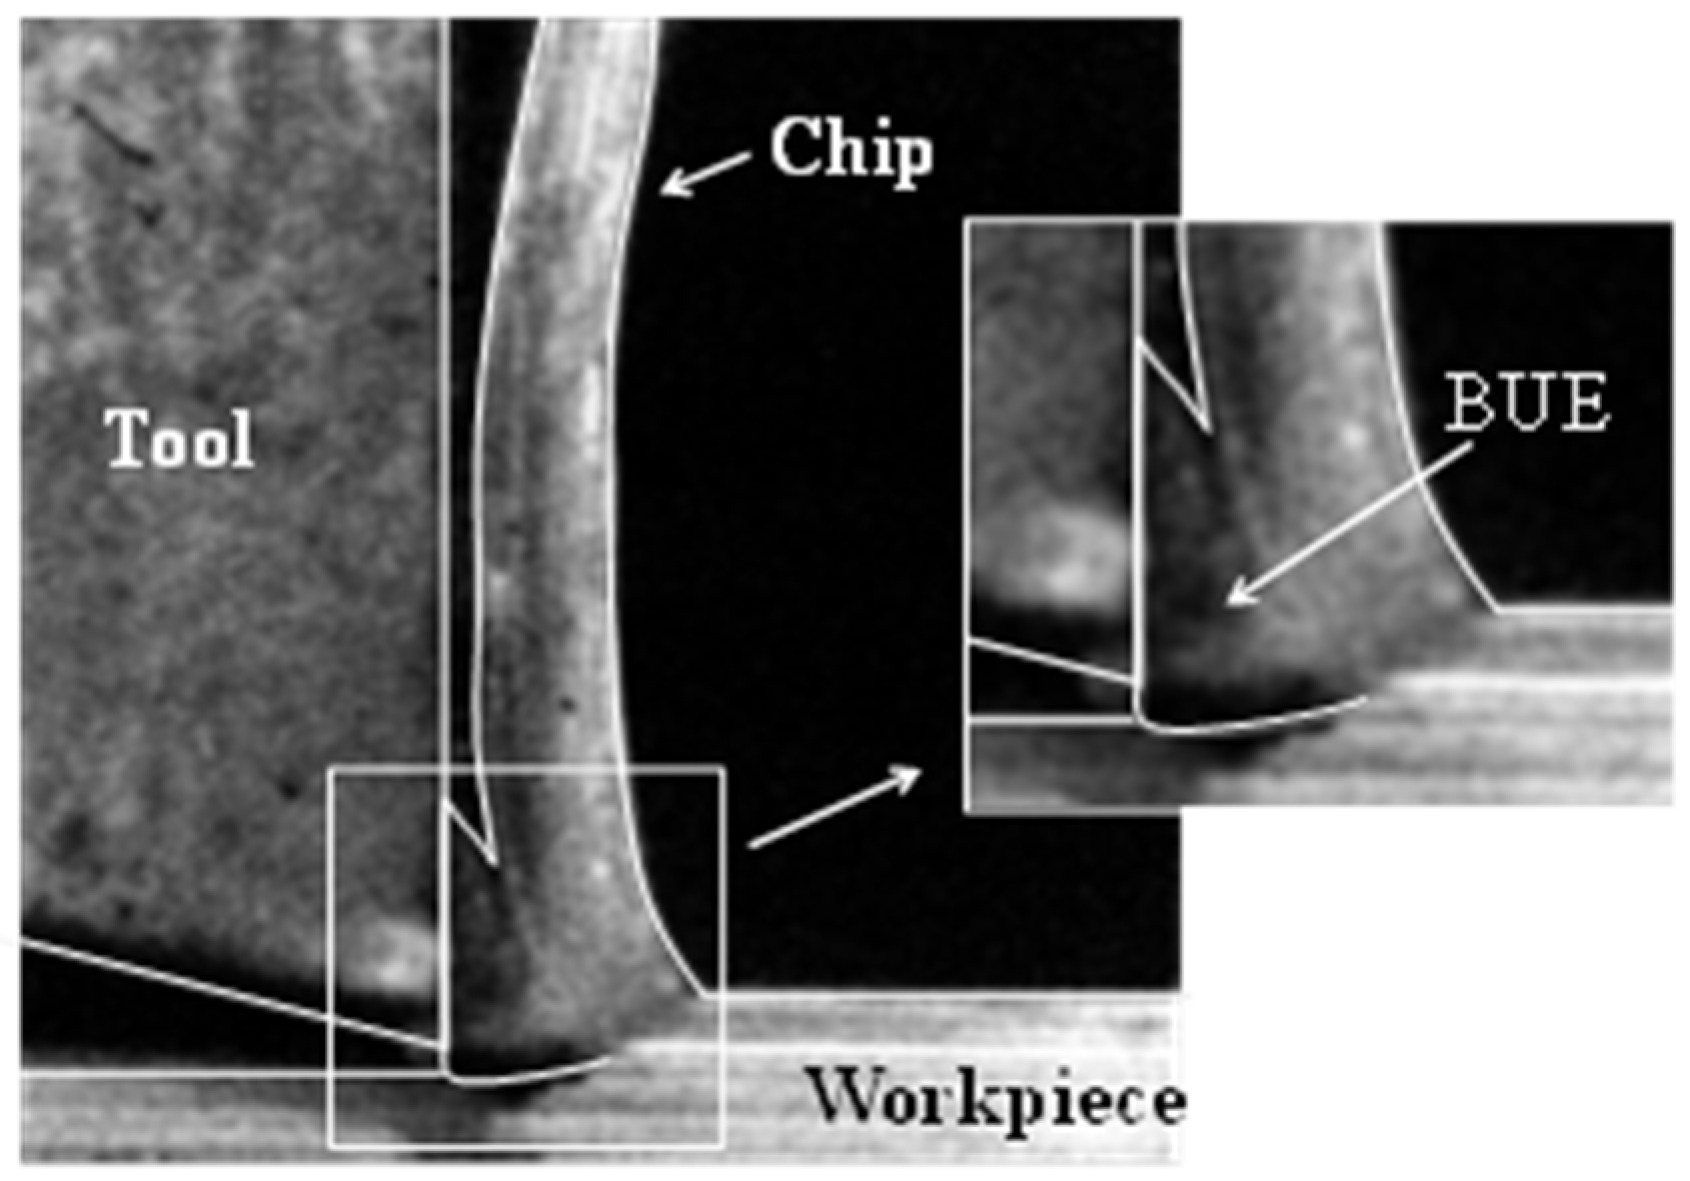
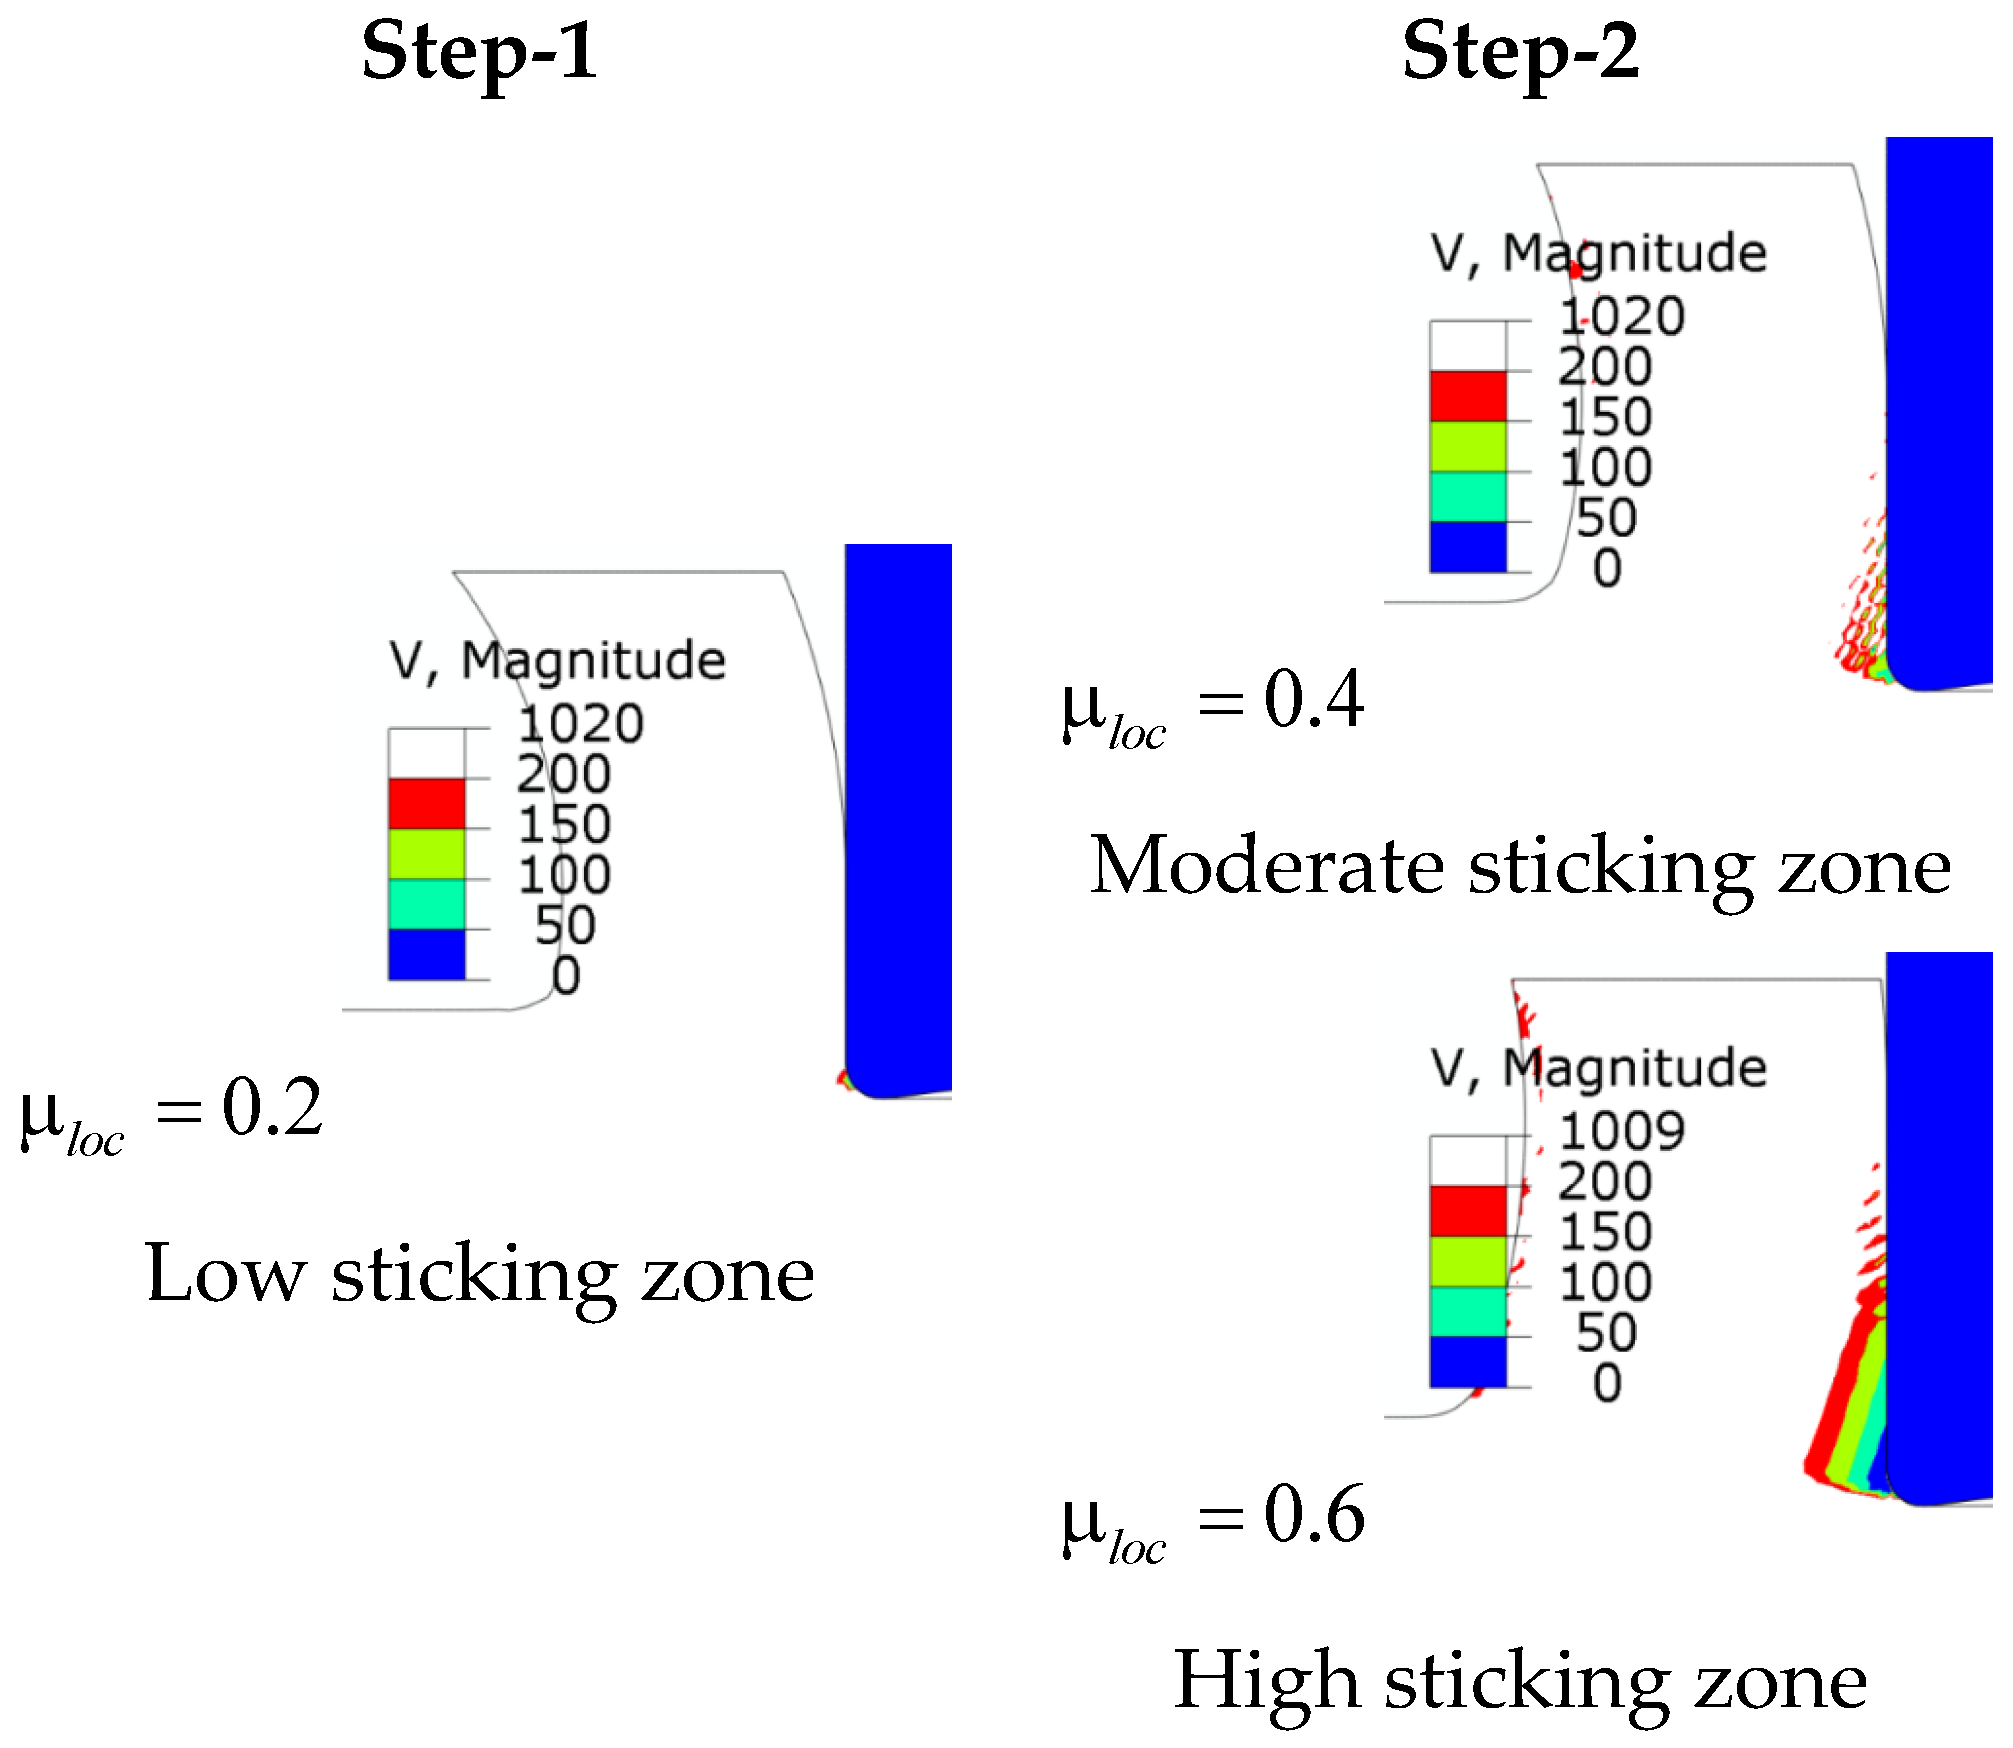
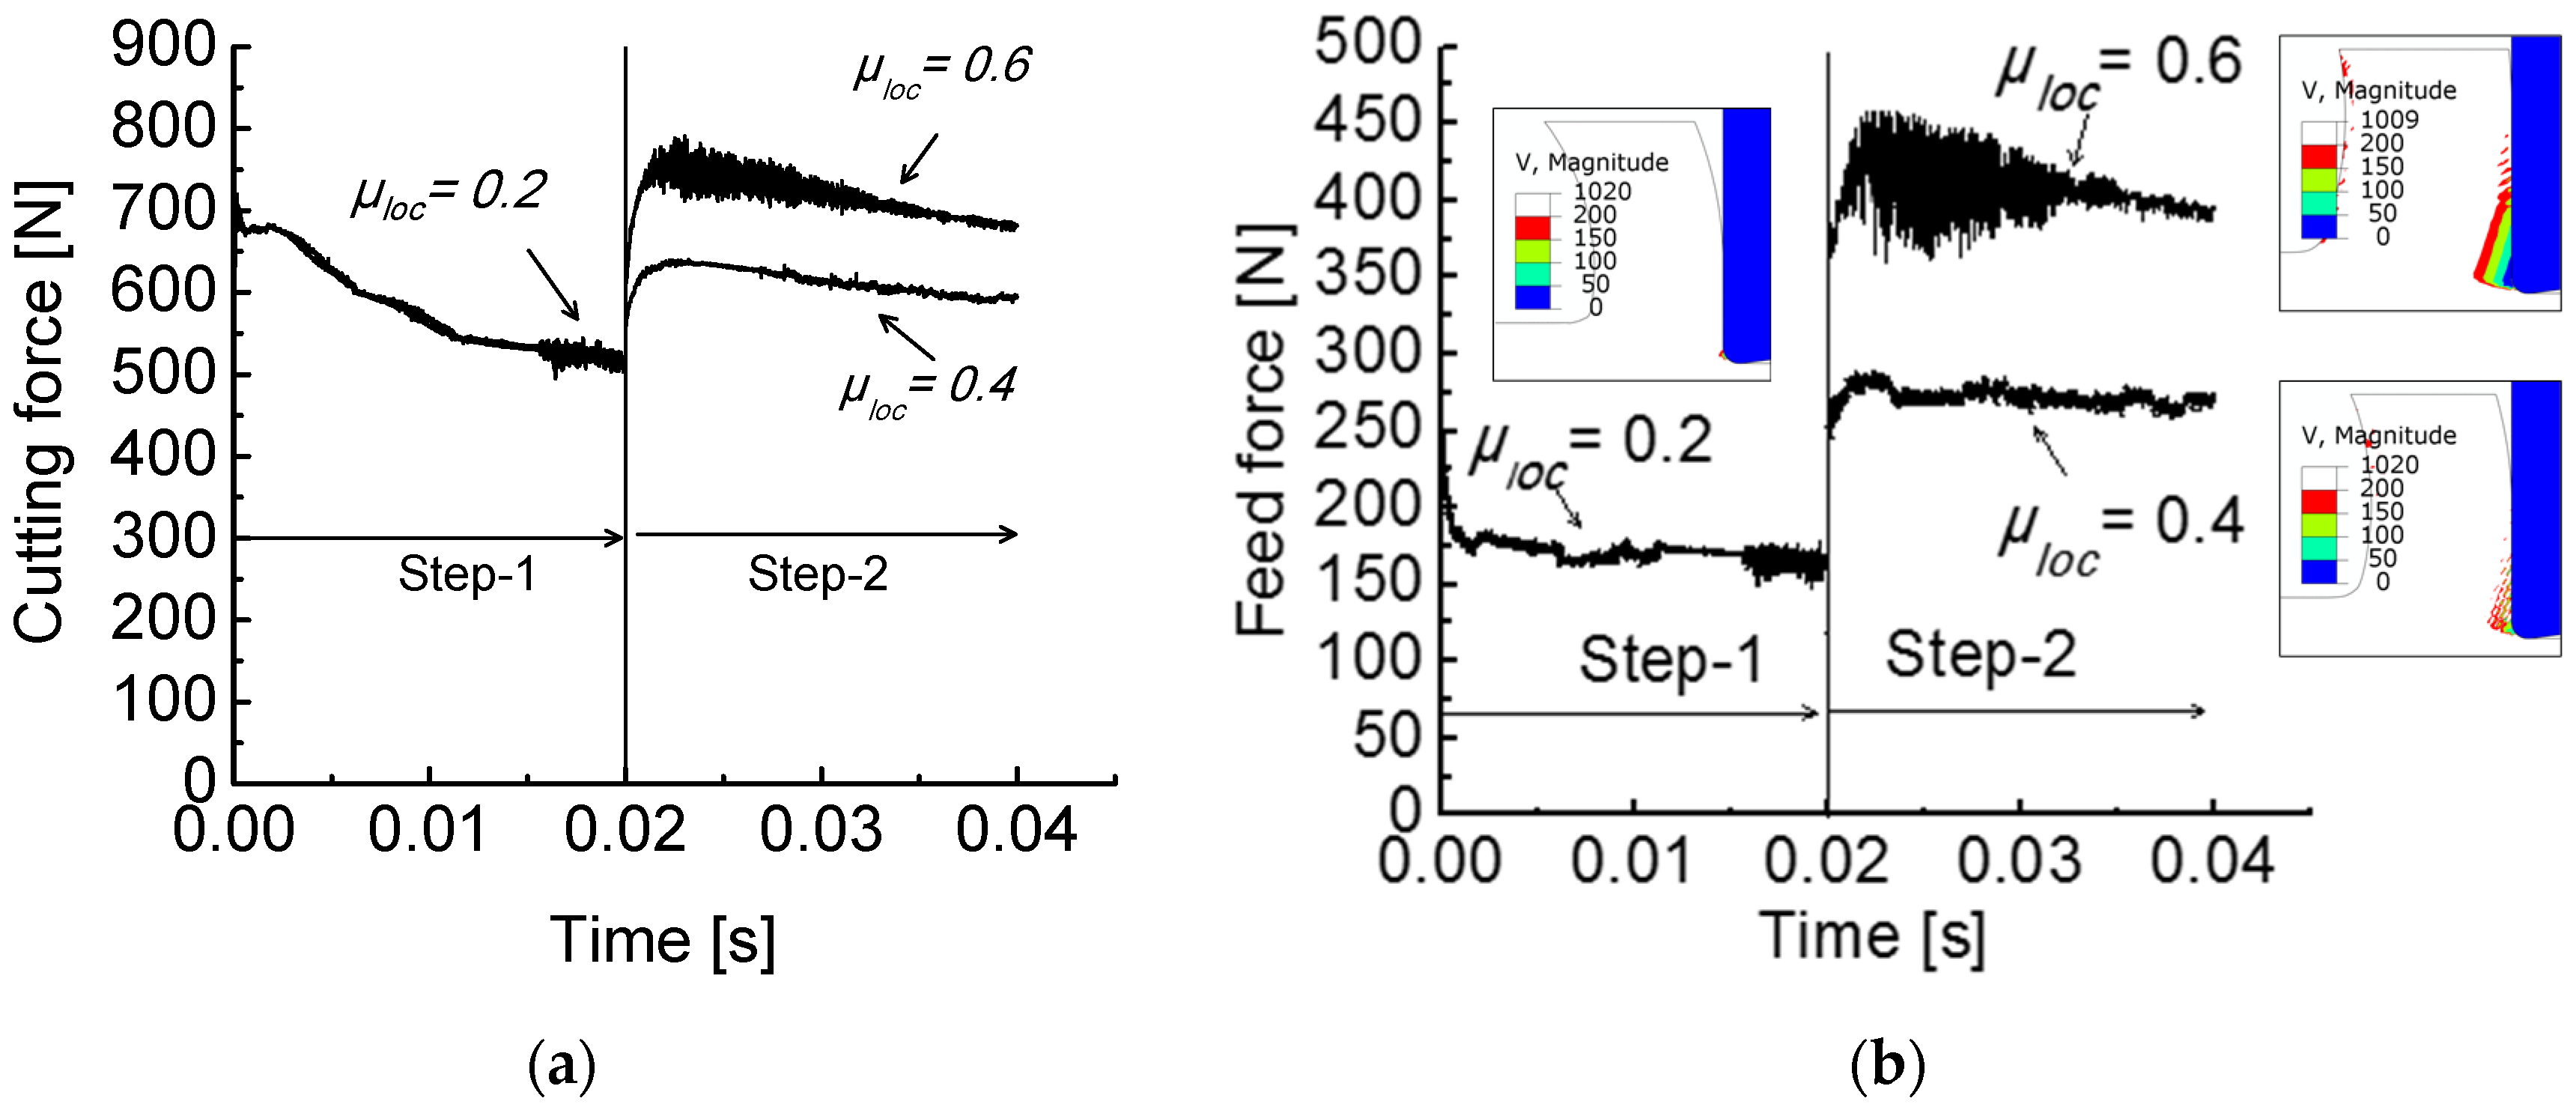
3.3. Built-Up Edge Formation-Time-Dependent Friction

The BUE phenomenon can be considered as the consequence of a gradual increase of the friction at the tool-chip interface up to reach a critical level leading to a complete or partial sticking contact at the tool-chip interface. The proposed idea to analyze the process of BUE formation consists to vary the local coefficient of friction (COF), defined as the ratio of frictional stress by contact pressure (see Equation (6)), during the chip flow on the rake face. This is physically an admitted assumption, since the BUE corresponds to the adhesion of the work material at the rake face close to the tool tip. Between the time where the cutting process is stable and the time where the BUE is formed, the friction evolves from a certain value to a higher one that induces the adhesion of the work material on the rake face.
Different possibilities can be proposed for the evolution of the friction at the contact interface. Here two cases were considered, corresponding, respectively, to an abrupt change and a gradual evolution of COF. The effect of friction change on BUE formation was investigated by examining particular cutting forces and the work material flow velocity on rake face. The ALE-FE model was adopted to simulate the cutting process with varying COF. The simulated cutting case is the reported one in Figure 4, where the BUE was observed by the CCD camera.
One possible mechanism of BUE formation is an abrupt change of the friction at the tool–chip interface. Two successive steps are then defined. In the first one (step 1), the cutting process was simulated with COF equal 0.2. In the followed step (step 2), the simulation is continued with COF equal 0.4 or 0.6. The impact of this abrupt change of COF on BUE formation is highlighted in Figure 12, through the work material flow velocity at the secondary shear zone. It can be deduced from Figure 12 that the work material flow velocity is affected by the increase of COF. The change in work material flow is more pronounced for a higher COF in the second step (i.e., COF = 0.6). The sticking zone becomes large as the friction is higher. For the low friction, (COF = 0.2 in step 1) a negligible sticking zone can be noticed and, consequently, no BUE can form. Therefore, it can be deduced that a change in the nature of the tool-work material contact have a direct effect on the BUE formation.
In addition, the abrupt change of the COF also has a significant effect on cutting and feed forces, as shown in Figure 13. So increasing COF increases cutting and feed forces. The chip flows with more difficultly at the rake face, resulting in the increase and fluctuation of cutting forces. Note that feed force is more affected by the friction change (see from Figure 13b), since it is in the direction of the friction stress on the rake face (rake angle = 0°).
The second possible mechanism of BUE formation corresponds to a gradual evolution of the friction at the tool-work material interface during chip formation. This is represented by the increase of COF gradually (increment of 0.1 is taken) from 0.2 to 1. This assumes that BUE is formed when the friction increases gradually to a higher level that leads to a complete adhesion of the work material at the rake face (sticking contact). According to Figure 14, the process of BUE formation can be viewed from the evolution of work material flow velocity with COF. The gradual increase of the friction increases the amount of the sticking zone. This later represents the work material having low flow velocity at the tool-chip interface. So the variation of the sticking zone with the friction can be correlated with the BUE formation.
The gradual increase of the friction also affects cutting forces, as shown in Figure 15, with more effect on feed force. The apparent friction coefficient follows the same trend as feed force. Globally, the ratio of the sticking by the sliding contact increases as the friction increases. For high friction, the sliding of the work material layer at the tool-chip interface is practically controlled by the shear flow stress of the work material (i.e., τ f = τ ¯ in Equation (6)). According to Figure 15, the average contact length follows the same trend as the apparent friction coefficient. It increases until reaching a quasi-saturated level. So the BUE formation can be related mainly to the dominant sticking contact at the tool-chip interface.

4. Conclusions

Machining aeronautical aluminum alloy AA2024-T351 in dry conditions was investigated. Cutting forces, chip segmentation, and built-up edge formation were analyzed. The main concluding remarks are as follows:
(1)
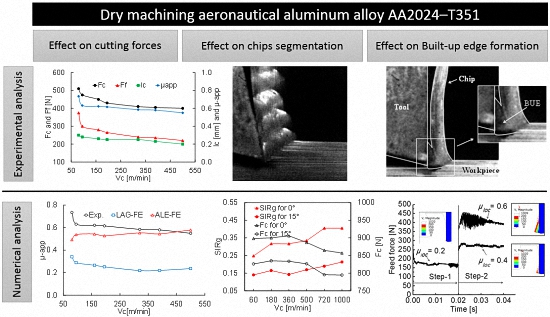
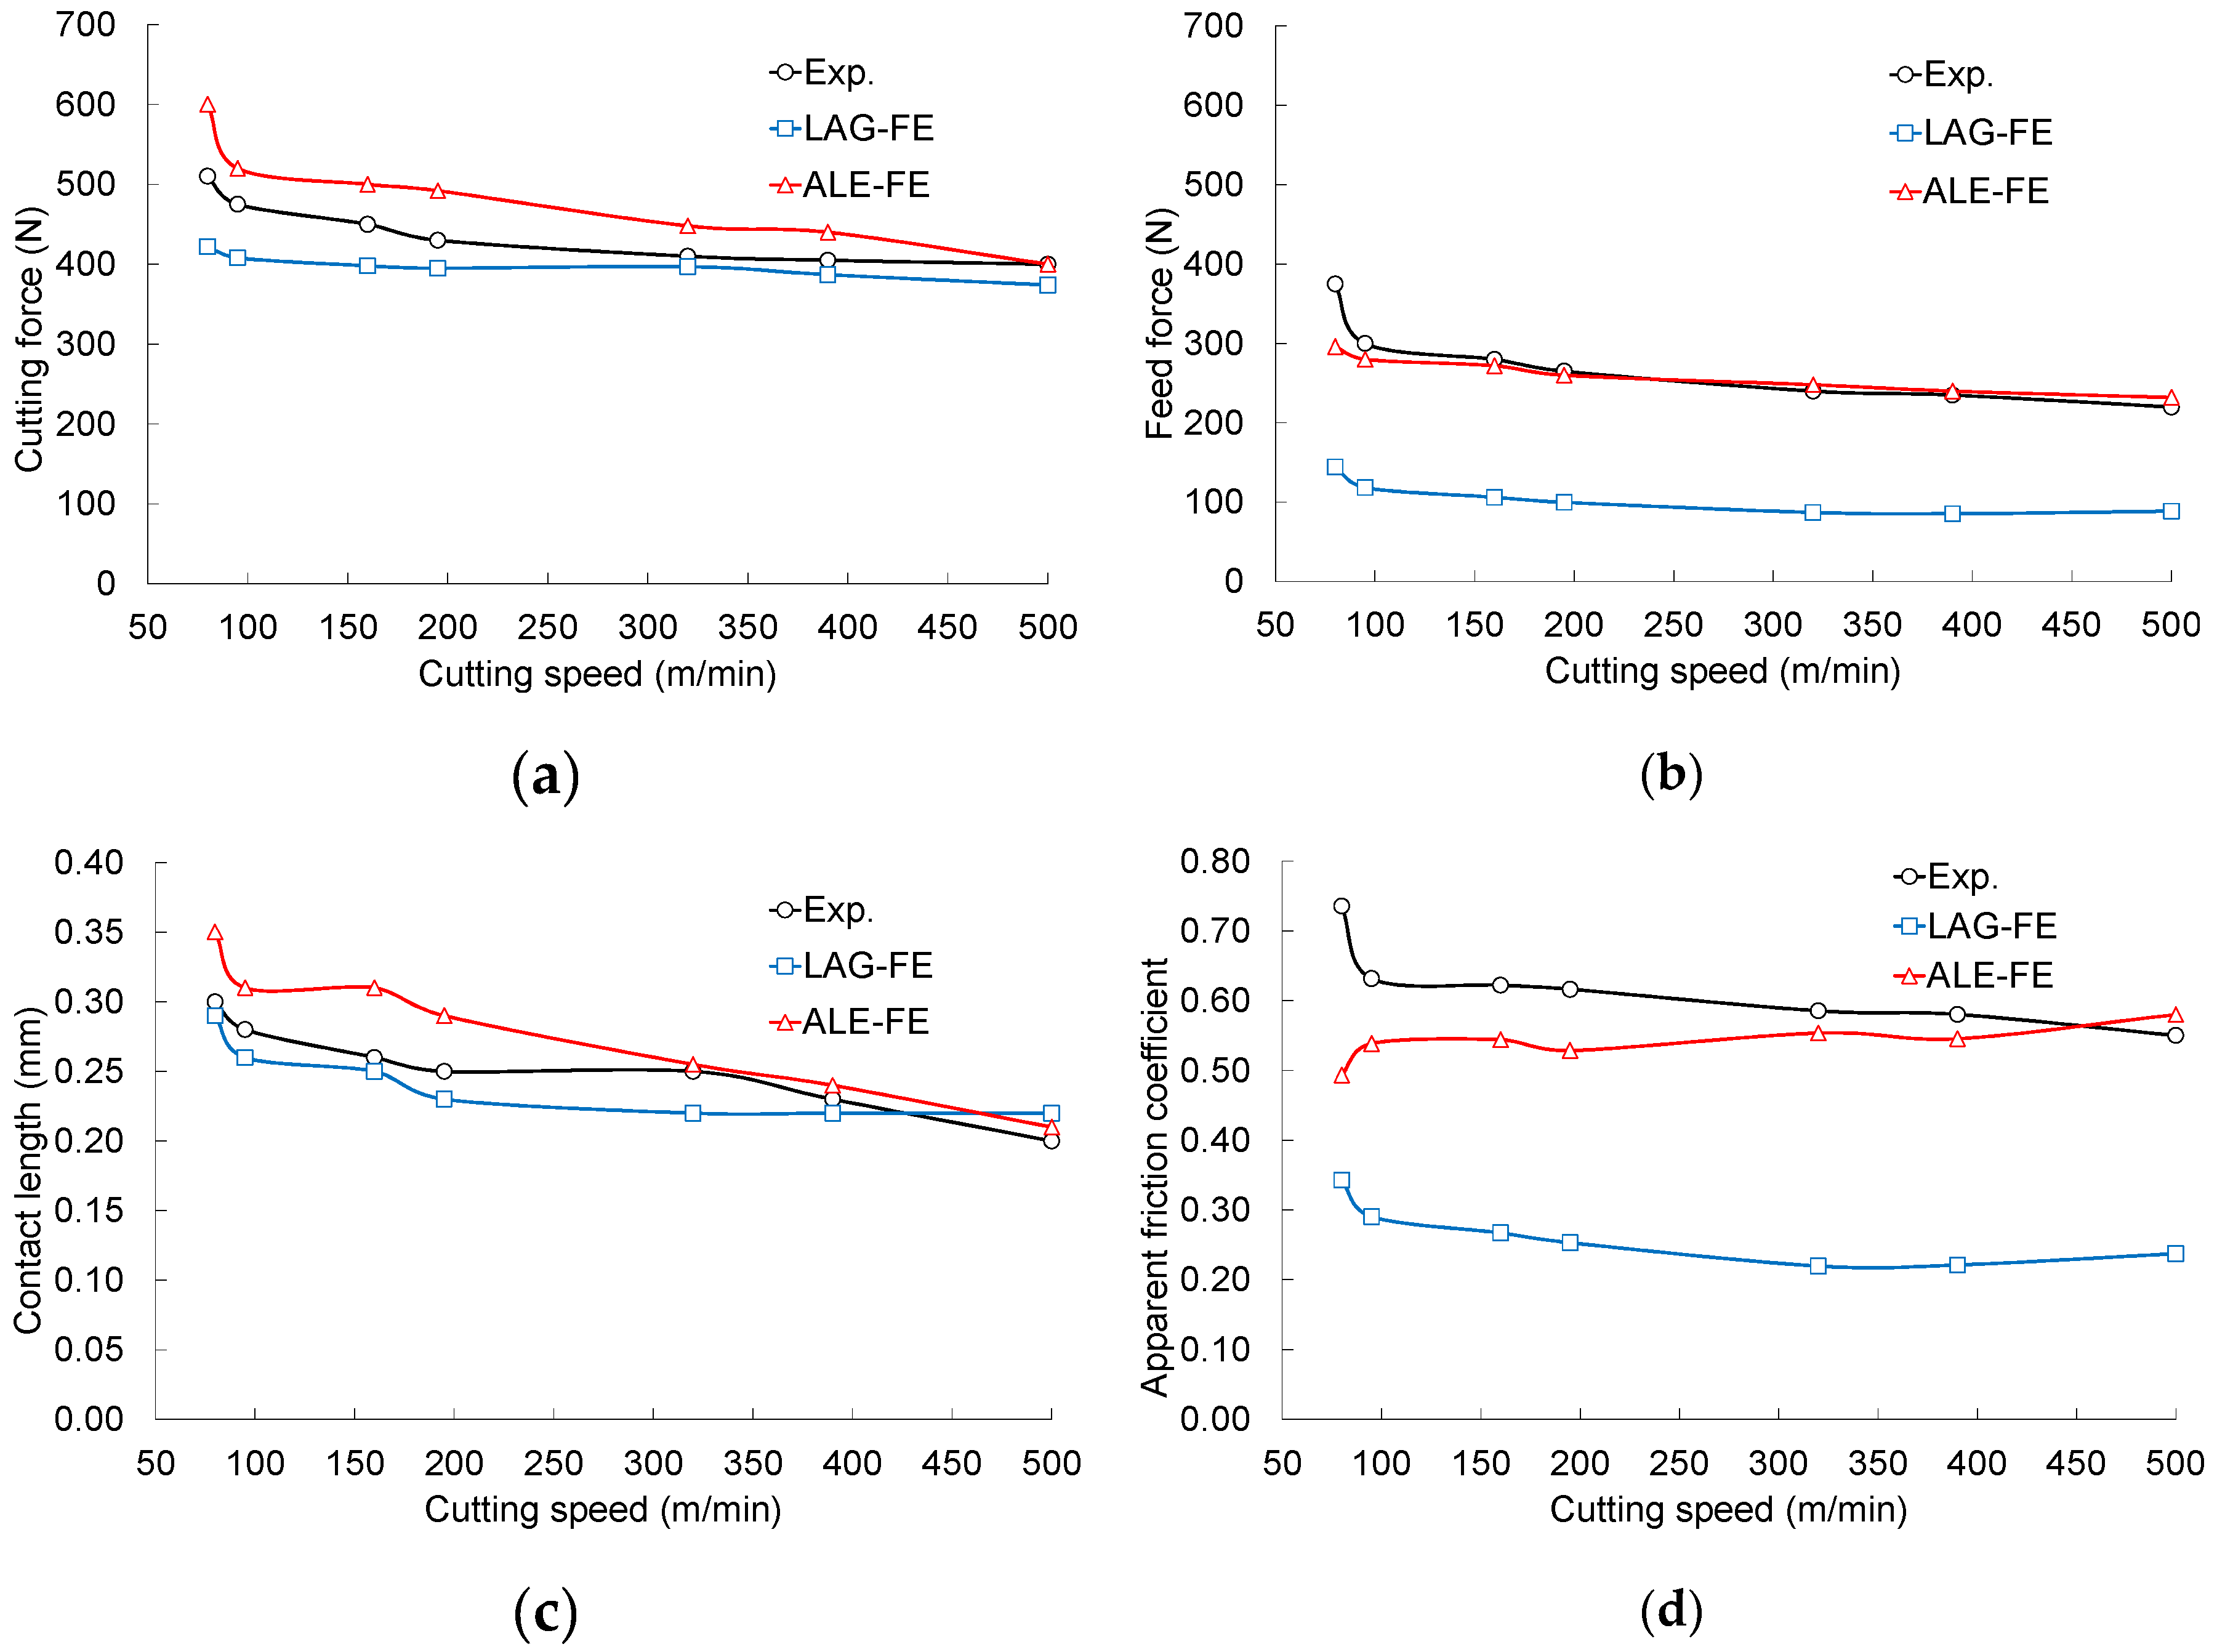
Measured cutting forces evolve highly at low cutting speeds for fixed feed and tend to stabilize rapidly at about 100 m/min. LAG-FE and ALE-FE models predict well cutting force, but LAG-FE model fails to predict feed force.
(2)
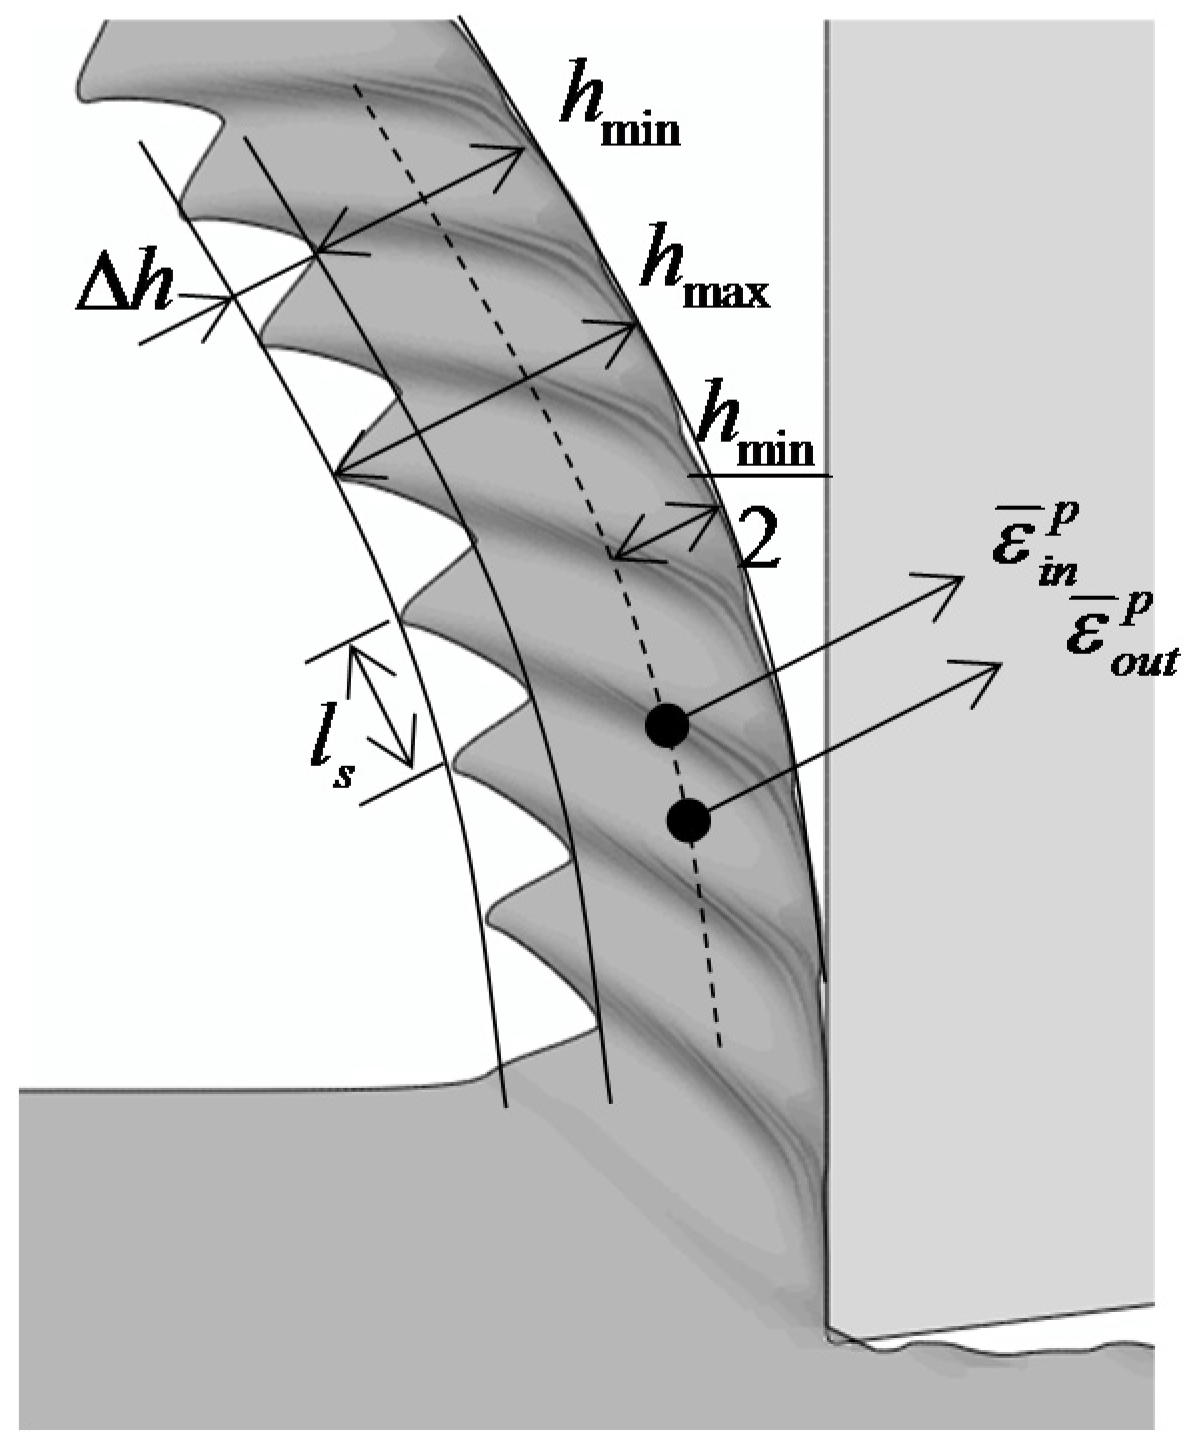
Chip segmentation depends highly on the tool rake angle and the uncut chip thickness.
(3)
Using LAG-FE model, it is shown that there is a close link between cutting forces evolution and chip segmentation intensity. So, chip segmentation phenomenon reduces the average cutting forces, but its fluctuation increases.
(4)
The BUE can be explained by the contact/friction change at the tool–work material interface during cutting. The ductility of aluminum alloy AA2024-T351 also promotes BUE formation.
(5)
The BUE can be modeled by making the friction coefficient time-dependent. This is done in the ALE-FE model. So, the sticking zone becomes larger with the increase of friction coefficient. This condition promotes the BUE formation, but there is no unique scenario of friction evolution as BUE occurs.

Author Contributions

M.N. performed the experiments; B.H., S.A., and A.M. analyzed the data; B.H. wrote the paper.

Conflicts of Interest

The authors declare no conflict of interest.

Abbreviations

The following abbreviations are used in this manuscript:
V c cutting speed (m/min)
f feed (mm)
α , γ tool-rake and clearance angles (°)
F c , F f cutting and feed forces (N)
l c contact length (mm)
h min contact length (mm)
h max maximum chip thickness
l s chip segmentation length
f s chip segmentation frequency
S I R g global segmentation intensity ratio
S I R l local segmentation intensity ratio
σ Cauchy stress tensor (MPa)
σ ˜ effective stress tensor (not affected by damage)
ρ material density (kg/m3)
E , ν Young modulus (GPa) and Poisson’s ratio
A , B , C , m , n Johnson-Cook flow stress parameters
ε ¯ p von Mises equivalent plastic strain
ε ¯ ˙ p von Mises equivalent plastic strain-rate
ε ¯ ˙ 0 Reference equivalent plastic strain-rate
σ ¯ von Mises equivalent stress (MPa)
ω d damage initiation criterion
d damage variable
G f fracture strain energy
σ n contact pressure (MPa)
τ f friction stress (MPa)
COF local friction coefficient
µ-appapparent friction coefficient
τ max shear stress limit (MPa)
V s sliding velocity at the tool-workpiece interface (m/s)
T temperature (°C)
T 0 reference ambient temperature (°C)
T m melting temperature (°C)
T i n t t tool temperature at the tool-workpiece interface (°C)
T i n t w workpiece temperature of at the tool-workpiece interface (°C)
λ thermal conductivity (W/m/°C)
c p specific heat capacity (J/kg/°C)
α thermal expansion (µm/m/°C)
η p plastic work conversion factor (Taylor-Quinney factor)
η f frictional work conversion factor
f f heat partition coefficient
h heat transfer coefficient (kW/m2/°C)
q ˙ p volumetric heat generation due to plastic work (W/m3)
q ˙ c heat conduction flux at the tool-workpiece interface (W/m2)
q ˙ t o o l heat flux going into the tool at the tool-workpiece interface (W/m2)
q ˙ w o r k p i e c e heat flux going into the workpiece at the tool-workpiece interface (W/m2)
Exp.experiment
Num.Numerical
Err.error (%)
Max.Maximum

References

  1. Pauze, N. Fatigue Corrosion dans le Sens Travers Court de Tôles d’aluminium 2024-T351 Présentant des Défauts de Corrosion Localisée. Ph.D. Thesis, Ecole Nationale Supérieure des Mines de Saint-Etienne, Saint-Etienne, France, 2008. [Google Scholar]
  2. Komanduri, R.; Brown, R.H. On the mechanics of chip segmentation in machining. J. Eng. Ind. 1981, 103, 33–51. [Google Scholar] [CrossRef]
  3. Bayoumi, A.E.; Xie, J.Q. Some metallurgical aspects of chip formation in cutting Ti-6 wt. % Al-4 wt. % V alloy. Mater. Sci. Eng. A 1995, 190, 173–180. [Google Scholar] [CrossRef]
  4. Barry, J.; Byrne, G. The mechanisms of chip formation in machining hardened steels. J. Manuf. Sci. Eng. 2002, 124, 528–535. [Google Scholar] [CrossRef]
  5. Komanduri, R.; von Turkovich, B.F. New observations on the mechanism of chip formation when machining titanium alloys. Wear 1981, 69, 179–188. [Google Scholar] [CrossRef]
  6. Atlati, S.; Haddag, B.; Nouari, M.; Zenasni, M. Analysis of a new segmentation intensity ratio “SIR” to characterize the chip segmentation process in machining ductile metals. Int. J. Mach. Tools Manuf. 2011, 51, 687–700. [Google Scholar] [CrossRef]
  7. Kouadri, S.; Necib, K.; Atlati, S.; Haddag, B.; Nouari, M. Quantification of the chip segmentation in metal machining: Application to machining the aeronautical aluminium alloy AA2024-T351 with cemented carbide tools WC-Co. Int. J. Mach. Tools Manuf. 2013, 64, 102–113. [Google Scholar] [CrossRef]
  8. Ernst, H.; Martellotti, M. The formation of the built-up edge. ASME Mech. Eng. 1938, 57, 487–498. [Google Scholar]
  9. Shaw, M.C.; Usui, E.; Smith, P.A. Free Machining Steel: III—Cutting Forces; Surface Finish and Chip Formation. J. Eng. Ind. 1961, 83, 181–192. [Google Scholar] [CrossRef]
  10. Philip, P.K. Built-up edge phenomenon in machining steel with carbide. Int. J. Mach. Tool Des. Res. 1971, 11, 121–132. [Google Scholar] [CrossRef]
  11. List, G.; Nouari, M.; Géhin, D.; Gomez, S.; Manaud, J.-P.; LePetitcorps, Y.; Girot, F. Wear behaviour of cemented carbide tools in dry machining of aluminium alloy. Wear 2005, 259, 1177–1189. [Google Scholar] [CrossRef]
  12. List, G. Etude des Mécanismes D’endommagement des Outils Carbure WC-Co par la Caractérisation de l’interface Outil Copeau: Application à l’usinage à sec de l’alliage d’aluminium Aéronautique AA2024-T351. Ph.D. Thesis, Ecole Nationale Supérieure des Arts et Métiers of Bordeaux, Saint-Etienne, France, 2004. [Google Scholar]
  13. Abaqus/Explicit®. Dassault Systemes 2015. Available online: http://www.3ds.com/products-services/simulia/products/abaqus/abaqusexplicit (accessed on 17 August 2016).
Figure 1. Experimental setup of orthogonal cutting tests: (a) planar machining; (b) turning; and (c) cutting tools with two rake angles (0° and 15°) [11].
Metals 06 00197 g001
Figure 2. Micrographs of a polished surfaces of (a) aluminum alloy AA2024-T351 [6] and (b) cemented carbide tool WC-Co [11].
Metals 06 00197 g002
Figure 3. Example of experimental chips morphology obtained with cutting speed = 60 m/min.
Metals 06 00197 g003
Figure 4. BUE (built-up edge) formation for cutting speed = 60 m/min, feed = 0.1 mm and rake angle = 0°.
Metals 06 00197 g004
Figure 5. Experimental cutting force (Fc), feed force (Ff), contact length (lc), and apparent friction coefficient (µapp).
Metals 06 00197 g005
Figure 6. Illustration of (a) 2D LAG-FE (lagrangian finite element) and (b) ALE-FE (arbitrary lagrangian-eulerian finite element) models of the orthogonal cutting.
Metals 06 00197 g006
Figure 7. Experimental vs. numerical modelling (ALE-FE and LAG-FE) of (a) cutting force; (b) feed force; (c) contact length, and (d) apparent friction coefficient.
Metals 06 00197 g007
Figure 8. Experimental vs. numerical chips morphology for two feeds and two rake angles.
Metals 06 00197 g008
Figure 9. Geometric parameters for the assessment of chip morphology parameters.
Metals 06 00197 g009
Figure 10. Segmentation length vs. segmentation frequency as function of cutting speed, for fixed feed (0.3 mm) and two rake angles (0° and 15°).
Metals 06 00197 g010
Figure 11. Correlation between average cutting force and segmentation intensity ratio: (a) S I R l and (b) S I R g .
Metals 06 00197 g011
Figure 12. Effect of COF (coefficient of friction) on the material flow velocity at the tool-chip interface.
Metals 06 00197 g012
Figure 13. Effect of an abrupt change of COF on (a) the cutting force and (b) the feed force.
Metals 06 00197 g013
Figure 14. Effect of a gradual evolution of COF on the work material flow velocity at the tool-chip interface (increase of the sticking zone).
Metals 06 00197 g014
Figure 15. Evolution of average cutting and feed forces, apparent friction coefficient, and average contact length with COF.
Metals 06 00197 g015
Table 1. Chemical composition (wt. %) of the AA2024-T351 [11].
AlCrCuFeMgMnSiTiZn
BalancedMax. 0.13.8–4.9Max. 0.51.2–1.80.3–0.9Max. 0.5Max. 0.15Max. 0.25
Table 2. Average cutting force, feed force and contact length for different cutting speeds [12].
Cutting Speed (m/min)Cutting Force (N)Feed Force (N)Contact Length (mm)
805103750.30
954753000.28
1604502800.26
1954302650.25
3204102400.25
3904052350.23
5004002200.20
Table 3. Mechanical and thermal properties of work material and tool [6].
Physical ParameterWorkmaterial (AA2024-T351)Tool (WC-Co)
Density, ρ (kg/m3)270011,900
Elastic modulus, E (GPa)73534
Poisson’s ratio, ν0.330.22
Specific heat, C p (J/kg/°C) C p = 0.557 T + 877.6 400
Thermal conductivity, λ (W/m/C) 25 T 300 : λ = 0.247 T + 114.4 300 T T m : λ = 0.125 T + 226 50
Thermal expansion, α (µm·m/°C)   α = 8.9 × 10 3 T + 22.2 -
Tm (°C)520-
T0 (°C)2525
Table 4. Johnson-Cook viscoplastic-damage parameters of AA2024-T351 [6].
Viscoplastic Parameters
A (Mpa) B (Mpa) n C m
3524400.420.00831
Damage Parameters
d 1 d 2 d 3 d 4 d 5 K C I (MPa·m1/2) K C I I (MPa·m1/2)
0.130.131.50.01103726
Table 5. Comparison between experimental data and LAG-FE results.
Vc (m/min)Fc (N)Ff (N)Lc (mm)µapp
-Exp.Num.Err. (%)Exp.Num.Err. (%)Exp.Num.Err. (%)Exp.Num.Err. (%)
8051042217375145610.300.2930.740.3453
9547540814300118610.280.2670.630.2954
16045039812280106620.260.2540.620.2757
1954303958265100620.250.2380.620.2559
320410397324087640.250.22120.590.2262
390405387423586640.230.2240.580.2262
500400374722089600.200.22100.550.2457
Table 6. Comparison between experimental data and ALE-FE results.
Vc (m/min)Fc (N)Ff (N)Lc (mm)µapp
-Exp.Num.Err. (%)Exp.Num.Err. (%)Exp.Num.Err. (%)Exp.Num.Err. (%)
8051060018375296210.300.35170.740.4933
95475520930028070.280.31110.630.5415
1604505001128027230.260.31190.620.5413
1954304921426526020.250.29160.620.5314
320410448924024830.250.2620.590.555
390405440923524020.230.2440.580.556
500400400022023250.200.2150.550.585

