Article

The Influence of Processing Conditions on Microchemistry and the Softening Behavior of Cold Rolled Al-Mn-Fe-Si Alloys

1
Gränges Technology AB, 612 33 Finspång, Sweden
2
Department of Materials Science and Engineering, NTNU, Trondheim NO-7491, Norway
3
Thermomechanical Metallurgy Laboratory—PX Group Chair, Ecole Polytechnique Fédérale de Lausanne (EPFL), CH-2002 Neuchâtel, Switzerland
*
Author to whom correspondence should be addressed.
Metals 2016, 6(3), 61; https://doi.org/10.3390/met6030061
Submission received: 7 November 2015 / Revised: 1 March 2016 / Accepted: 8 March 2016 / Published: 11 March 2016

Abstract

:
Using different homogenization treatments, different initial microchemistry conditions in terms of solid solution levels of Mn, and number densities and sizes of constituents and dispersoids were achieved in an Al-Mn-Fe-Si model alloy. For each homogenized condition, the microchemistry and microstructure, which further change both during deformation and subsequent annealing, were quantitatively characterized. The influence of the different microchemistries, with special focus on different particle structures (constituents and dispersoids), on the softening behavior during annealing after cold rolling and the final grain structure has been systematically studied. Time-Temperature-Transformation diagrams with respect to precipitation and recrystallization as a basis for analysis of the degree of concurrent precipitation during back-annealing have been established. Densely distributed fine pre-existing dispersoids and/or conditions of significant concurrent precipitation strongly slows down recrystallization kinetics and lead to a grain structure of coarse and strongly elongated grains. At the lowest annealing temperatures, recrystallization may even be completely suppressed. In conditions of low number density and coarse pre-existing dispersoids, and limited additional concurrent precipitation, recrystallization generally results in an even, fine and equi-axed grain structure. Rough calculations of recrystallized grain size, assuming particle stimulated nucleation as the main nucleation mechanism, compare well with experimentally measured grain sizes.

Graphical Abstract

1. Introduction

AA3xxx alloys that contain Mn as a main alloying element have a wide range of applications, e.g., in the building sector, in packaging industry and in equipment for heating and cooling. AA3xxx alloy sheets are typically processed via hot-rolling followed by cold rolling and back-annealing where the final annealing step gives the grain structure and texture of the sheet material before further possible forming operations (e.g., deep drawing). The microstructure and properties in this condition are a result of the whole thermo-mechanical history of the material and the corresponding closely coupled evolution in microchemistry (solid solution level of alloying elements, volume fraction and size of constituents and dispersoids), grain structure, and texture. After casting, the supersaturated Mn in solid solution will precipitate from the matrix in subsequent heat treatment processes to form different types of second-phase particles (dispersoids), which may have a significant influence on the deformation behavior and subsequent softening behavior after annealing [1,2,3,4].
Numerous investigations have been carried out related to the influence of second-phase particles, including both large constituent particles [5,6] and fine dispersoids [7,8,9,10,11,12,13,14], on the recrystallization behavior and texture in particular (e.g., [7,11,13,14]) of aluminum alloys. It is well known that large particles (larger than about 1 μm) promote recrystallization due to the activation of particle-stimulated nucleation (PSN), and that fine densely distributed dispersoids retard and may even inhibit recrystallization due to the effect of Zener pinning both of low- and high-angle grain boundary motion [5,13,15]. However, these complex interactions and their influence on the microstructure and texture evolution are still not fully understood and, in particular, adequate quantitative descriptions are still largely missing. This is a general challenge with respect to process optimization and alloy design for “tailor-made” properties of these alloys, and even more so with the introduction of more recycled aluminum where alloying elements like Mn, Fe and Si will accumulate in secondary alloys. More generally the role of dispersoids is of vital importance in the framework of recrystallization induced by severe plastic deformations and the stability of the refined micro- and nanostructure obtained by cold working, with the aim of creating stable grain refined metals with improved properties [16,17].
A particular focus of the current study has been to investigate how different levels of Mn in solid solution (and thus the potential for concurrent precipitation) and/or how different pre-existing particle structures (in terms of size and the number density of constituents and dispersoids) influence the deformation and subsequent back-annealing behavior. While some related papers have given special attention to the grain structure and texture evolution during back-annealing [18,19,20], the present paper provides a more detailed characterization of the microchemistry and microstructural evolution during homogenization and deformation as well as a quantitative analysis of the final recrystallized grain structures. The key to understand the recovery and recrystallization behavior, is the prior sub-structure and microchemistry state in terms of constituents particles, solid solution levels and dispersoids. A detailed characterization of the as-homogenized and deformed (cold-rolled) states is therefore included. To discuss the degree of concurrent precipitation and its influence on the back-annealing behavior, Time-Temperature-Transformation (TTT) diagrams with respect to precipitation and recrystallization have been established. The precipitation behavior during back-annealing of selected conditions is followed in detail for a more quantitative analysis of the dispersoid effects. The recrystallized grain sizes are discussed in view of model concepts assuming particle stimulated nucleation of recrystallization to be the main nucleation mechanisms and estimates for the stored energy (driving force for recrystallization) and Zener drag obtained from the experiments.

2. Experimental Section

2.1. Material Preparation and Thermomechanical Treatments

The material investigated in this work was a model direct chill (DC) cast aluminum extrusion billet with a diameter of 228 mm and 1 m in length supplied by Hydro Aluminum (Sunndalsøra, Norway). The chemical composition of the alloy was (in wt. %): Mn 0.97, Fe 0.53, and Si 0.15. Samples were machined from the central region of the as-cast billet. In addition to the as-cast state, three distinctively different homogenization procedures (see Table 1 for details) were used in order to achieve different levels of Mn in solid solution and obtain different volume fractions and size distributions of constituent particles and dispersoids. The different material conditions were labeled C2-X (X = 0–3), to be consistent with related work on the same alloys [18,19,20], as shown in Table 1. The different dispersoid density levels indicated in Table 1 will be confirmed and discussed later in the paper. The homogenization treatments were performed in an air circulation furnace with a temperature accuracy of ±2 °C, starting from room temperature (about 20 °C) with a heating rate of 50 °C/h, followed by different annealing schedules as specified in Table 1. Materials were water quenched to room temperature at the end of the homogenization procedure.
Cold rolling was performed in order to obtain a deformed material for subsequent investigation of softening behavior of materials in different homogenized states. Heavily lubricated rolls and maximum roll velocity, which minimizes the shear zone in the surface region of the sheet, were used in order to obtain a microstructure similar to industrial processed materials. The homogenized materials, in the form of cuboid pieces of length 200 mm, width 80 mm and an initial thickness of 15 mm and 30 mm were cold rolled to a thickness of about 1.5 mm, i.e., thickness reductions of 90% and 95%, corresponding to true strains of ε = 1.6 and 3.0, respectively. The rolled sheets were subsequently isothermally back-annealed in a salt bath at different temperatures in the range 300–500 °C and times in the range 5–105 s, followed by water quenching to room temperature. The specimens were stirred after they were immersed in the salt bath in order to minimize the heating time, an aspect that is especially important for short annealing times and for thick specimens [21]. The softening and precipitation behavior during annealing were followed by Vickers hardness (VHN) and electrical conductivity (EC) measurements performed on the RD-TD (RD: rolling direction; TD: transverse direction) plane of sheets [18,19]. Following the procedure used in [13], TTT-diagrams with respect to precipitation and recrystallization were established, as a basis for analyzing the degree of recrystallization and concurrent precipitation, where a 25% drop in hardness from the deformed condition to the fully recrystallized condition was used to indicate the onset of recrystallization and a 2.5% increase in electrical conductivity was defined as the start of precipitation, assuming changes of Mn in solid solution (and thus precipitation of Mn-containing dispersoids) to be the main contribution to changes in EC [13,19].

2.2. Microstructure Characterization

The microstructure of the samples was analyzed in a Zeiss Ultra 55-Limited Edition field emission scanning electron microscope (FESEM, Oberkochen, Germany), equipped with an energy dispersive spectrometer (EDS, Bruker, Berlin, Germany) for chemical composition analysis, a back-scattered electron detector (BSE, Zeiss, Germany) for the sub-grain structure and particle characterization, and electron back-scattered detector (EBSD, Nordif, Trondheim, Norway) for orientation imaging mapping (OIM). Characteristic size parameters of primary particles as measured in two-dimensional (2D) cross-sections, including circle equivalent diameter, mean diameter, area fraction and number density, were measured by the image analysis software IMAGE-PRO (Media Cybernetics, Rockville, MD, US). To transpose the measured 2D distributions into a 3D-distribution a Johnson-Saltykov analysis has been used [22,23,24]. The basis for this analysis is that the particles are assumed to belong to different size classes, and where these size classes scale with the logarithm of the circle equivalent diameter, dk = 100.1k. For simplicity the particles in the present work are all assumed spherical. Corrections for non-spherical shaped particles and a finite information depth may be performed [23], although such corrections have not been included in the present work.
Both light optical microscopy (LOM, Leica Microsystems, Wetzlar, Germany) and SEM-EBSD orientation mapping was used to image the grain structure and measure grain sizes of specimens in different conditions. Grain size was measured by using the line intercept method. The measurements were performed both in the rolling direction (RD) and the normal direction (ND) and grain size was determined by the average of more than 300 grains.
Vickers hardness was measured with a Matsuzawa DVK-1S hardness tester (Toshima, Tokyo, japan) with a load of 1 kg, loading speed 100 µm/s and 15 s loading time. The measurements were performed by mounting the contact probe on a clean, planar sample surface, after grinding on a SiC paper with a surface finish of 1200 Mesh. The hardness was the average of at least 5 measurements on the rolled surfaces. Electrical conductivity was measured by a Sigmascope EX 8 (Sindelfingen, Germany) at room temperature of about 293 K (20 °C). The electrical conductivity values were averaged by 3 measurements on each sample. An accuracy of ±0.05 MS/m can be achieved by the experimental setup.

3. Results

3.1. Initial Microstructure before Rolling

The manganese levels in solid solution, Mnss, of the different initial conditions, i.e., the as-cast state and after the three different homogenization procedures were estimated based on Thermo-Electrical Power (TEP) measurements (see e.g., [25] for details) and the results are shown in Table 1 above. The Mn content in solid solution in the as-cast condition (C2-0) is 0.69%. As compared to the non-homogenized condition C2-0, it can be seen that the Mn content following the three homogenization procedures has been much reduced, and in particular for the two last variants (C2-2 and C2-3). Although quite different, the two latter homogenization procedures have quite efficiently promoted the decomposition of the Mn supersaturated solid solution from the as-cast condition, where the C2-2 condition (heating 50 °C/h to 450 °C + 4 h@450 °C) has only slightly higher Mn content in solid solution than the second homogenization procedure involving longer holding times at higher temperatures (C2-3; involving 4 h@600 °C + 25 °C/h down to 500 °C + 4 h@500 °C + quenching). The reduction of Mn in solid solution can mainly be attributed to precipitation of Mn-bearing dispersoids, and also to the growth of Mn-containing constituent particles [26,27]. The low value of Mn remaining in solid solution in the two last variants indicates that these alloy conditions have a limited potential for concurrent precipitation during a subsequent annealing stage. However, the different dispersoid structures (see details below) in terms of the size and number density will still have a very different influence on the softening behavior, as will be demonstrated later in the paper.
SEM-BSE micrographs of the particle structures of the four conditions after homogenization are illustrated in Figure 1. The solidification microstructure (as-cast) is shown in Figure 1a. The eutectic primary particles with rod and plate like shape are distributed in the interdendritic regions and at grain boundaries. The area fraction of the primary particles is measured to be 2.1%, and mean diameter of primary particles is estimated to be 0.8 μm. The microstructure of the C2-1 material after homogenization (24 h@600 °C) is shown in Figure 1b. Most of the eutectic networks are broken up, and primary particles have become coarsened and spheroidized. The area fraction and the mean diameter of the primary particles have increased, and are measured to be 2.9% and 1.5 μm, respectively. Furthermore, only a few small precipitated dispersoids are seen to be distributed within the interdendritic regions of the homogenized sample. The number density is measured to be 0.17 × 10⁶ (1/mm2), and the mean diameter is 170 nm. These observations indicate that the decreased content of Mn in solid solution in the C2-1 material mainly contributes to the growth of the primary particles, and only to a small amount to the precipitation of dispersoids.
For the C2-2 material which is homogenized at a lower temperature (450 °C), there is only a slight coarsening of the constituent particles as compared to the as-cast state due to the low diffusion rate of Mn in the Al matrix [28]. Moreover, most of the eutectic constituent particles keep their rod-like or plate-like shapes, as in the as-cast condition. The area fraction of constituent particles in C2-2 is measured to be 1.9%, and mean diameter of the constituent particles is measured to be 1.0 μm. During heating and holding at 450 °C for the C2-2 sample, the decomposition of the supersaturated solid solution is mainly through precipitation of dispersoids. For the more elaborate homogenization of the C2-3 material, the area fraction of constituent particles is measured to be 2.7%, and mean diameter of constituent particles is measured to be 1.5 μm. The fact that the area fraction of constituent particles in the C2-3 condition is larger than that of the C2-2 sample is due to coarsening of the large constituent particles on behalf of the fine dispersoids, during heating and holding at the higher temperature (>530 °C), which makes the constituent particles growing. In addition, for the C2-3 condition, the homogenization procedure, which combines both a high and medium holding temperature, also results in general growth of large constituent particles (600 °C) as well as coarsening of existing dispersoids (at 500 °C).
In order to show more clearly the morphology and distribution of the dispersoids precipitated after homogenization in the C2-2 and C2-3 samples, high magnification electron backscattered images were recorded, as illustrated in Figure 2, where a significant difference in dispersoid structures can be seen, in terms of number density and size. The diameter of the dispersoids in C2-2 and C2-3 were quantitatively measured and the size distributions are shown in Figure 3 (the fully drawn lines represent smooth curves fitted to the experimental values). The number density and mean diameter of dispersoids are listed in Table 2, together with corresponding values for the C2-1 alloy. The chemical compositions of the dispersoids measured by SEM-EDS show that the dispersoids are mainly of α-Al(Mn,Fe)Si type. C2-2 contains a large percentage of small dispersoids with a maximum in the size distribution in the range 100–200 nm. No dispersoids larger than 400 nm could be detected. The number density is measured to be 2.8 × 106 mm−2 and the mean diameter estimated to be 105 nm. C2-3 contains more large particles with the peak position shifted to ~230 nm along with a broader distribution and a lower peak value. The number density is measured to be 0.9 × 106 mm−2 and mean diameter estimated to be 156 nm. A large part of the dispersoids precipitated during heating has dissolved during holding at 600 °C for 4 h. The solid solution supersaturated with Mn decomposes further during cooling from 600 °C to 500 °C, however, there is limited precipitation of new dispersoids, and the result is mainly further growth of the pre-precipitated dispersoids and large constituent particles [26,27]. Nucleation of dispersoids in 3xxx alloys mainly occurs in the low temperature range (300–450 °C) during heating, while at higher temperatures the evolution of dispersoids is mainly controlled by coarsening and dissolution [26,27].

3.2. Deformation Microstructure

Characteristics of the deformed state may have a significant influence on the subsequent softening behavior. Therefore, a thorough characterization of the deformation structure has been carried out, including the evolution in primary particle structures with increasing cold deformation. The morphology of constituent particles of the four material condition imaged by SEM-BSE after cold rolling to a strain of ε = 1.6 are illustrated in Figure 4. As compared to the as-homogenized conditions the network of constituent particles, after deformation, has been compressed and some broken up into smaller particles with rod and plate like shape and distributed more densely and uniformly in the matrix. Moreover there is a clear tendency of the particles to be rotated and aligned into strings along the RD direction. There are also some distinct differences between the different conditions. Both the non-homogenized material, C2-0, and the C2-2 and C2-3 conditions, have a higher number density of particles after deformation as compared with the C2-1 condition. For the latter condition the particles are coarser and the number density is smaller. The shape and size of the primary particles after deformation is mainly inherited from the as-cast and as-homogenized conditions, e.g., in the C2-1 condition the particles are generally larger and have a more rounded shape than those in the other conditions, in particular C2-0 and C2-2.
The sizes of the particles in the cold-rolled conditions were also measured quantitatively in terms of 2D size-distributions. Following a Johnson-Saltykov analysis [22,23], they are presented as 3D cumulative size distributions for the different materials before deformation (as-homogenized) and after true strains of ε = 1.6 and 3.0 in Figure 5. All the 3D cumulative size distributions of constituent particles are fitted to an equation of the following form [29]:
F ( η ) = N 0 exp ( L η )
where η is the volume equivalent particle diameter, and N0 and L are characteristic size distribution parameters. The resulting values for N0 and L in the different conditions are listed in Table 3.
As compared to the as-homogenized condition, the as-deformed samples all contain fewer particles with size larger than 1 µm. This can be attributed to particle break-up taking place during deformation which changes the size distribution and increases the number density of particles smaller than 1 µm at the cost of the larger ones. The effect of break-up is best seen for the largest particles, i.e., generally for those larger than ~3–4 μm. The size distributions in Figure 5 clearly confirm the qualitative considerations of the particle size differences between the different conditions made above with reference to the micrographs in Figure 4. The C2-0 material contains a considerably larger number density of particles with size smaller than 1 μm as compared to both the C2-1 and C2-3 materials. Moreover, no particles with equivalent diameter larger than 4 μm were found in the C2-0 material. The same applies for the C2-2 materials and for both more than 90% of the particles at a strain of ε = 3 are less than 1 μm. The C2-1 material on the other hand contains more coarse particles, and the equivalent diameter of the largest particles was measured to be ~5 μm. In this material, more than 30% of the particles at a strain of ε = 3 are larger than 1 μm. For C2-3 almost 20% of the particles at a strain of ε = 3 are larger than 1 μm. These large differences of the particle structure do lead to differences in the PSN activity during subsequent annealing and softening, as discussed later in the paper.
In order to show the influence of different microchemistry (in terms of constituents and dispersoid structures) on the sub-structure evolution during deformation, the sub-grain size after the different cold-rolling strains of the different material variants were measured. The sub-grain sizes were measured from SEM-BSE images (RD-ND section; cf. Figure 7a,b below, unrecrystallized) using the linear intercept method in the length direction (RD; δlength) and normal direction (ND; δwidth), and the results are presented in Table 4. The sub-grain sizes typically vary between ~1.0 μm for the lowest strain in RD direction to less than 0.3 μm for the largest strain in the ND-direction. As expected, the sub-grain sizes are decreasing with increasing strain. Except for the C2-1 alloy, where the sub-grain sizes are generally larger, there is no significant influence of the different particle structures on the sub-grain structures. The sub-grain sizes in the deformed condition are of importance during the subsequent annealing treatment as they are the main factor that determines the stored energy of the as-deformed conditions, i.e., the driving pressure for recovery and recrystallization.

3.3. Softening Behavior

The softening behavior of the differently homogenized materials (i.e., with different microchemistry) after a strain of 1.6, in view of Vickers hardness (VHN) and electrical conductivity (EC) are shown in Figure 6a–d, where the behavior at four different annealing temperatures are compared, i.e., 350 °C, 400 °C, 450 °C and 500 °C. The corresponding TTT-diagrams are shown in Figure 6e–h.
As shown, the softening behavior (kinetics) is very different for the different materials and the temperature dependence for each of them is also very different. It is observed that both for the C2-0 variant and the C2-2 material the kinetics is quite sluggish except for at the highest annealing temperature. At the two lowest annealing temperatures, 350 and 400 °C, neither material fully recrystallizes even within 105 s of annealing. This has been confirmed (not shown) by light optical microscopy which show only partial recrystallization even after this long annealing times. For the C2-0 alloy the slow kinetics is connected with quite considerable concurrent precipitation of Mn (into Mn-containing dispersoids) as indicated by the considerable increase in EC during annealing and also illustrated by the TTT diagram in Figure 6b. Only at the highest temperature (500 °C) recrystallization is so fast that the influence of precipitation is limited. For the C2-2 material the very slow kinetics, especially at the two lowest annealing temperatures, are associated with a considerable amount of pre-existing fine dispersoids. However, although less than for C2-0, some additional (concurrent) precipitation is also observed for this material (note the scale difference), and which at the two lowest temperatures mainly take place prior to or simultaneous with the recrystallization reaction.
For the C2-1 material the softening reaction is fairly fast for the three higher temperatures, fully recrystallized conditions are reached within 100 s (confirmed by LOM) even at 400 °C. For the lowest temperature (350 °C), however, the softening is strongly delayed and the material is barely recrystallized even after 104 s of annealing. As for the C2-0 alloy this is related to considerable concurrent precipitation at this temperature, while at 400 °C and above, recrystallization is mainly finished before any significant precipitation takes place (Figure 6f). For the C2-3 alloy, kinetics is generally faster, and only at the lowest temperature any influence of precipitation can be observed (Figure 6c,g). As compared to the other alloy conditions, precipitation in this alloy is both slower and much less, with limited influence on the recrystallization behavior.
The softening behavior upon annealing of the same four differently homogenized variants after a prior rolling strain of ε = 3.0 has also been monitored. However, the qualitative differences between the different material conditions (and temperatures) follow the same pattern as for the same materials after a strain of ε = 1.6 (Figure 6). The corresponding softening curves, the evolution in electrical conductivity (as a measure of precipitation) and associated TTT-diagrams are therefore not shown here, but are included in the Figure S1.
The measured grain sizes in the fully recrystallized conditions (when achieved), of the different materials are summarized in Table 5. Although very different for the different materials, the general trend is that the grain size decreases with increasing annealing temperature, while the effect of increasing rolling strain is not equally obvious. However, the apparent increase in grain size with strain for some conditions is most probably due to the difference in concurrent precipitation where generally stronger concurrent precipitation is observed with larger cold deformation. Also poor statistics/measuring uncertainty might have contributed. The most obvious and pronounced differences are reflecting the differences in microchemistry and in particular the influence of fine dispersoids on the recrystallization behavior, whether pre-existing (as for C2-2) and/or as a result of significant concurrent precipitation. In both cases highly elongated coarse grain structures result.

3.4. Precipitation Behavior

To more closely correlate the microchemistry state and in particular quantify the influence of dispersoids and concurrent precipitation (i.e., the Zener pressure) on the microstructure evolution during annealing and the associated softening behavior, one or two (for C2-0) annealing conditions for each of the four homogenization variants have been chosen for a further analysis in view of their precipitation behavior, i.e., all materials after deformation to a strain of ε = 1.6 and subsequent annealing at 350 °C, 400 °C , and 450 °C. The number density of dispersoids and their mean diameter as a function of annealing time have been measured, and the results are presented in Table 6. The measurements were carried out by a manual 2D-counting procedure based on high magnification BSE-micrographs. Areas without constituent particles were selected to perform these measurements, and the measured data refer to selected areas of the samples which may be characterized as areas of “maximum density” of dispersoids.
The dispersoid structure evolution for the differently homogenized structures is largely consistent with the evolution in electrical conductivity as presented in Figure 6. The C2-0 material starts out with no dispersoids, however, after 10 s of annealing a measurable number density of fairly small dispersoids (diameter of about 40 nm) is obtained, which increases with a factor of 20× during the annealing period, while the mean size increases only moderately. For the C2-1 material a certain number density of much coarser dispersoids (~150 nm) is present already in the deformed state (formed during homogenization). During annealing, the number density clearly increases, although much less than for C2-0 (factor of 3), while the mean size also in this case increases only moderately.
The different dispersoid structures of the C2-0 and C2-1 material are exemplified in Figure 7, where the microstructures as observed by SEM-BSE micrographs after 5 s and 104 s of annealing are shown. As seen no dispersoids can be observed in the C2-0 material after only 5 s of annealing while a high density in present in the one annealed for 104 s. We also see that even at this long annealing time this is still mainly an unrecrystallized sub-grain structure (which has only experienced some recovery/sub-grain growth from the initially deformed state), consistent with previous results (Figure 6). As observed the high density of small dispersoids decorate the sub-grain boundaries which thus are pinned by these, preventing recrystallization. In C2-1 on the other hand a few coarser dispersoids are present already after 5 s of annealing, and some more after annealing for 104 s (Figure 7d) which are mainly observed inside large recrystallized grains (note the differences in scale bar on the different micrographs). The distinctively larger particles at the upper half in Figure 7d are primary (constituent) particles.
For the C2-2 material, a fairly high density of medium sized dispersoids (~100 nm) is present already at the beginning the annealing process. During the first 1000 s of annealing, the number density distinctively increases, while there are only marginal changes in the mean diameter. This observation indicates that some new dispersoids precipitate from the matrix, which is also in accordance with an increase in EC during this stage as demonstrated by the EC evolution in Figure 6a. After longer annealing times, the number density decreases again and the mean diameter more clearly increases, i.e., mainly coarsening of the dispersoid structure takes place. A similar observation is also made for the C2-1 material at the longest annealing time. The “removal” of Mn from solid solution is still strong during this period, as seen from the increase in EC in Figure 6, so Mn in solid solution mainly diffuses into the pre-existing dispersoids and contributes to their growth.
For the C2-3 material a considerable amount of coarse dispersoids is present from the beginning of annealing and they remain mainly constant both in number density and mean size throughout annealing. These dispersoid number density and size values are comparable to those of the C2-1 material. The somewhat stronger influence on the softening behavior of the latter may indicate that the new dispersoids forming during the initial stages of annealing of the C2-1 material more effectively prevent and/or delay recrystallization than those already present in the deformed structure of the C2-3 material.

4. Discussion

This paper was mainly aimed to investigate the effects of different microchemistries (constituents, solid solution levels and dispersoids) on the substructure evolution during rolling to different strains and the subsequent softening behavior during back-annealing. Particular focus has been given to the influence of different dispersoid structures, whether pre-existing or mainly formed during back-annealing, in terms of the number density and size, on softening kinetics and final recrystallized grain size.
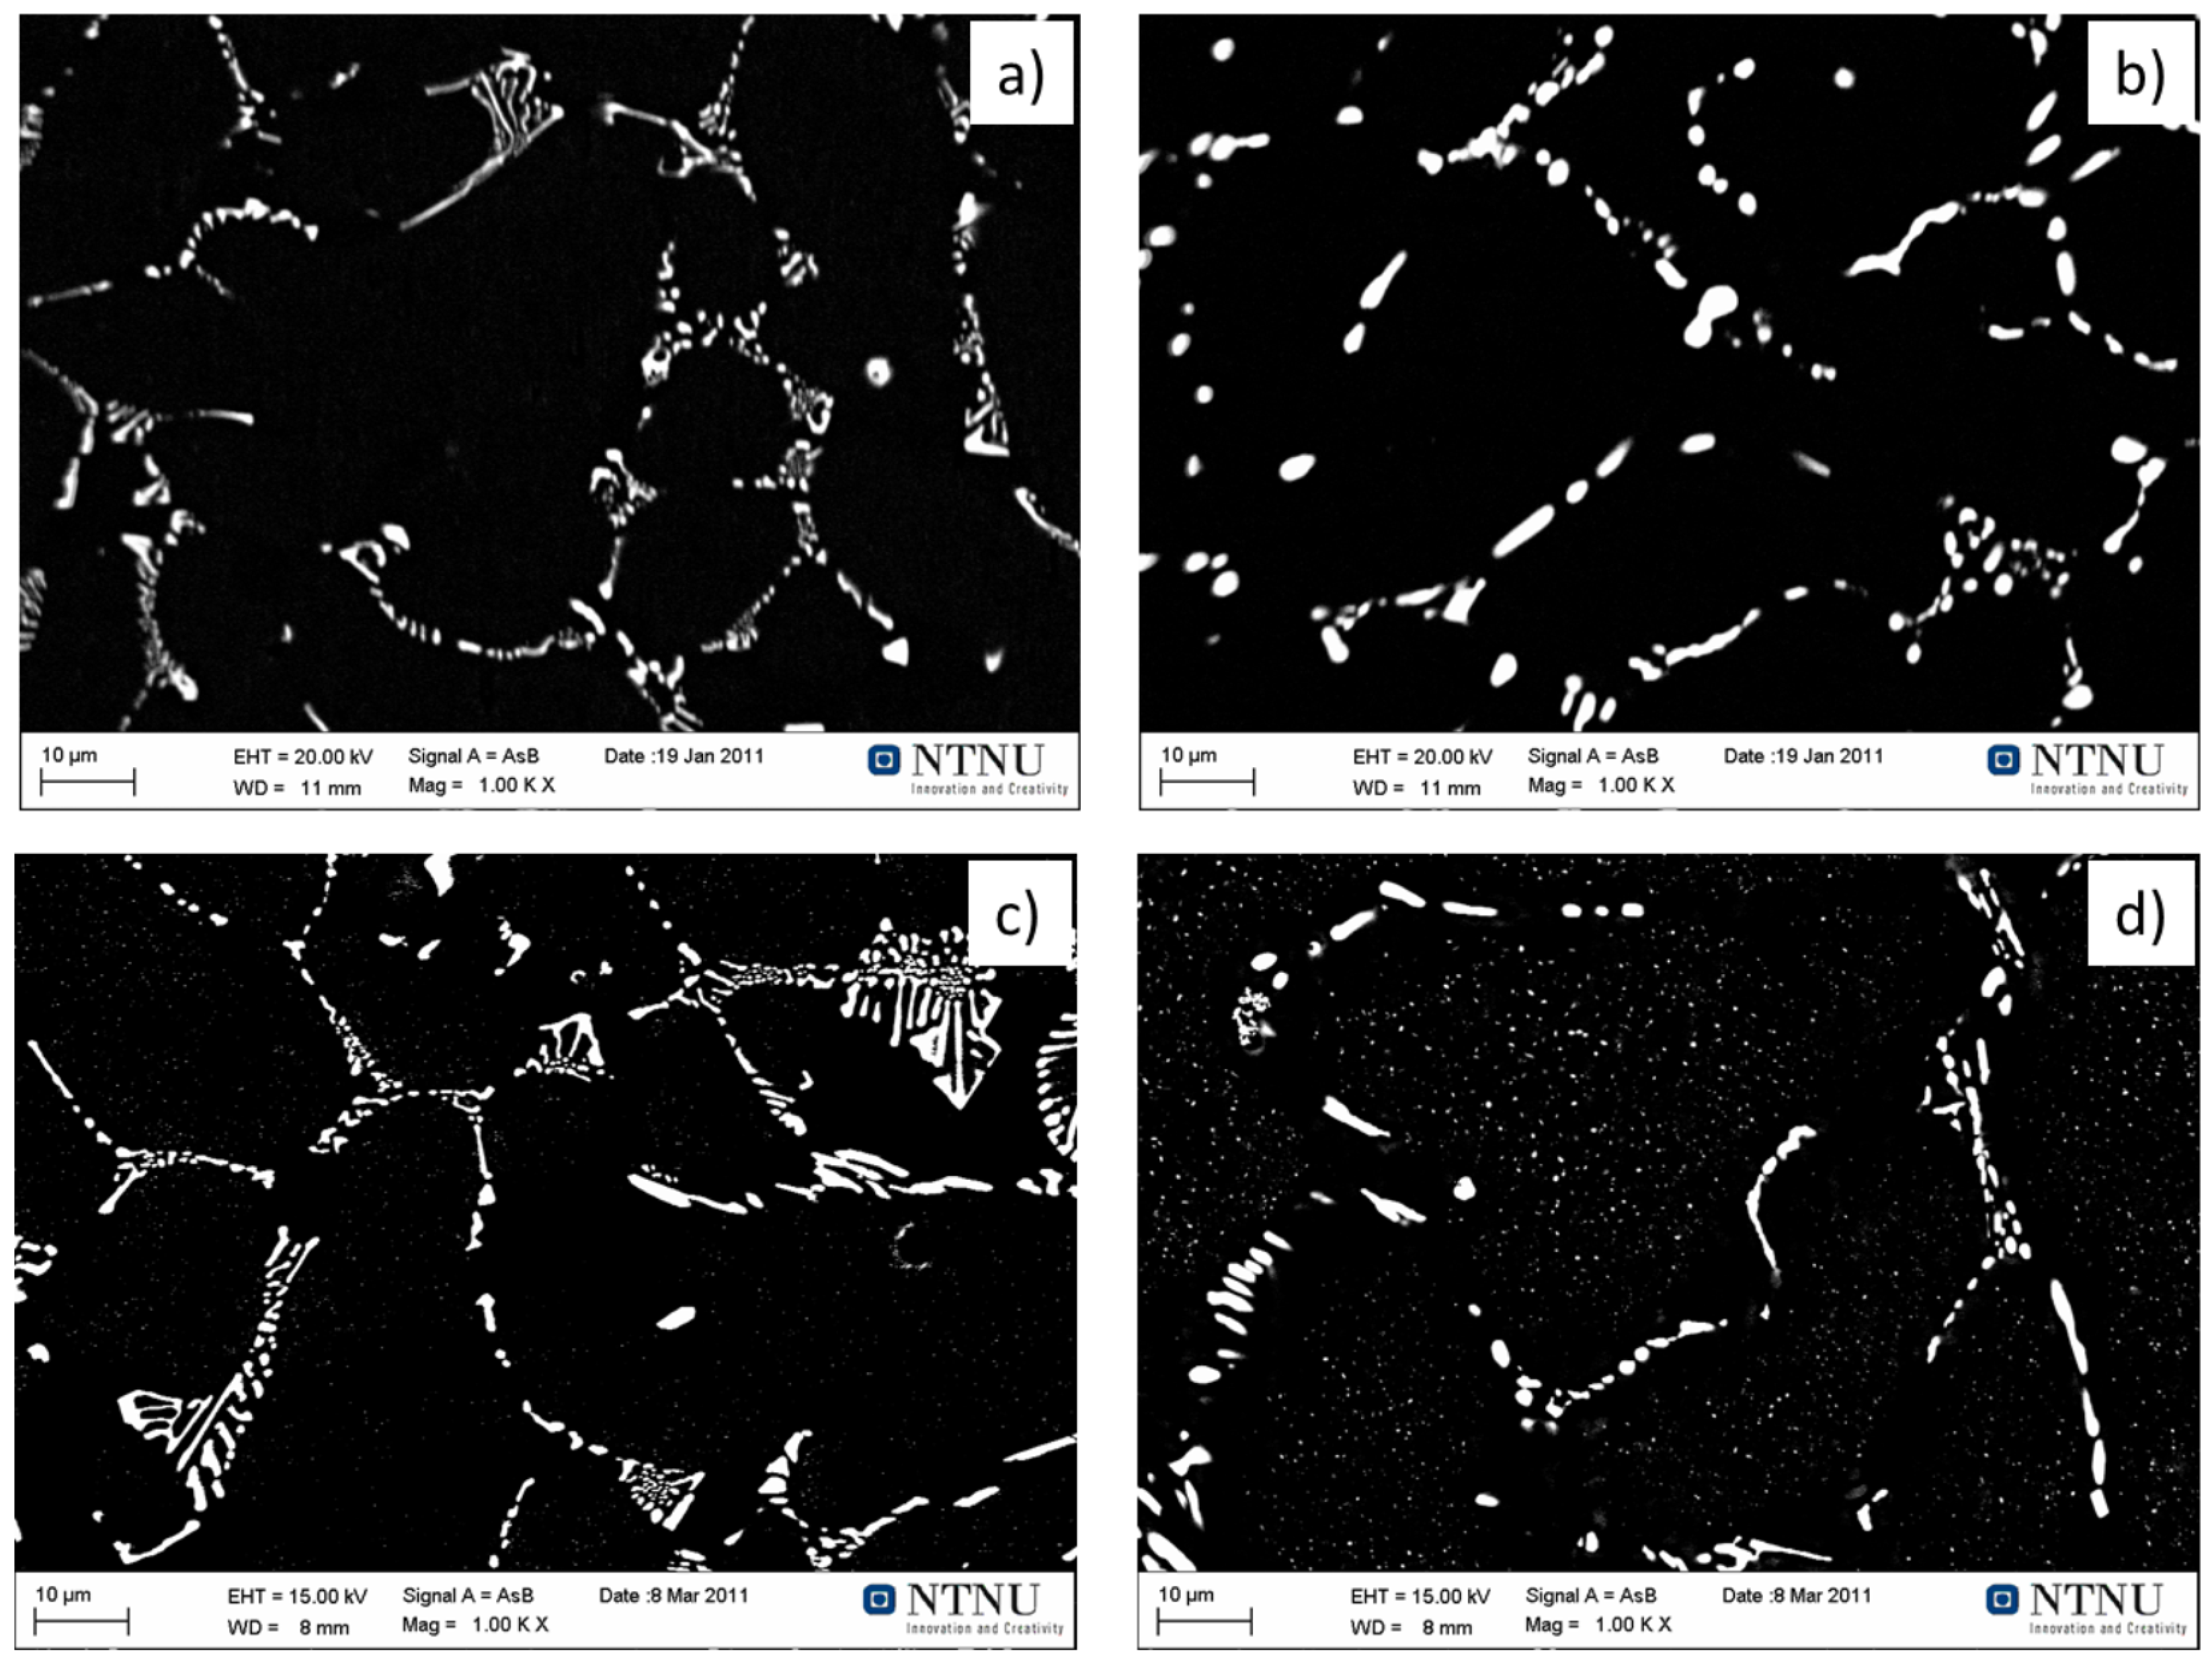
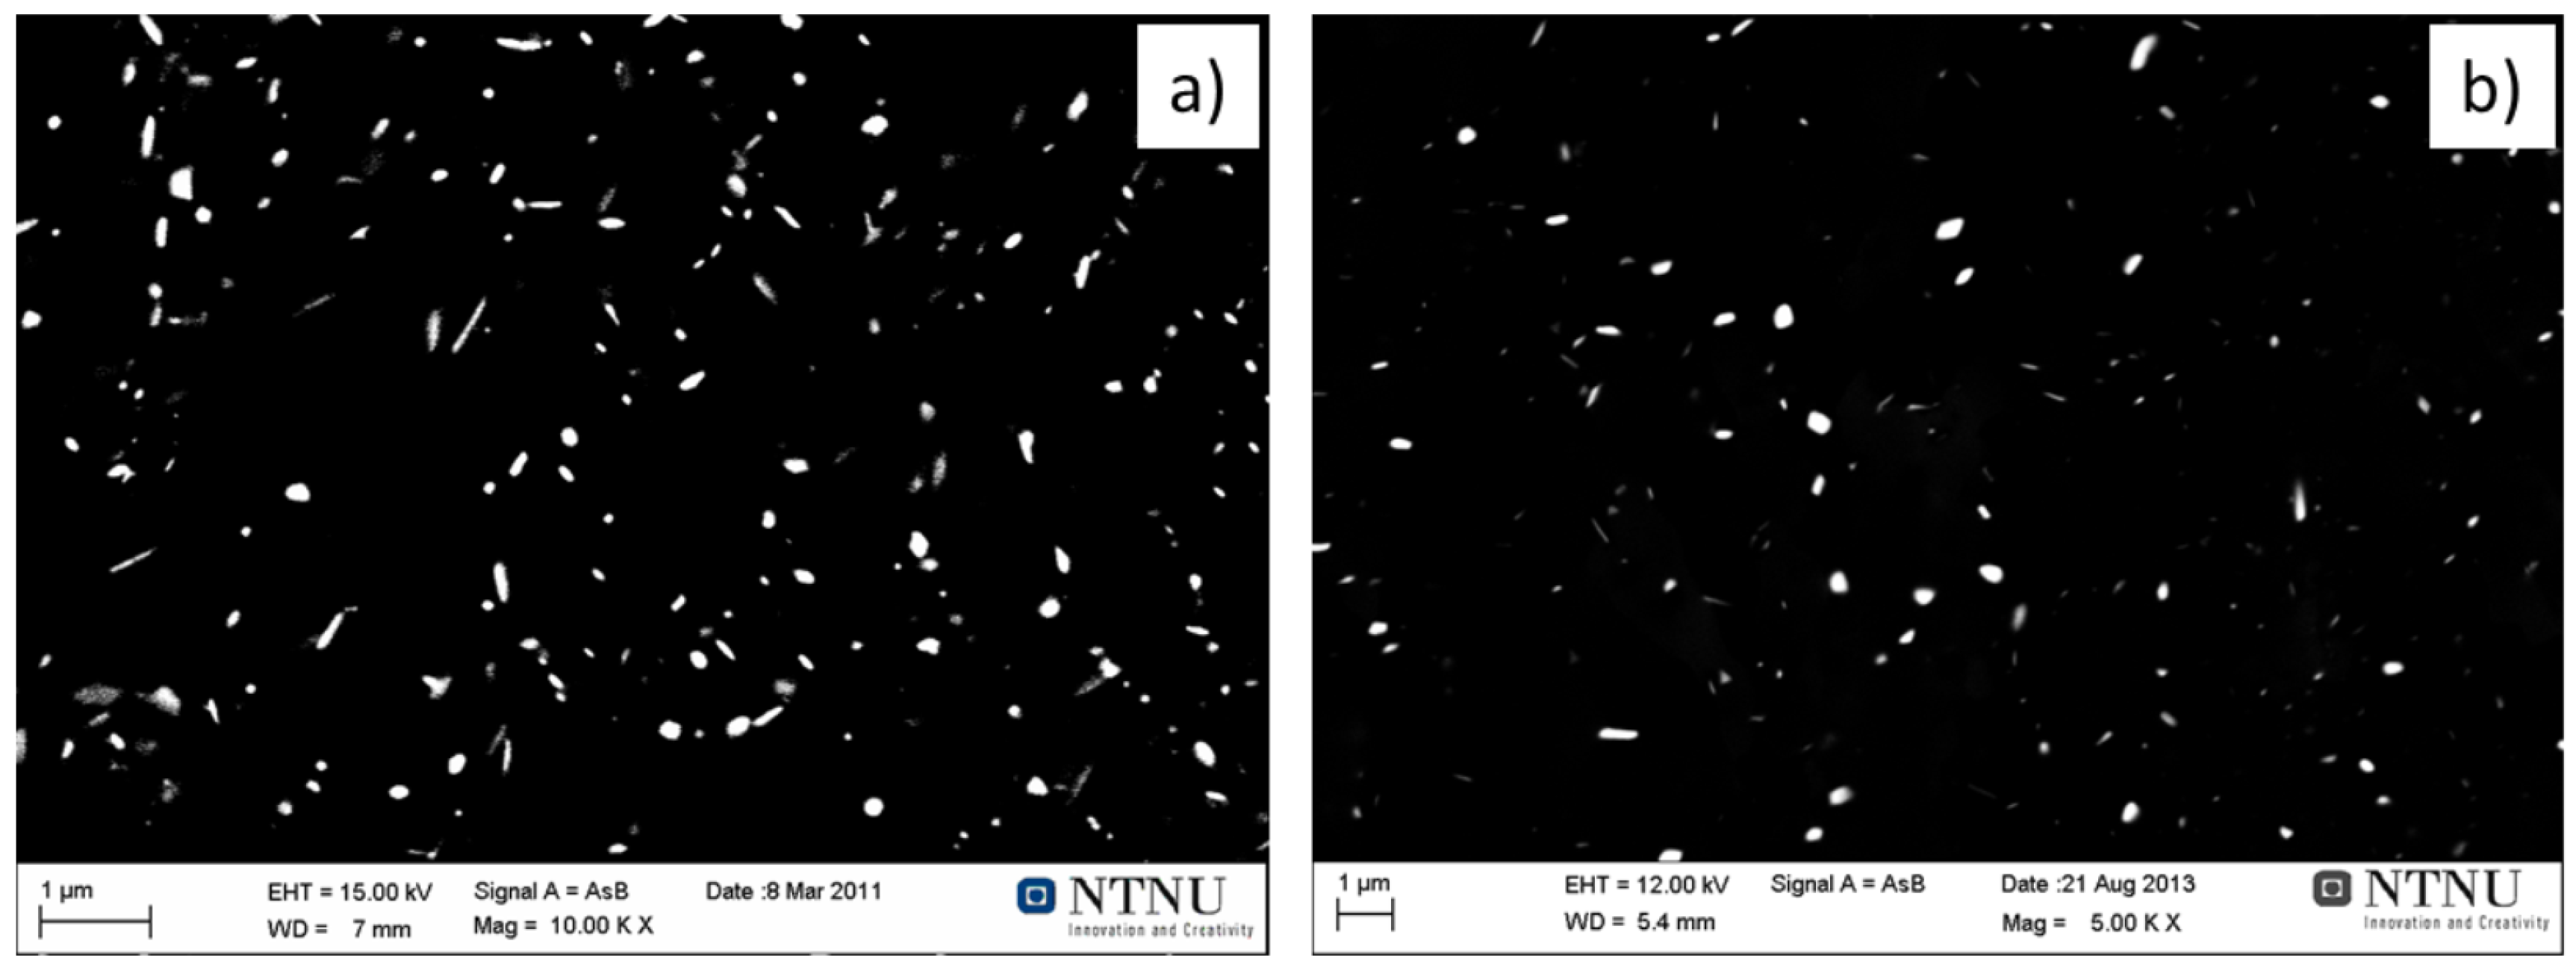
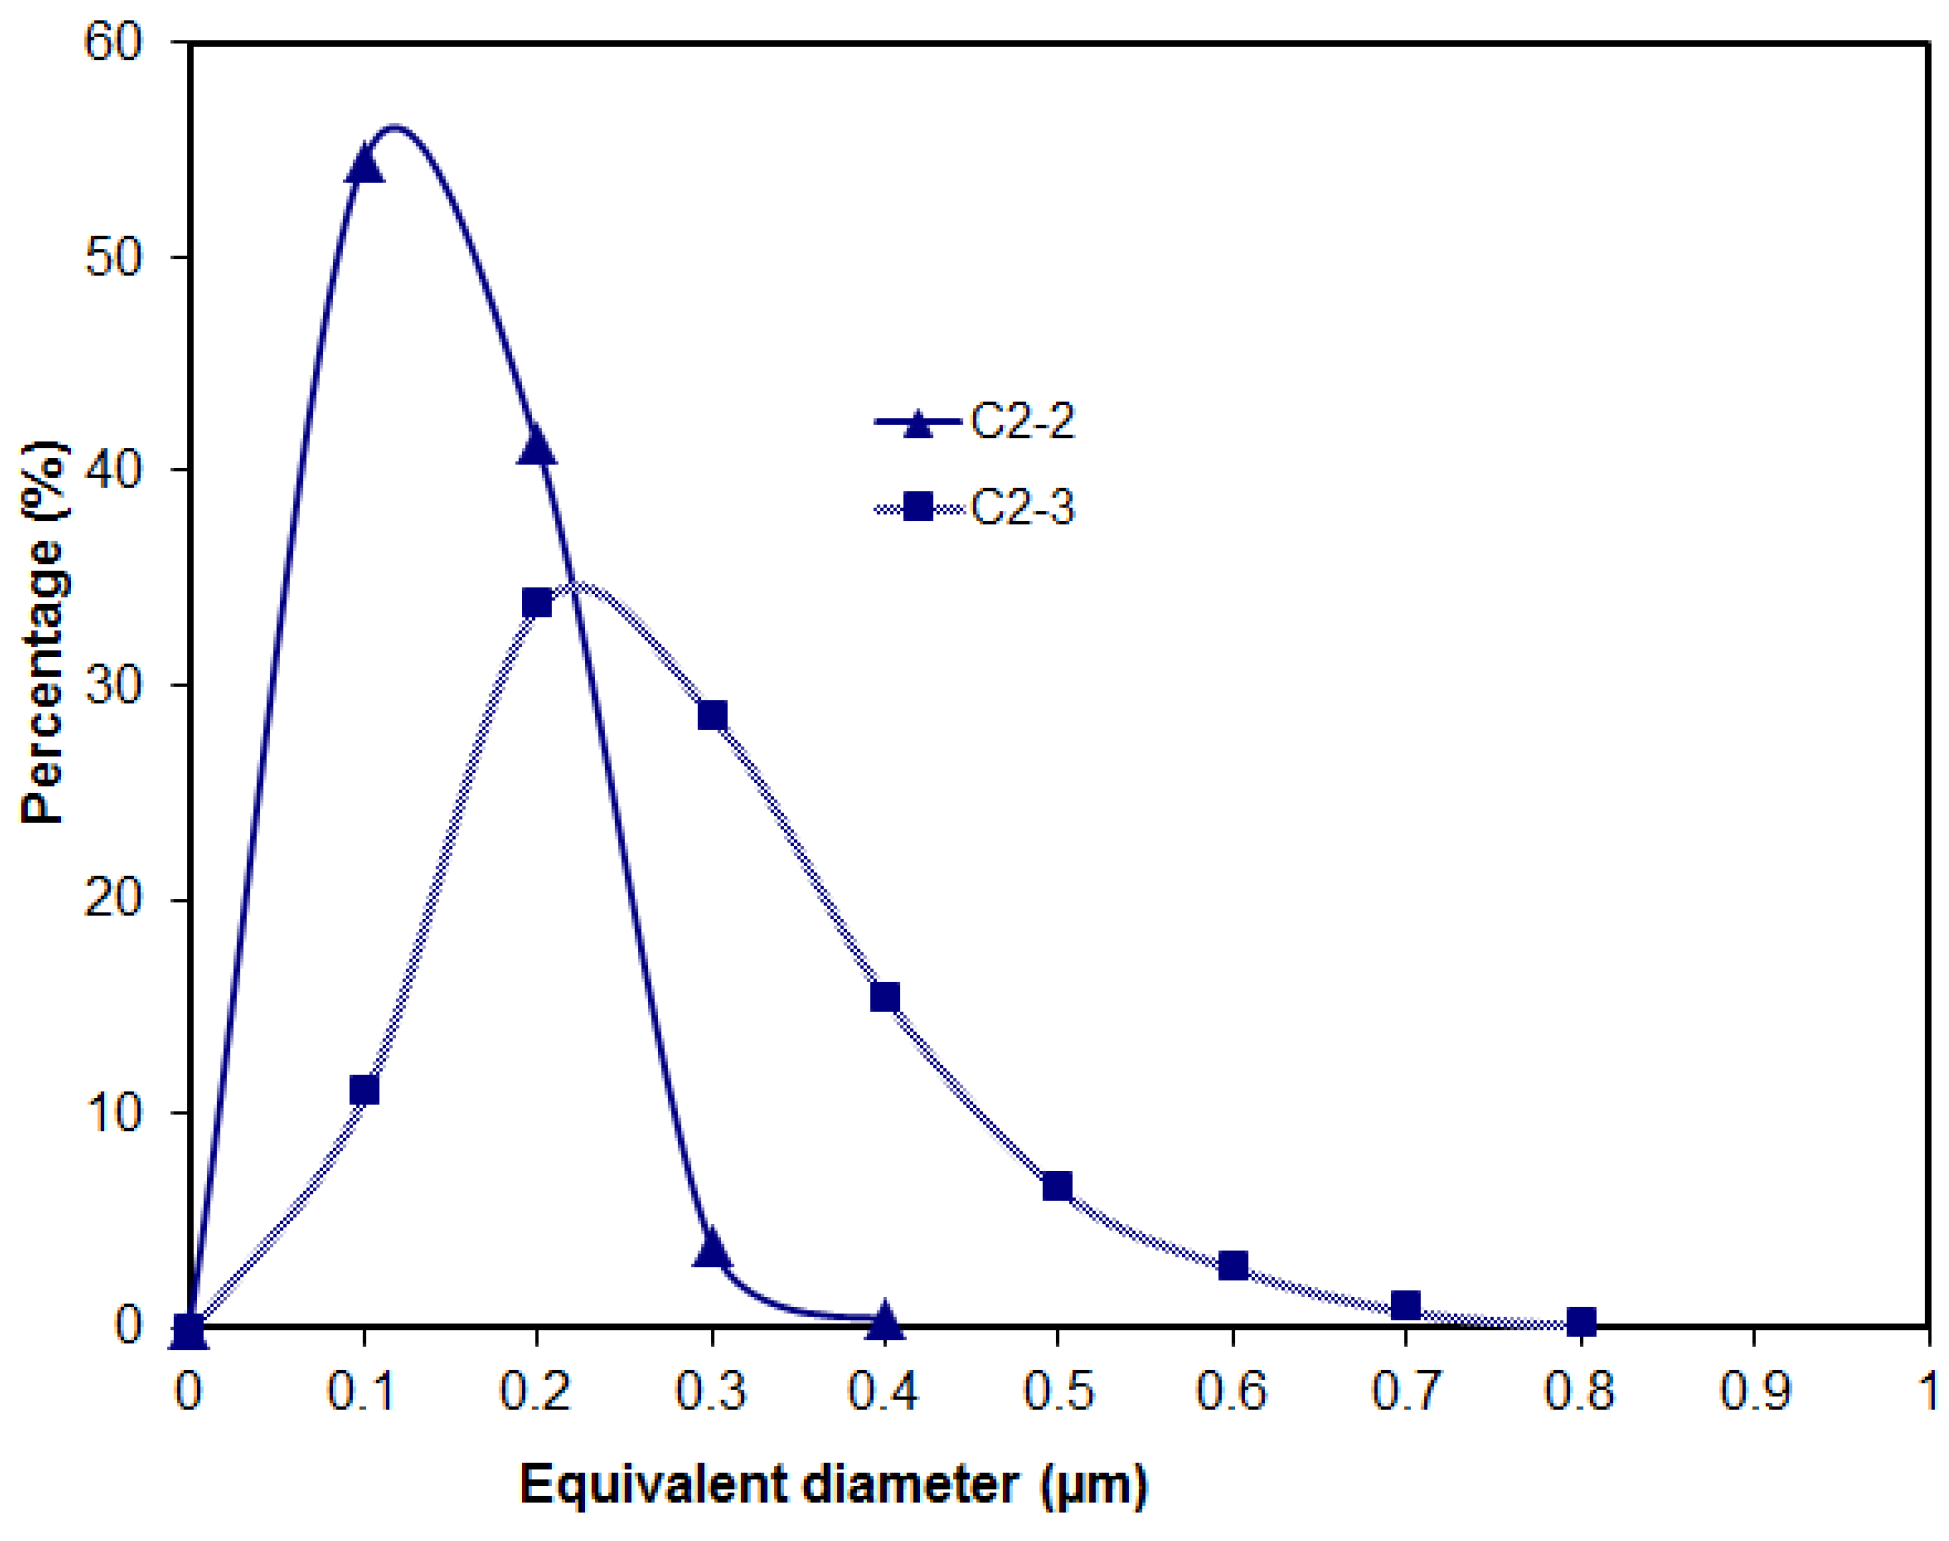
At low to medium temperatures of homogenization, the precipitation of dispersoids is controlled by nucleation and growth due to the relatively low diffusion rate of Mn in Al. At a homogenization temperature of 450 °C, the number density of dispersoids can reach a maximum and the spatial distance of dispersoids reaches a minimum. When increasing the temperature further, the diffusion speed of Mn in the matrix is increased significantly, and for annealing at 600 °C, dissolution of small and coarsening of large dispersoids as well as constituent particles becomes the prominent process due to the increased solubility and the fact that long distance diffusion becomes possible. This explains the difference in solid solution level and dispersoid structures of the two conditions C2-1 and C2-2. The slow and elaborate cooling procedure of condition C2-3 ensures additional precipitation of Mn into constituents and dispersoids while preserving a fairly coarse dispersoid structure and bringing the solid solution level even below the one in C2-2 (cf. Table 1).
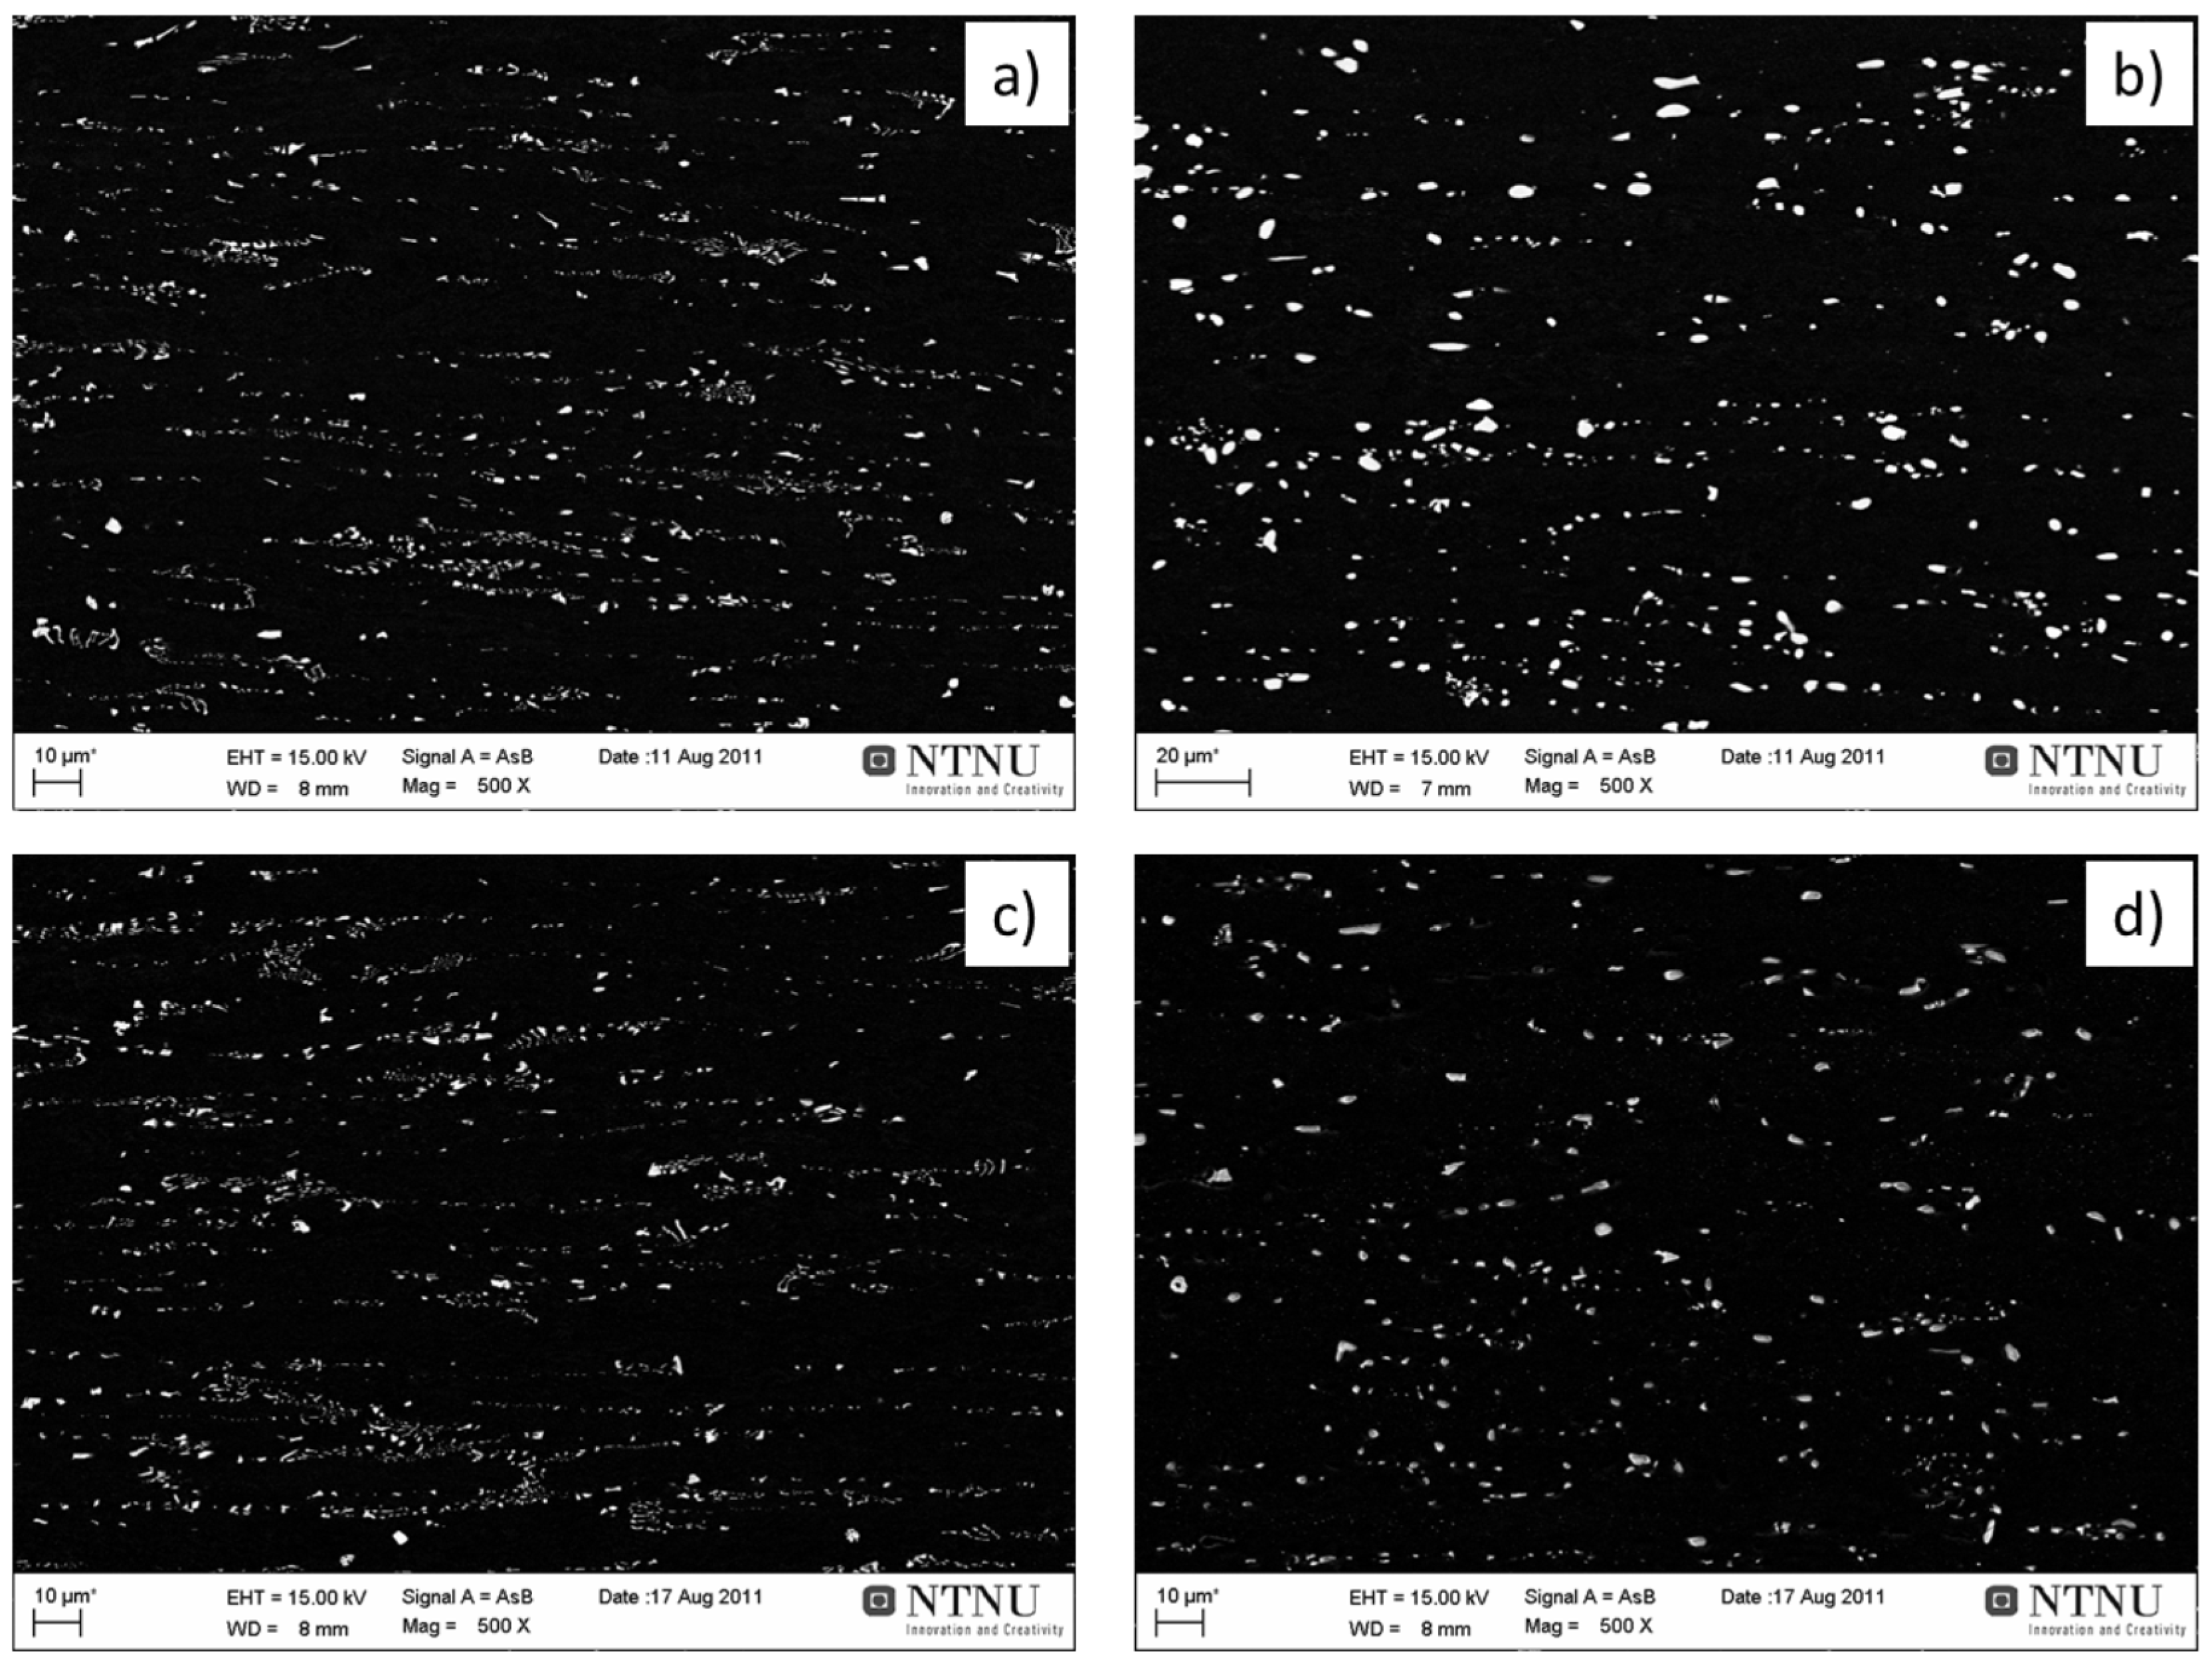
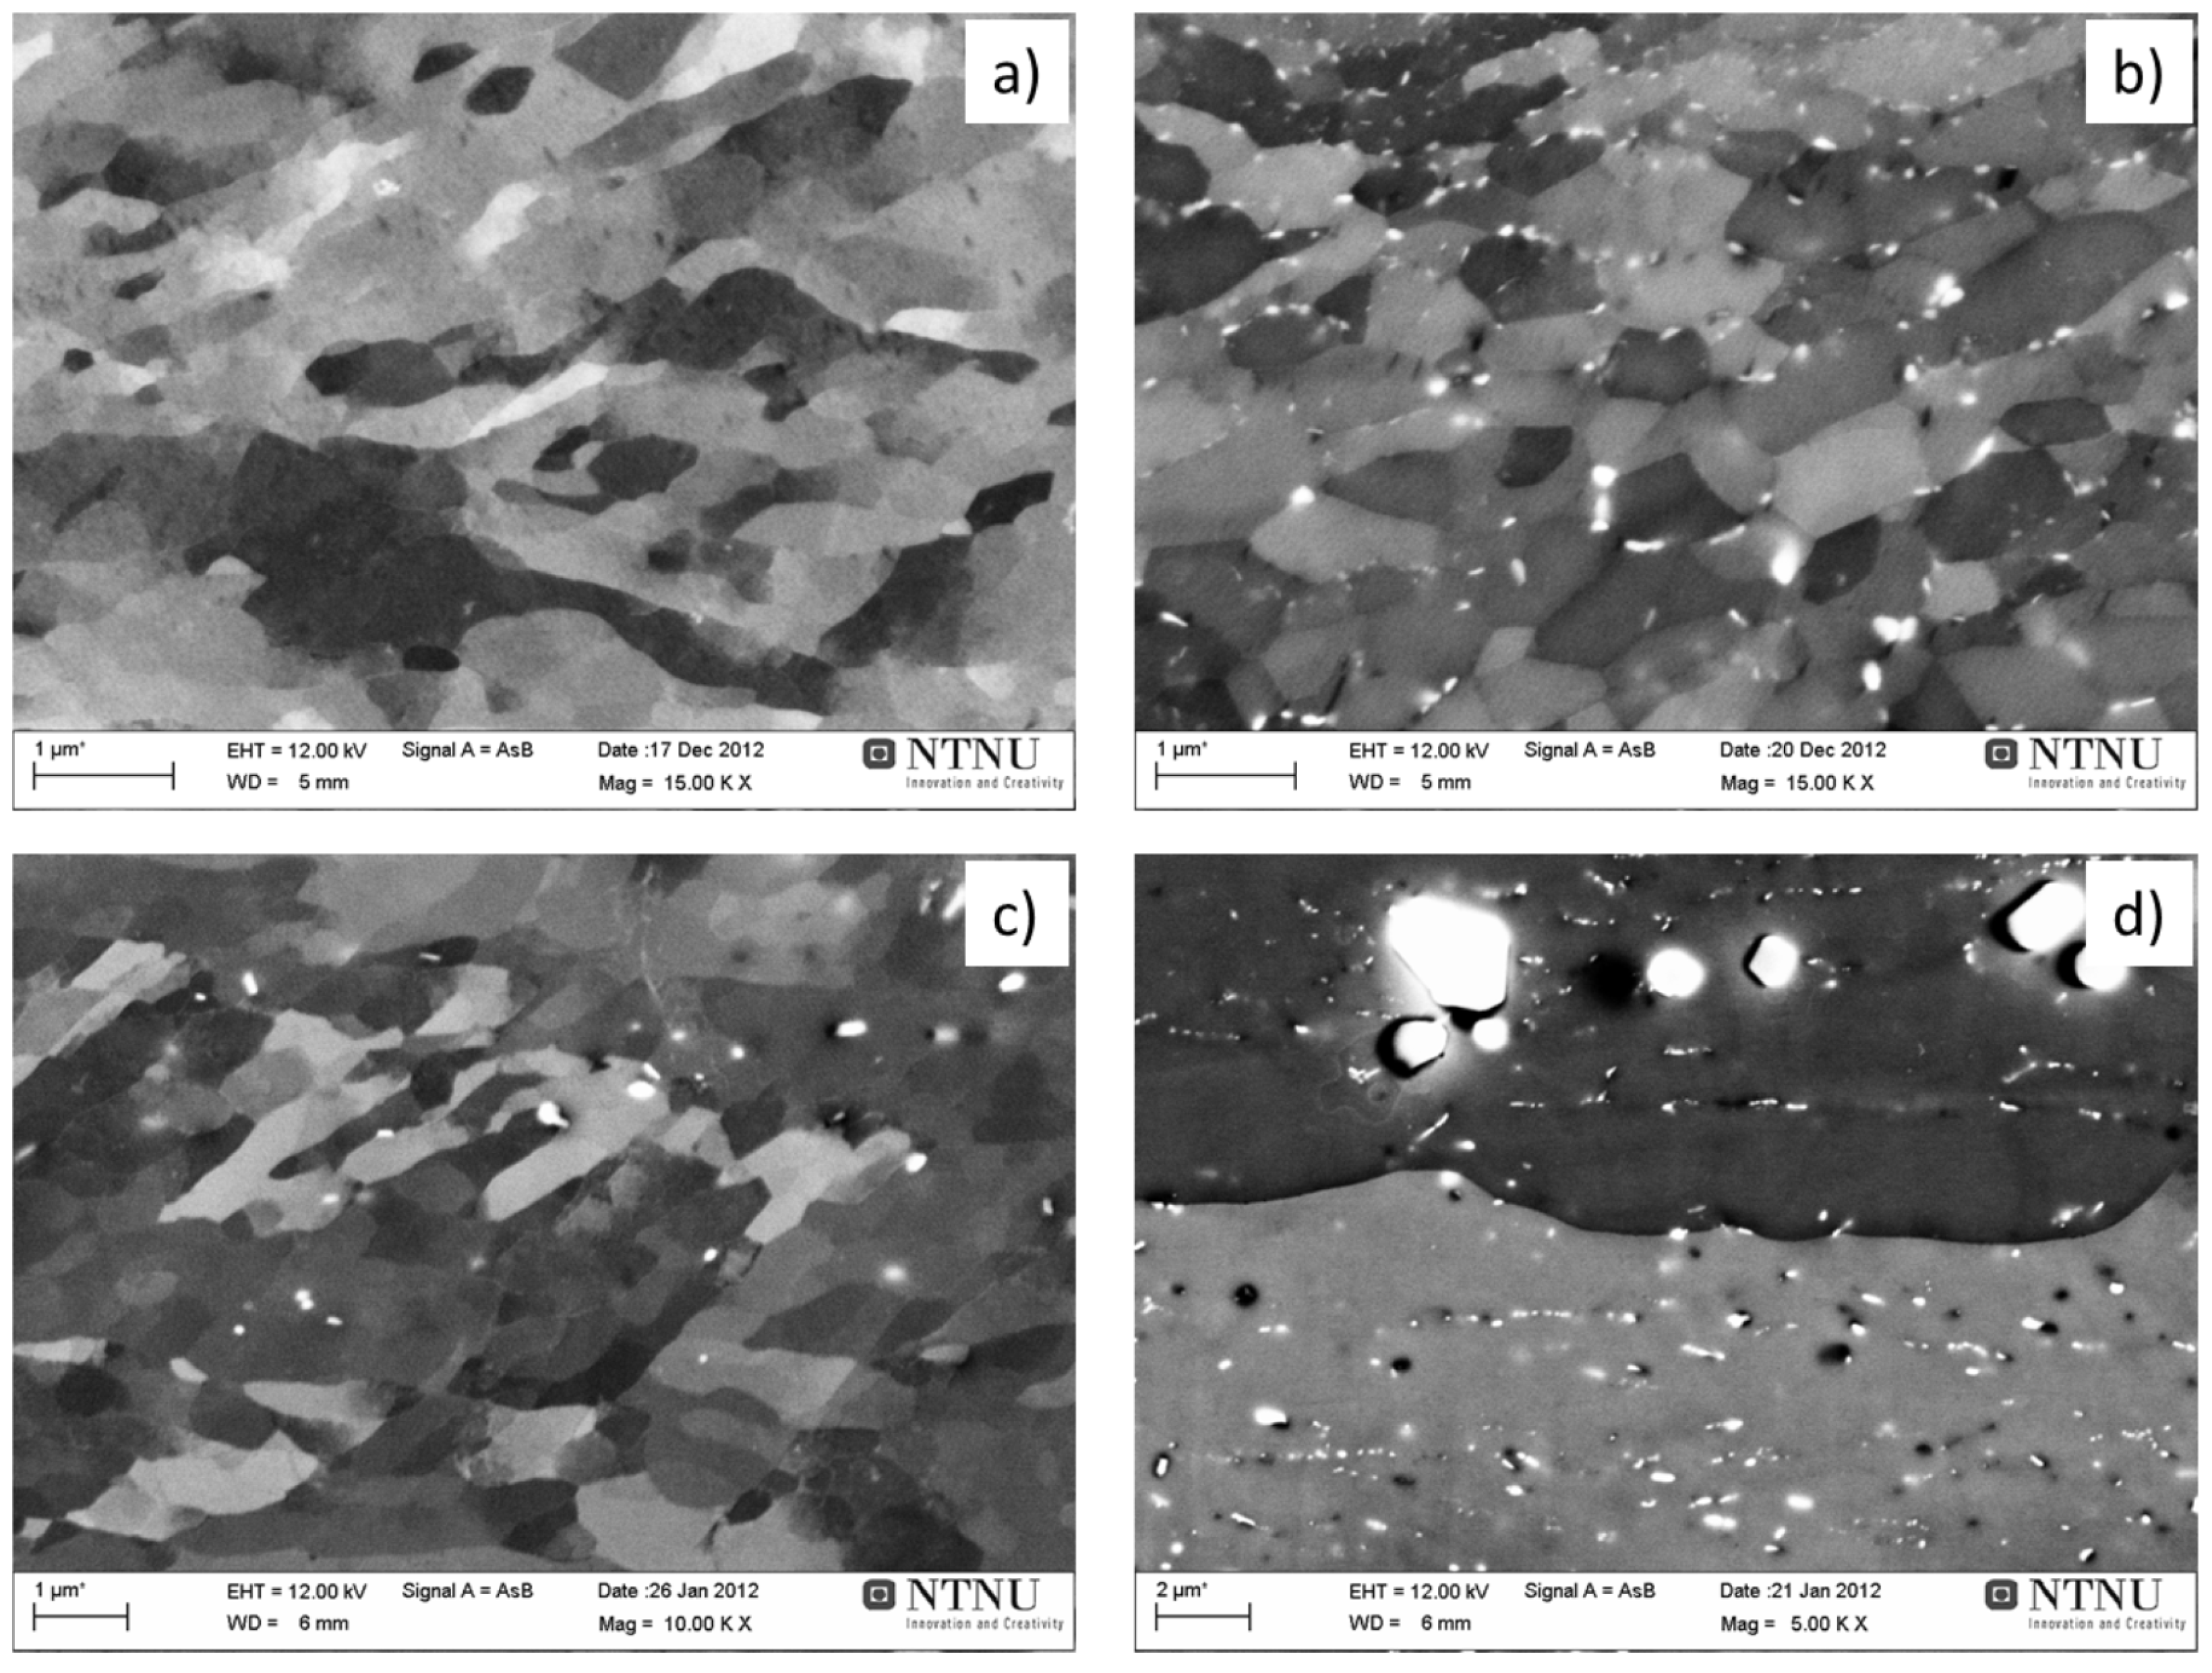
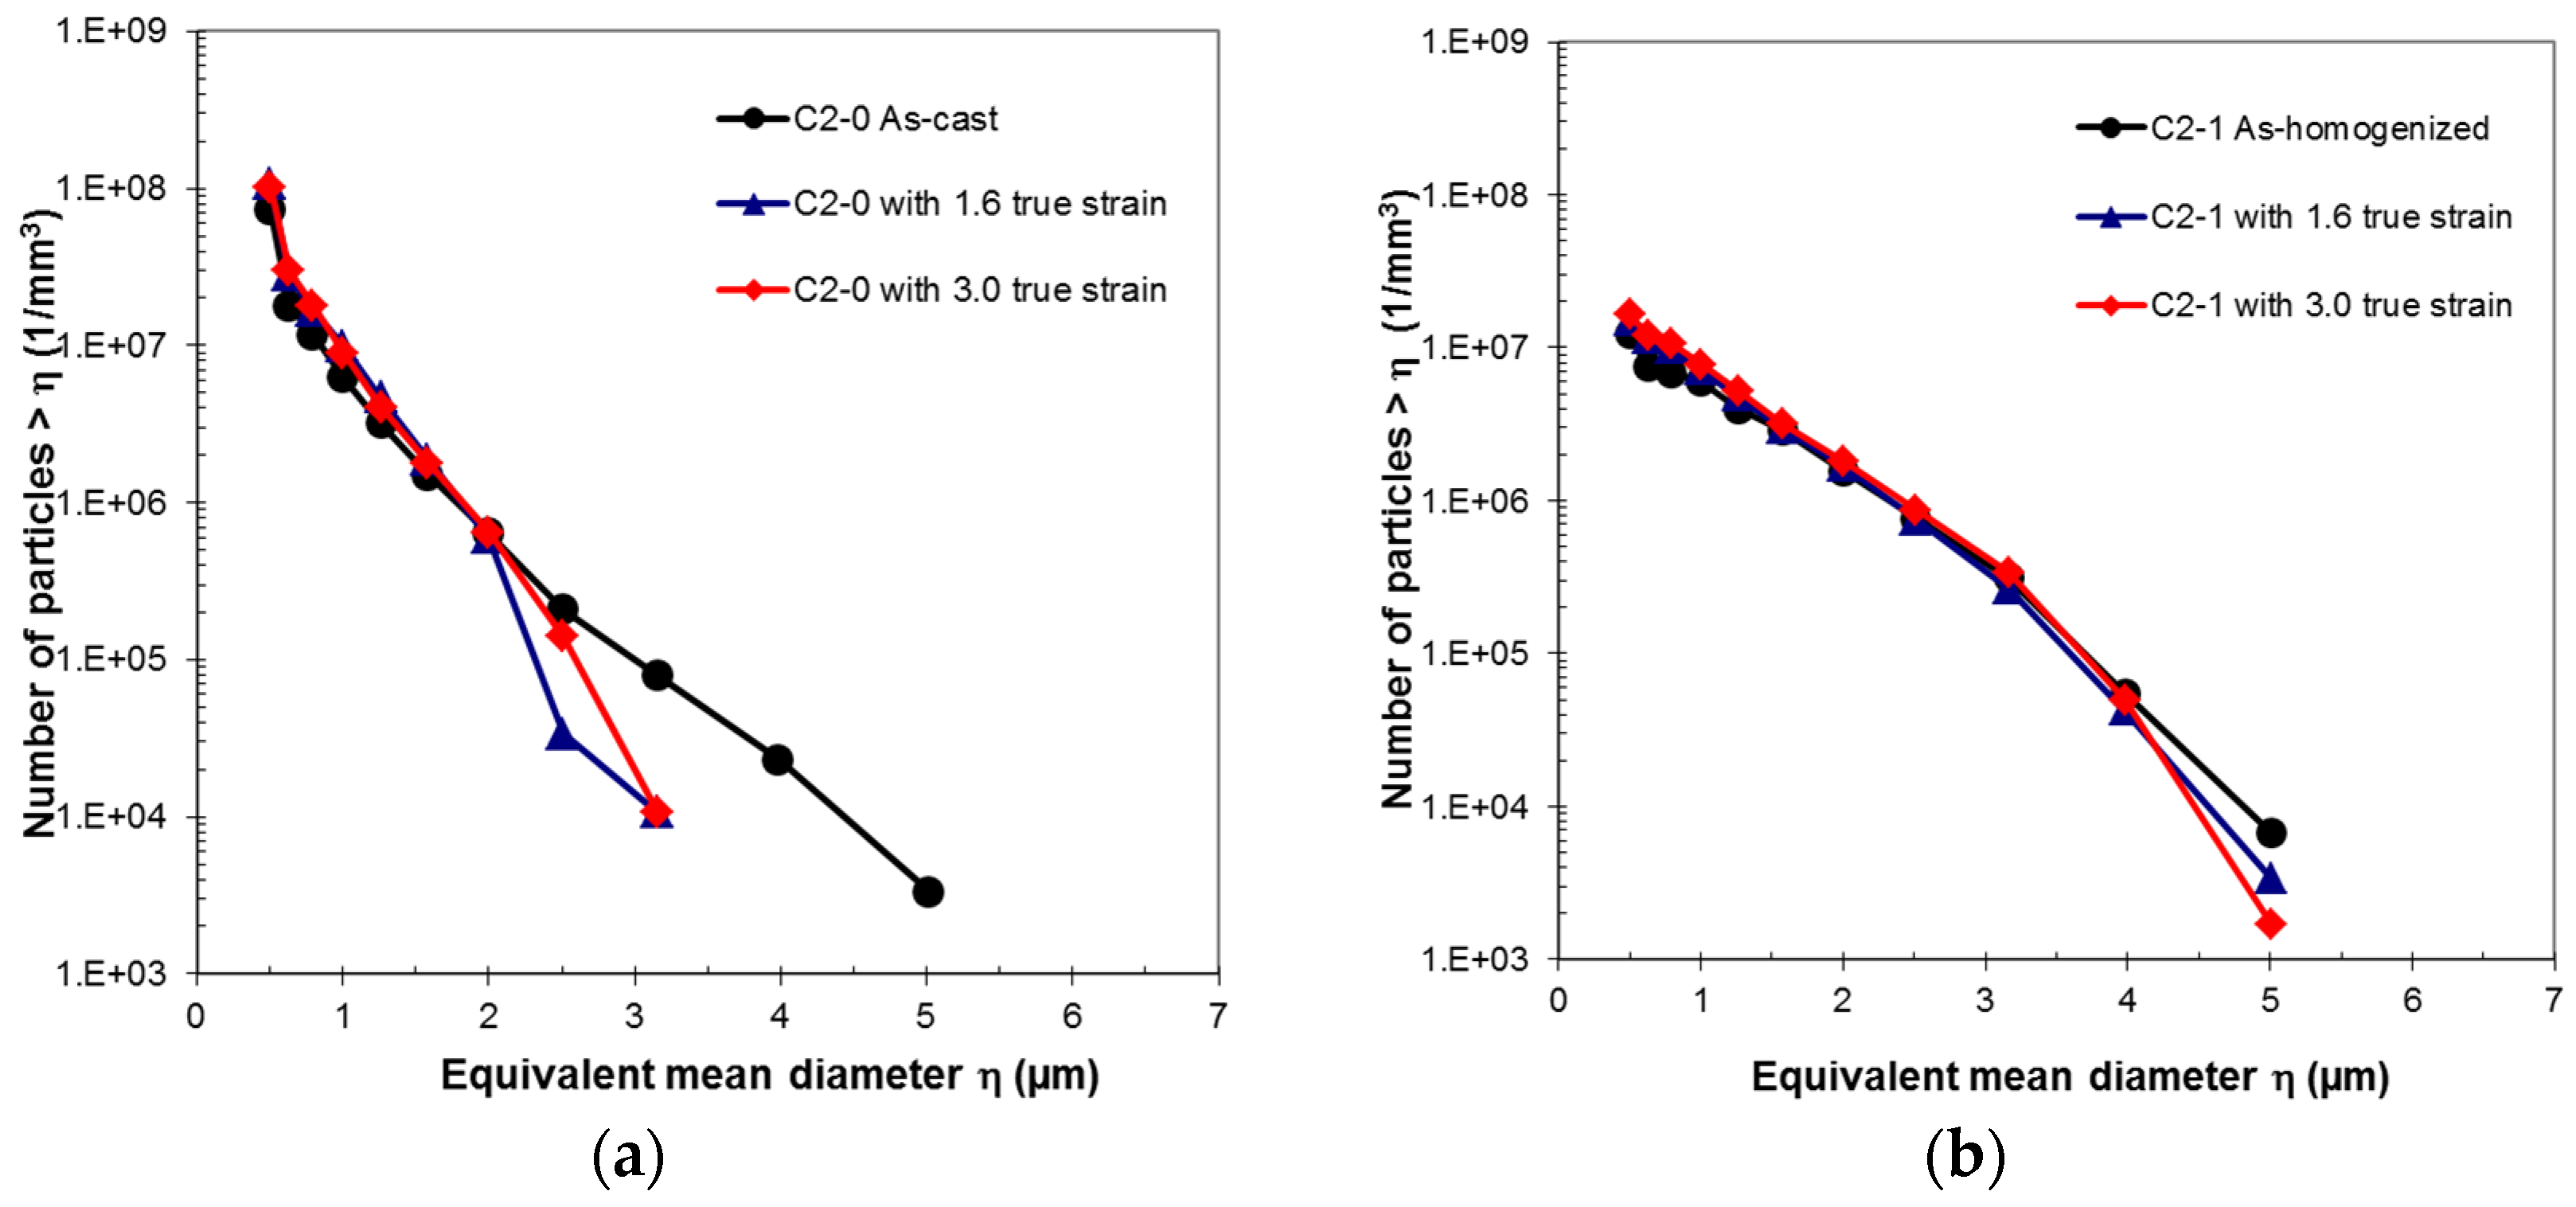
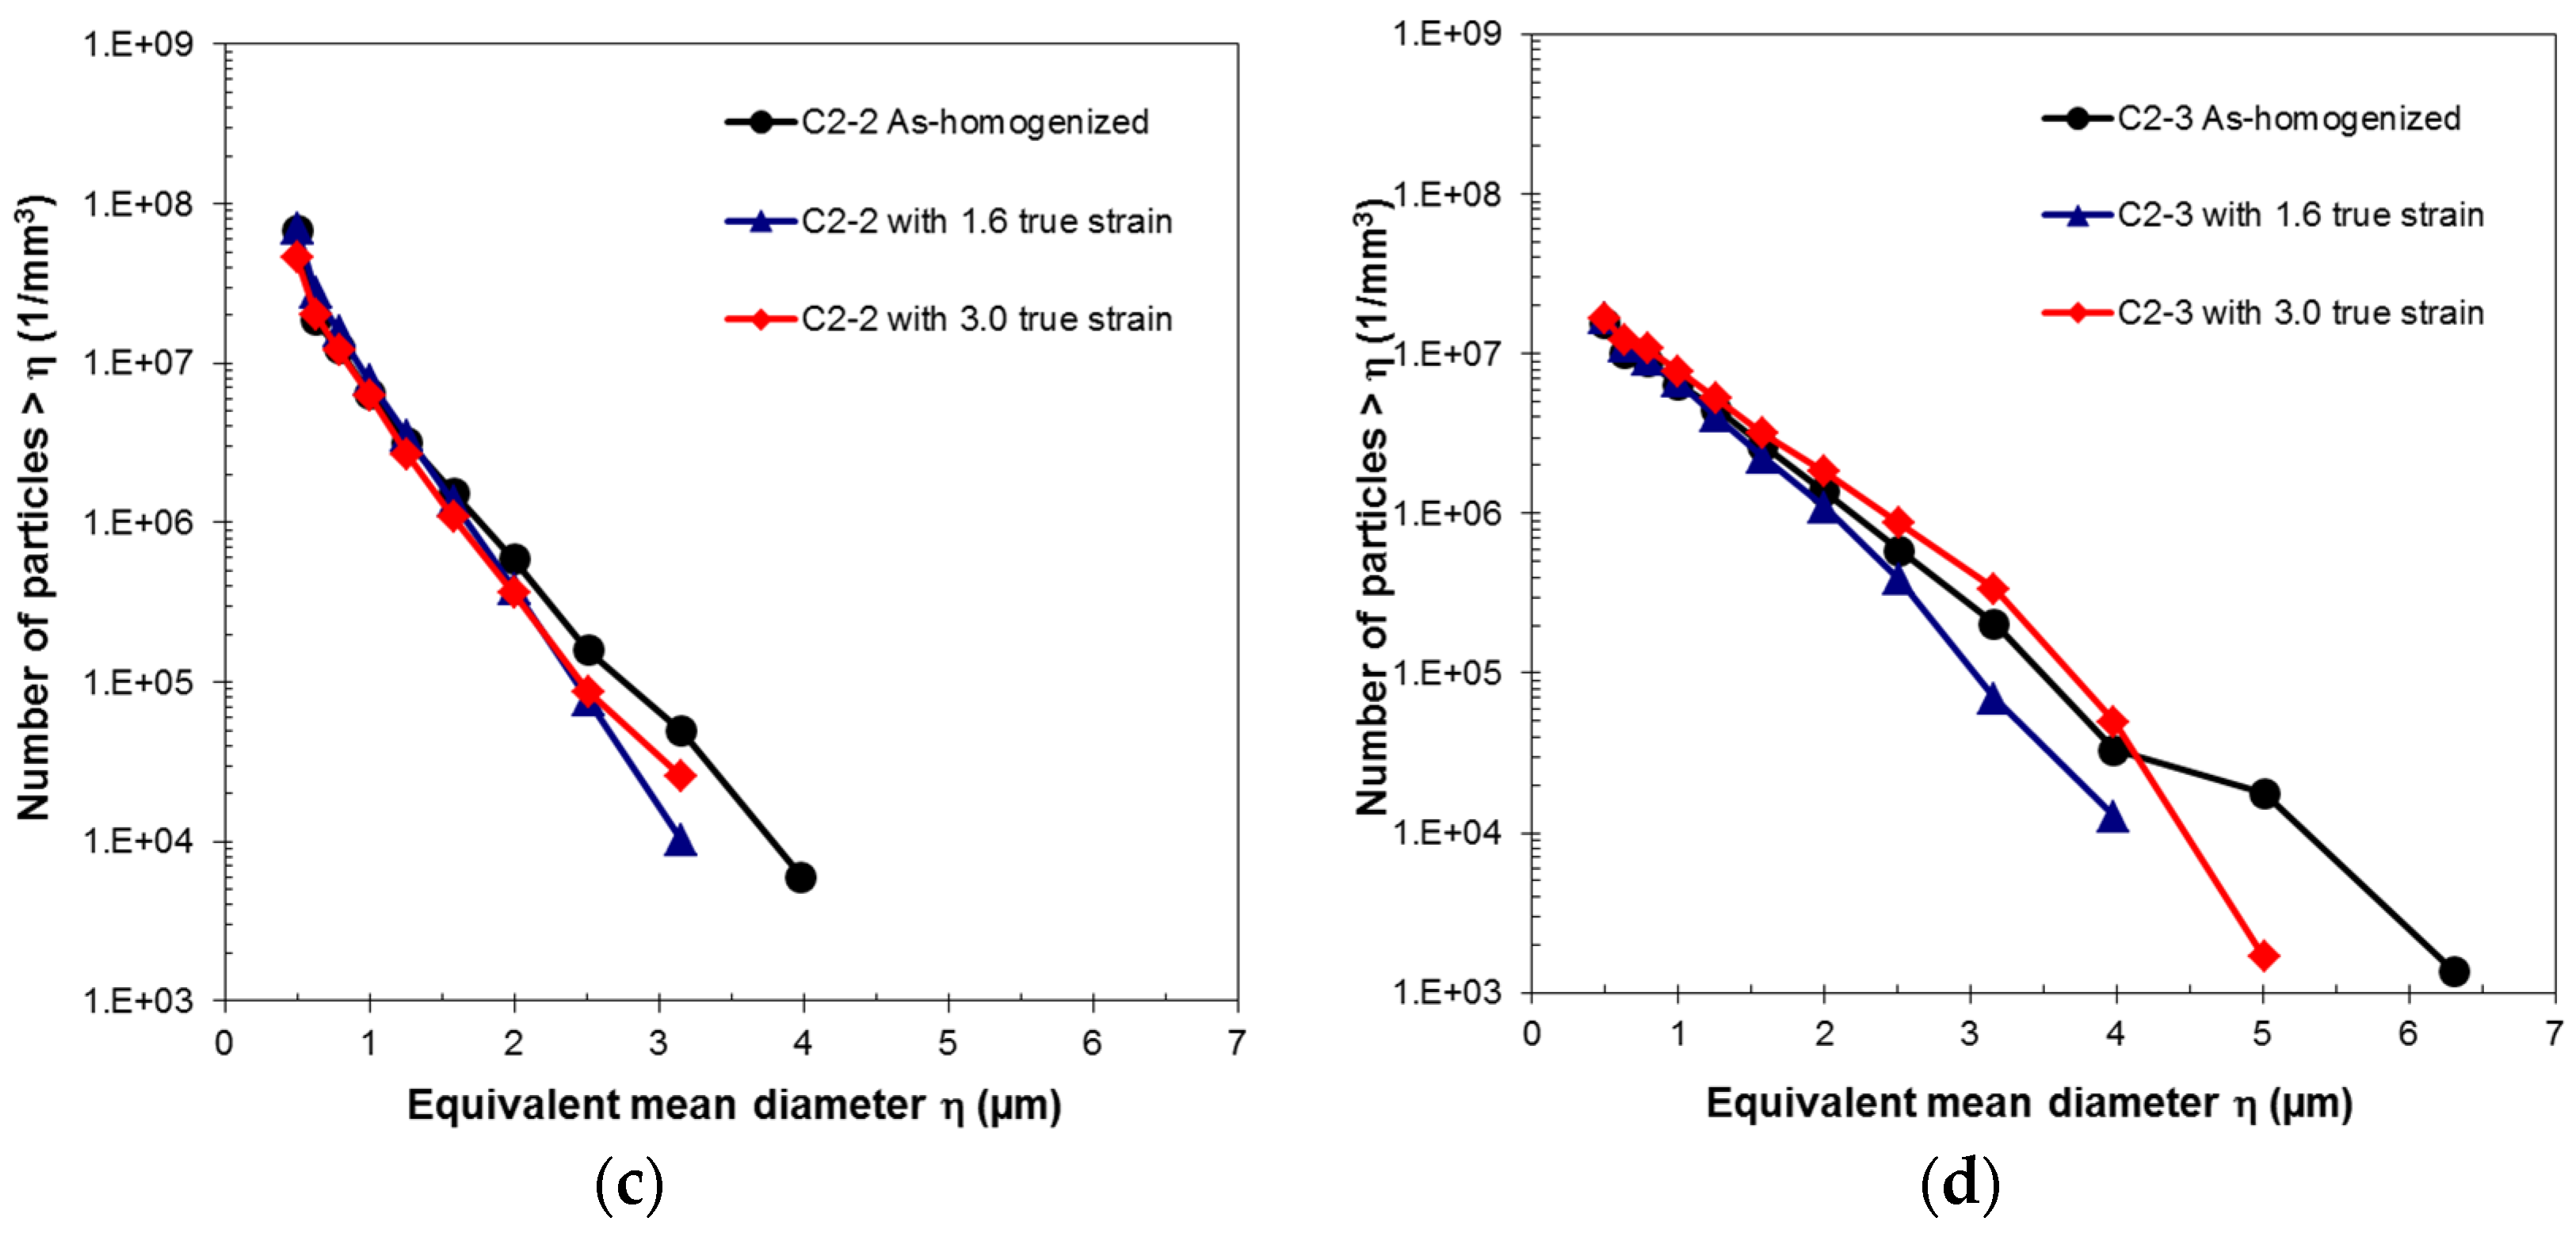
In terms of constituents both the C2-1 and C2-3 conditions contain fewer and larger particles, than the non-homogenized condition, due to coarsening during homogenization. The C2-2 material, which was homogenized at a relatively low holding temperature (450 °C), contains smaller, but considerably more particles, due to less coarsening. Moreover, in the C2-2 material the constituent particles are mainly thin plates which can break up more easily during deformation, which increases the number density and decreases the size of constituent particles during rolling. On the other side, both C2-1 and C2-3 contains more particles with sizes larger than 1 µm, which is typically a critical size for successful PSN in aluminum alloys. The microchemistry states observed here are in accordance with earlier work on the evolution of particles during homogenization of similar alloys [26,27].
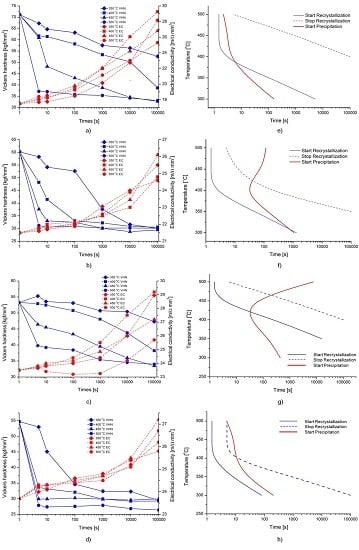
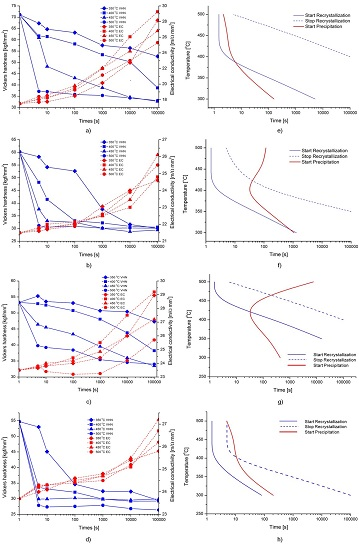
The present work has clearly confirmed that the different microchemistries following the different homogenization procedures have a profound effect on the back-annealing behavior, in line with previous findings in similar alloys (e.g., [13,18,19,
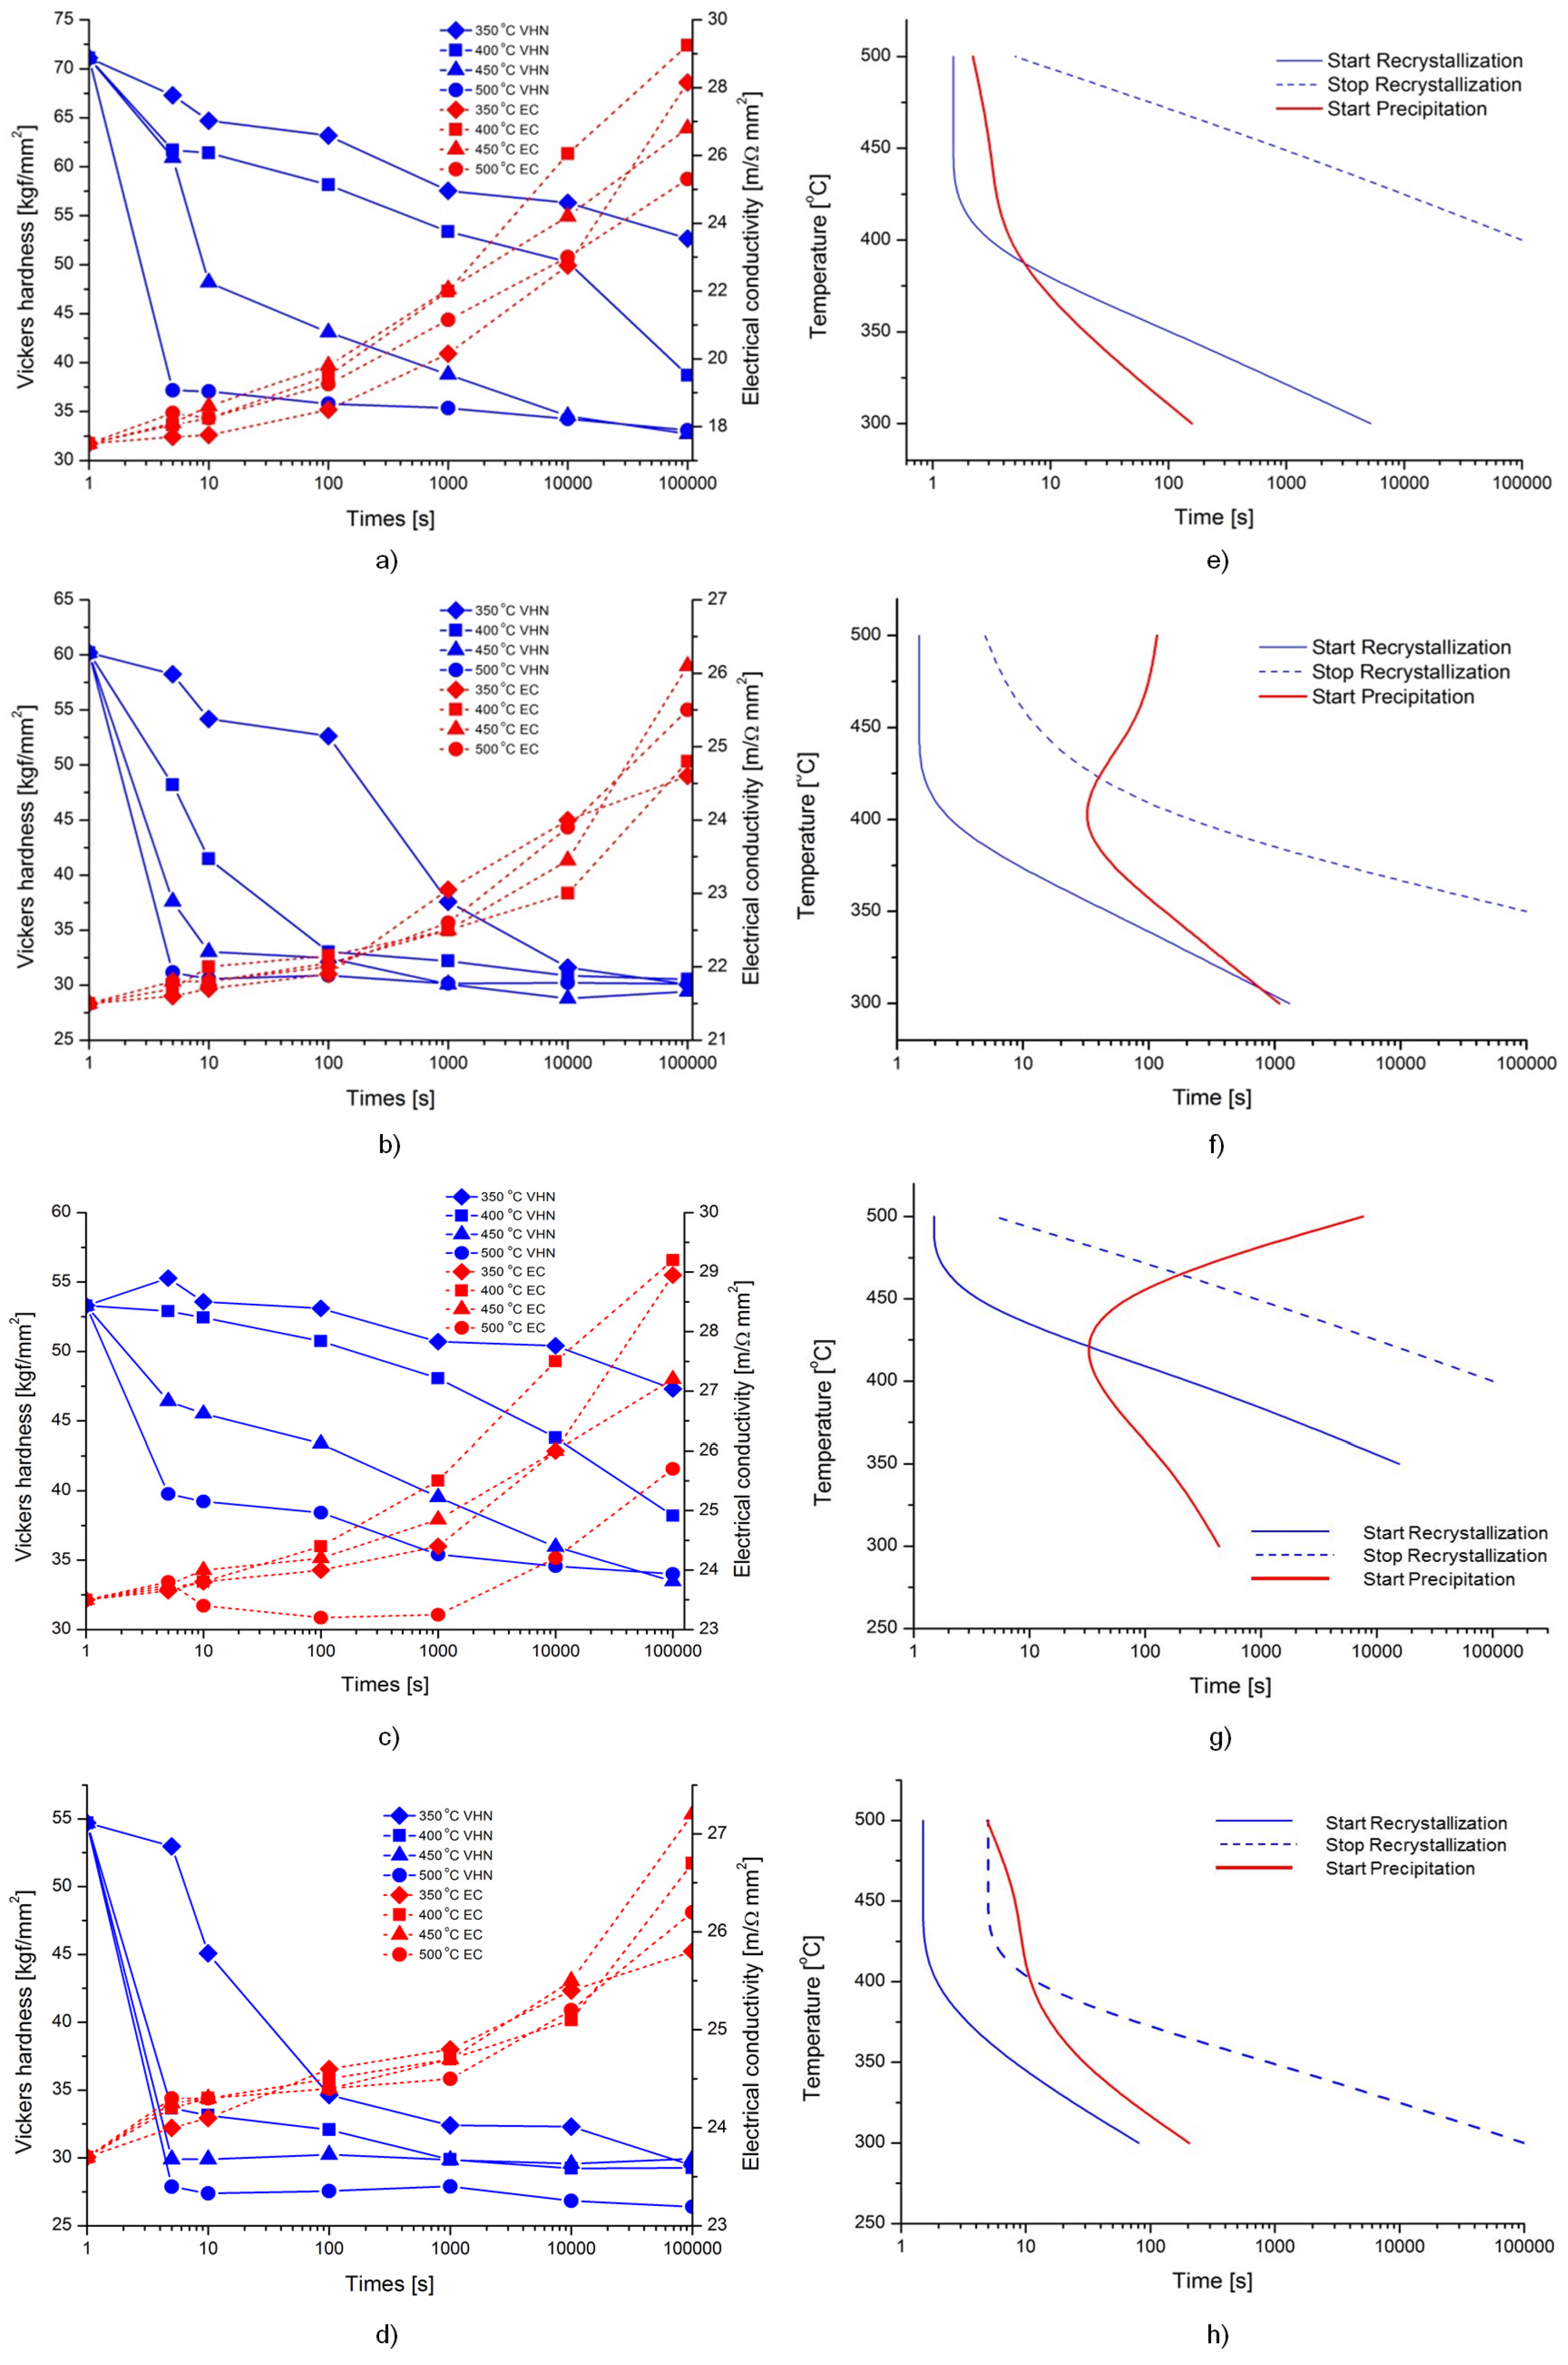
20]). Generally, conditions which are mainly unaffected by dispersoid effects give a fairly fine grained structure. This applies for conditions without dispersoids or when the dispersoids are coarse and/or with a low number density and in condition with no or limited concurrent precipitation. Faster kinetics and slightly refined grain structures are generally obtained with increased annealing temperature and a larger cold rolling strain. On the other hand, in conditions with either a considerable density of fine pre-existing dispersoids and/or significant concurrent precipitation of fine dispersoids, the influence can be quite pronounced with much slower kinetics and strongly modified, generally much coarser, grain structures. In some cases of low stored energy and/or low annealing temperatures recrystallization can be completely prevented and only extended recovery takes place. Although only indicative with respect to start and stop of precipitation and recrystallization, respectively, the respective TTT-diagrams are quite useful in discussing the interaction of these two reactions and in particular the influence of concurrent precipitation on the recrystallization behavior. Nonetheless, the present work have also shown that a high density of fine dispersoids whether pre-existing or formed during annealing (concurrent precipitation), both have a strong and comparable effect on kinetics and recrystallized microstructure, the latter in the form of large and highly elongated grains. The recrystallization textures for most of the conditions considered here have been reported elsewhere [18,19,20]. In the absence of dispersoids the texture is found to be generally weak, indicating that PSN plays a prominent role as nucleation mechanism for recrystallization in these alloys. In the presence of dispersoids, on the other, the textures become dominated by a distinct P-texture and a ND-rotated cube component [13,14,18,19,20]. The two latter are also generally associated with large particles, which indicates that PSN also plays a dominant role in these conditions.
The effect of rolling strain, increasing from ε = 1.6 to 3.0, on the softening behavior, is in general much less pronounced than the microchemistry effects. Higher strain gives a higher stored energy (and thus larger driving force) for recrystallization, consistent with slightly higher as-deformed hardness at the higher strain (compare Figure 6a–d and Figure S1). Accordingly the kinetics is consistently faster for all material conditions. In principle this should also promote nucleation of recrystallization, and then a smaller grain size, which is not obvious from the present experimental results (cf. Table 5), where even some counter-intuitive results are observed with increasing grain size with increasing strain. As mentioned above these results may be the result of different concurrent precipitation behavior and/or an artifact due to poor statistics/measurement uncertainties in the measured results. Moreover, the directional homogeneities introduced by the rolling process where characteristic length scales (between e.g., dispersoid layers and constituents (PSN sites) are shortened along ND and extended along RD with increasing strain may also play a role.
Although the shape effect discussed above cannot be completely accounted for, a rough estimate of grain size in selected cases can now be made, assuming PSN to be the dominating nucleation mechanism for recrystallization for all conditions. In doing so we make use of ideas from the ALSOFT model [29], and the available experimental data for the deformation sub-structure, constituent particles and dispersoids (cf. Table 3, Table 4 and Table 6). Following Vatne et al. [29], it is assumed that the critical step for nucleation from large constituent particles is growth out the deformation zone around these particles, i.e., the critical particle size for a successful PSN event is given by the Gibbs-Thompson equation, i.e., η* = 4γGB/Peff where γGB is the particle-matrix interfacial energy between the nucleus and the deformed aluminum matrix. Here, it is assumed that the size of the deformation zone scales with the size of the particle itself.
The quantity Peff is effective driving force for recrystallization and is given by the following expression:
P eff = P D P Z = G b 2 2 ρ i + 3 γ SB δ 3 F v γ GB 2 r
Here, PD is the driving pressure for recrystallization/stored energy in terms of sub-grain size δ (mean diameter) and the cell interior dislocation density ρi. PZ (last term in Equation (2)) is the Zener pinning pressure due to a particle volume fraction Fv of radius r [4,15], and γSB and γGB are the boundary energies for sub-grains and high angle grain boundaries, respectively. G is shear modulus and b is Burgers vector. It should be noted that the Zener-pressure expression in Equation (2) is based on the assumption of spherical equi-axed particles with a random spatial distribution. The latter assumption is generally not valid in our case, as the dispersoids tend to be located at the grain boundaries where they may more effectively pin the boundaries (a higher effective Zener drag [2,4,10,31]). However, for qualitative purposes Equation (2) may still be used.
Making use of Equation (1) for the size distribution of constituent particles, the following relationship for the number density of PSN nuclei can then be derived [29]:
N PSN = C PSN N 0 exp ( C PE 4 γ GB L P D P Z )
where N0 and L are defined from Equation (1) f, and CPSN and CPE are model constants of the order ~1. On the assumption that site-saturation nucleation kinetics applies, the recrystallized grain size then becomes:
D RX = 1 / N PSN 3
In estimating PD and PZ, respectively, according to Equation (2), we use γGB = 0.3 Jm−2 [32] and γ SB = G b θ 4 π ( 1 v ) ln ( e θ c θ ) = 0.15 Jm−2 (assuming an average misorientation angle of θ~4° and θc~15°), G = 26.5 GPa, b = 2.86 Å together with relevant data from Table 4 and Table 6 with F v = N v π 6 d 3 D 3 ; N v = N A / d 3 D , where d3D is the equivalent spherical particle diameter (3D) derived from the mean cross sectional diameter in Table 6. Moreover the equivalent circle diameter (CED) is used for the sub-grain size. Following [32], the contribution from cell interior dislocations can be ignored as it represents only a small contribution to the stored energy at the onset of recrystallization (typically 1%–2% [32]). The results are presented in Table 7, where values marked with an asterisk refer to artificially changed input parameter values to highlight how the stored energy and the Zener drag may influence the result.
Ignoring the shape effect and that some of the experimentally measured grain sizes are counter-intuitive (in view of the strain dependence), the calculated results are grossly in agreement with the experimental results (cf. Table 5). This result supports the assumption of PSN being the dominant nucleation mechanism. For the C2-3 alloy the results actually compares quite well with the experiments, although the variation with strain is not consistent with the experiments. For some conditions a better agreement, is obtained by changing either the stored energy or the Zener drag values (data marked with *). Concerning the stored energy, the results clearly indicate that for some conditions the stored energy is underestimated, i.e., the respective measured sub-grain size is too large and/or neglecting the dislocation contribution may have contributed to the underestimation in these cases. Especially for the C2-1 alloy this seems reasonable as the measured sub-grain size seems somewhat high. The indicated underestimations of the Zener drag is supported by more recent comprehensive model predictions with the ALSOFT model [33]. Both for the C2-0 alloy after a strain of ε = 3, and the C2-2 material, the grain sizes obtained with nominal input for the Zener drag, is much too low, indicating that the actual Zener drag effect on nucleation (determining the grain size), as estimated from the classical Zener expression, Equation (3), is much too low. In fact, increasing the nominal Zener drag with a factor of 2, gives results which are more in line with the experiments. It should also be noted that the actual Zener drag also increases during annealing, due to (additional) concurrent precipitation (cf. Table 6; [18]). With a long incubation for onset of recrystallization (possible slow time-dependent nucleation), and possibly also boundary-dispersoid correlations the increased Zener drag may actually be closer to reality, also during nucleation, than the lower nominal one.

5. Conclusions

Four different material conditions, following different homogenization procedures including the as-cast non-homogenized condition of an AlMnFeSi model alloy (close to a commercial AA3103 in composition) giving quite different initial microchemistries in terms of content of Mn in solid solution (potential for concurrent precipitation during subsequent processing), size and number density of constituent particles as well as dispersoids have been investigated during subsequent cold rolling and back-annealing.
It is shown that the softening behavior upon annealing after cold rolling is strongly influenced by the initial microchemistry. In particular, the amount of Mn in solid solution (potential for concurrent precipitation) and/or the density of fine pre-existing dispersoids are important factors, where the actual effect is strongly dependent on temperature and to a much less extent on the deformation strain. Both a well homogenized material (reduced Mn solid solution level) and high annealing temperatures reduces the influence of dispersoids giving relatively fast softening kinetics at adequate temperatures (even faster the higher the annealing temperature is) and the formation of a homogeneous fine grained structure. An increased rolling strain has generally the same effect, but much less pronounced. On the other hand, conditions strongly influenced by pre-existing dispersoids and/or concurrent precipitation, in the form of a high density of small dispersoids, have a significant influence on the softening behavior in general and the recrystallization behavior in particular. Such dispersoid structures strongly suppress nucleation and/or retard recrystallization (through a dynamic Zener pinning pressure) resulting in a sluggish recrystallization reaction and an inhomogeneous grain structure of coarse elongated grains. The recrystallization behavior also depends on the microchemistry state in view of size and number density of primary constituents particles. A large fraction of relatively large constituents (>1 μm) promote recrystallization by PSN, which generally speeds up the kinetics and gives smaller recrystallized grains.
Rough grain size estimates based on the assumption that PSN is the main nucleation mechanism for recrystallization with appropriate experimental input values for the stored energy and the Zener drag are qualitatively comparable with experimental results. However, the calculations also indicate that for some conditions the stored energy/driving force for recrystallization is underestimated while the actual Zener drag effect on nucleation seems underestimated by the classical Zener drag expression.

Supplementary Files

Supplementary File 1

Acknowledgments

This research work has been supported by a KMB project (project number: 193179/I40), in Norway. The financial support by the Research Council of Norway and the industrial partners, Hydro Aluminium and Sapa Technology is gratefully acknowledged. Qinglong Zhao is gratefully acknowledged for providing some of the sub-grain size data in Table 5.

Author Contributions

Ning Wang performed all the experimental work and drafted the paper. Ke Huang contributed to analyses and discussions of the results and to writing of the paper. Yanjun Li and Knut Marthinsen conceived and designed the experimental program, contributed to analyses and discussions of the results and to writing of the paper.

Conflicts of Interest

The authors declare no conflict of interest.

References

  1. Hutchinson, W.B.; Oscarsson, A.; Karlsson, A. Control of microstructure and earing behavior in aluminum-alloy AA3004 hot bands. Mater. Sci. Technol. 1989, 5, 1118–1127. [Google Scholar] [CrossRef]
  2. Daaland, O.; Nes, E. Recrystallization texture development in commercial Al-Mn-Mg alloys. Acta Mater. 1996, 44, 1413–1435. [Google Scholar] [CrossRef]
  3. Engler, O.; Yang, P.; Kong, X.W. On the formation of recrystallization textures in binary Al-1.3% Mn investigated by means of local texture analysis. Acta Mater. 1996, 44, 3349–3369. [Google Scholar] [CrossRef]
  4. Humphreys, F.J.; Hatherly, M. Recrystallization and Related Annealing Phenomena; Elsevier: Oxford, UK, 2004. [Google Scholar]
  5. Humphreys, F.J. Nucleation of recrystallization at 2nd phase particles in deformed aluminum. Acta Metall. 1977, 25, 1323–1344. [Google Scholar] [CrossRef]
  6. Humphreys, F.J. Local lattice rotations at 2nd phase particles in deformed metals. Acta Metall. 1979, 27, 1801–1814. [Google Scholar] [CrossRef]
  7. Engler, O.; Kong, X.W.; Lucke, K. Recrystallisation textures of particle-containing Al-Cu and Al-Mn single crystals. Acta Mater. 2001, 49, 1701–1715. [Google Scholar] [CrossRef]
  8. Nes, E.; Embury, J.D. Influence of a fine particle dispersion on recrystallization behavior of a 2 phase aluminum-alloy. Z. Metallkunde 1975, 66, 589–593. [Google Scholar]
  9. Nes, E. Effect of a fine particle dispersion on heterogeneous recrystallization. Acta Metall. 1976, 24, 391–398. [Google Scholar] [CrossRef]
  10. Vatne, H.E.; Engler, O.; Nes, E. Influence of particles on recrystallisation textures and microstructures of aluminium alloy 3103. Mater. Sci. Technol. 1997, 13, 93–102. [Google Scholar] [CrossRef]
  11. Ryu, J.H.; Lee, D.N. The effect of precipitation on the evolution of recrystallization texture in AA8011 aluminum alloy sheet. Mater. Sci. Eng. A Struct. Mater. Prop. Microstruct. Process. 2002, 336, 225–232. [Google Scholar] [CrossRef]
  12. Tangen, S.; Sjolstad, K.; Nes, E.; Furu, T.; Marthinsen, K. The effect of precipitation on the recrystallization behavior of a supersaturated, cold rolled AA3103 aluminium alloy. Mater. Sci. Forum 2002, 396–402, 469–474. [Google Scholar] [CrossRef]
  13. Tangen, S.; Sjolstad, K.; Furu, T.; Nes, E. Effect of concurrent precipitation on recrystallization and evolution of the p-texture component in a commercial Al-Mn alloy. Metall. Mater. Trans. A Phys. Metall. Mater. Sci. 2010, 41A, 2970–2983. [Google Scholar] [CrossRef]
  14. Schafer, C.; Gottstein, G. The origin and development of the P{011}<111> orientation during recrystallization of particle-containing alloys. Int. J. Mater. Res. 2011, 102, 1106–1114. [Google Scholar] [CrossRef]
  15. Nes, E.; Ryum, N.; Hunderi, O. On the zener drag. Acta Metall. 1985, 33, 11–22. [Google Scholar] [CrossRef]
  16. Shankar, M.R.; King, A.H.; Compton, W.D. Microstructure and stability of nanocrystalline aluminum 6061 created by large strain machining. Acta Mater. 2005, 53, 4781–4793. [Google Scholar] [CrossRef]
  17. Bacca, M.; Hayhurst, D.R.; McMeeking, R.M. Continuous dynamic recrystallization during severe plastic deformation. Mech. Mater. 2015, 90, 148–156. [Google Scholar] [CrossRef]
  18. Huang, K.; Wang, N.; Li, Y.J.; Marthinsen, K. The influence of microchemistry on the softening behaviour of two cold-rolled Al-Mn-Fe-Si alloys. Mater. Sci. Eng. A Struct. Mater. Prop. Microstruct. Process. 2014, 601, 86–96. [Google Scholar] [CrossRef]
  19. Huang, K.; Zhao, Q.L.; Li, Y.J.; Marthinsen, K. Two-stage annealing of a cold-rolled Al-Mn-Fe-Si alloy with different microchemistry states. J. Mater. Process. Technol. 2015, 221, 87–99. [Google Scholar] [CrossRef]
  20. Huang, K.; Engler, O.; Li, Y.J.; Marthinsen, K. Evolution in microstructure and properties during non-isothermal annealing of a cold-rolled Al-Mn-Fe-Si alloy with different microchemistry states. Mater. Sci. Eng. A Struct. Mater. Prop. Microstruct. Process. 2015, 628, 216–229. [Google Scholar] [CrossRef]
  21. Furu, T.; Orsund, R.; Nes, E. Subgrain growth in heavily deformed aluminum-experimental investigation and modeling treatment. Acta Metall. Mater. 1995, 43, 2209–2232. [Google Scholar] [CrossRef]
  22. DeHoff, R.T.; Rhines, F.N. Quantitative Microscopy; McGraw-Hill: New York, NY, USA, 1968. [Google Scholar]
  23. Ekstrøm, H.-E.; Østensen, L.; Hagstrøm, J. Dispersoids and Constituent Distribution in 2.2 mm Thick Hot Rolled Bands of AA3104; BE96–3364; Gränges Technology AB: Finspång, Sweden, 1998. [Google Scholar]
  24. Ekstrom, H.E.; Hagstrom, J.; Ostensson, L. Particle size distributions in a DC-cast and rolled AA3104 alloy. Mater. Sci. Forum 2000, 331–337, 179–184. [Google Scholar] [CrossRef]
  25. Engler, O.; Laptyeva, G.; Wang, N. Impact of homogenization on microchemistry and recrystallization of the Al-Fe-Mn alloy AA 8006. Mater. Charact. 2013, 79, 60–75. [Google Scholar] [CrossRef]
  26. Li, Y.J.; Arnberg, L. Quantitative study on the precipitation behavior of dispersoids in DC-cast AA3003 alloy during heating and homogenization. Acta Mater. 2003, 51, 3415–3428. [Google Scholar] [CrossRef]
  27. Li, Y.J.; Arnberg, L. Evolution of eutectic intermetallic particles in DC-cast AA3003 alloy during heating and homogenization. Mater. Sci. Eng. A Struct. Mater. Prop. Microstruct. Process. 2003, 347, 130–135. [Google Scholar] [CrossRef]
  28. Altenpohl, D. Aluminium und Aluminiumlegierungen; Springer-Verlag: Berlin, Germany, 1965. [Google Scholar]
  29. Vatne, H.E.; Furu, T.; Orsund, R.; Nes, E. Modelling recrystallization after hot deformation of aluminium. Acta Mater. 1996, 44, 4463–4473. [Google Scholar] [CrossRef]
  30. Wang, N.; Flatoy, J.E.; Li, Y.J.; Marthinsen, K. Evolution in microchemistry and its effects on deformation and annealing behavior of an AlMnFeSi alloy. In Proceedings of the 13th International Conference on Aluminum Alloys (ICAA13), Pittsburgh, PA, USA, 3–7 June 2012; pp. 1837–1842.
  31. Somerday, M.; Humphreys, F.J. Recrystallisation behaviour of supersaturated Al-Mn alloys—Part 1—Al-1.3 wt. %-Mn. Mater. Sci. Technol. 2003, 19, 20–29. [Google Scholar] [CrossRef]
  32. Benum, S.; Nes, E. Effect of precipitation on the evolution of cube recrystallisation texture. Acta Mater. 1997, 45, 4593–4602. [Google Scholar] [CrossRef]
  33. Marthinsen, K.; Wang, N.; Huang, K. Modelling microstructure and properties during annealing of coldrolled Al-Mn-Fe-Si-alloys with different microchemistries. Mater. Sci. Forum 2014, 783–786, 57–62. [Google Scholar] [CrossRef]
Figure 1. Back scatter electron scanning electron microscopy (SEM) images of constituent particles after the different homogenization procedures: (a) C2-0 (non-homogenized); (b) C2-1; (c) C2-2; and (d) C2-3.
Metals 06 00061 g001
Figure 2. Back scatter electron SEM images of dispersoids after homogenization: (a) C2-2; and (b) C2-3.
Metals 06 00061 g002
Figure 3. Distribution of mean diameter of precipitated particles after homogenization in the C2-2 and C2-3 materials.
Metals 06 00061 g003
Figure 4. Back scatter electron SEM images of constituent particles after cold rolling strain of ε = 1.6: (a) C2-0; (b) C2-1; (c) C2-2; and (d) C2-3. RD-ND (vertical) section.
Metals 06 00061 g004
Figure 5. 3D cumulative size distribution of constituent particles for the different material conditions before and after rolling to strains of ε = 1.6 and 3.0: (a) C2-0; (b) C2-1; (c) C2-2; and (d) C2-3.
Metals 06 00061 g005aMetals 06 00061 g005b
Figure 6. (a) Vickers hardness and electrical conductivity (EC) for the different materials material with the true strain of ε = 1.6 during isothermal back annealing at 350 °C, 400 °C, 450 °C and 500 °C for different times (ad) and TTT-diagrams (eg) for: C2-0 (a,e); C2-1 (b *,f); C2-2 (c *,g); and C2-3 (d,h). * [30] Copyright 2012 by The Minerals, Metals and Materials Society, reprinted with permission.
Metals 06 00061 g006
Figure 7. SEM-BSE images exemplifying of the microstructure and dispersoid structure evolution during different annealing times at 350 °C for the C2-0 and C2-1 materials, respectively, after strain of ε = 1.6: (a) C2-0, annealing of 5 s; (b) C2-0, annealing of 104 s; (c) C2-1, annealing of 5 s; and (d) * C2-1, annealing of 104 s. * [30] Copyright 2012 by The Minerals, Metals and Materials Society, reprinted with permission.
Metals 06 00061 g007
Table 1. Four homogenization procedures and resulting different concentration levels of Mn in solid solution.
SampleMnss (wt. %)Dispersoids DensityHomogenization Procedure
C2-00.69-As-cast condition
C2-10.35Low50 °C/h up to 600 °C + 24 h@600 °C + quenching
C2-20.23High50°C/h up to 450 °C + 4 h@450 °C + quenching
C2-30.21Medium50 °C/h up to 600 °C + 4 h@600 °C + 25 °C/h down to 500 °C + 4 h@500 °C + quenching
Table 2. The number density and mean diameter of dispersoids in materials in the as-homogenized conditions.
SampleNumber Density (mm−2)Mean Diameter (nm)
C2-10.17 × 106170
C2-22.8 × 106105
C2-30.9 × 106156
Table 3. The values of the constituent size distribution parameters, N0 and L, for the different material conditions (cf. Figure 5).
MaterialsTrue Strain εN0L (μm−1)
C2-00 (as-cast)1.13 × 1082.54
1.63.24 × 1083.37
3.02.67 × 1083.14
C2-10 (as-homogenized)2.91 × 1071.57
1.64.55 × 1071.78
3.05.64 × 1071.87
C2-20 (as-homogenized)9.72 × 1072.48
1.62.21 × 1083.19
3.01.12 × 1082.78
C2-30 (as-homogenized)3.10 × 1071.58
1.64.97 × 1072.04
3.05.00 × 1072.02
Table 4. Sub-grain sizes measured from SEM-BSE micrographs, in terms of length and width, for the different material variants after strains of ε = 1.6 and 3.0.
MaterialsTrue Strain εδlength (μm)δwidth (μm)
C2-01.60.920.46
3.00.580.24
C2-11.61.370.59
3.00.980.32
C2-21.60.850.31
3.00.670.25
C2-31.60.920.42
3.00.720.39
Table 5. Recrystallized grain sizes of the different material conditions cold rolled to strains of ε = 1.6 and 3.0, respectively, after annealing at different temperatures for 105 s.
AlloysTrue Strain εRecrystallized Grain Size in RD × ND Direction (µm)
350 °C400 °C450 °C500 °C
C2-01.6--132 × 3337 × 18
3.0-285 × 3781 × 2152 × 19
C2-11.640 × 2019 × 1622 × 1721 × 16
3.086 × 2527 × 1518 × 1521 × 16
C2-21.6-119 × 36114 × 4086 × 29
3.0-182 × 30156 × 30109 × 29
C2-31.627 × 1825 × 1629 × 1926 × 19
3.026 × 1621 × 1327 × 1721 × 17
Table 6. Dispersoid number density and mean diameter as a function of annealing time measured for the different alloy conditions at selected annealing temperatures in the range 350 °C to 450 °C after cold rolling to strain of ε = 1.6.
MaterialBack Annealing Time (s)
0510102103104105
Number Density × 104 (mm−2)
C2-0 (350 °C)--591855978091247
C2-0 (450 °C)-171208189421577688
C2-1 (350 °C)26293037758264
C2-2 (400 °C)177181206216302287178
C2-3 (350 °C)73757276747855
Mean Diameter, d [nm]
C2-0 (350 °C)--3834375456
C2-0 (450 °C)-394134575561
C2-1 (350 °C)145164168171142154177
C2-2 (400 °C)909894106108114148
C2-3 (350 °C)125128147139128137151
Table 7. Estimated values for initial (t = 0) stored energy, PD, and Zener drag, PZ, for C2-2 and C2-3 and resulting calculated grain sizes (assuming PSN only; see text below) for annealing at 400 °C and 350 °C, for 105 s, respectively, after different strains (based on Equations (3) and (4)).
AlloysTrue Strain εδCED (μm)PD (MPa)PZ (MPa)Calculated Recrystallized Grain Size (µm)
350 °C400 °C450 °C
C2-01.60.530.15176
1.60.60 *0.1576
3.00.920.1520
3.00.920.3 *30 *
C2-11.60.380.0355
1.60.5 *0.0330 *
3.00.570.0324
3.00.65 *0.0330 *
C2-21.60.580.640.1254
1.60.25 *148
3.00.460.810.1225
3.00.25 *38
C2-31.60.600.620.06716
1.6
3.00.470.800.06727
3.0
* Conditions, for which the stored energy (PD) or the Zener drag (PZ)values is artificially changed as compared to the experimentally based estimates.

