Article

Formation and Dissolution of γ’ Precipitates in IN792 Superalloy at Elevated Temperatures

1
Nuclear Physics Institute ASCR, CZ-25068 Řež near Prague, Czech Republic
2
Institute of Physics of Materials of the ASCR, CZ-61662 Brno, Czech Republic
3
CEITEC Institute of Physics of Materials of the ASCR, CZ-61662 Brno, Czech Republic
4
Laboratory for Neutron Scattering, PSI, CH-5232 Villigen, Switzerland
5
Department of Physics of Materials, Faculty of Mathematics and Physics, Charles University, Ke Karlovu 5, 121 16, Prague 2, Czech Republic
*
Author to whom correspondence should be addressed.
These authors contributed equally to this work.
Present address: TESCAN, a.s., CZ-62300 Brno, Czech Republic.
Metals 2016, 6(2), 37; https://doi.org/10.3390/met6020037
Submission received: 4 December 2015 / Revised: 22 January 2016 / Accepted: 1 February 2016 / Published: 17 February 2016
(This article belongs to the Special Issue Superalloys)

Abstract

:
Precipitation of γ’ phase in nickel-base superalloy IN792-5A was studied using in-situ Small Angle Neutron Scattering (SANS). It was found that additional precipitates are formed after reheating above 600 °C when the material is previously fast cooled (100 K/min) from 900 °C. The size distribution and volume fraction of the additional γ’ precipitates as well as of the already present medium-size precipitates in dependence on temperature were evaluated. The small precipitates can influence mechanical properties of the alloy, which exhibits an anomaly in the temperature dependence of the yield stress. Volume fraction of all precipitate populations above 900 °C was estimated as well.

Graphical Abstract

1. Introduction

Excellent strength of Ni-base superalloys comes from their microstructure composed of strengthening γ’-precipitates (L12 lattice) coherently embedded in γ solid solution (fcc) matrix [1,2]. Morphology of γ’ precipitates after standard heat treatment is spherical or cuboidal, depending on the lattice misfit, with dimensions in the range 1000–7000 Å [3].
Precipitate microstructure was examined in the past in IN738LC alloy both ex situ and in situ at elevated temperatures [4] using Small-Angle Neutron Scattering (SANS) technique [5]. It was found that additional precipitates in the channels between the large primary ones are formed either during slow cooling from high temperature or after reheating above 570 °C [4]. The new precipitates presumably affect mechanical properties as such small (tertiary) precipitates very significantly contribute to strengthening in polycrystalline superalloys [6,7].
Neutron diffraction offers a unique tool for ex- or in-situ bulk investigation of superalloy microstructure. While ex-situ SANS brings information on precipitate morphology, size and specific interface in superalloys (see e.g., [8,9] and references therein), in-situ SANS studies, moreover, are able to follow the evolution of the microstructure of superalloys directly at high temperature [10,11,12,13,14]. This approach has important benefits when compared with room temperature measurements, as the morphological changes occurring on cooling do not influence the results of the microstructural characterization. Moreover, SANS is an integral method that can extract information from a large amount of precipitates in bulk (≈4 × 10¹¹ particles in the present experiment when counting only large precipitates). The results are thus not influenced by local inhomogeneities in the specimens, which could be the case when using microscopic methods. Therefore, SANS technique can be effectively used to map the temperature threshold where the formation of precipitates starts, to investigate the kinetics of their growth and to find the temperature limit for their dissolution. It can also bring information on volume fraction of precipitates, which is an important input parameter for strengthening modeling [6,15].
The present experiment was focused on in-situ investigation of precipitate formation and dissolution at elevated temperatures in another type of Inconel superalloy, IN792-5A. The initial ex-situ SANS tests carried out with IN792-5A alloy indicated that the formation of a new population of precipitates with slow kinetics occurs similarly to that in previously investigated IN738LC superalloy. The principal task of this study was similar as in the case of IN738LC alloy: to examine if and at which temperature the secondary precipitation occurs in IN792-5A and at which temperature the small precipitates disappear. The temperature intervals corresponding to the changes in the precipitate distribution can be correlated with the temperature domain where the anomaly of the mechanical properties appears. Simultaneously, the dissolution of large primary precipitates was studied in the present in-situ SANS experiment.

2. Material and Methods

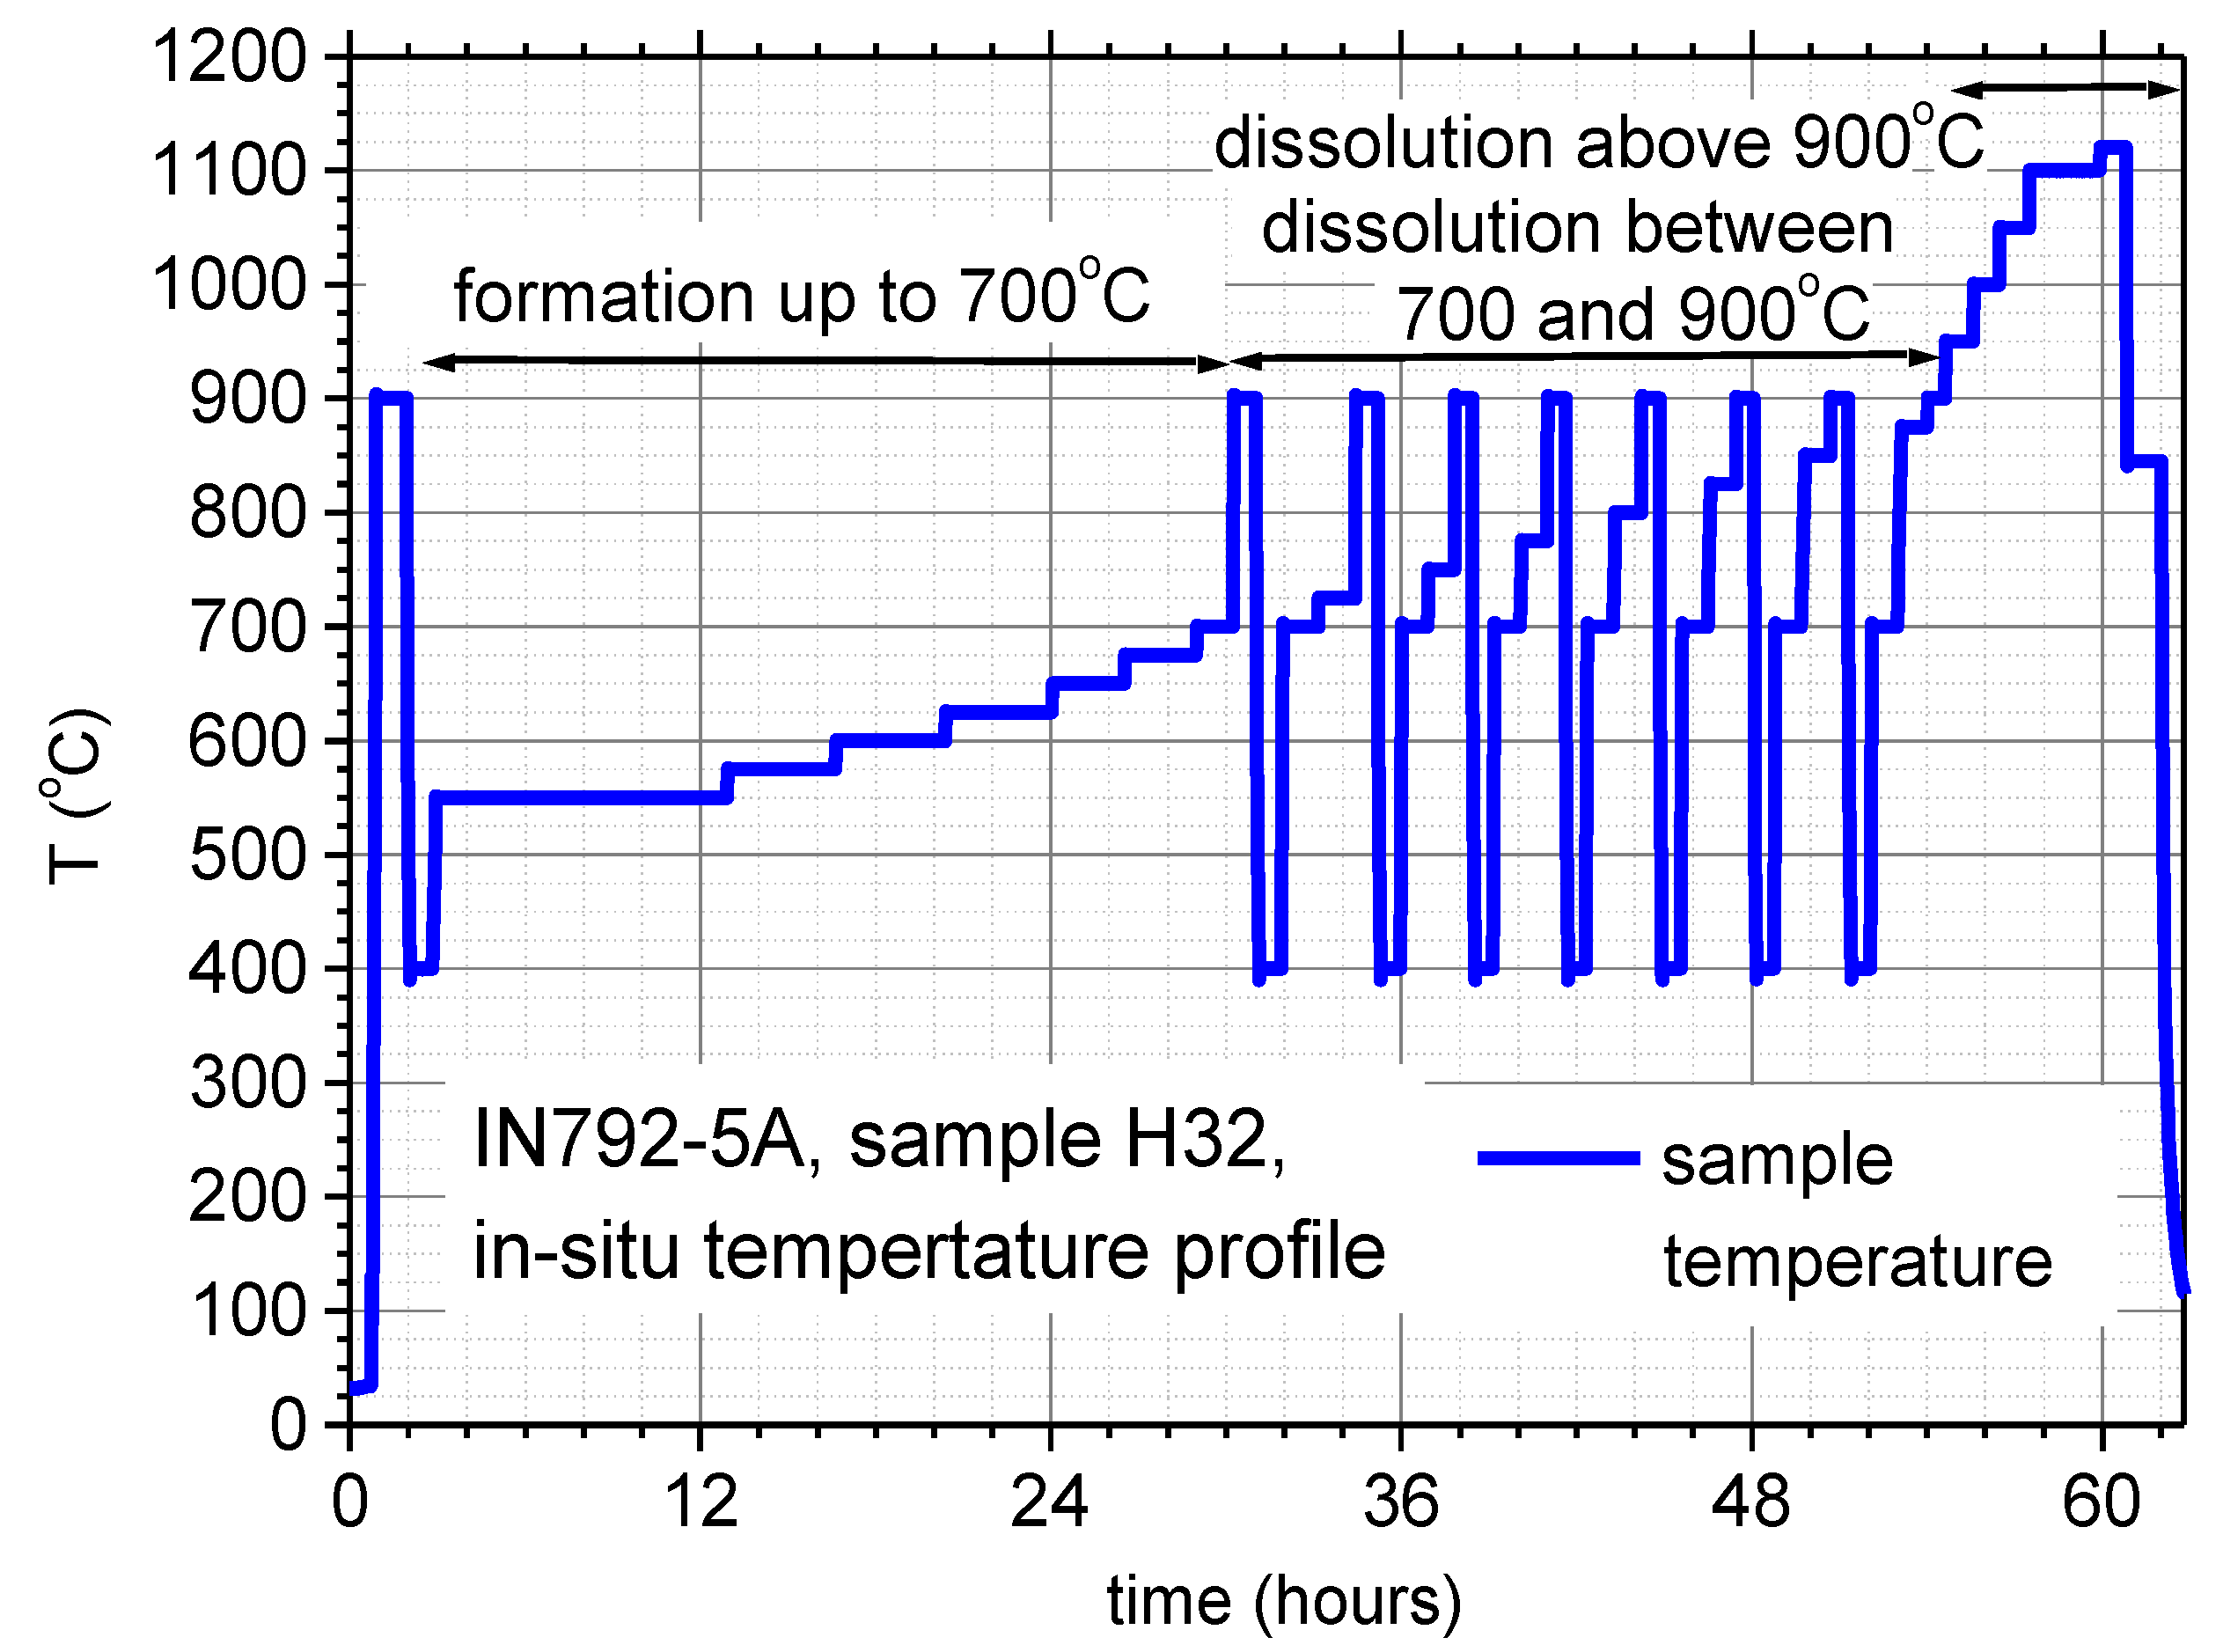
2.1. Specimens and Thermo-Mechanical Treatment
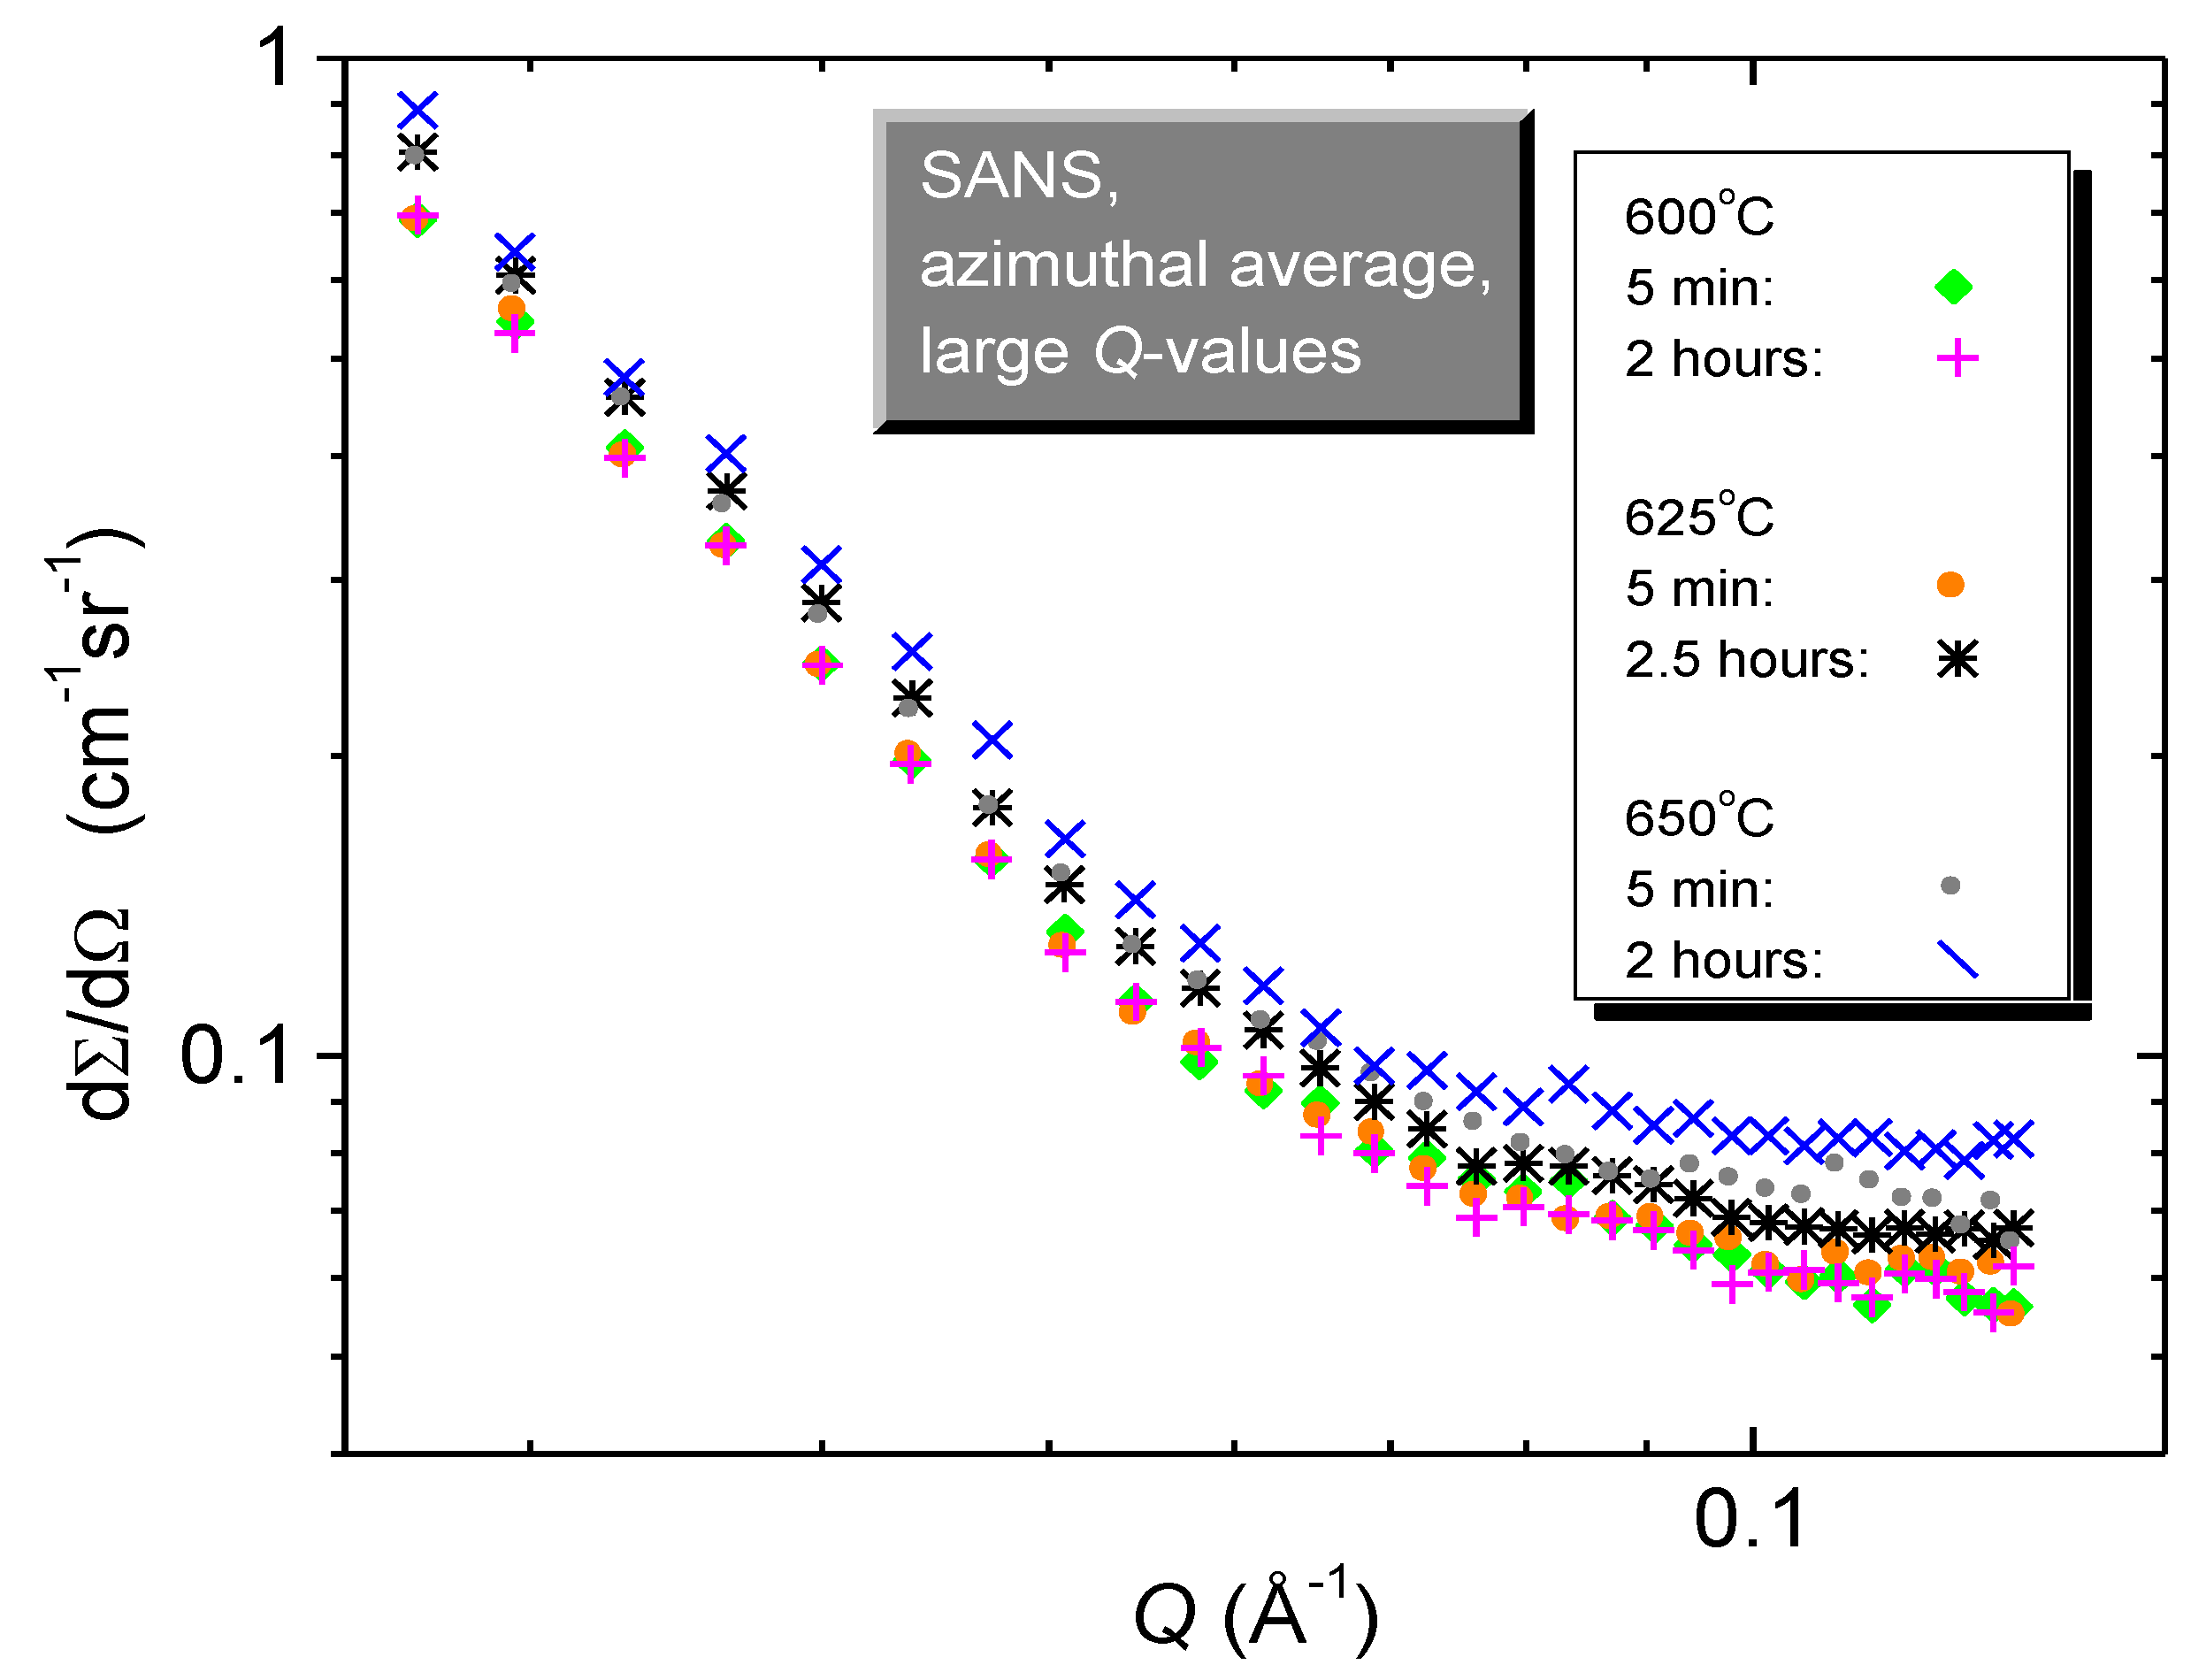
IN792-5A is a cast polycrystalline Ni-base superalloy for turbine rim of small supplementary energy units in aircrafts. Its composition is reported in Table 1. The heat treatment of the superalloy was as follows: (1120 ± 5) °C/4 h air stream cooling, (1080 ± 5) °C/4 h air cooling, and (845 ± 5) °C/24 h air cooling.
Morphology of γ’ precipitates after this standard heat treatment was bimodal, with large (mostly cuboidal) precipitates with size 630 nm and smaller spherical precipitates with dimension 190 nm [18]. Figure 1 displays Transmission Electron Microscopy (TEM) micrograph of typical precipitate microstructure in the material. 68% volume fraction was found using image analysis software (Adaptive Contrast Control) [18]. Table 1 also includes estimated composition of γ’ precipitates taken from the EDS measurement reported by Dahl and Hald [17].
The specimens with diameter of 6 mm were subjected to cyclic loading (low-cycle fatigue test) [18] at various temperatures. The specimens were cyclically strained in a computer controlled electro-hydraulic MTS testing system with constant strain rate 2 × 10⁻³ s−1. The total duration at the elevated temperature in the low-cycle fatigue test was roughly 6 h (approximately 4 h hold at the given temperature prior the cycling and 2 h cycling). The specimen was cycled at 900 °C with strain amplitude 0.28%. The saturated stress amplitude reached 375 MPa. The overall number of cycles was 3245. Nevertheless, similarly as in the case of IN738LC alloy [4], no influence of stress exposure on small precipitate formation and dissolution is expected.
An interesting result for IN792-5A superalloy from an earlier study [19,20] was that it exhibits an anomaly in temperature dependence of the tensile properties in the temperature region 600–800 °C (Figure 2). Nevertheless, it is well known that strength of polycrystalline superalloys often increases between room temperature and 800 °C [6]. Such behavior cannot be explained by simple models of strengthening, and rather complex model considering all relevant strengthening mechanisms should be used [6].

2.2. SANS Technique

The IN792-5A sample was investigated by SANS in situ using vacuum furnace at temperatures up to 1120 °C. The pinhole SANS-II facility [21] at SINQ (PSI Villigen) was used for the measurement. Preliminary tests were performed using MAUD double-crystal SANS diffractometer (NPL lab of CANAM, NPI Řež, Czech Republic [22]).
Scattering length densities (SLDs) of the alloy and γ´ precipitates, necessary for the evaluation of the SANS data in an absolute scale, are reported in Table 1 (last column). When assuming volume fraction of precipitates to be 68% [18], then also the SLD of γ matrix can be calculated [4] with the result 58.3 × 109 cm−2. The corresponding scattering contrast between γ´ precipitates and γ matrix is then 8.5 × 109 cm−2.
Cylindrical samples were used for measurement. The neutron beam path was slightly less than 6 mm. The attenuation was still acceptable and multiple scattering did not influence significantly the scattering curves in the accessible region of scattering vector magnitude Q. The width of the slit was only 3.35 mm in order not to have an excessively broad distribution of thicknesses in the gauge volume. The average thickness (used in the raw-data treatment) was thus 5.62 mm. The slit height was 10 mm. Each sample installed into the furnace was adjusted to the beam using neutron sensitive camera. Expected thermal expansion of the stick, which was used for mounting the sample at high temperatures, was taken into account during the adjustment.
The scattering data were collected at several (reproducible) geometries during the hold at a particular temperature, i.e., the measurements at various geometries were done with the same sample. The data acquisition time for one SANS pattern (i.e., at one geometry) was 5–10 min, which enables to see possible microstructural change during hold at a temperature (the hold time > 50 min was always used).
The sample-to-detector distance was varied from 1.2 m to 6 m and the neutron wavelengths λ of 6.3 Å and 10.5 Å were used. The full covered range of Q (Q = |Q| = |k-k0|, where k0 and k are the wave vectors of the incident and of the scattered neutrons, respectively, and |k| = |k0| = 2π/λ), was 4.0 × 10⁻³ Å−1–0.13 Å−1 (i.e., 4.0 × 10⁻² nm−1 < Q < 1.3 nm−1).
The in-situ SANS experiment was performed using tantalum furnace with maximum cooling rate approximately 100 K/min in the temperature region 900–600 °C. The uncertainty in temperature determination using a thermocouple was ±8 K due to the possible gradient of temperature in the relatively large gauge volume. The temperature profile during in-situ SANS measurement is plotted in Figure 2. It consists basically of three regions: temperature increase (step-by-step, the step equal to 25 K) from 550 up to 700 °C, which should provide information on formation of the small additional precipitates, then the further part where dissolution of these small precipitates between 700 and 900 °C was tested, and finally the temperature increase from 900 up to 1120 °C which was intended to provide information on dissolution of large primary precipitates in IN792-5A.
The part dealing with dissolution of the small precipitates between 700 and 900 °C consisted of series of thermal cycles 900 °C–400 °C–700 °C–TD, hold at each of the given temperatures for 1 h. Temperature TD has been increased in the subsequent cycles always by 25 K. The list of TD is thus as follows: 725, 750, 775, 800, 825, 850, and 875 °C. The aim was to ensure—for each TD—the same preconditions and thus the same microstructure of small precipitates at the beginning of the hold at TD temperature. The temperature 900 °C served (similarly as in the case of previous study with IN738LC [4]) for dissolution of all populations of small- and medium-size precipitates from the previous heat treatment steps. The annealing at 900 °C was thus a kind of “reset” of the precipitate microstructure—only large precipitates remain, all the others were dissolved. Then, the sample was cooled to 400 °C and later heated to 700 °C (1 h hold) in order to produce a new population of small precipitates. Afterwards, the sample was heated to TD in order to test the precipitate dissolution.
The last part of the in-situ experiment, i.e., the temperature increase from 900 up to 1120 °C (step equal to 50 K) with one-hour hold at the particular temperature was carried out for assessment of the volume fraction of all precipitates (i.e., not only small and medium, but also the large ones) in IN792-5A. Since the same sample was used, the evolution of the γ’ volume fraction in the whole temperature range up to 1120 °C could be determined (see Evaluation and Discussion Section).
The measured raw SANS data were corrected for background scattering and calibrated to absolute scale using the measurement of the (attenuated) primary beam [23]. In this way, macroscopic differential cross section dΣ/dΩ (Q) was obtained. A correction for efficiency and solid angle of the individual pixels of the 2D detector was also performed. The scattered intensity is assumed to originate predominantly from the compositional variations in the superalloy, i.e., due to the presence of γ’ precipitates.

3. Results

The in-situ SANS experiment was mainly focused on the determination of the temperatures at which the formation of small precipitates starts and at which the γ’ precipitates are dissolved.

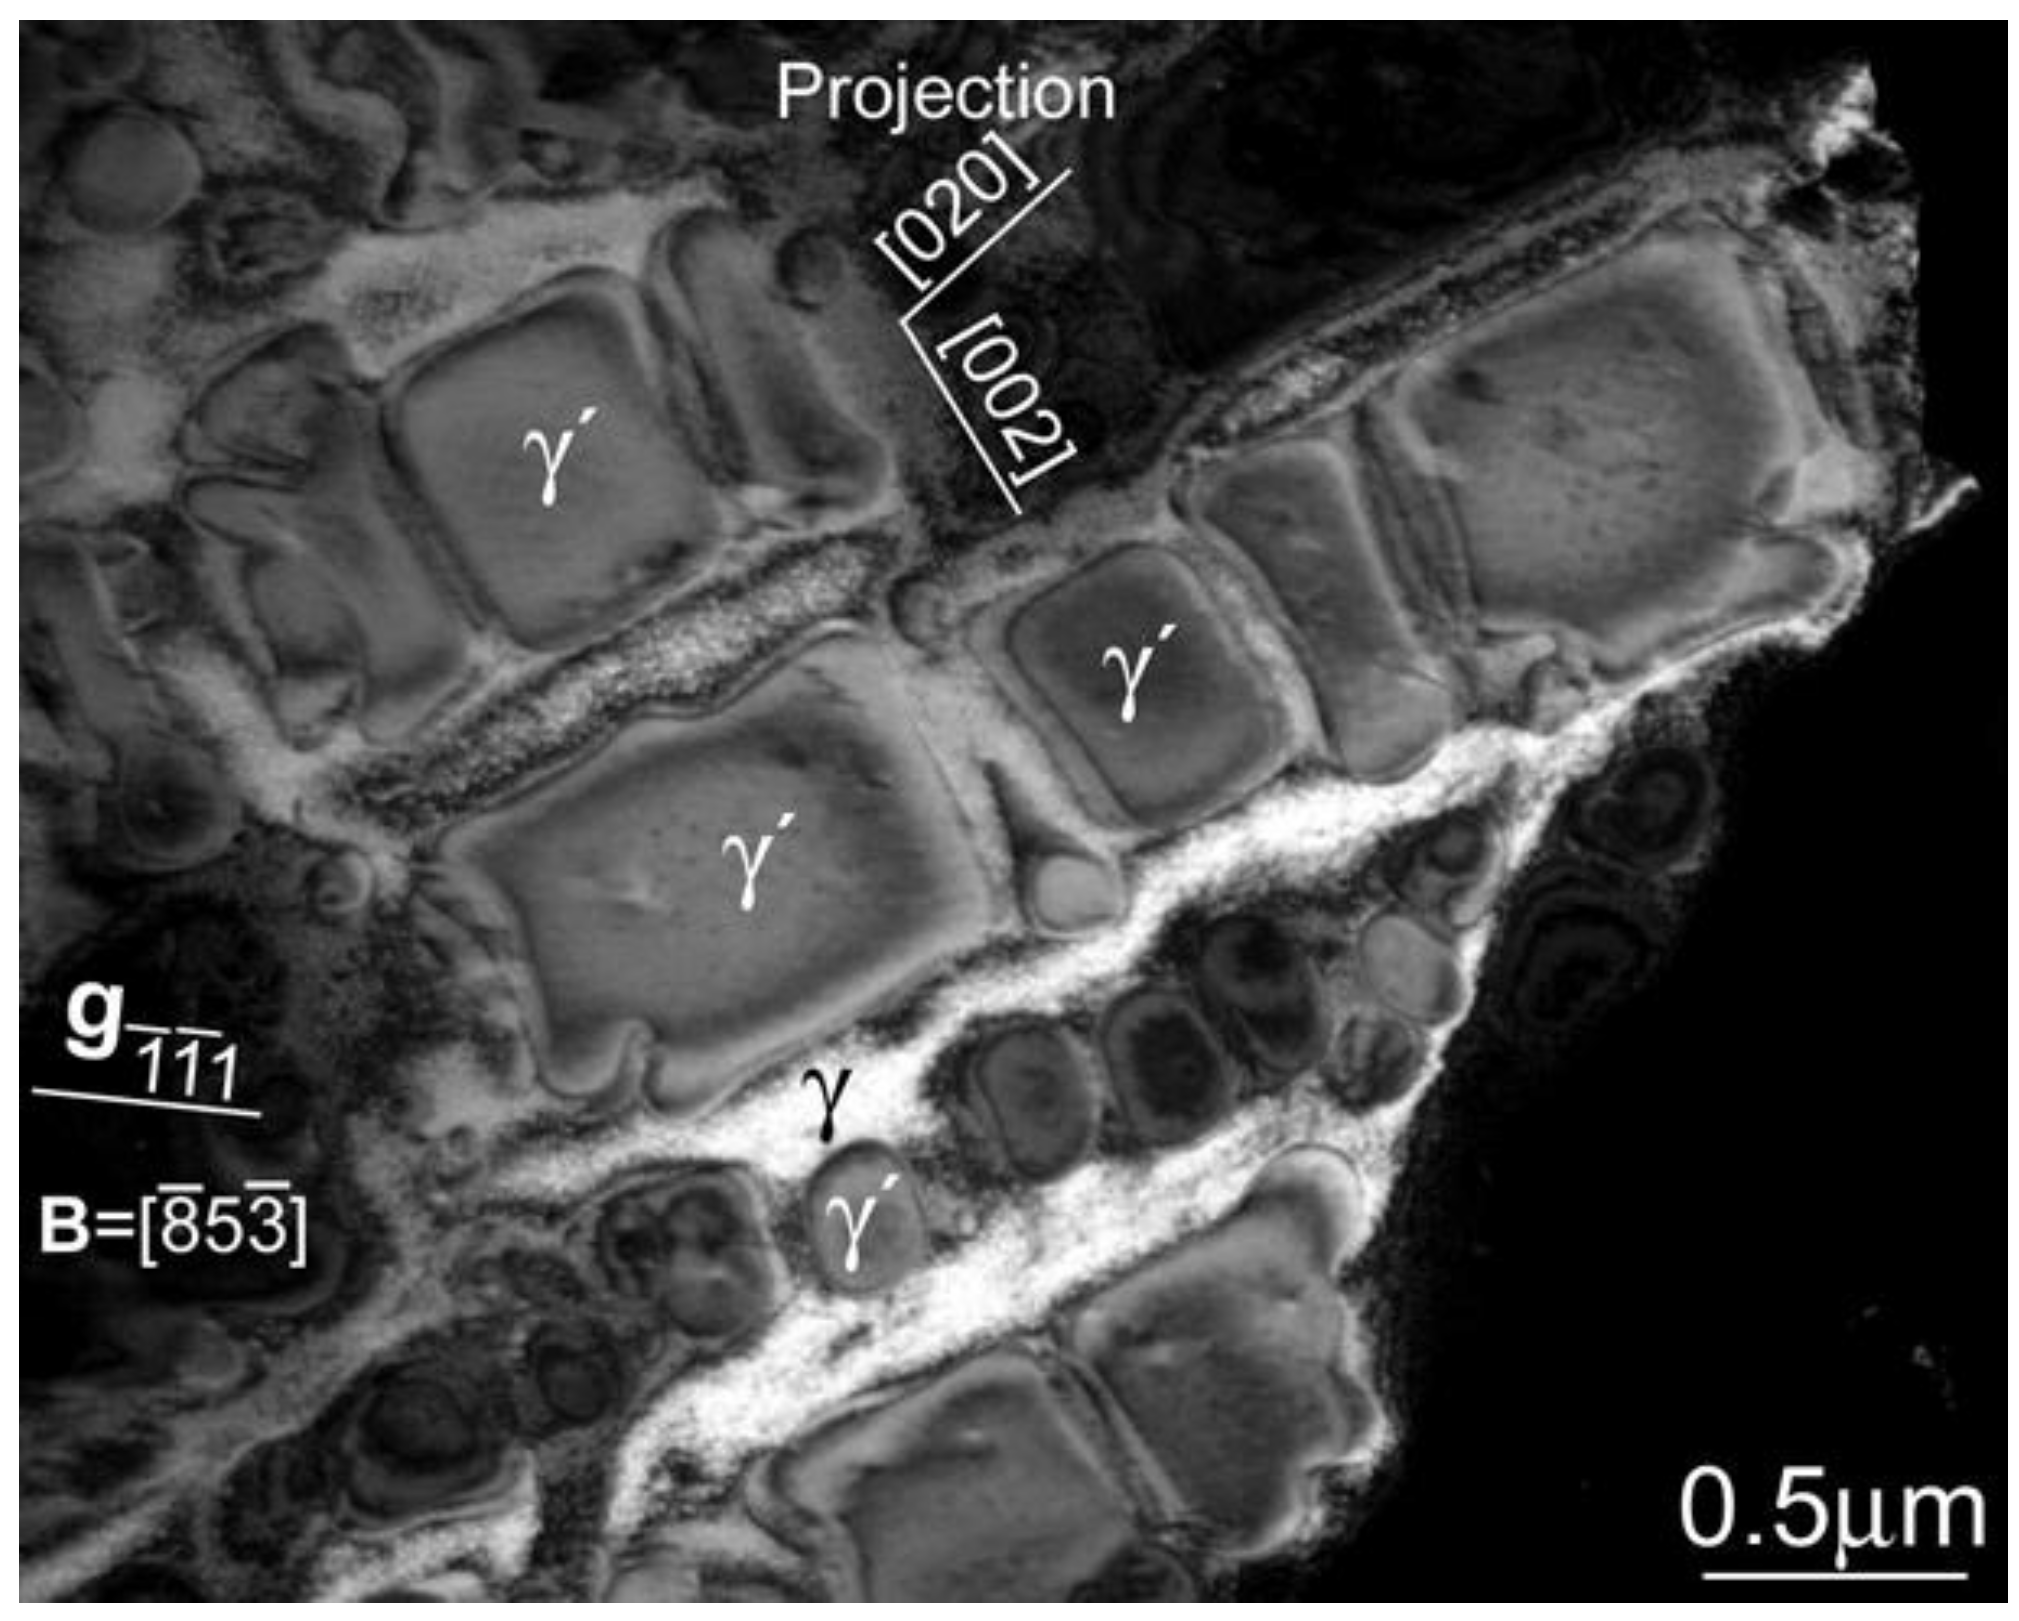
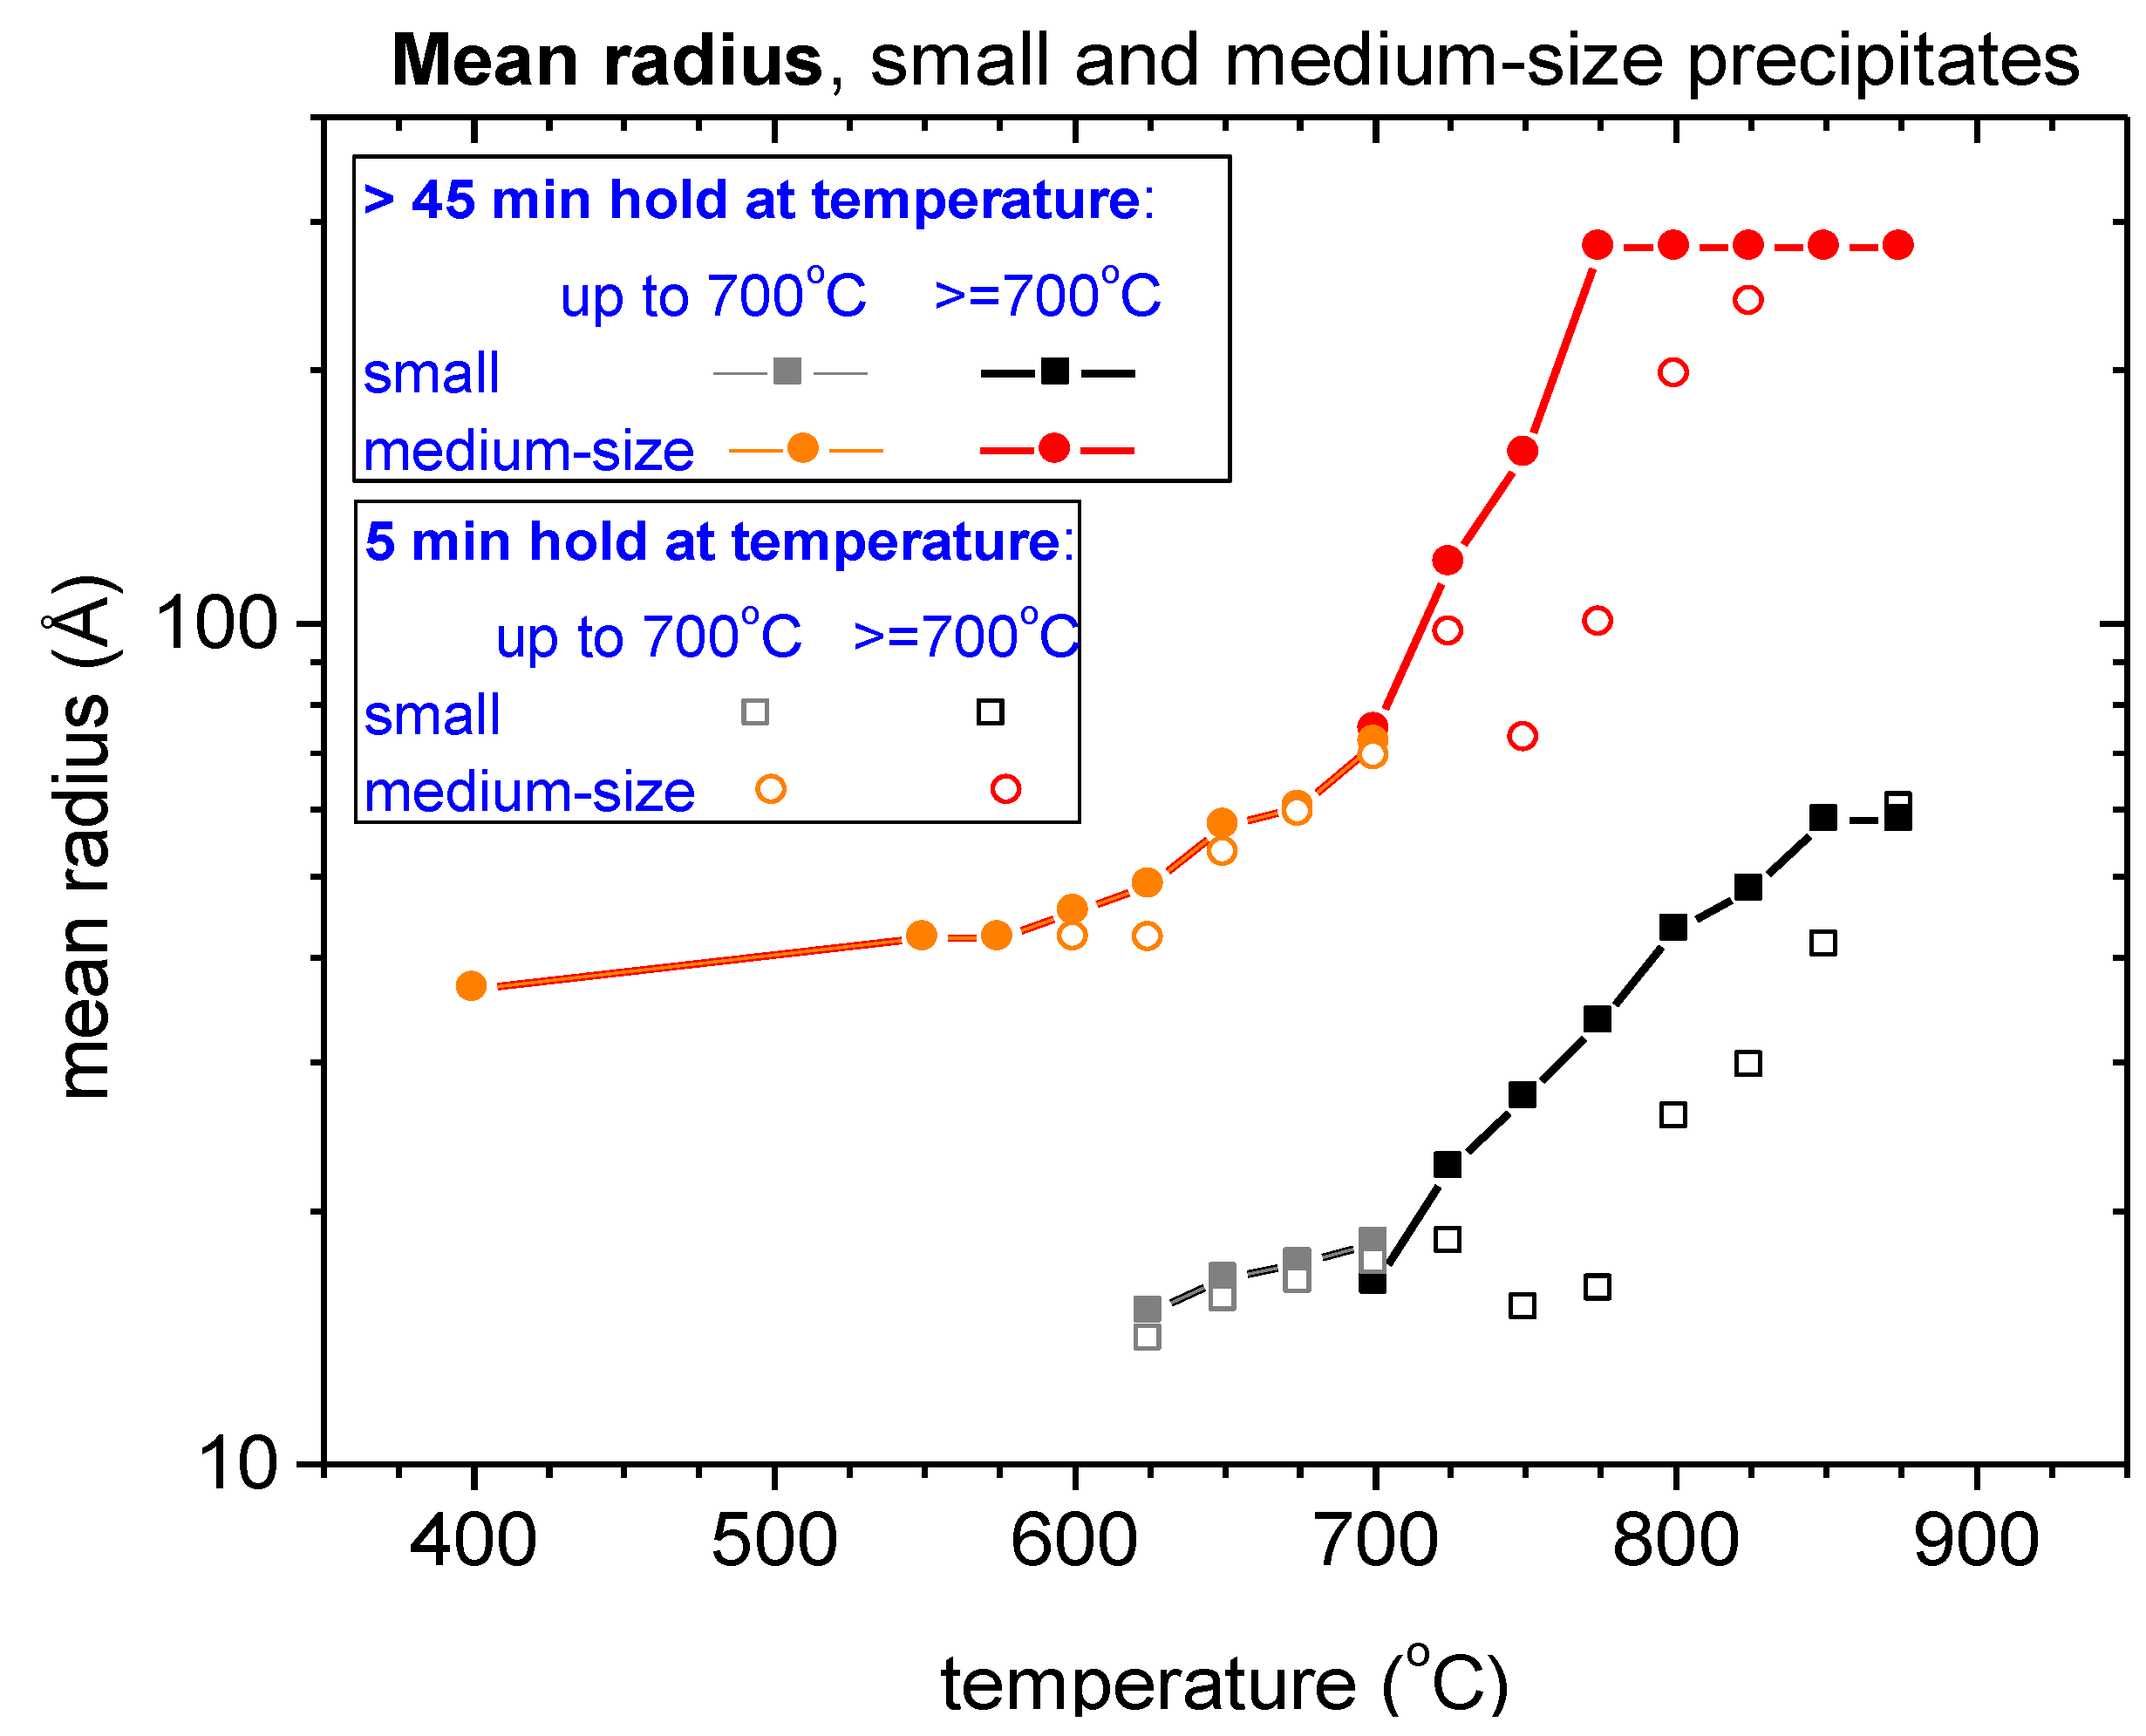
3.1. Formation of Precipitates

The temperature was increased step by step (see Figure 3) up to 700 °C and the sample was held at each temperature for a long time in order to observe if the formation of precipitates occurs at that particular temperature or not. This can be recognized from scattering intensity increase at the largest Q-values as the smallest precipitates after their formation contribute to the intensity just in that Q-range. A clear increase of the intensity occurs first at 625 °C during 2.5 h hold, as can be seen from the scattering curves in Figure 4.

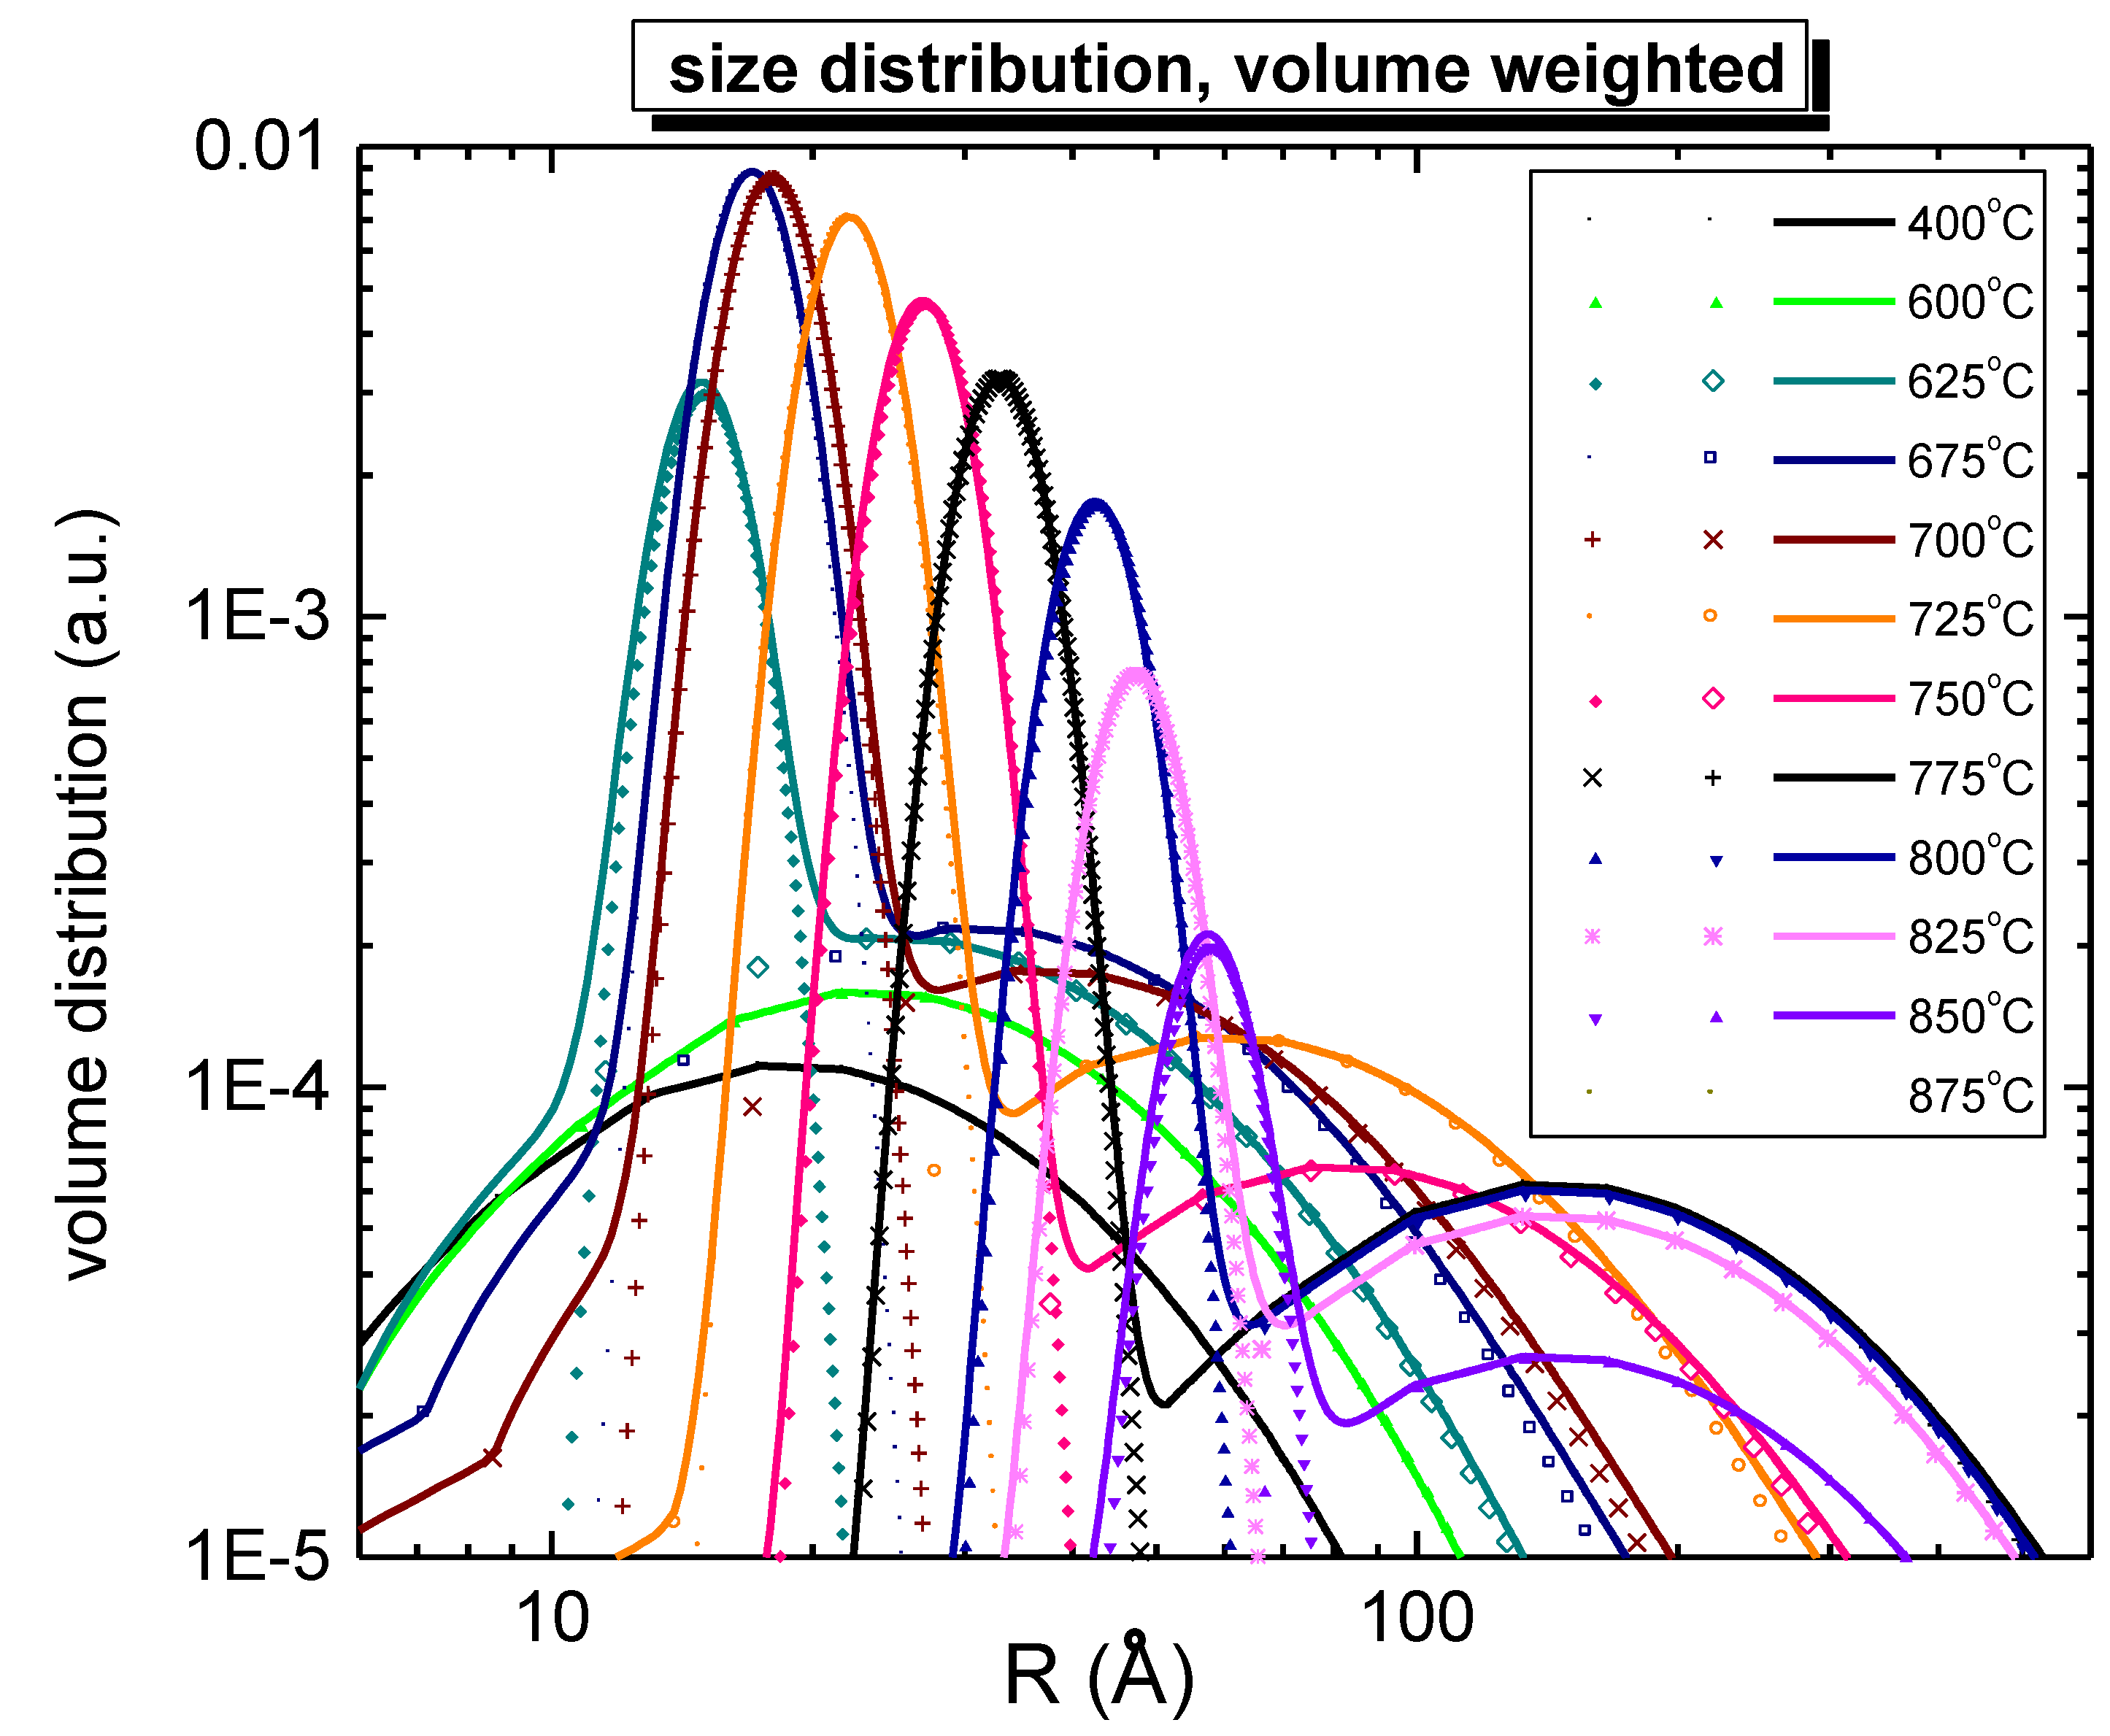
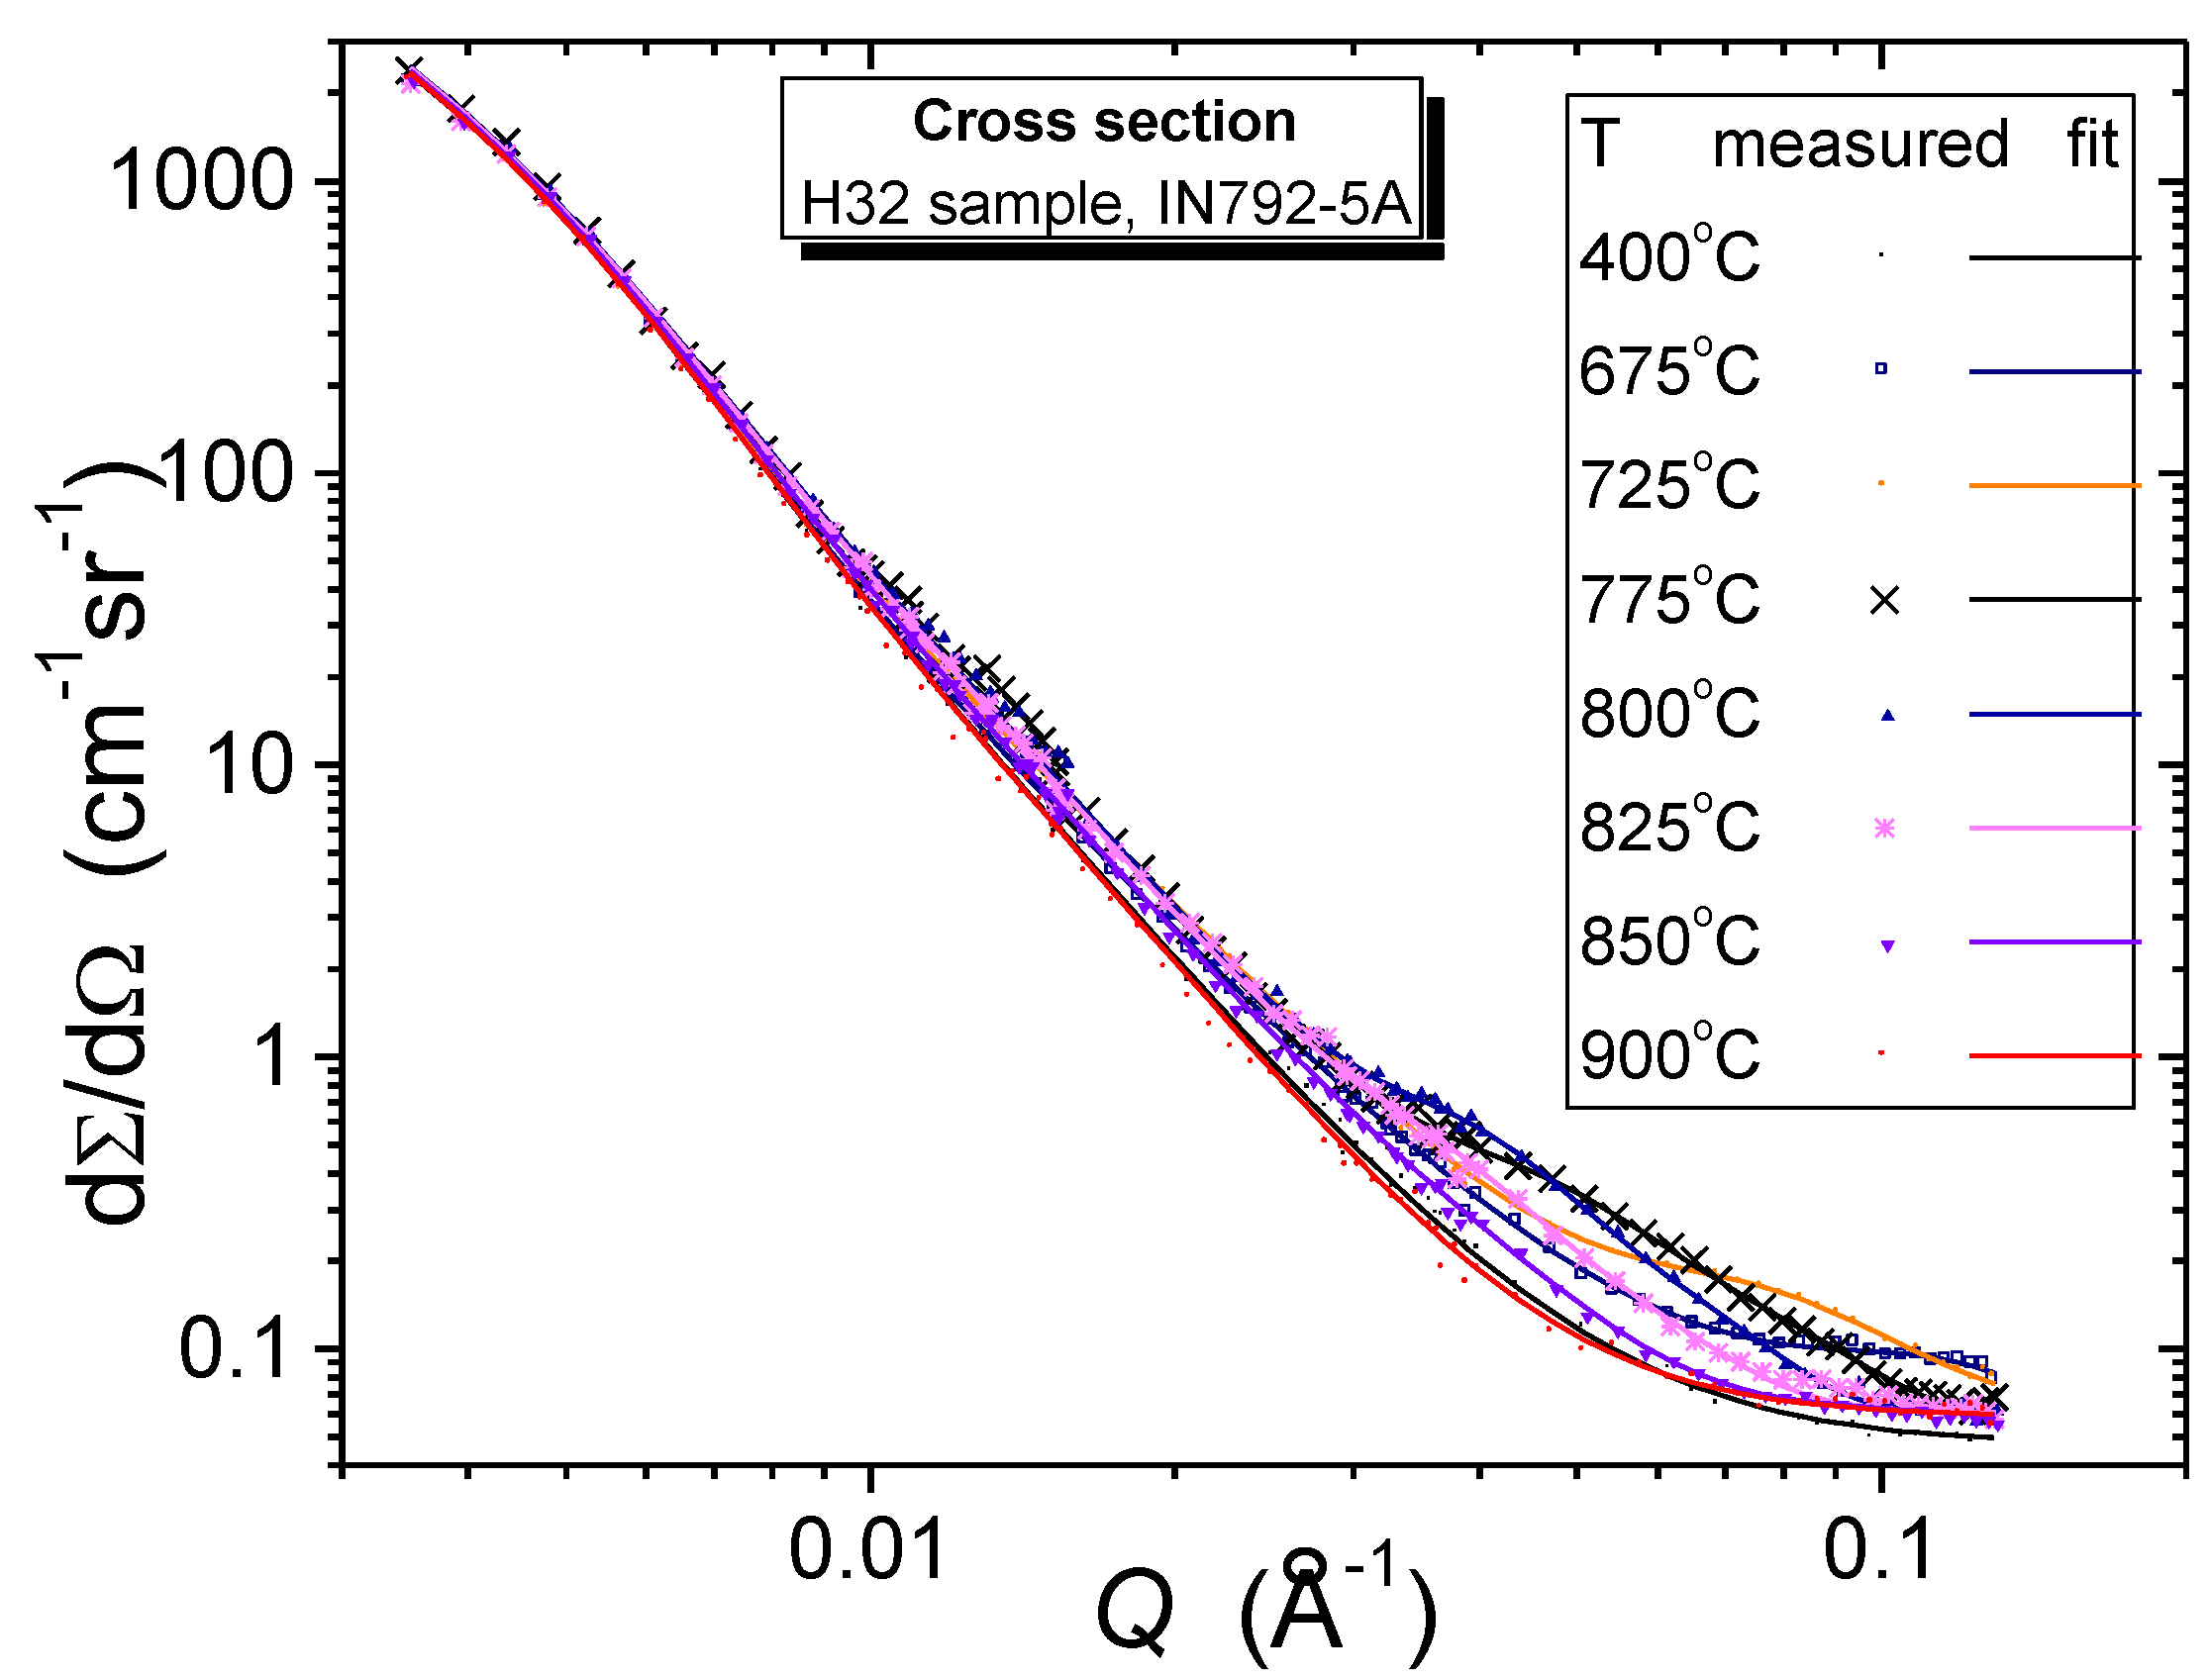
3.2. Evolution and Dissolution of Precipitates between 700 and 900 °C

Selected full scattering curves measured during in-situ heating are shown in Figure 5. From the scattering curves, it can be deduced that small precipitates grew with increasing temperature and also that they form a dense system for which the interparticle interference has to be taken into account when evaluating the SANS data.
The second part of the in-situ SANS experiment was focused on the determination of temperatures at which the small- and medium-size precipitates dissolve. The evolution of small precipitate morphology in the given temperature range can be deduced from the measured scattering curves. This temperature range was tested in a special sequence of temperatures described previously in the Experimental Section. The scattering curves measured in this temperature range can be seen in Figure 5.

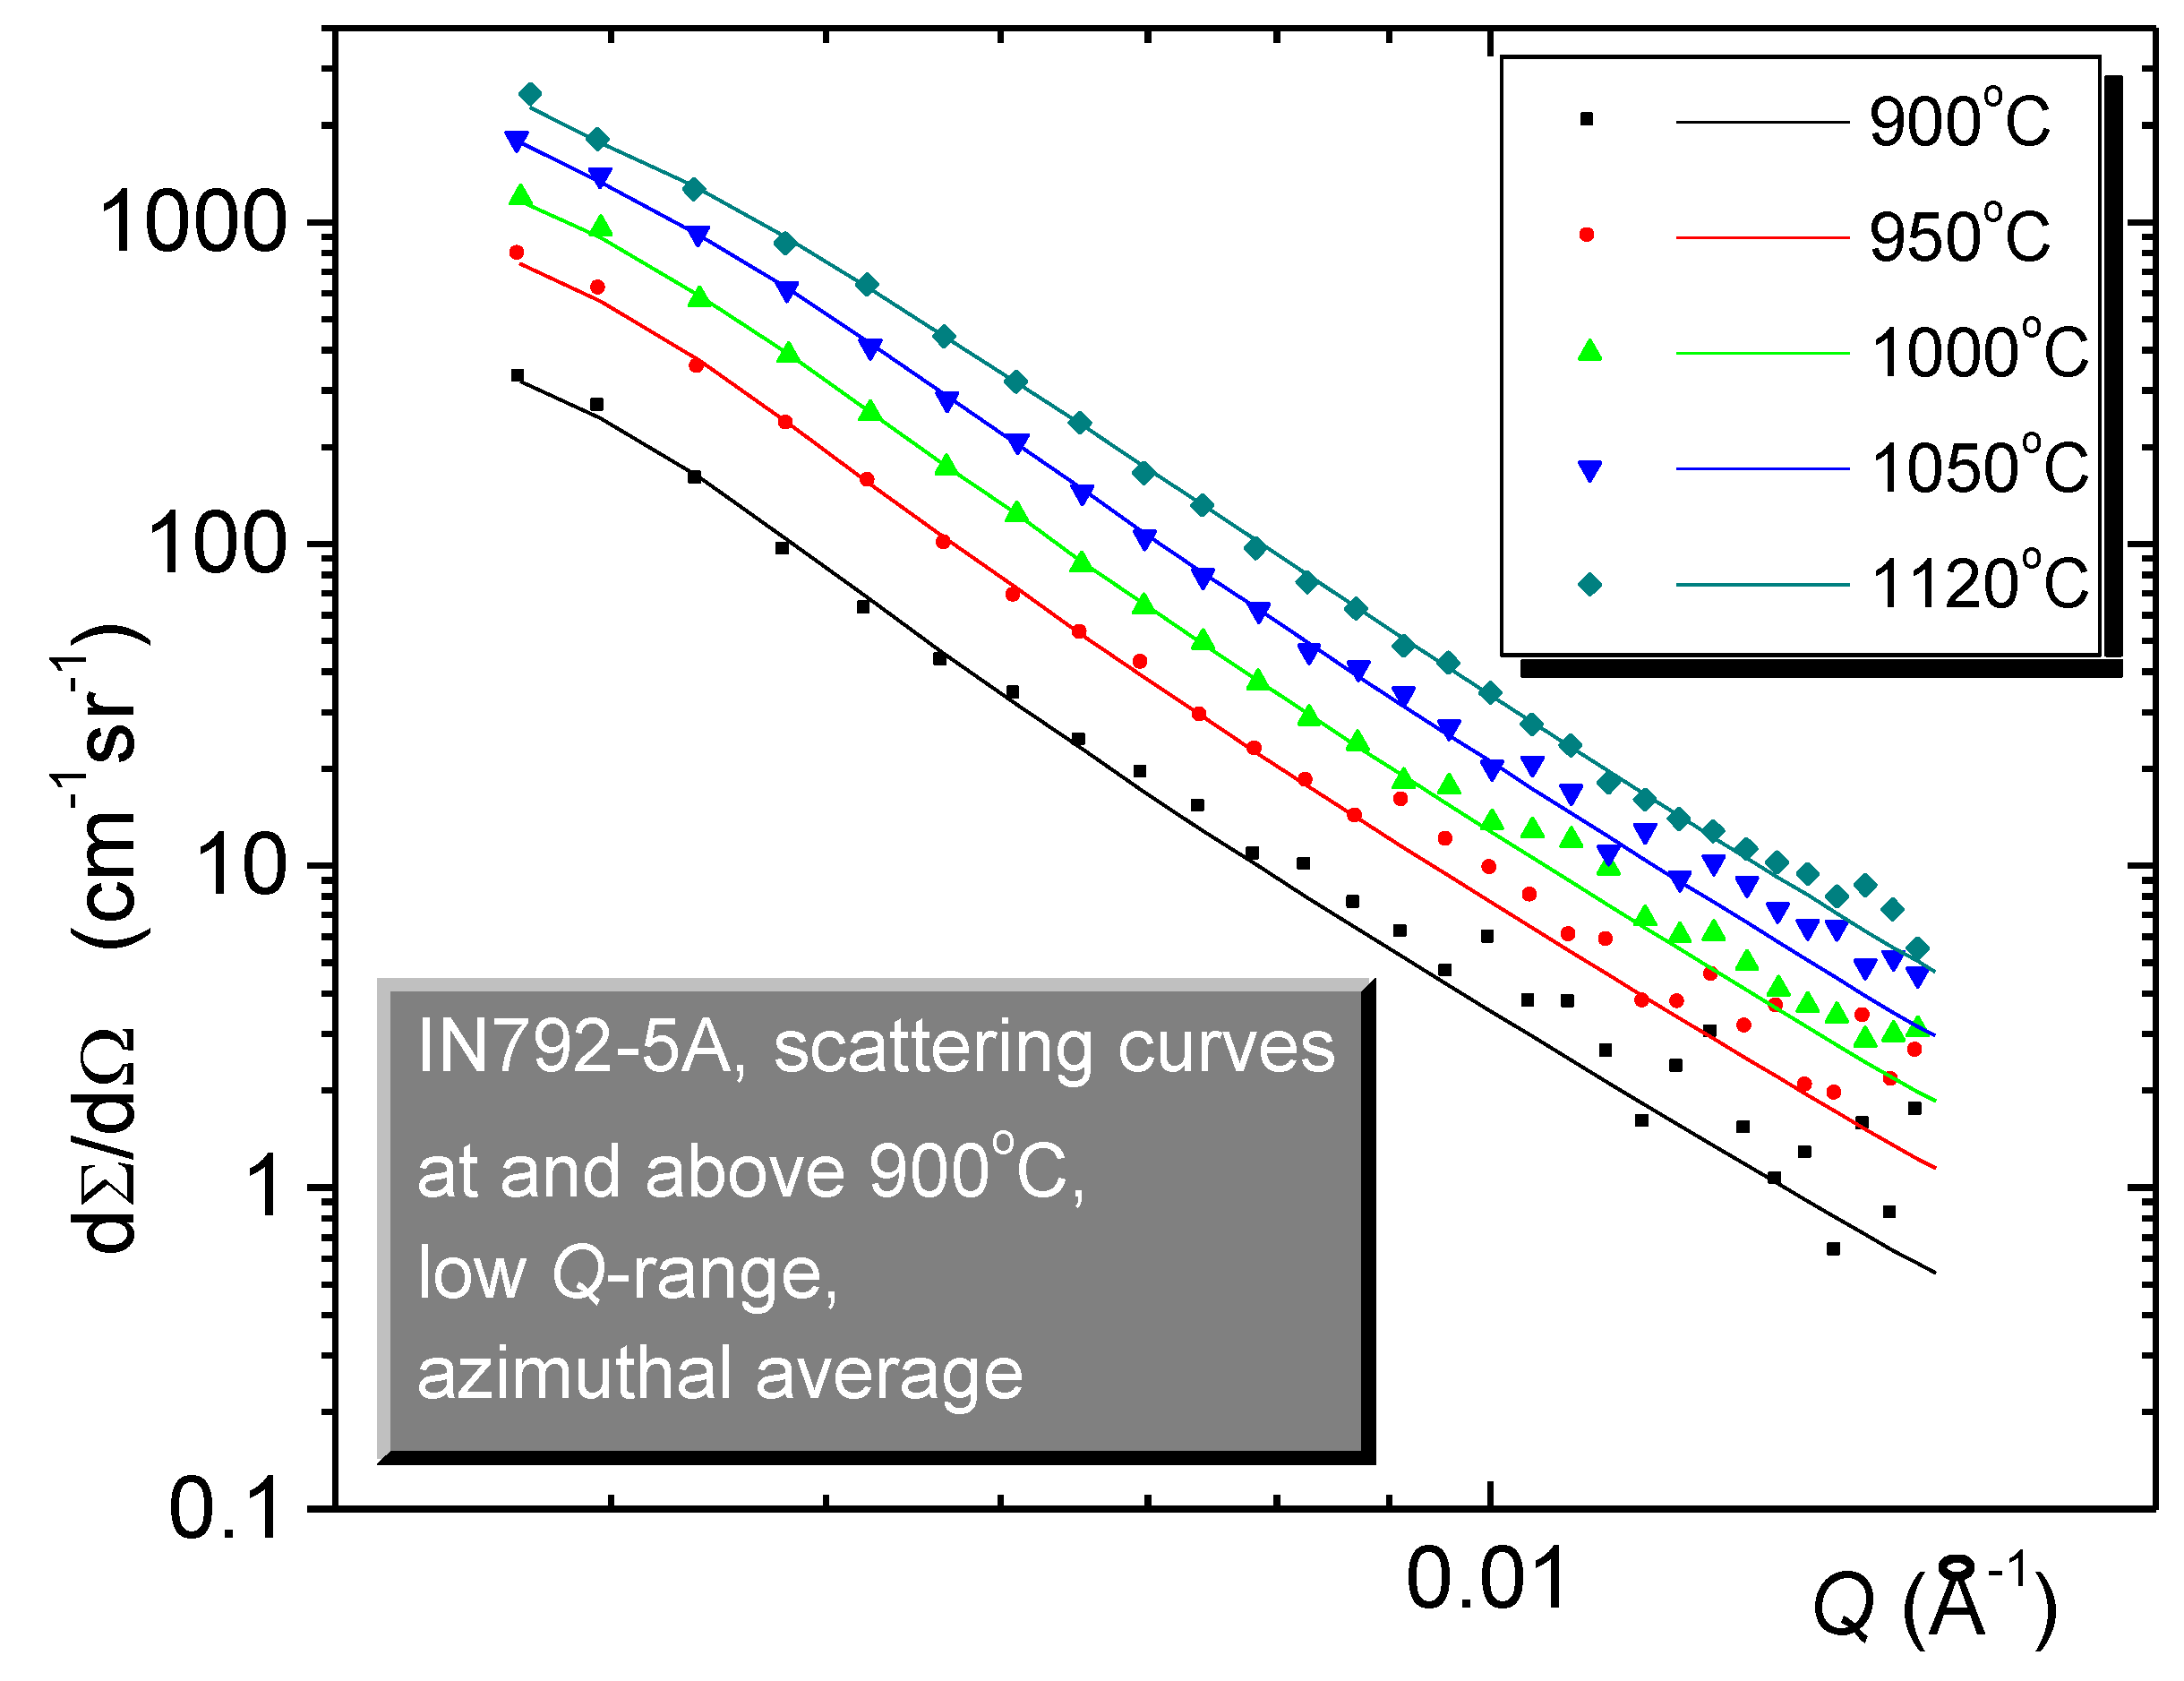
3.3. Dissolution of Precipitates at and Above 900 °C

Primary large precipitates start to dissolve above 900 °C. A sequence of temperature steps and corresponding scattering curves at which this dissolution was tested by in-situ SANS can be seen in Figure 6. The intensity decreases with increasing temperature, but does not disappear completely at the highest temperature 1120 °C.
NOC program [24] was used for volume fraction estimation as this software takes into account multiple scattering from a thick sample, which is important for the large-precipitate scattering (unlike the scattering from the small and the medium-size populations).
Changes in the asymptotic part of the scattering intensity originating from the large precipitate population during the in-situ thermal exposure above 900 °C were then treated as coming from the relative decrease of their volume fraction. Proportionality was assumed.

4. Evaluation and Discussion

4.1. Model for Evaluation

The SANS measurements at and below 900 °C were evaluated by the SASFIT program for SANS data treatment [25]. The analysis procedure is based on the simulation of a scattering profile generated from a set of size distributions of the particle system. In order to find the microstructural parameters which can be extracted from the measured data, the calculated SANS profile was matched with the experimental curve.
From the first qualitative analysis of SANS data and the observations using electron microscopy, a model was proposed which was used for the detailed analysis of the SANS data. The microstructural model was generally composed of three γ´ precipitate distributions:
(1) Small precipitates, mean sizes below 120 Å (radius < 60 Å), modeled by spherical-particle population with log-normal size distribution.
(2) Medium-size precipitates, mean sizes 70–600 Å, modeled by spherical-particle population with log-normal size distribution.
(3) Large precipitates with sizes larger than 600 Å (radius > 300 Å); these correspond predominantly to the secondary precipitates in the alloy. [Although shape of these precipitates is rather cuboidal, the spherical shape of particles was used in the evaluation also for these particles. It does not matter for evaluation as only the asymptotic part of the scattering is recorded from these particles at the used SANS facility and no details on shape and size of these particles are extracted from the measured data].
Pronounced interparticle interference effect for small particles (due to their relatively narrow size distribution as well as relatively dense arrangement of the small precipitates in the channels between the large precipitates) was observed in the initial period of new precipitate population formation. Therefore, hard-sphere model was used to approximate structure factor in SASFIT program. In all cases, this approximation was sufficient and the resulting model curves described very well the scattering data.

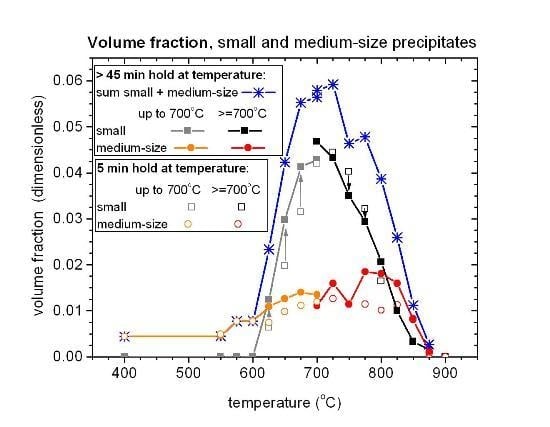
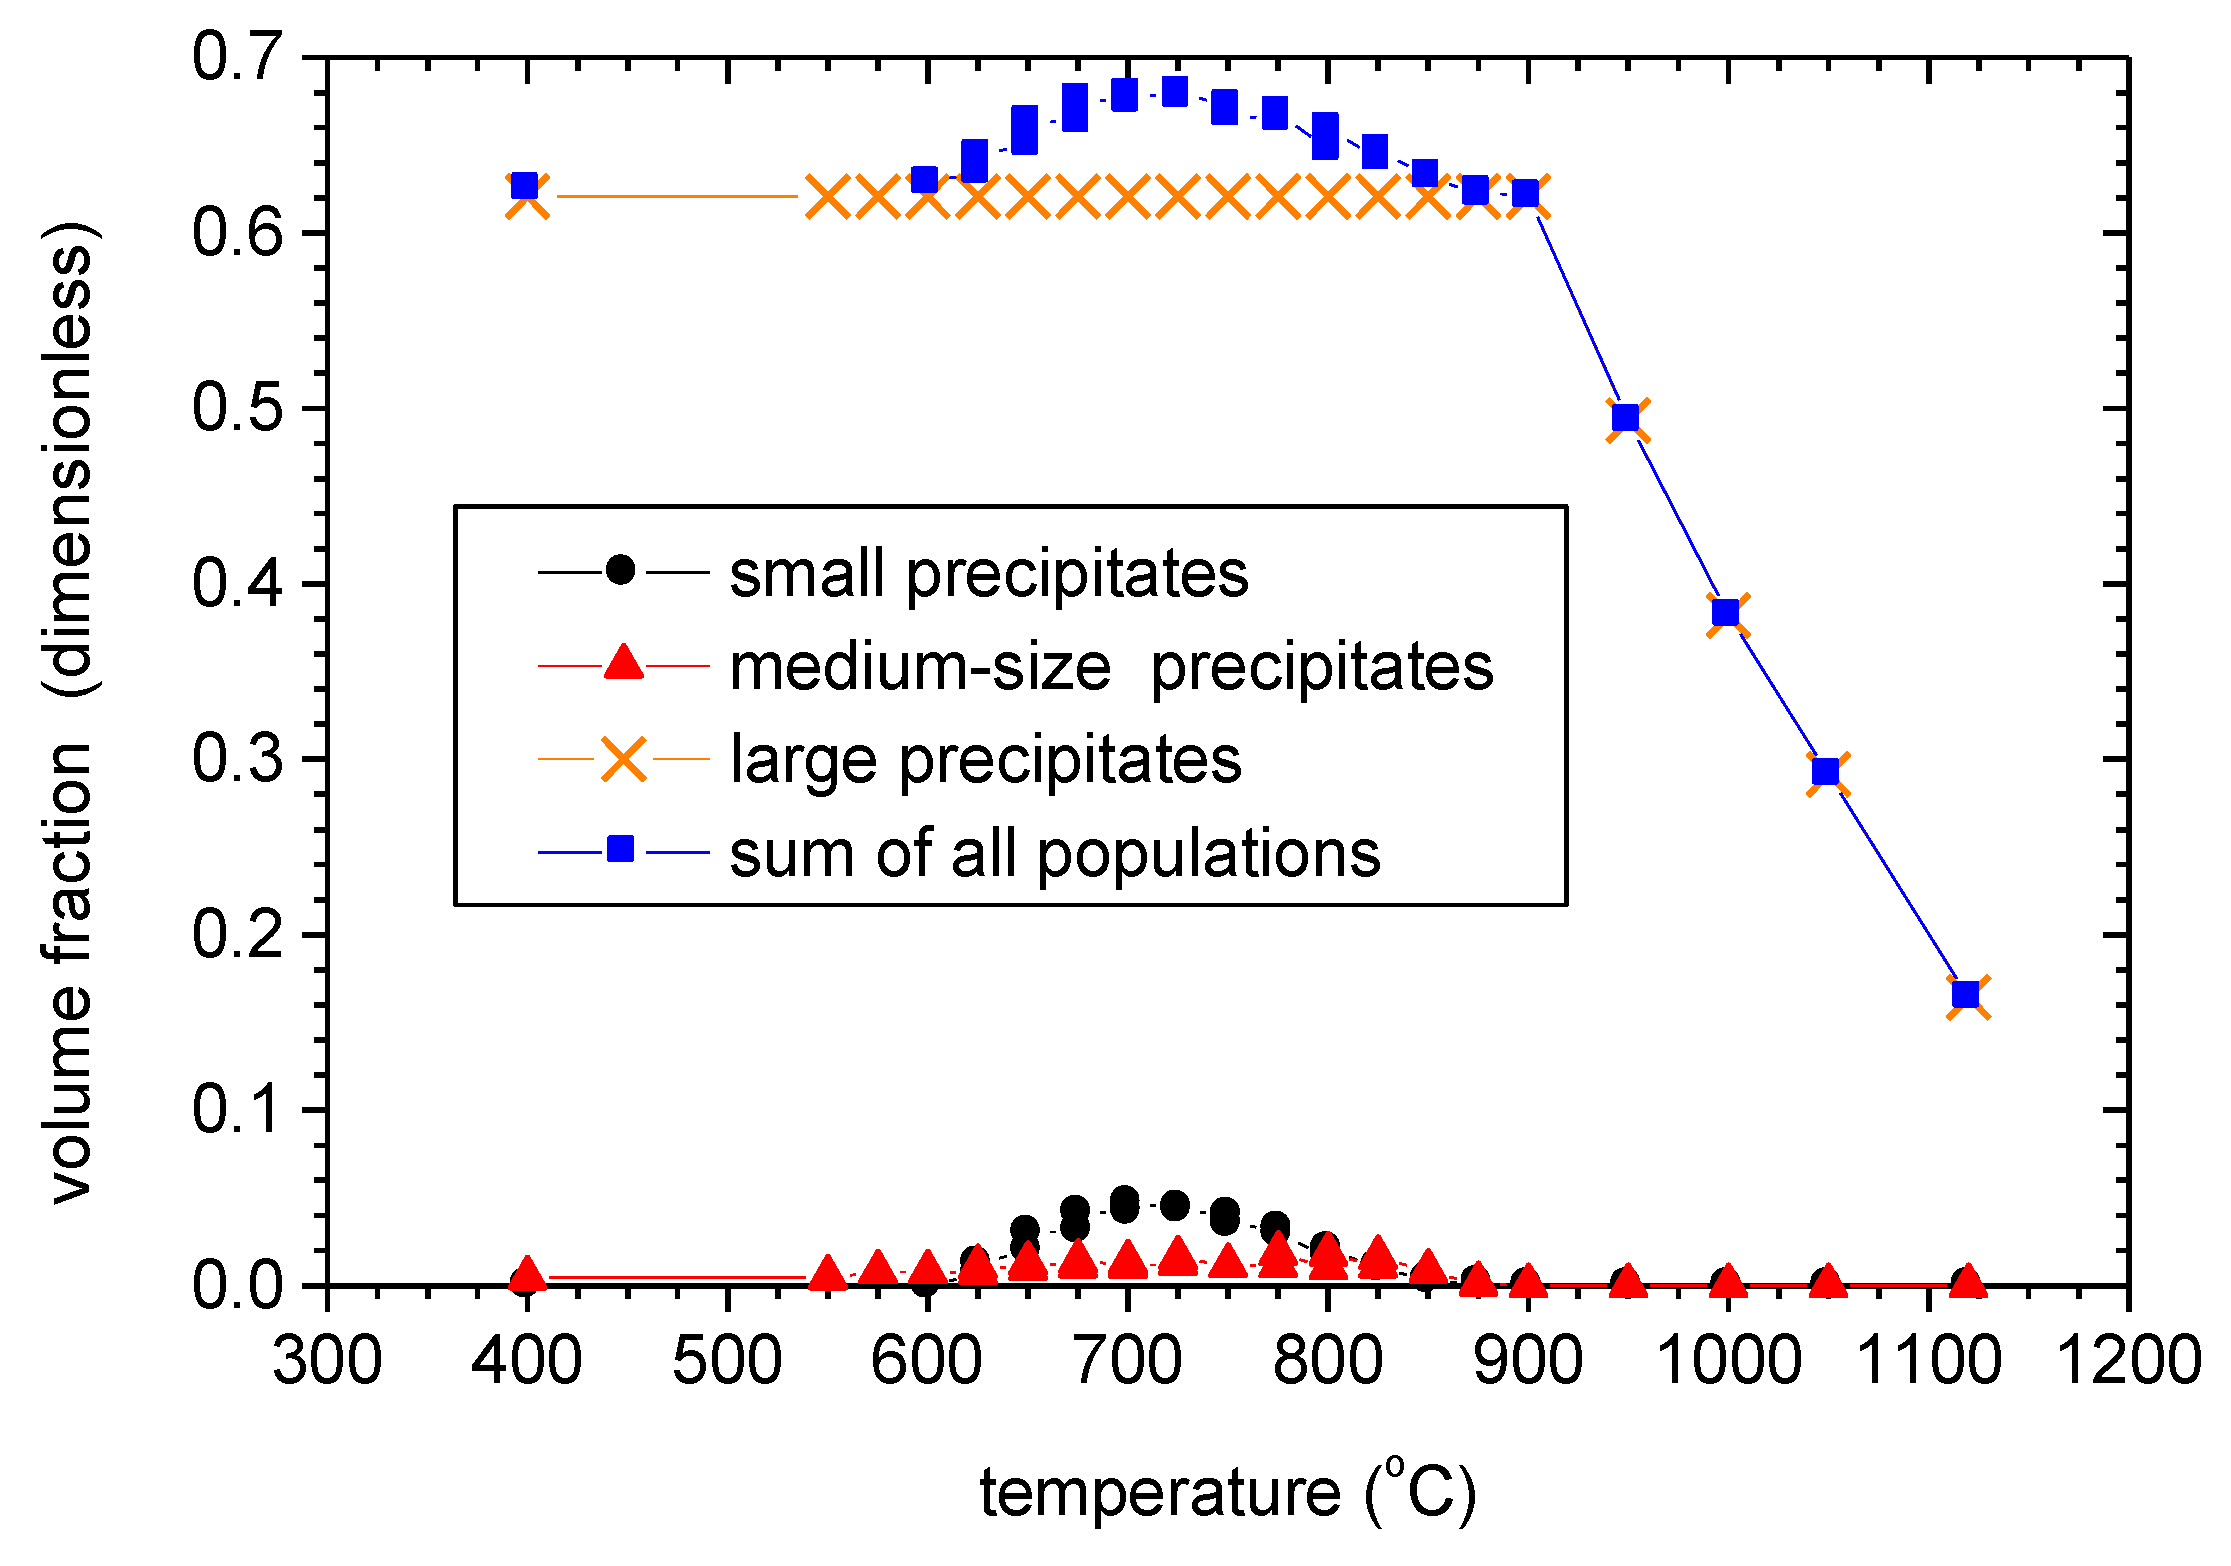
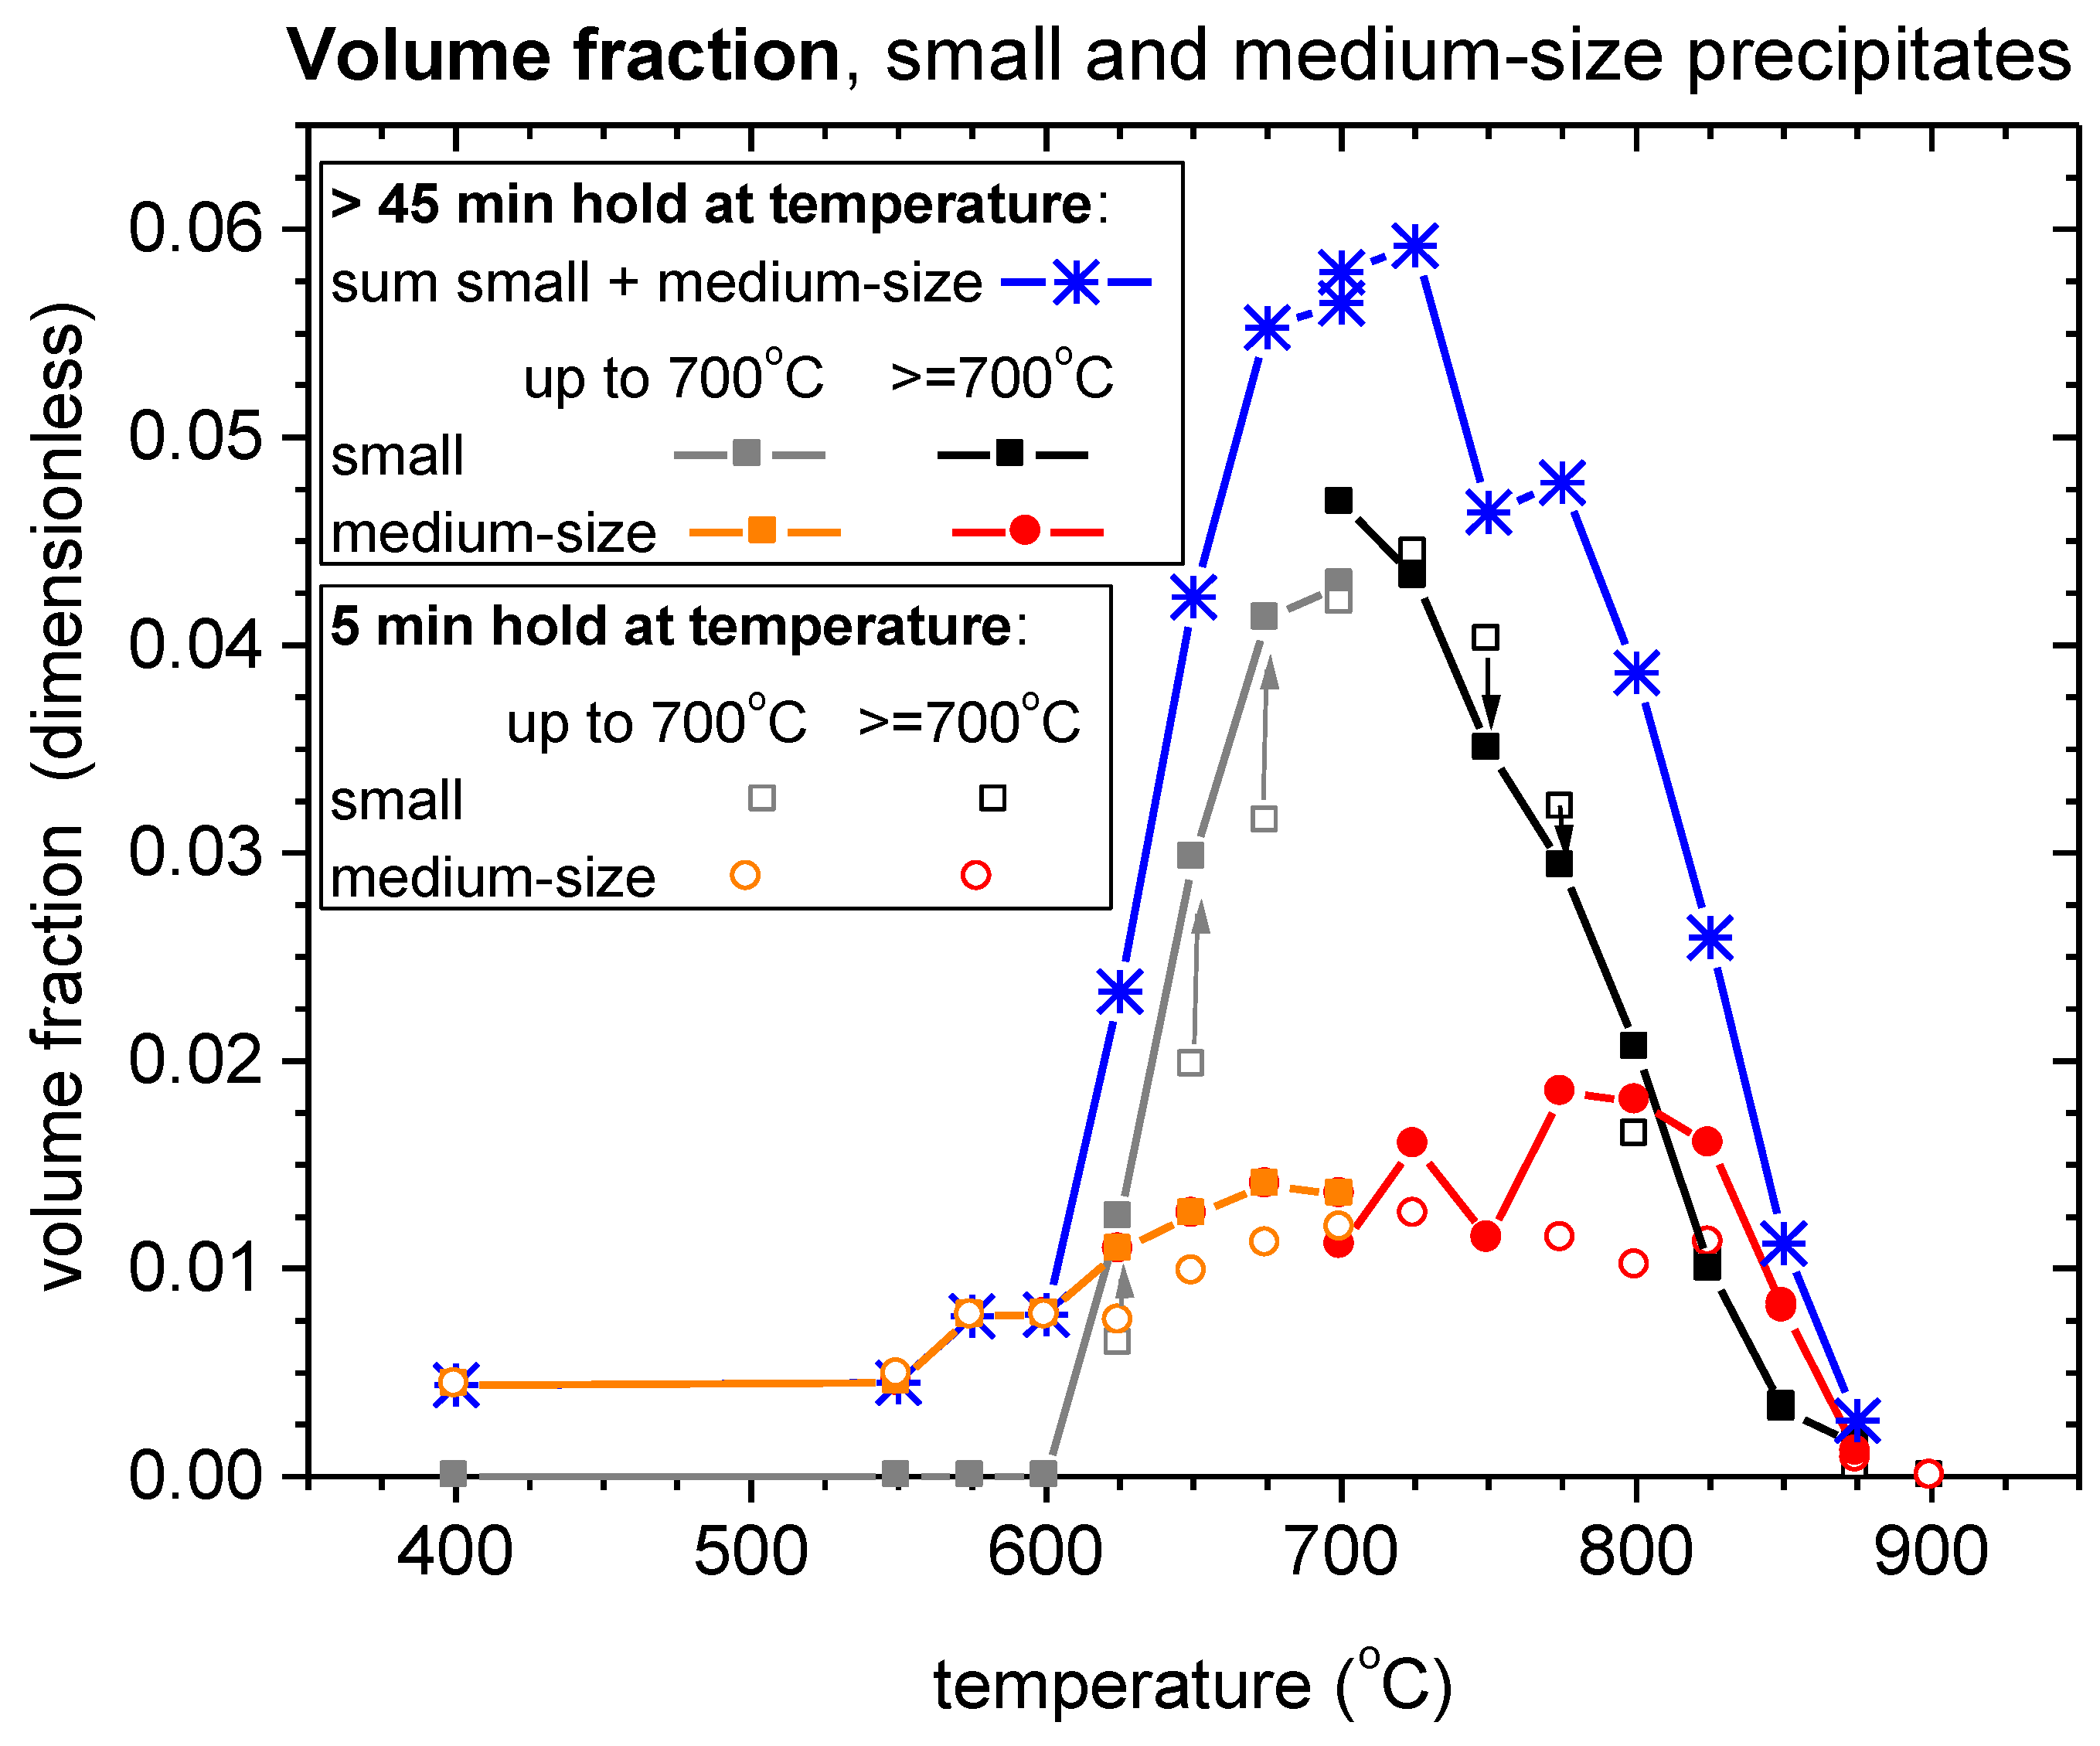
4.2. Volume Fraction

It has to be stressed that it is not possible to determine the total volume fraction of γ´ precipitates only from the SANS measurements because the size of the largest precipitates (size 6300 Å) is well above the detection limit for the used Q range. The scattering from these precipitates has nearly asymptotic character (except of the lowest Q-values) in the used Q range. At very low Q-values, due to the sample thickness, it is certain that also the multiple scattering takes place and influences the scattering curve.
Therefore, the estimate of the total volume fraction of precipitates in IN792-5A alloy at room temperature had to be taken from other techniques. The value 68% mentioned in the Experimental section of this paper was used.
As already mentioned above, the size of the large precipitates is well above the detection limit for the Q-range of the pin-hole SANS facility (SANS-II at SINQ) used for the in-situ measurements. The scattering from these precipitates is present but has nearly asymptotic character (i.e., decreases as Q−4 with increasing Q) and the size cannot be determined from such shape of the scattering curve. Nevertheless, the scattering from the large precipitates has to be included in the model. Therefore, we modeled the scattering from large precipitates by scattering from the particles of their expected size (according to TEM results—see Figure 1) in order to get a realistic approximation of their part of the scattering. Naturally, no conclusion for size and for absolute volume fraction of large precipitates was drawn from the fit parameters for this particular part of the scattering. The volume fraction of large precipitates was adjusted in such a way, that the total volume fraction was equal to 68% at maximum.
On the other hand, the volume fraction of the medium-size and small precipitates can be determined from the SANS data. The magnitude of the scattering cross section can be employed for the evaluation of the volume fraction providing that the scattering contrast Δρ is known. We approximated Δρ by the value 8.5 × 109 cm−2 (see the Experimental Section).

4.3. Formation and Dissolution of the Precipitates

The evaluation of the in-situ SANS data resulted in a series of size distributions of small and medium precipitates at different elevated temperatures. The determined distributions are depicted in Figure 7. Further parameters were derived from these size distributions.
Figure 8 summarizes temperature dependence of the volume fraction during formation and dissolution. The volume fraction of small- and medium-size precipitates determined from the magnitude of the scattering cross section using the estimated scattering contrast is reported.
Precipitation of small particles—previously suppressed due to the fast cooling from high temperature (900 °C)—appears only after heating to temperatures above 600 °C. While the small precipitates form only on reheating, there was a certain amount of medium-size precipitates present already at 400 °C (i.e., after the fast cooling from 900 °C).
The small- and medium-size precipitates are fully dissolved already around 875 °C. As can be seen from Figure 8, the dissolution process is size dependent: whereas the volume fraction of small precipitates decreases in the range 725–825 °C with increasing temperature, the volume fraction of the medium-size precipitates is constant or even slightly increases.
The volume fraction of small precipitates is at maximum in the temperature region 700–725 °C and is estimated to be around 0.045. On the other hand, there is less than 0.02 volume fraction of medium-size precipitates with maximum in the temperature region 775–800 °C. Figure 8 also shows total volume fraction of small- and medium-size precipitates with the maximum around 0.06 at 725 °C. Similarly as in [4], we estimate—thanks to the uncertainties in the scattering contrast determination—the error for the volume fraction determination of small- and medium-size precipitates to 30%.
The evolution of the size of the small precipitates after their formation could be determined from the in-situ SANS data. The size evolution for small- and medium-size precipitates in dependence on temperature and hold time is displayed in Figure 9. The small precipitates radii grew with time and temperature from 14 Å (at 625 °C) to 60 Å (at 850 °C, 50 min hold at the temperature).
The medium-size precipitates radii grew with time and temperature from 37 Å (at 400 °C) to 290 Å (at 775 °C, 50 min hold at the temperature). For the medium-size precipitates above 775 °C, it is not possible to determine their size due to the limited Q-range accessible at SANS-II and used for the measurement. Therefore, the size of medium-size precipitates was fixed for the evaluation of scattering curves above 775 °C, as shown in Figure 9.
In Figure 10, the volume fractions of individual precipitate populations are shown also for the temperatures, where large precipitates dissolve appreciably (particularly for temperatures 950, 1000, 1050 and 1120 °C). At 900 °C, both small- and medium-size precipitates are fully dissolved and only the large precipitates remain. Their volume fraction then gradually decreases with increasing temperature. Figure 10 also shows the total sum of all three precipitate populations.

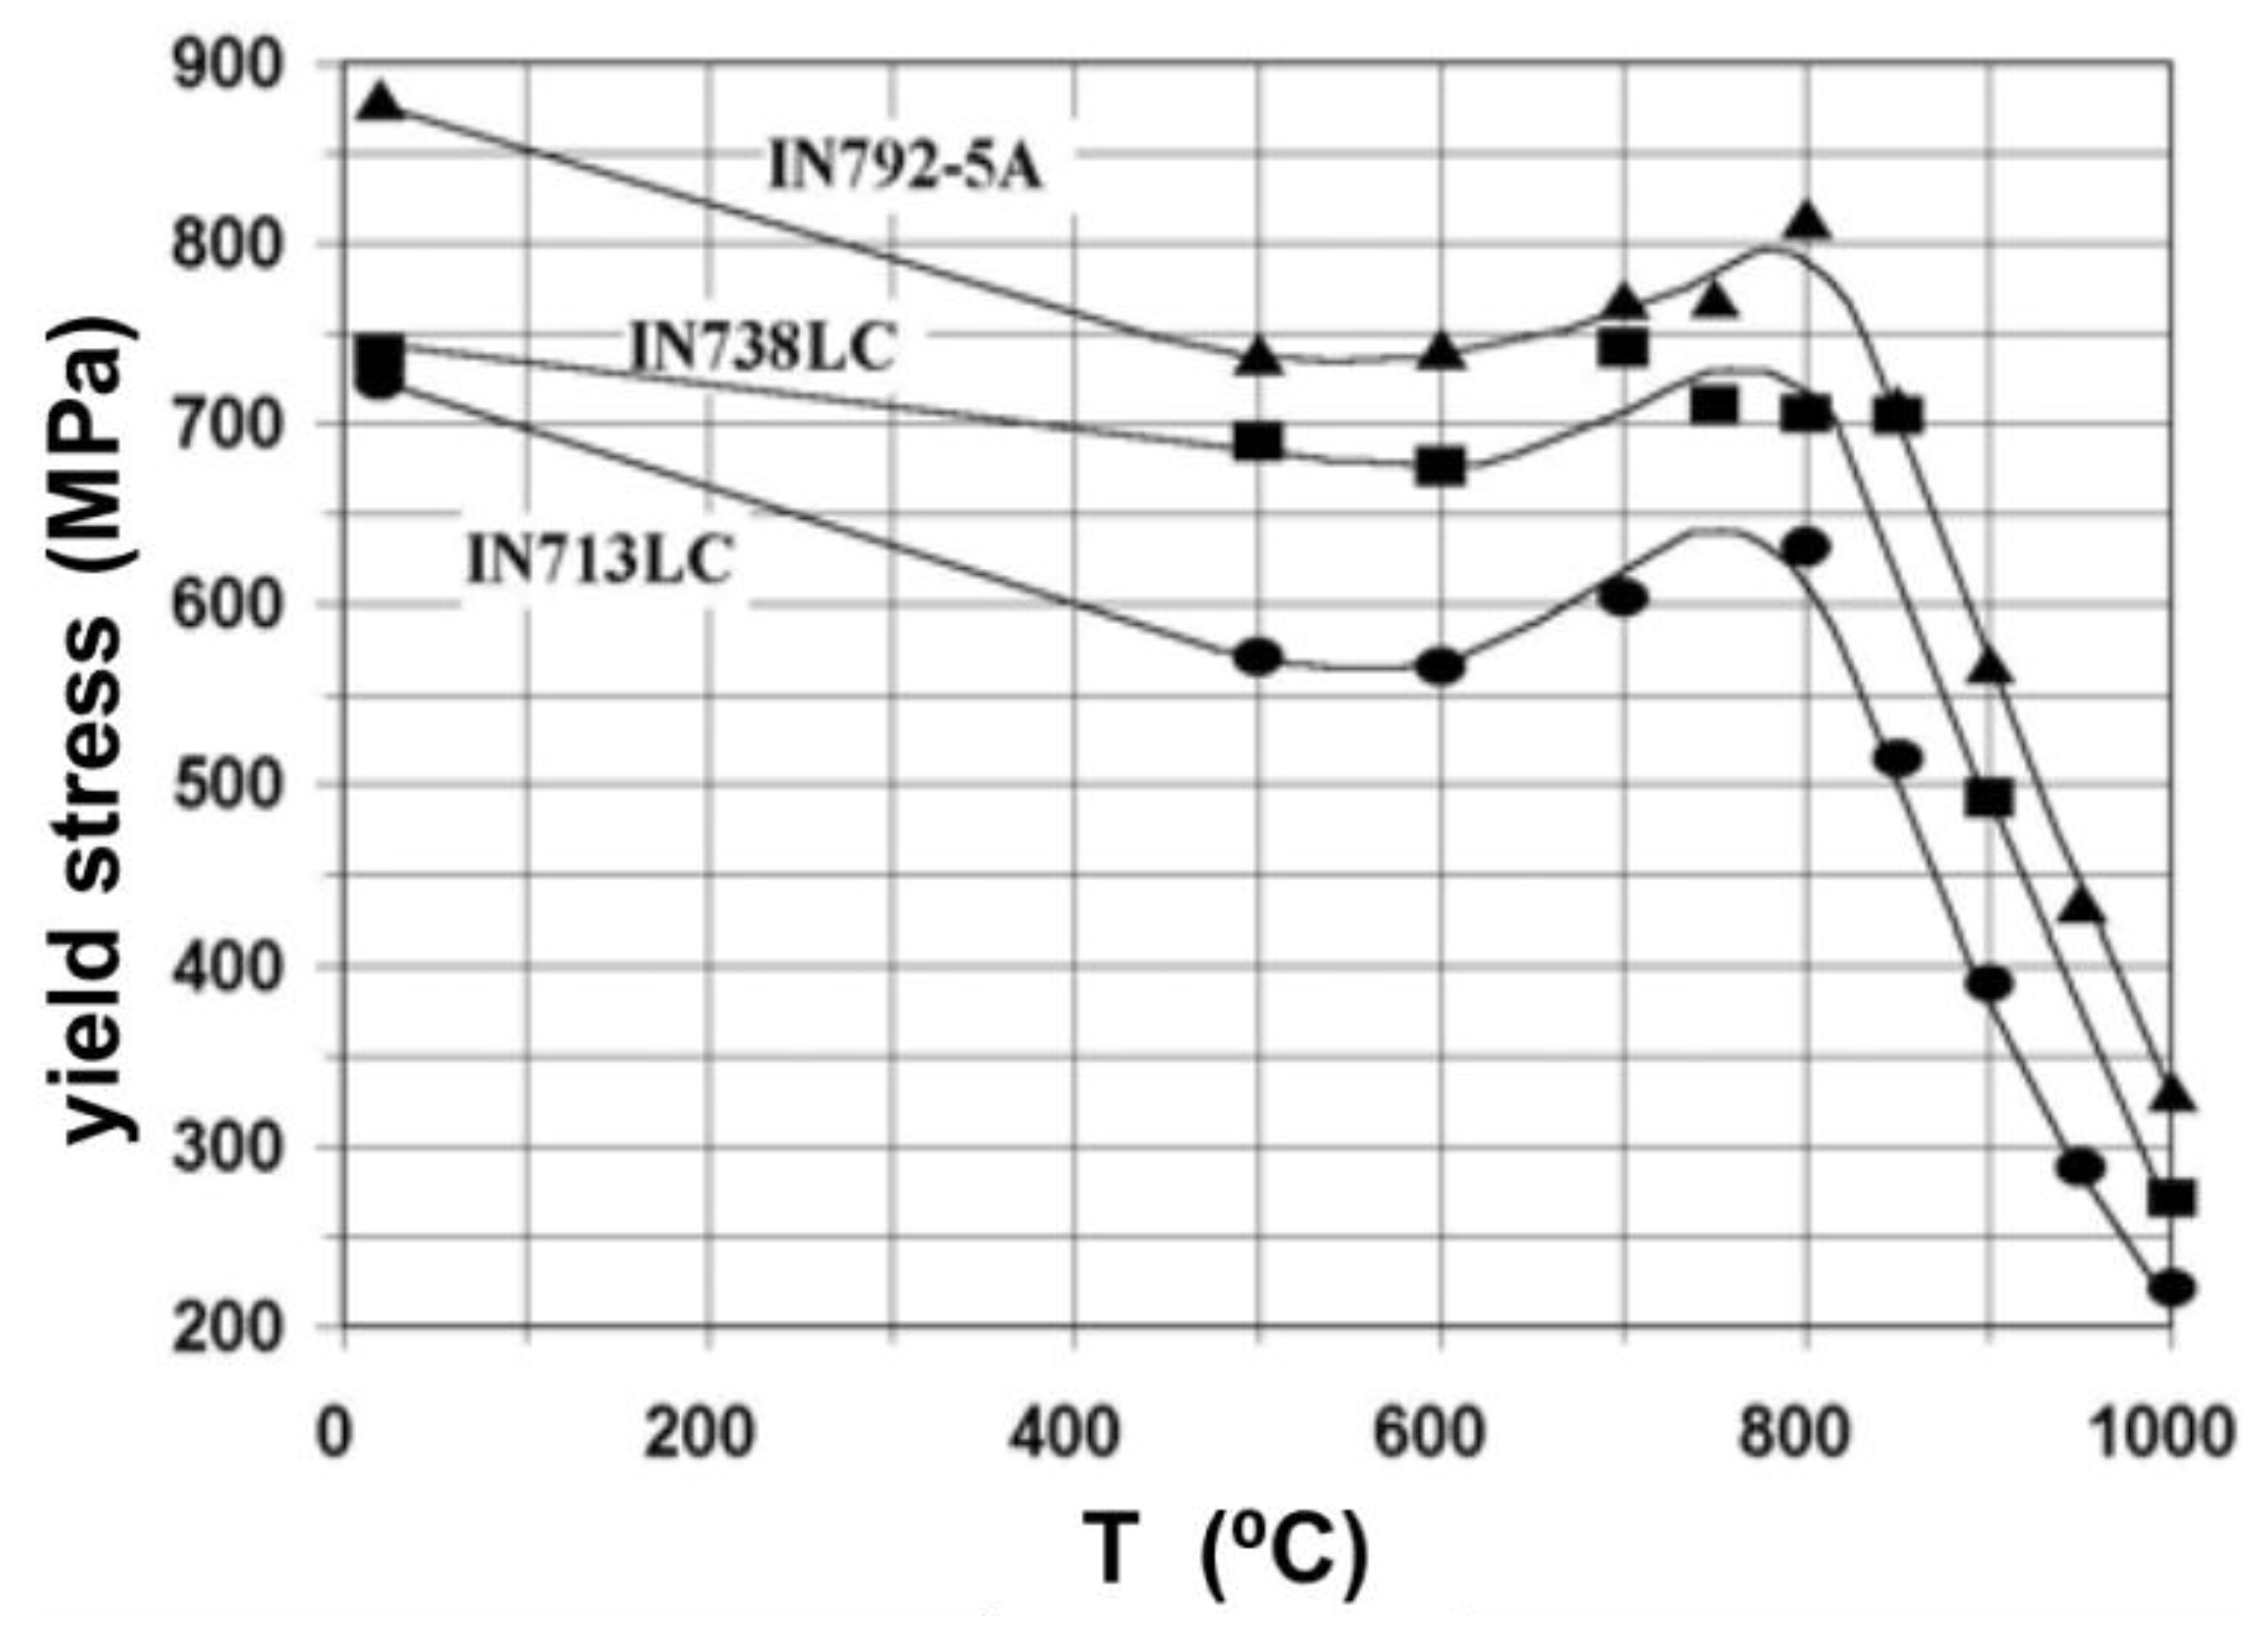
4.4. Strengthening by Tertiary Precipitates

As found by Kozar et al. for IN100 superalloy and its modification [6], the largest contribution to strengthening in multimodal superalloys are tertiary precipitates (they correspond in size to the small precipitates reported in the model used in this paper). Although there is several contributions for strengthening in polycrystalline superalloys (solid-solution strengthening, Hall–Petch mechanism, cross-slip pinning, strong pair-coupling, and weak pair-coupling), the main mechanism for the strengthening according to modeling [6] is—for alloy with large grains and significant amount of tertiary precipitates—weak pair-coupling due to tertiary (i.e., small, with size less than 10–20 nm for IN100) precipitates followed by the strong pair-coupling mechanism due to the presence of larger (secondary) precipitates.
The earlier models of precipitate strengthening like the one of Kozar et al. [6] were improved recently to unify the weak pair-coupling and the strong pair-coupling mechanism into one comprehensive model [7]. Moreover, this model can be used for complex multimodal precipitate distributions as well. The new modeling approach was tested on several types of polycrystalline superalloys (RR1000, Udimet, IN100, KM4). Nevertheless, the qualitative output of the novel modeling approach [7] is for tertiary precipitates the same as found by Kozar et al.: the tertiary, i.e., the small, precipitates provide the main part of strengthening.
Therefore, it is clear that small (tertiary) precipitates play a very significant role in strengthening. If they are formed at elevated temperatures in the channels between the larger (secondary) precipitates—as in our IN792-5A case—they certainly contribute to the strengthening of the superalloy and cause the increase of the yield strength with respect to lower temperatures. Moreover, the weak pair coupling strengthening, which is active up to the certain precipitate size, depends on the square root of precipitate size [6]. When the small precipitates grow, it thus additionally increases the strength of the alloy.
The last step of the standard heat treatment of the IN792-5A superalloy was the hold for 24 h at 845 °C, followed by air cooling. Such long hold resulted in microstructure with very low amount of tertiary precipitates (see Figure 8, small precipitate volume fraction at 845 °C) having, moreover, relatively large size. The relatively fast cooling (air cooling) from that temperature and slow kinetics hindered formation of new population of tertiary precipitates. Nevertheless, when heated again to elevated temperatures used for yield strength examination shown in Figure 2, new population of tertiary precipitates was formed during the tensile test in the temperature region 600–800 °C. It caused the observed (Figure 2) yield strength increase.

5. Conclusions

New precipitates in IN792-5A alloy arise at temperature (625 °C), higher than in IN738LC alloy (575 °C). The fast cooling from high temperature (900 °C) suppresses the precipitate formation due to the slow kinetics. The small precipitates (up to diameter of 120 Å) appear only after heating to temperatures higher than 600 °C. At temperatures above 875 °C, small precipitates are dissolved. The full dissolution of these small precipitates occurs in IN792-5A at a temperature that is approximately 25 K higher than in IN738LC alloy. The volume fraction of the small newly formed precipitates in IN792-5A is significantly lower than in IN738LC.
The size evolution and the volume fraction evolution of the small- and medium-size precipitates with temperature were determined. The maximum volume fraction of small precipitates at 725 °C is 4.5%. The full dissolution of the small- as well as the medium-size γ’ precipitates occurs around 875 °C. The presence of small- and medium-size precipitates in the temperature range 600–875 °C influences the yield strength of the IN792-5A alloy which exhibits an anomaly in this temperature range. Since the additional precipitation affects the mechanical properties of the alloy, these properties depend on the thermal history of the material. The observations in this study fit well with the modeling presented in earlier [6] or recent [7] studies highlighting significance of strengthening by tertiary precipitates in polycrystalline superalloys.
The volume fraction evolution of large primary γ’ precipitates at and above 900 °C was estimated. It was found that 1120 °C solution treatment (40 min) is not sufficient for their full dissolution.

Acknowledgments

The support by GACR project No. 14-36566G is gratefully acknowledged. The authors thank SINQ (PSI Villigen, Switzerland) and NPL (CANAM), NPI Řež, Czech Republic) for providing beamtime and support for the SANS measurements. Infrastructure projects support (NMI3-II EC project No. 283883 and CZ MSMT project No. LM2011019) are gratefully acknowledged as well.

Author Contributions

Martin Petrenec prepared the samples. Pavel Strunz, Urs Gasser and Gergely Farkas carried out the experiments. Pavel Strunz analyzed the SANS data. Pavel Strunz, with the help of Martin Petrenec and Jaroslav Polák, interpreted the results. Pavel Strunz and Jaroslav Polák prepared and revised the manuscript.

Conflicts of Interest

The authors declare no conflict of interest.

References

  1. Ross, E.W.; Sims, C.T. Nickel-Base Alloys. In Superalloys II: High-Temperature Materials for Aerospace and Industrial Power, 2nd ed.; Sims, C.T., Stoloff, N.S., Hagel, W.C., Eds.; John Wiley and Sons: New York, NY, USA, 1987; Part 2, Chapter 4; pp. 97–134. [Google Scholar]
  2. Reed, R.C. The Superalloys, Fundamentals and Applications; Cambridge University Press: New York, NY, USA, 2006. [Google Scholar]
  3. Socrate, S.; Parks, D.M. Numerical determination of the elastic driving force for directional coarsening in Ni-superalloys. Acta Metall. 1993, 41, 2185–2209. [Google Scholar] [CrossRef]
  4. Strunz, P.; Petrenec, M.; Gasser, U.; Tobiáš, J.; Polák, J.; Šaroun, J. Precipitate microstructure evolution in exposed IN738LC superalloy. J. Alloy. Compd. 2014, 589, 462–471. [Google Scholar] [CrossRef]
  5. Kostorz, G. Small-Angle Scattering and Its Applications to Materials Science. In Neutron Scattering: Treatise on Materials Science and Technology; Kostorz, G., Ed.; Academic Press: New York, NY, USA, 1979; pp. 227–289. [Google Scholar]
  6. Kozar, R.W.; Suzuki, A.; Milligan, W.W.; Schirra, J.J.; Savage, M.F.; Pollock, T.M. Strengthening mechanisms in polycrystalline multimodal nickel-base superalloys. Metallurgical and Mater. Trans. A 2009, 40, 1588–1603. [Google Scholar] [CrossRef]
  7. Galindo-Nava, E.I.; Connor, L.D.; Rae, C.M.F. On the prediction of the yield stress of unimodal and multimodal gamma’ Nickel-base superalloys. Acta Mater. 2015, 98, 377–390. [Google Scholar] [CrossRef]
  8. Rogante, M.; Lebedev, V.T. Small angle neutron scattering comparative investigation of Udimet 520 and Udimet 720 samples submitted to different ageing treatments. J. Alloy. Compd. 2012, 513, 510–517. [Google Scholar] [CrossRef]
  9. Strunz, P.; Zrník, J.; Epishin, A.; Link, T.; Balog, S. Microstructure of creep-exposed single crystal nickel base superalloy CSMX4. J. Phys.: Conf. Ser. 2010, 247. [Google Scholar] [CrossRef]
  10. Veron, M.; Bastie, P. Strain induced directional coarsening in nickel based superalloys: Investigation on kinetics using the small angle neutron scattering (SANS) technique. Acta Mater. 1997, 45, 3277–3282. [Google Scholar] [CrossRef]
  11. Miller, R.J.R.; Messoloras, S.; Stewart, R.J.; Kostorz, G. Small-angle neutron-scattering study of temperature and stress dependence of microstructure of Nimonic alloys. J. Appl. Cryst. 1978, 11, 583–588. [Google Scholar] [CrossRef]
  12. Mukherji, D.; Del Genovese, D.; Strunz, P.; Gilles, R.; Wiedenmann, A.; Rösler, J. Microstructural characterisation of a Ni-Fe-based superalloy by in situ small-angle neutron scattering measurements. J. Phys.: Condens. Matter. 2008, 20. [Google Scholar] [CrossRef]
  13. Zickler, G.A.; Schnitzer, R.; Radis, R.; Hochfellner, R.; Schweins, R.; Stockinger, M.; Leitner, H. Microstructure and mechanical properties of the superalloy ATI Allvac® 718Plus™. Mater. Sci. Eng. A 2009, 523, 295–303. [Google Scholar] [CrossRef]
  14. Strunz, P.; Schumacher, G.; Klingelhöffer, H.; Wiedenmann, A.; Šaroun, J.; Keiderling, U. In situ observation of morphological changes of γ’ precipitates in a pre-deformed single-crystal Ni-base superalloy. J. Appl. Cryst. 2011, 44, 935–944. [Google Scholar] [CrossRef]
  15. Collins, D.M.; Stone, H.J. A modelling approach to yield strength optimisation in a nickel-base superalloy. Int. J. Plast. 2014, 54, 96–112. [Google Scholar] [CrossRef]
  16. Petrenec, M.; Obrtlík, K.; Polák, J.; Kruml, T. Fatigue behaviour of cast nickel based superalloy Inconel 792–5A at 700 °C. Mater. Technol. 2006, 40, 175–178. [Google Scholar]
  17. Dahl, K.V.; Hald, J. Identification of Precipitates in an IN792 Gas Turbine Blade after Service Exposure. Pract. Metallogr. 2013, 50, 432–450. [Google Scholar] [CrossRef]
  18. Petrenec, M.; Obrtlík, K.; Polák, J.; Man, J. Dislocation structures in nickel based superalloy Inconel 792–5A fatigued at room temperature and 700 °C. Mater. Sci. Forum 2008, 567–568, 429–432. [Google Scholar] [CrossRef]
  19. Podhorská, B.; Kudrman, J.; Hrbáček, K. Tepelné zpracování, mechanické vlastnosti a strukturní stabilita perspektivních litých niklových superslitin (in Czech). In METAL 2004, Proceedings of the 13th International Metallurgical & Material Conference, Hradec nad Moravicí, Czech Republic, May 2004; Tanger: Ostrava, Czech Republic, 2004; pp. 101–111. [Google Scholar]
  20. Strunz, P.; Petrenec, M.; Gasser, U. Precipitate microstructure evolution in low-cycle fatigued Inconel superalloys. In Proceedings of the 15th International Small-Angle Scattering Conference; Sydney, Australia, 18–23 November 2012, McGillivary, D., Trewhella, J., Gilbert, E.P., Hanley, T.L., Eds.; Australian Nuclear Science and Technology Organization: Lucas Heights, New South Wales, Australia; 1921268158P039, Metals and Metallic Materials Symposium. Available online: http://trove.nla.gov.au/version/197519597 (accessed on 1 December 2015).
  21. Strunz, P.; Mortensen, K.; Janssen, S. SANS-II at SINQ: Installation of the former Risø-SANS facility. Phys. B 2004, 350, e783–e785. [Google Scholar] [CrossRef]
  22. Strunz, P.; Šaroun, J.; Mikula, P.; Lukáš, P.; Eichhorn, F. Double-Bent-Crystal Small-Angle Neutron Scattering setting and its applications. J. Appl. Cryst. 1997, 30, 844–848. [Google Scholar] [CrossRef]
  23. Strunz, P.; Šaroun, J.; Keiderling, U.; Wiedenmann, A.; Przenioslo, R. General formula for determination of cross-section from measured SANS intensities. J. Appl. Cryst. 2000, 33, 829–833. [Google Scholar] [CrossRef]
  24. Strunz, P.; Gilles, R.; Mukherji, D.; Wiedenmann, A. Evaluation of anisotropic small-angle neutron scattering data; a faster approach. J. Appl. Cryst. 2003, 36, 854–859. [Google Scholar] [CrossRef]
  25. Kohlbrecher, J. SASfit: A Program for Fitting Simple Structural Models to Small Angle Scattering Data. 2014. Available online: https://kur.web.psi.ch/sans1/SANSSoft/sasfit.html, https://kur.web.psi.ch/sans1/SANSSoft/sasfit.pdf (accessed on 1 December 2015).
Figure 1. Transmission Electron Microscopy (dark field) micrograph of IN792-5A.
Metals 06 00037 g001
Figure 2. Temperature dependence of the yield stress for three Inconel superalloys. An anomaly (yield stress increase) was observed in the temperature region 600–800 °C [19].
Metals 06 00037 g002
Figure 3. Thermal history for the in situ investigated sample. Different regions for the study of precipitate formation and dissolution by Small-Angle Neutron Scattering are marked.
Metals 06 00037 g003
Figure 4. The large-Q part of the selected scattering curves (the scattering cross section dΣ/dΩ (Q)) taken at different temperatures in order to detect formation of the precipitates. Precipitates start to form only during 625 °C hold.
Metals 06 00037 g004
Figure 5. Selected scattering curves taken at different temperatures allowing detecting formation, evolution and dissolution of small precipitates. The solid lines are the fits of the model (discussed in “Evaluation and discussion” section) to the measured data.
Metals 06 00037 g005
Figure 6. Scattering curves at low Q-values for the temperatures at and above 900 °C.
Metals 06 00037 g006
Figure 7. Size distributions determined for small- and medium-size precipitates at various temperatures. They corresponds to the fitted curves in Figure 6. Rather narow peak corresponds to the small precipitates, which is followed (towards larger radiuses) by a broader peak corresponding to the medium-size precipitates.
Metals 06 00037 g007
Figure 8. Volume fraction evolution of small- and medium-size precipitates in dependence on temperature and hold time.
Metals 06 00037 g008
Figure 9. Size evolution of small- and medium-size precipitates in dependence on temperature and hold time.
Metals 06 00037 g009
Figure 10. Estimation of total volume fraction dependence on temperature for IN792-5A previously fast cooled from 900 °C.
Metals 06 00037 g010
Table 1. The chemical composition (wt. %) of the IN792-5A superalloy [16] and the approximate chemical composition of γ´ precipitates in this superalloy taken from the reference [17] determined by energy dispersive spectroscopy. (Note: Hf reported in 0.5% to be present in the alloy used in [17] was not present in the alloy used in the present experiment. Proportional adjustment for the other elements to 100% was done). Scattering length densities (SLDs) at room temperature of the respective alloy (average) and of the γ´ precipitates calculated using the given compositions are reported in the last column.
CrMoCCoFeZrNbAlBTiTaWNiSLD (109 cm−2)
alloy12.281.810.0788.870.160.0310.13.360.0153.984.124.1rest64.1
γ´3.484.924.617.177.172.56rest66.8

