
Evolution of the Annealing Twin Density during δ-Supersolvus Grain Growth in the Nickel-Based Superalloy Inconel™ 718

 , and
, and
Abstract
:
1. Introduction
2. Experimental Details for Quantitative Analysis of Twin Content

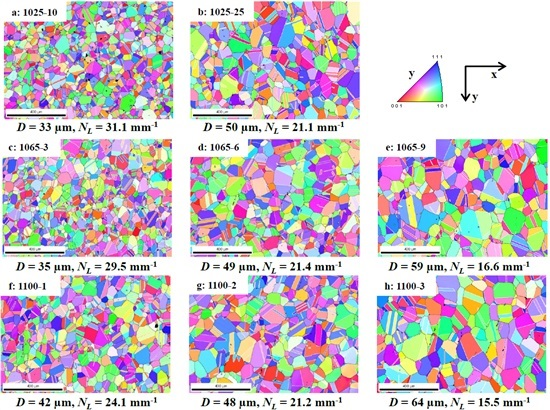
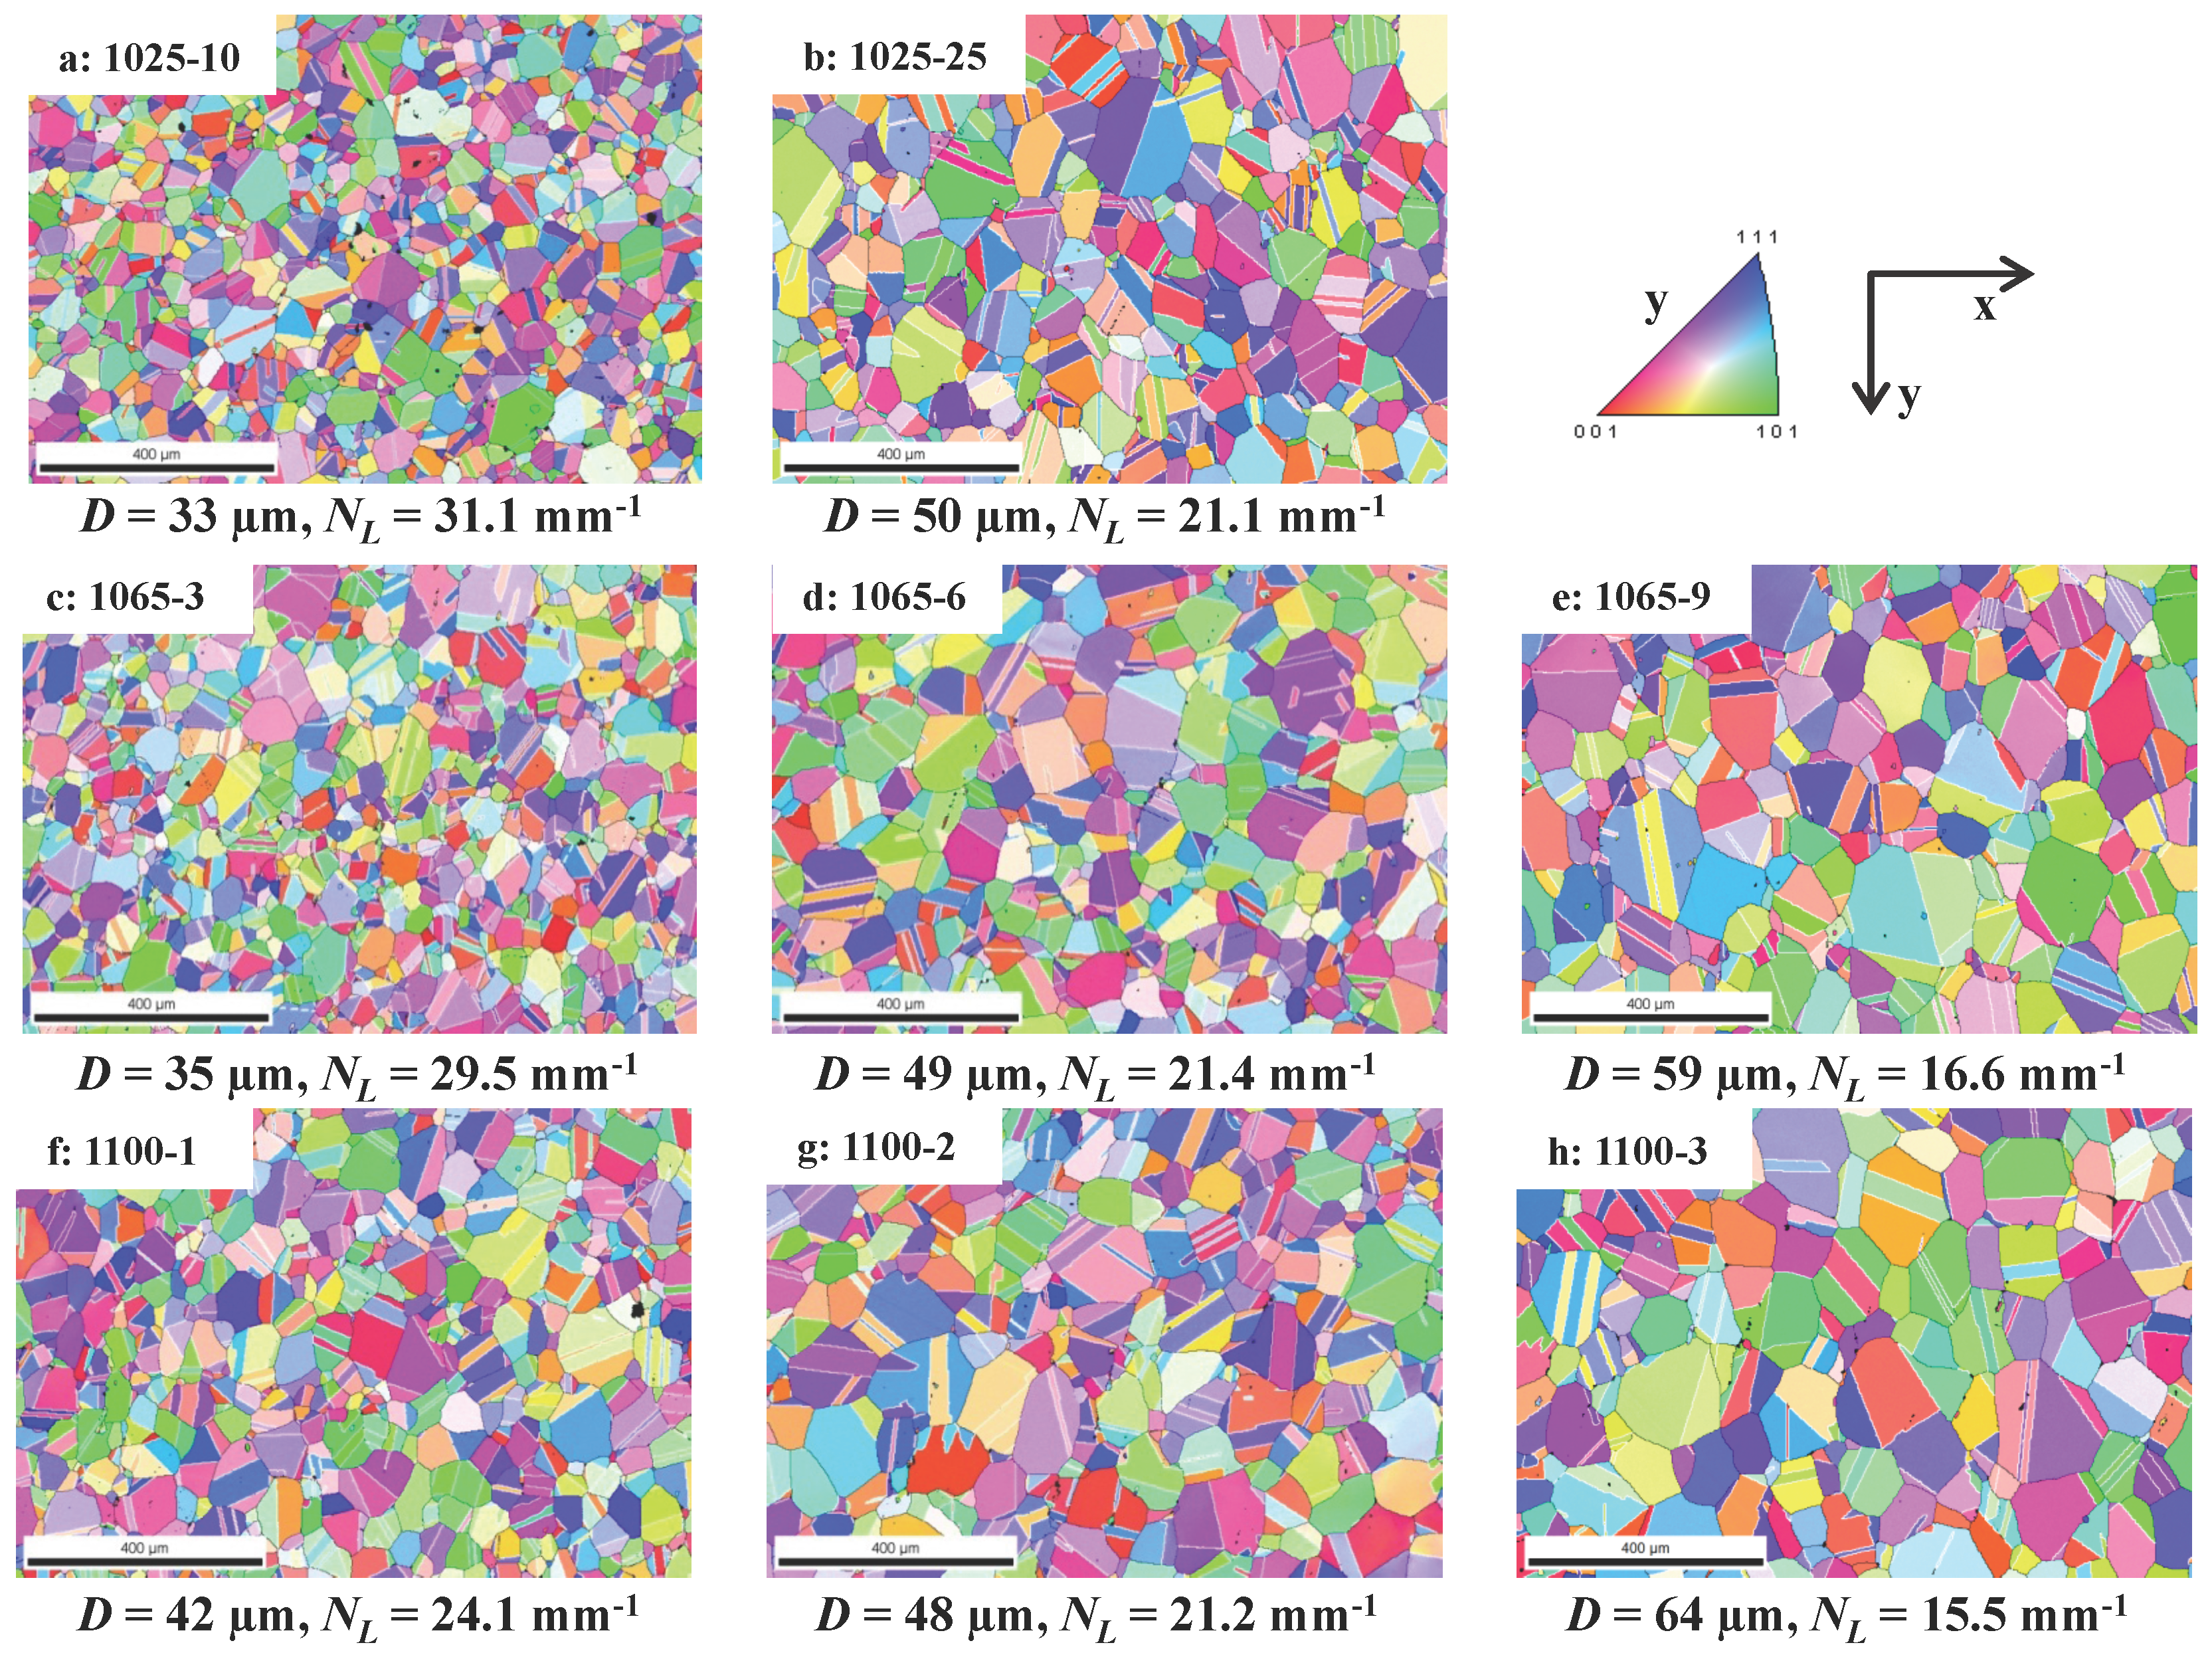
| Temperature | Applied Annealing Time | ||
|---|---|---|---|
| 1025 °C | 10 min | 25 min | |
| 1065 °C | 3 min | 6 min | 9 min |
| 1100 °C | 1 min | 2 min | 3 min |
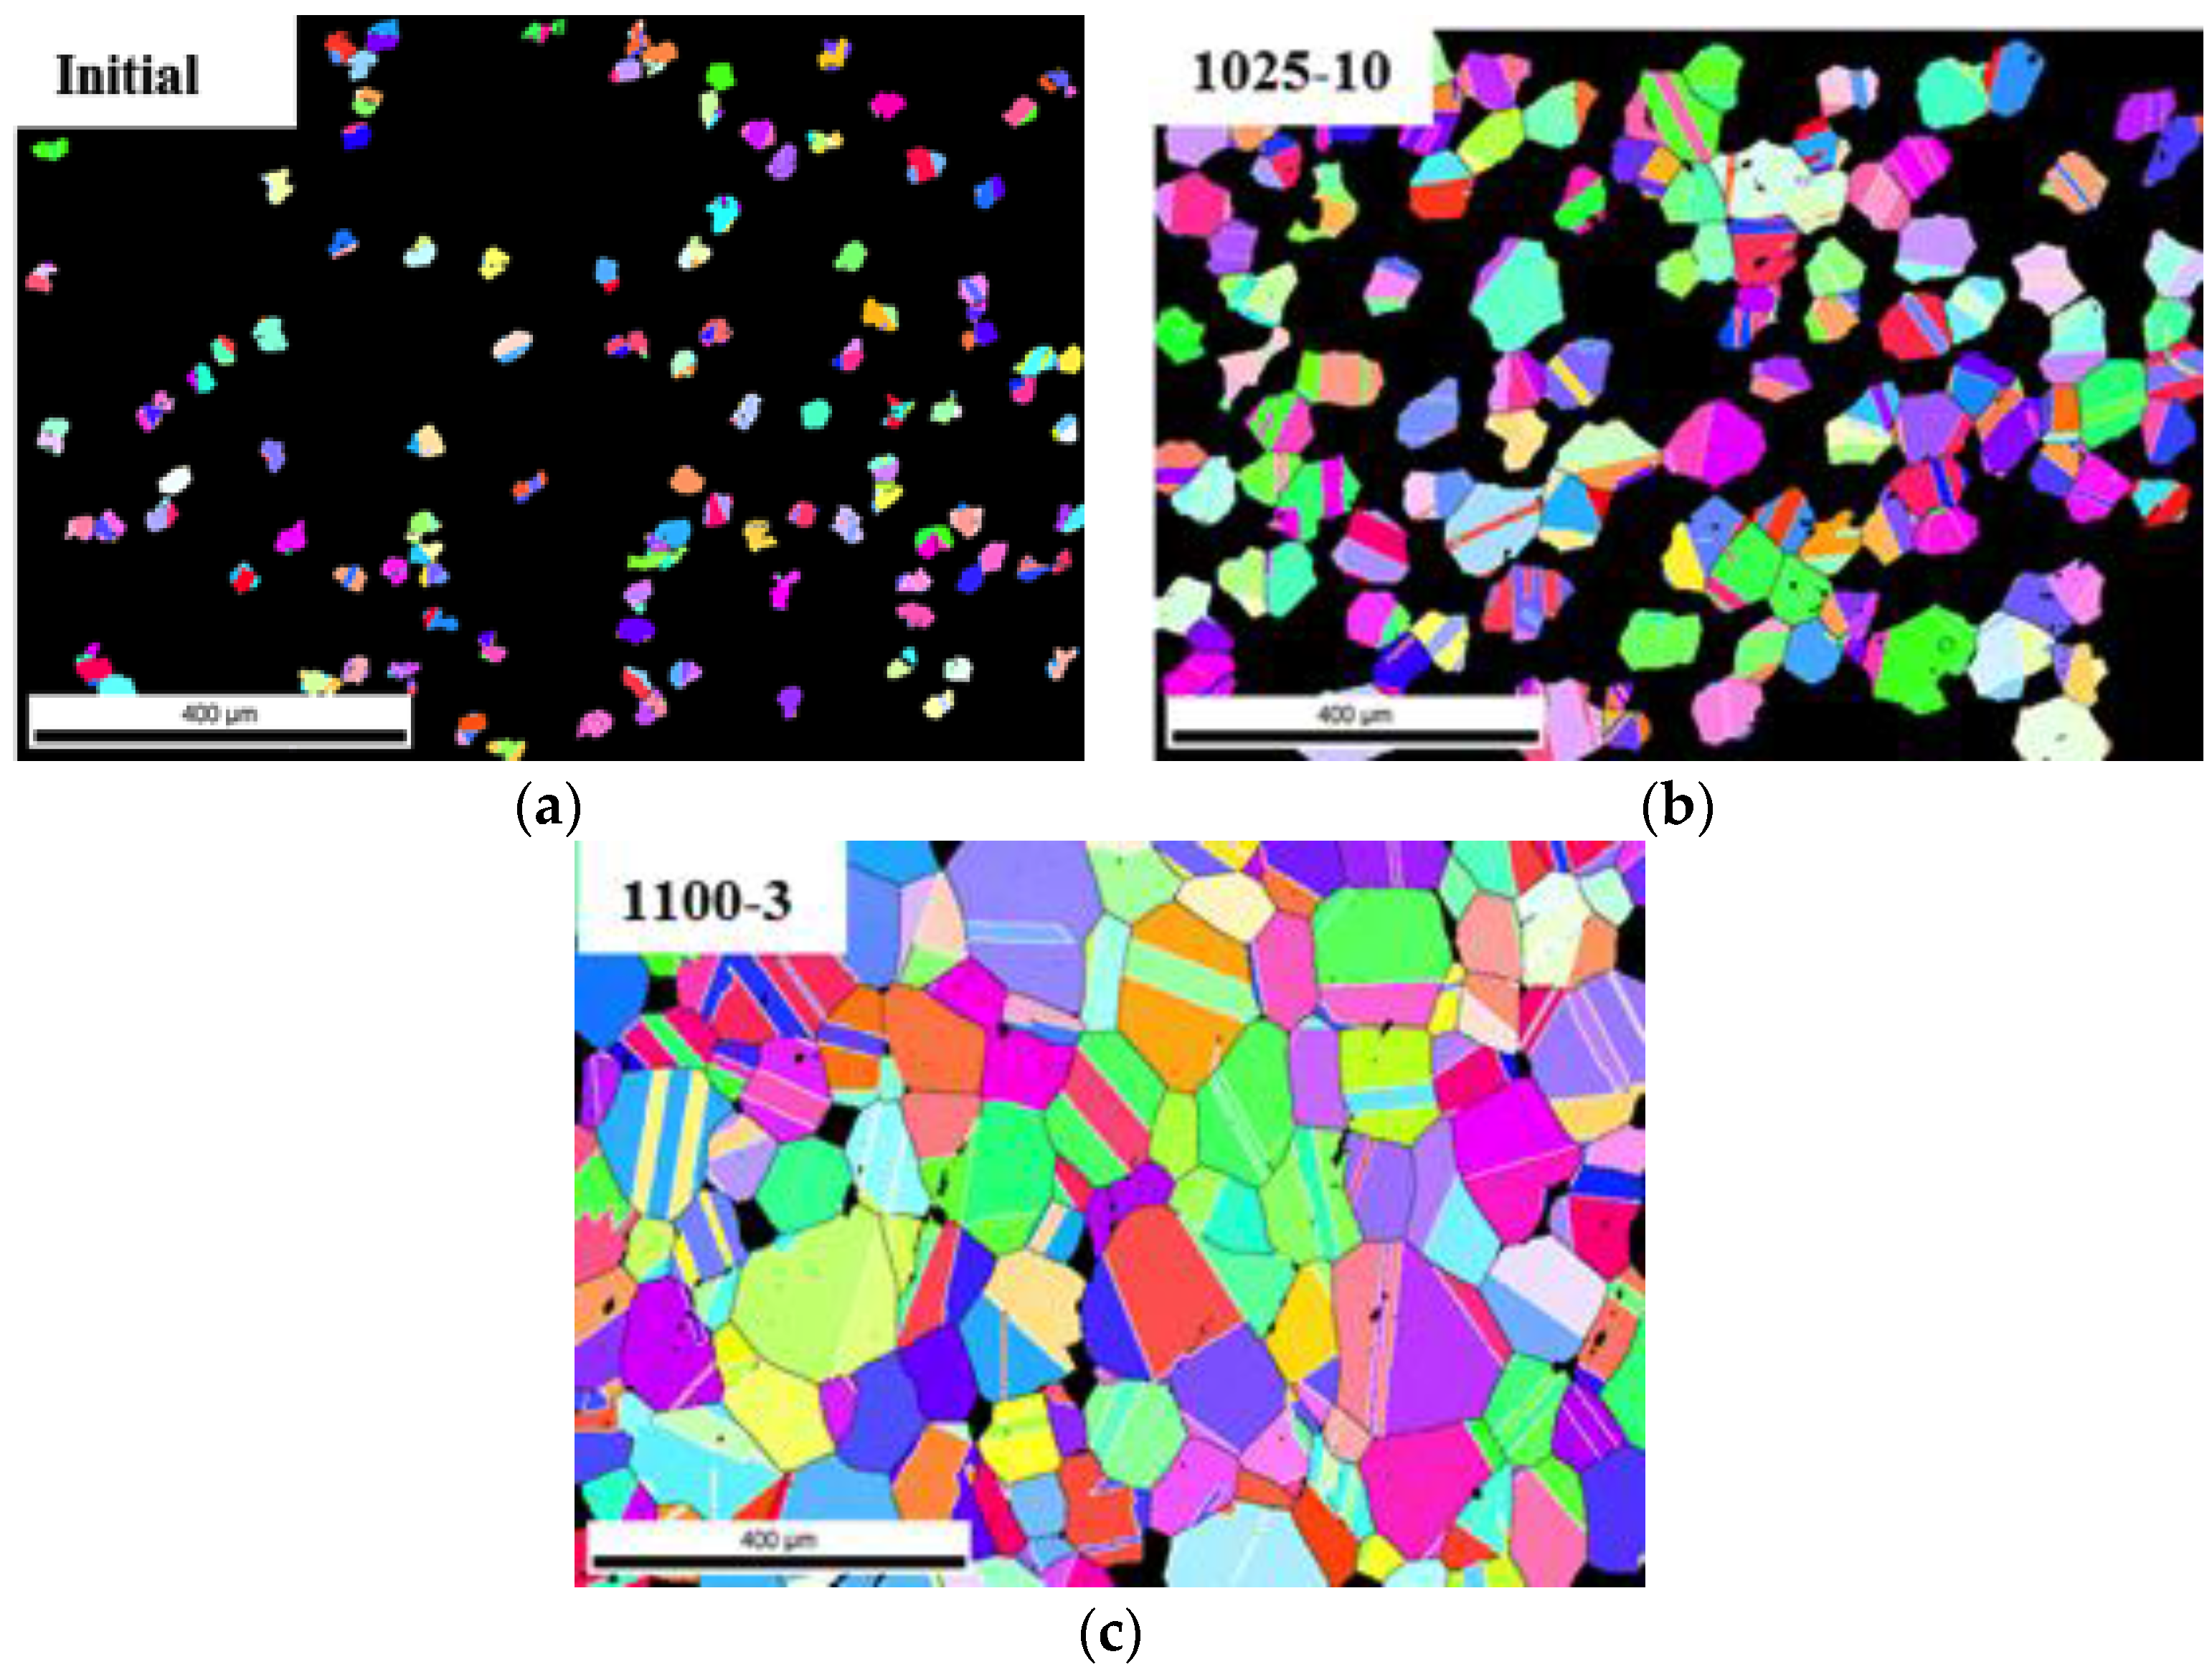
3. Experimental Results and Discussion of the Underlying Mechanisms

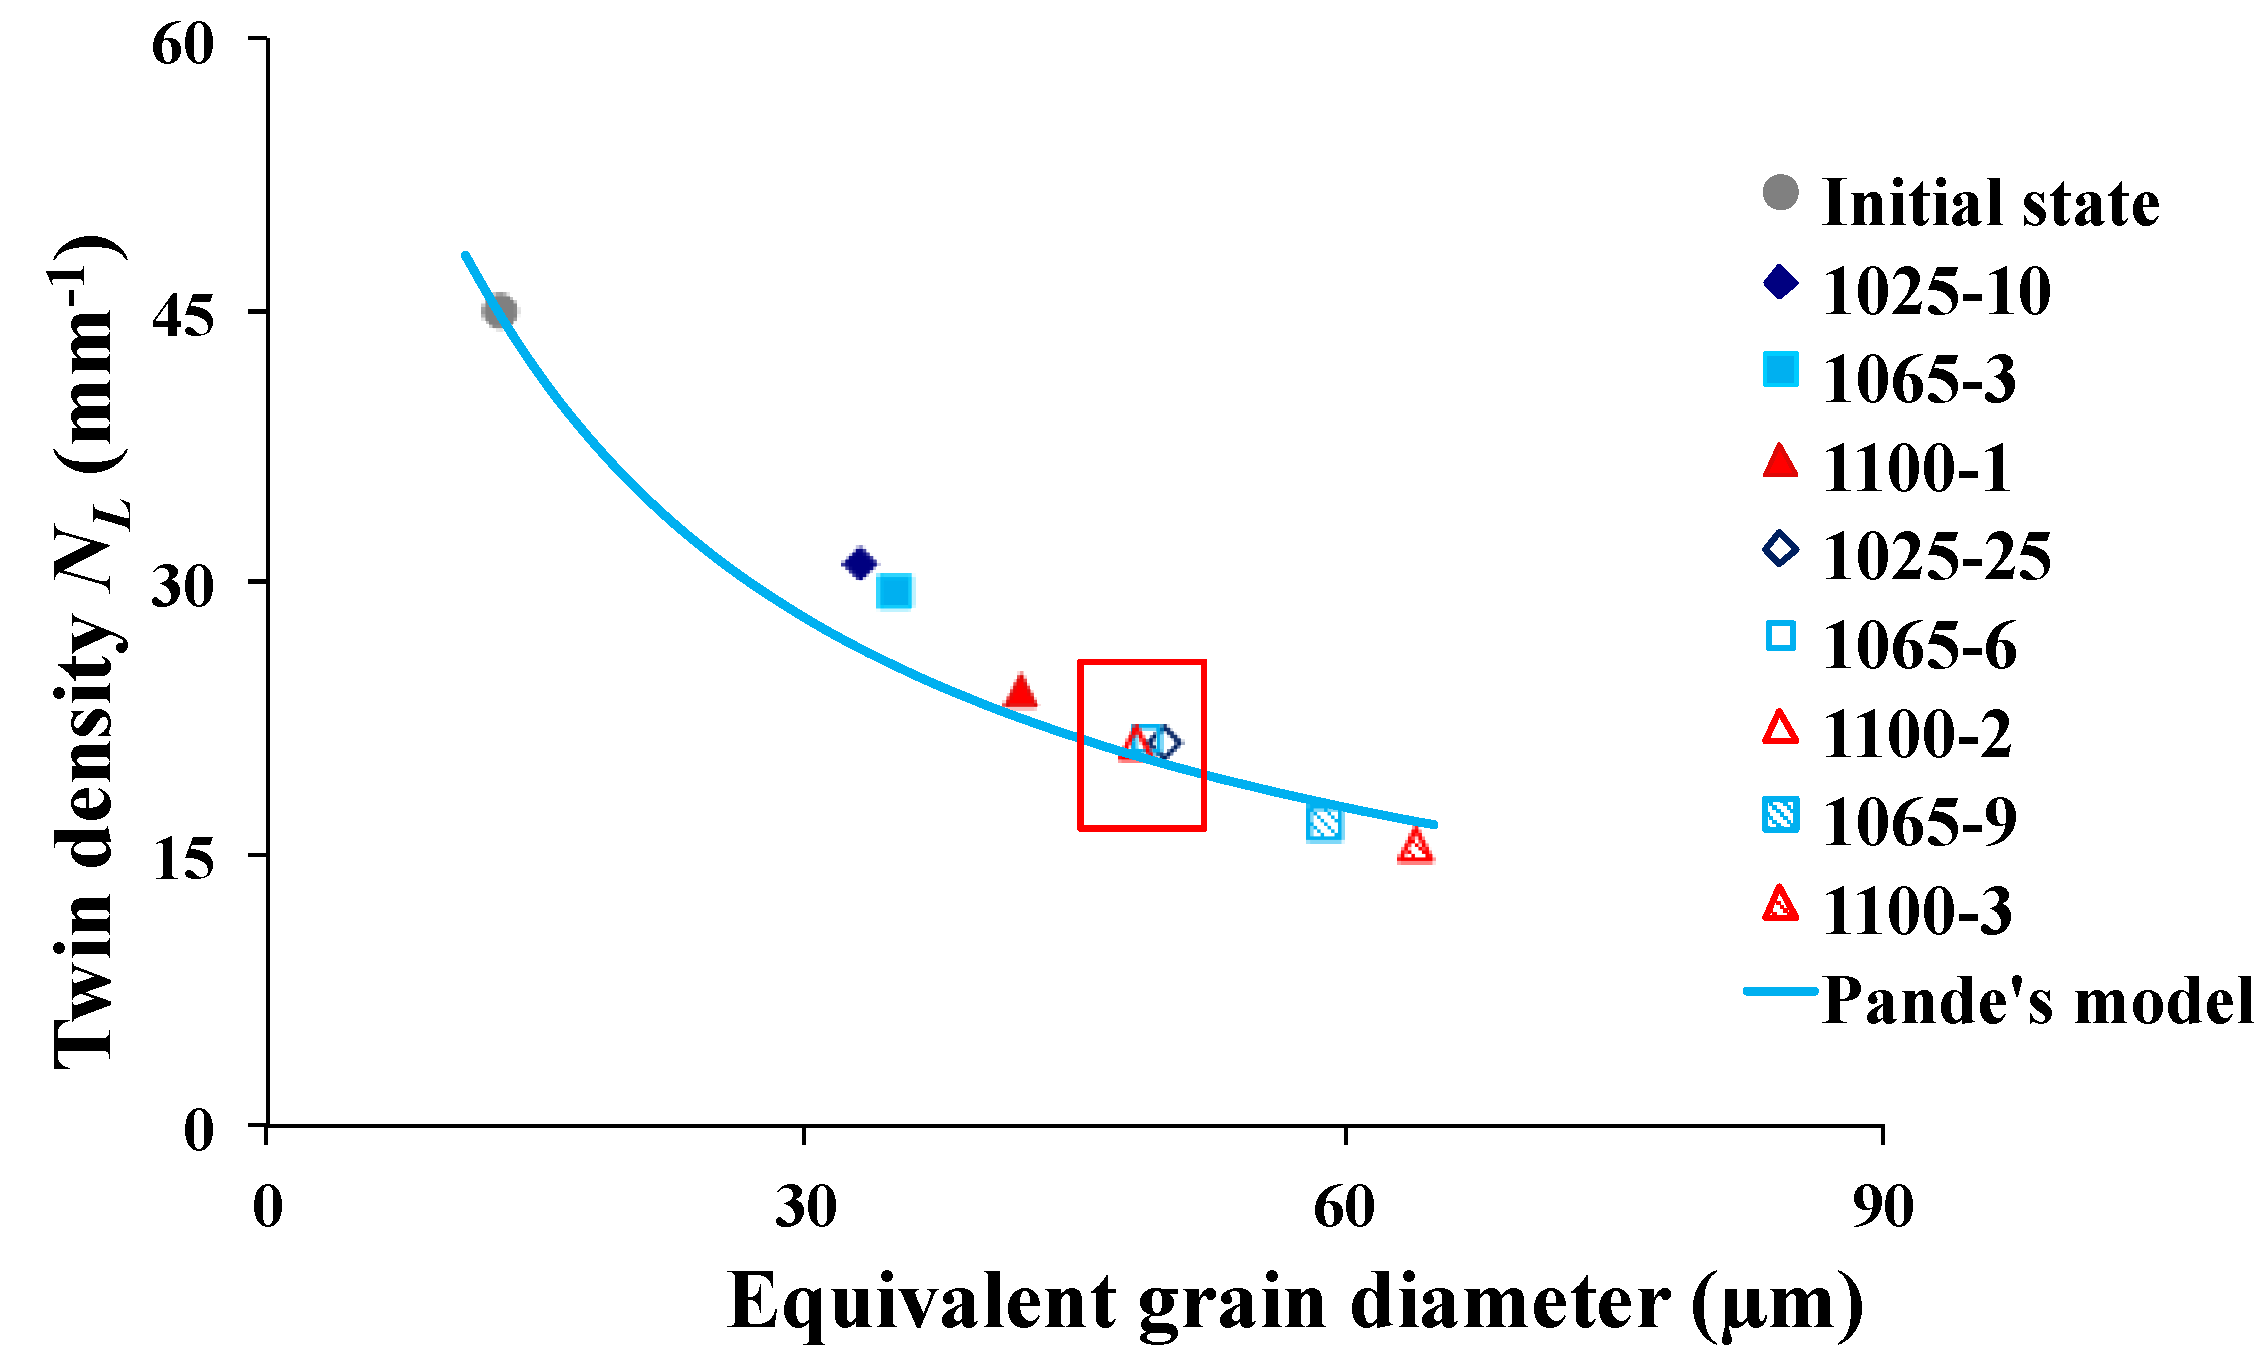
4. Literature Models for Predicting Twin Density Evolution
5. Description of the New Mean Field Model
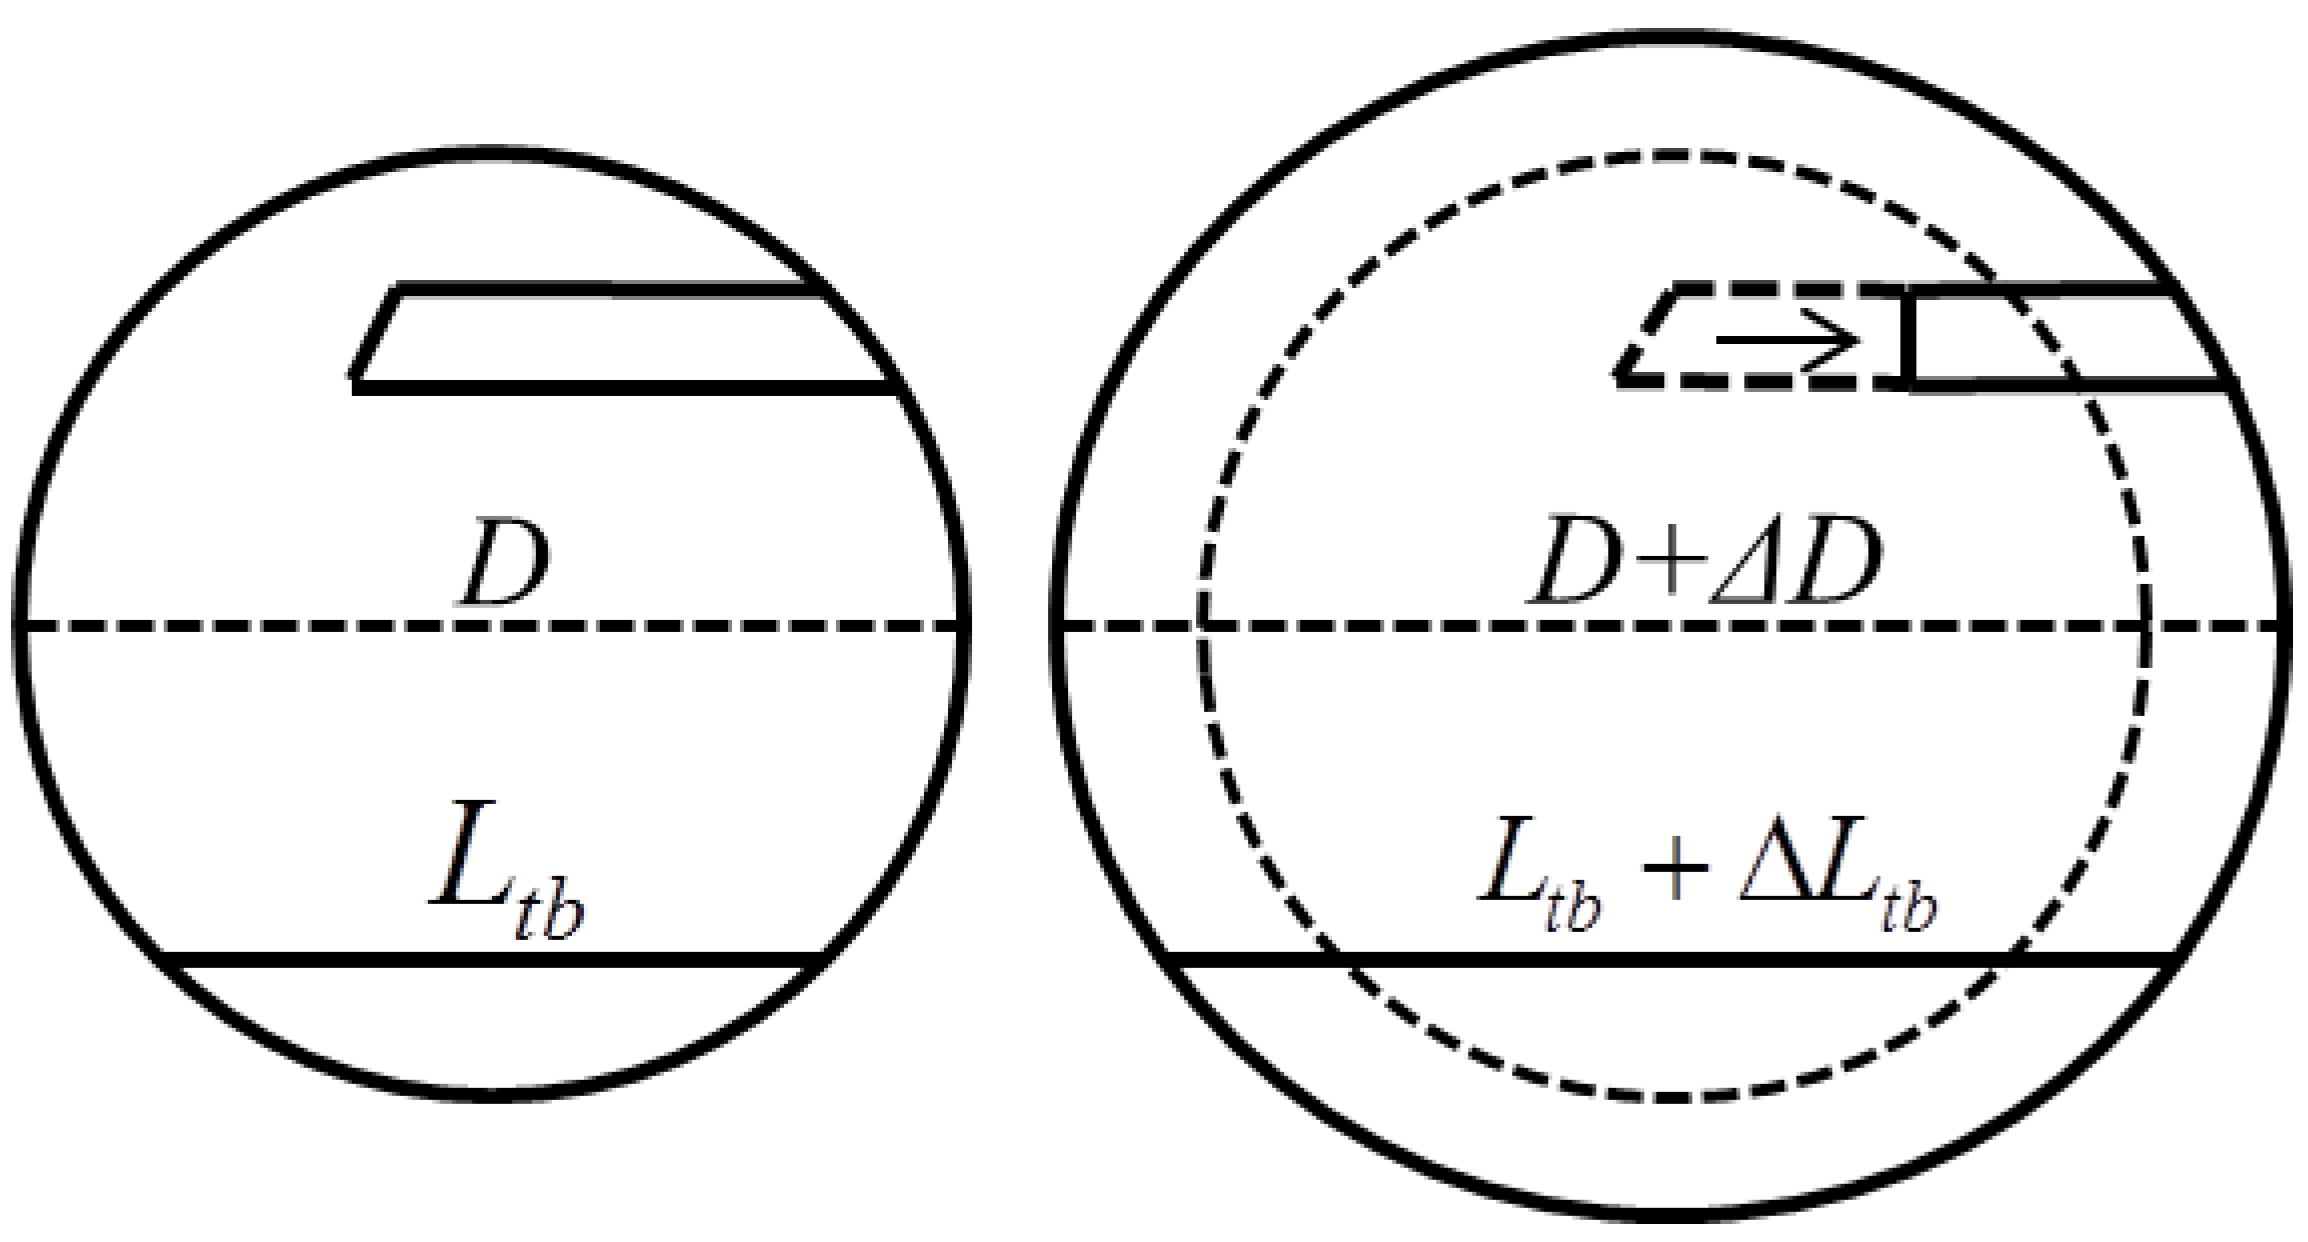
- For a coherent twin boundary spanning to the opposite side of the representative grain, since (equality occurs when is a diameter of the considered circular representative grains) and , we have ; thus k should in principle be higher than one. However, if there is more than one coherent twin boundary inside the representative grain, the total twin boundary length is not necessarily smaller than the representative grain diameter. In this case, the value of k depends also on the initial ratio between the twin boundary length and the representative grain diameter.
- Incoherent twin boundary segments may migrate inside representative grains to decrease the total twin boundary length. This may lead to the shortening of the considered twin boundary, even though the representative grain boundary migration tends to lengthen it, which is a reason for which k might be smaller than one.
- The diameter change of each representative grain is calculated using Equation (4). The volume conservation is naturally verified.
- The change in twin length for each category is calculated by Equation (5) using the twin boundary length in this category , since (when a grain category Gi is fully consumed by other categories, i.e., Di = 0, its corresponding twin boundary length, , is fixed to zero).
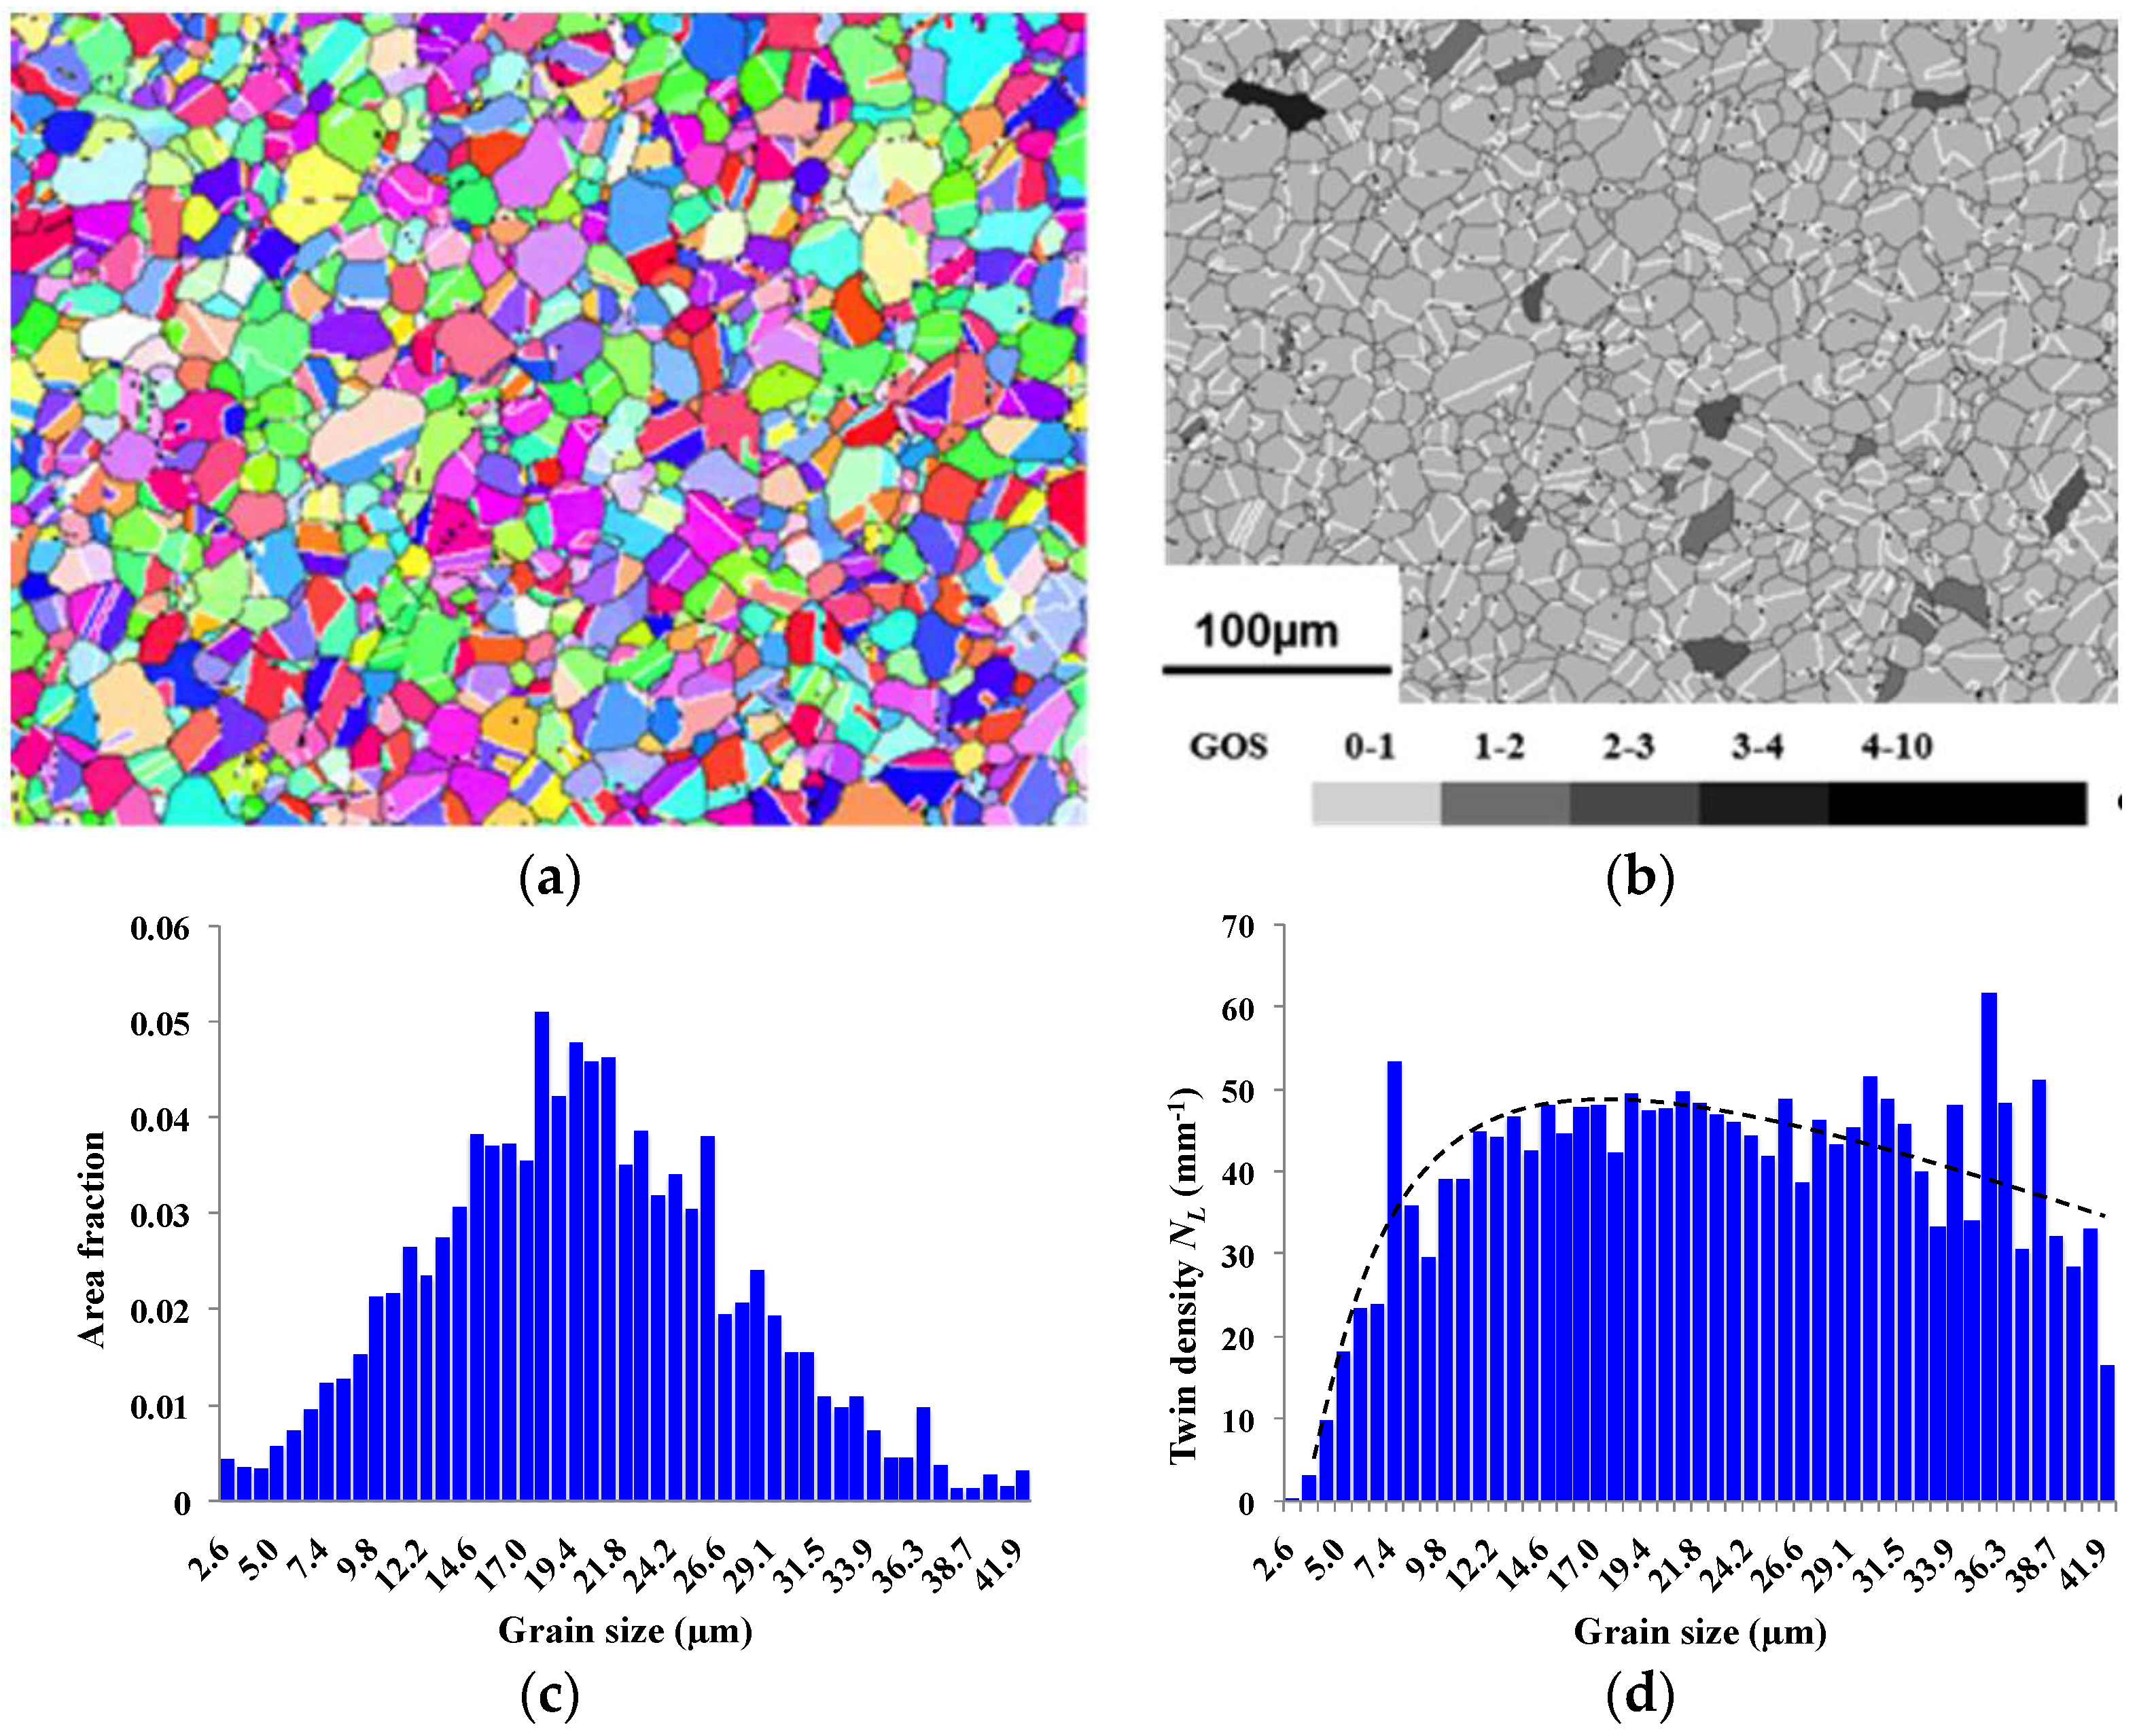
- The twin density in each category () is calculated via the twin boundary length in this category () and its area (NiSi) as follows:
- The average twin density in the overall microstructure is calculated from the summation of twin boundary lengths of each category and the overall area (S) as follows:
6. Mean Field Modeling of Twin Density Evolution during Grain Growth in Inconel™ 718


7. Discussion of the Relevance of the New Mean Field Model
8. Conclusions
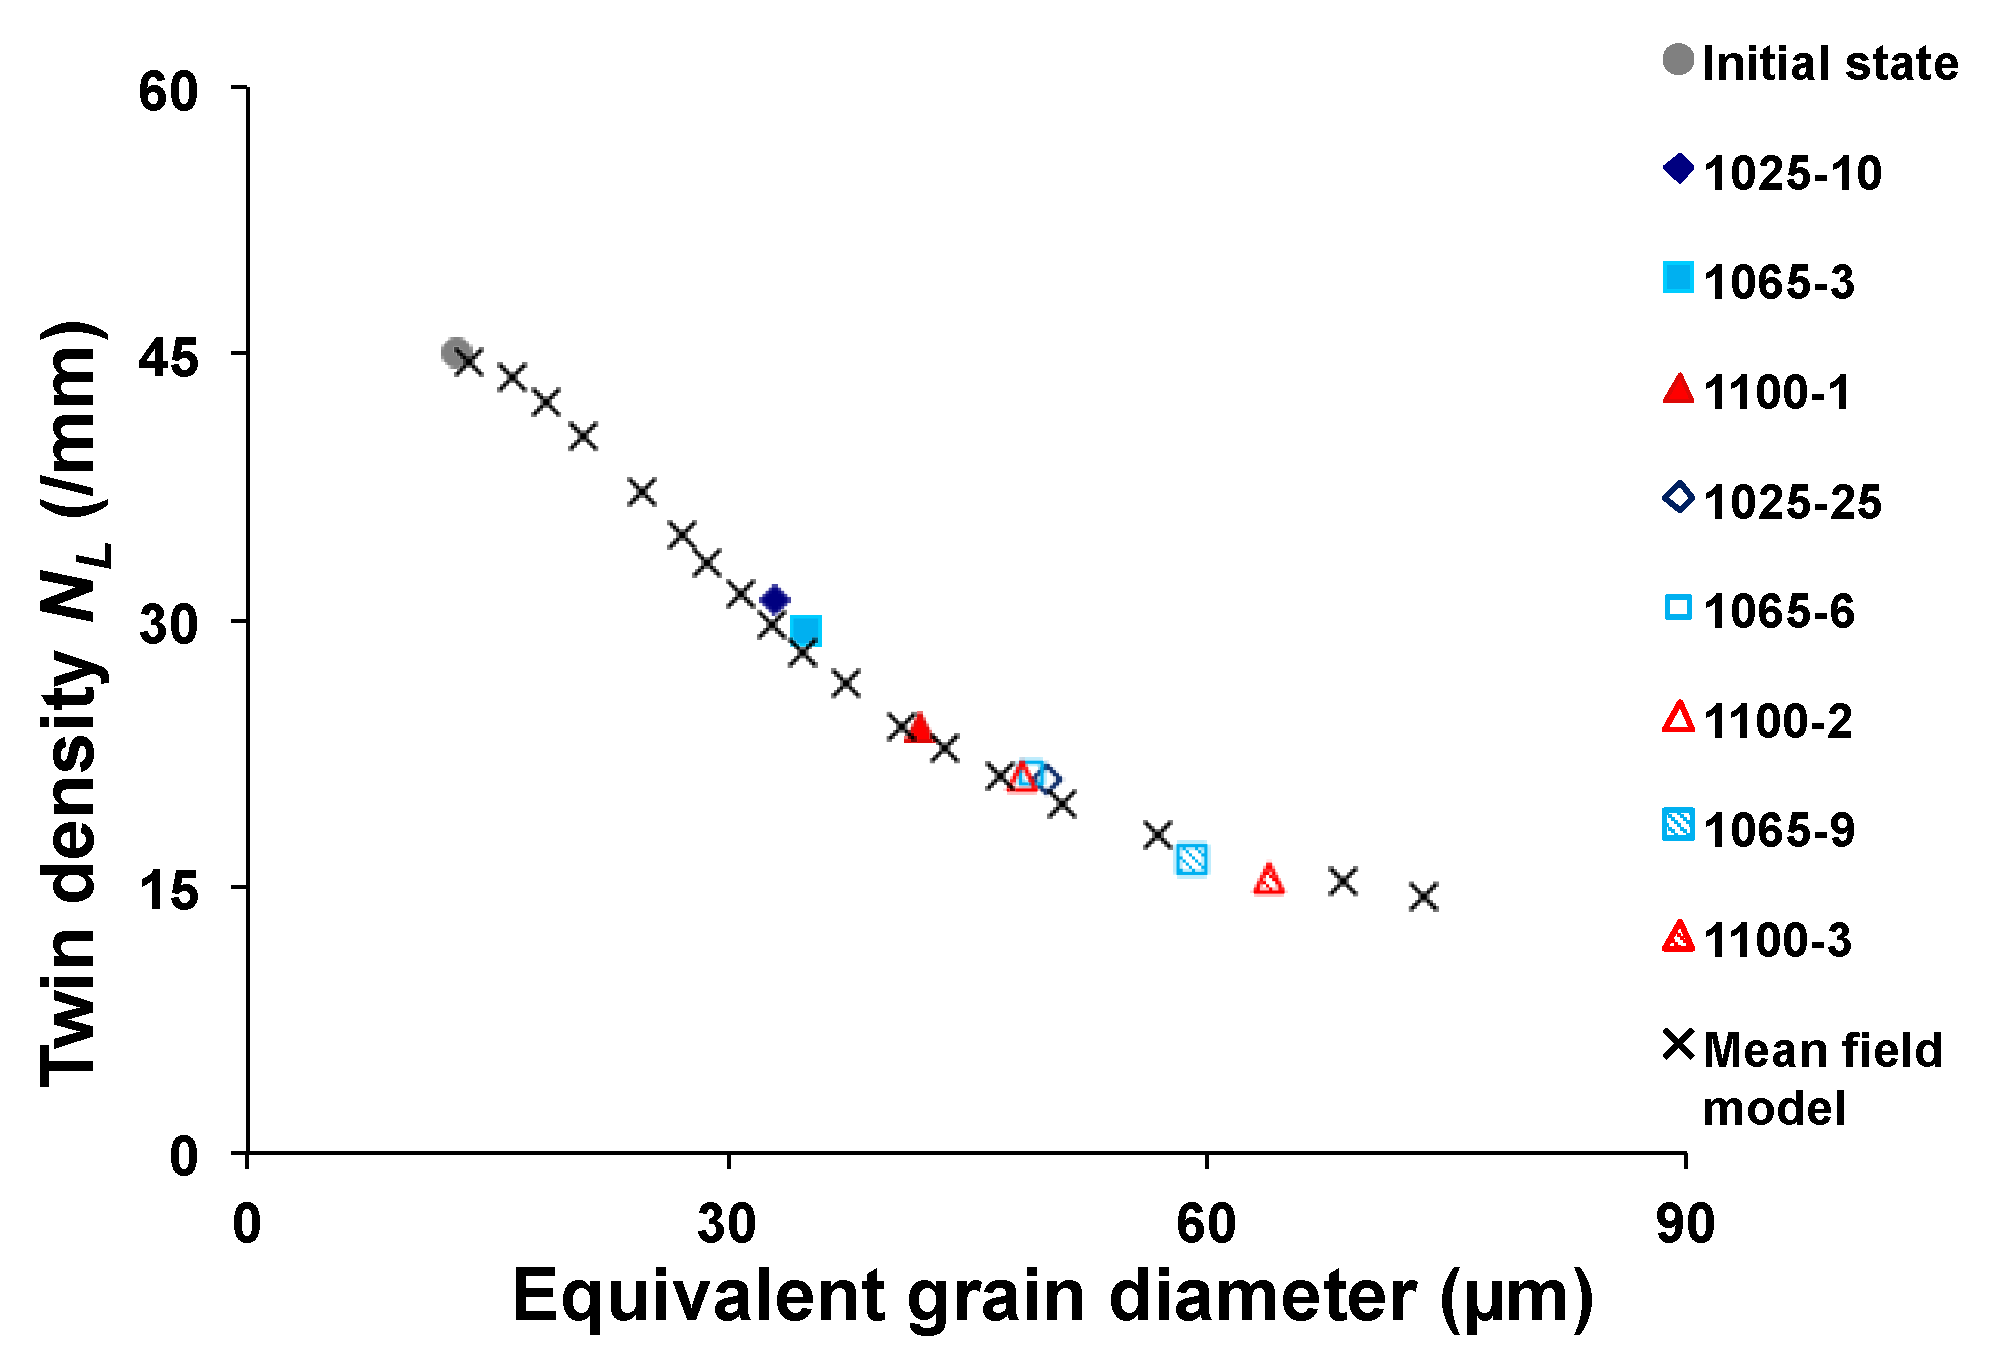
- Annealing twin density evolution in Inconel™ 718 during grain growth is independent of temperature and, thus, also of the average grain growth rate, in the observed temperature range (1025 to 1100 °C).
- Annealing twin density exhibits an inverse correlation with the average grain size.
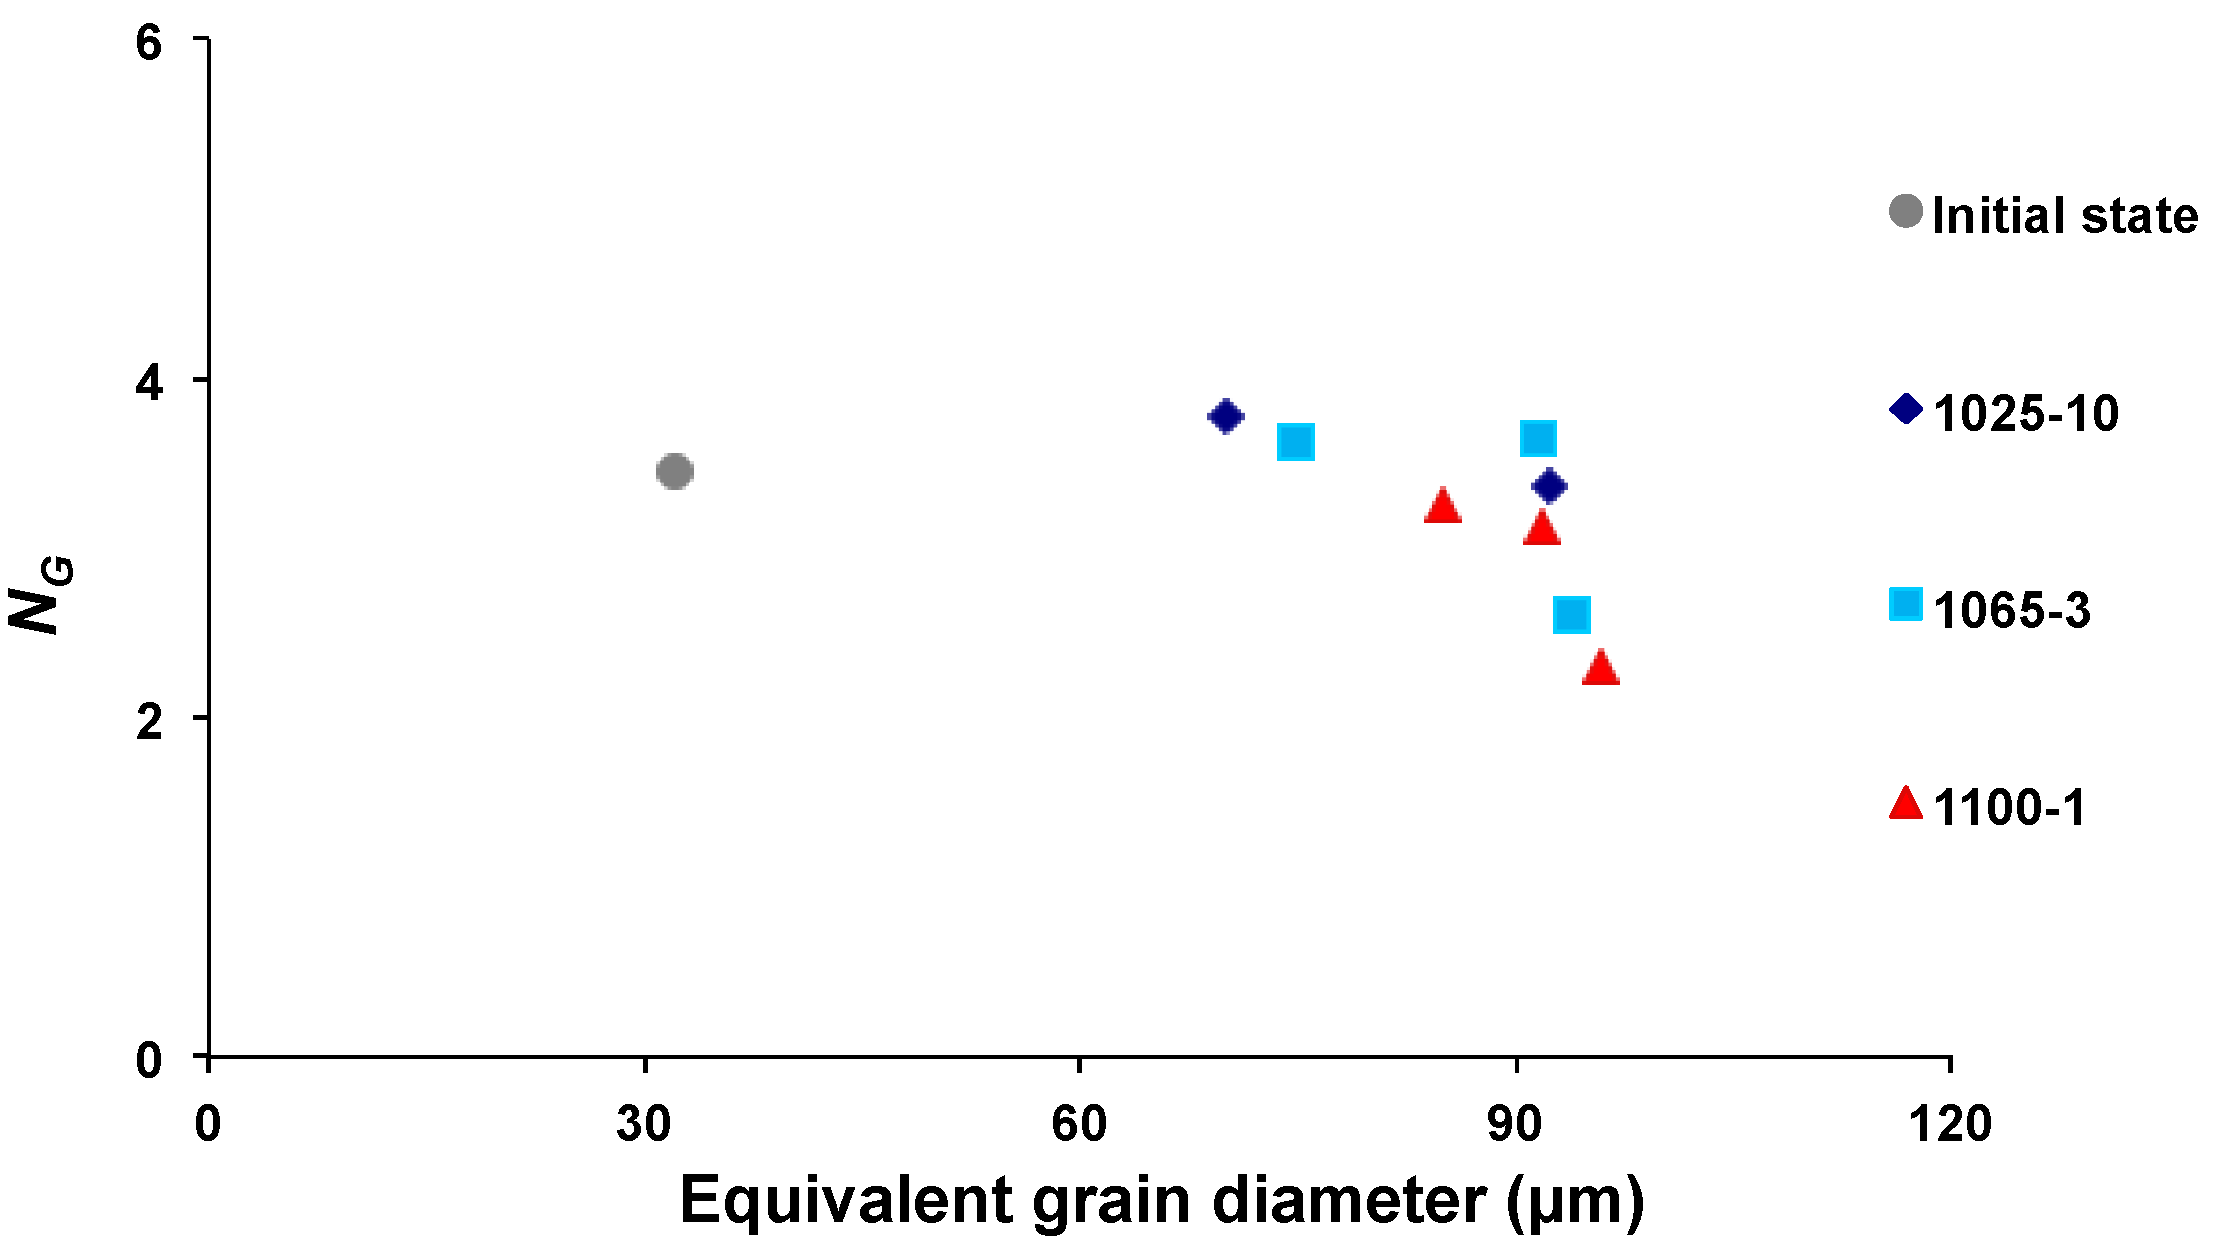
- The number of annealing twin boundaries per grain does not increase with the average grain size. This observation, which is consistent with our previous results in pure nickel, suggests that almost no new twins are formed during grain growth. On the contrary, it may slightly decrease, notably due to the migration of incoherent twin boundary segments.
- A mean field model with only one parameter to be determined is proposed to predict twin density evolution as a function of grain size during grain growth, based on the observed behavior of annealing twins during grain growth.
Acknowledgments
Author Contributions
Conflicts of Interest
References
- Wantanabe, T. Grain boundary design and control. Res. Mech. 1984, 11, 47–84. [Google Scholar]
- Olmsted, D.L.; Foiles, S.M.; Holm, E.A. Survey of computed grain boundary properties in face-centered cubic metals: I. Grain boundary energy. Acta Mater. 2009, 57, 3694–3703. [Google Scholar] [CrossRef]
- Palumbo, G.; Lehockey, E.M.; Lin, P. Applications for grain boundary engineered materials. JOM 1998, 50, 40–43. [Google Scholar] [CrossRef]
- Randle, V. Twinning-related grain boundary engineering. Acta Mater. 2004, 52, 4067–4081. [Google Scholar] [CrossRef]
- Kumar, M.; Schwartz, A.J.; King, W.E. Microstructural evolution during grain boundary engineering of low to medium stacking fault energy fcc materials. Acta Mater. 2002, 50, 2599–2612. [Google Scholar] [CrossRef]
- Carpenter, H.; Tamura, S. The formation of twinned metallic crystals. Proc. R. Soc. Lond. A 1926, 113, 161–182. [Google Scholar] [CrossRef]
- Cahoon, J.R.; Li, Q.; Richards, N.L. Microstructural and processing factors influencing the formation of annealing twins. Mater. Sci. Eng. A 2009, 526, 56–61. [Google Scholar] [CrossRef]
- Li, Q.; Cahoon, J.R.; Richards, N.L. On the calculation of annealing twin density. Scr. Mater. 2006, 55, 1155–1158. [Google Scholar] [CrossRef]
- Wang, W.; Lartigue-Korinek, S.; Brisset, F.; Helbert, A.L.; Bourgon, J.; Baudin, T. Formation of annealing twin during primary recrystallization of two low stacking fault energy Ni-based alloys. J. Mater. Sci. 2015, 50, 2167–2177. [Google Scholar] [CrossRef]
- Brandon, D.G. The structure of high-angle grain boundaries. Acta Metall. 1966, 14, 1479–1484. [Google Scholar] [CrossRef]
- Underwood, E.E. Quantitative Stereology; Addison-Wesley Publishing Company: Boston, MA, USA, 1970. [Google Scholar]
- Alvi, M.H.; Cheong, S.W.; Suni, J.P.; Weiland, H.; Rollett, A.D. Cube texture in hot-rolled aluminum alloy 1050 (AA1050)—Nucleation and growth behavior. Acta Mater. 2008, 56, 3098–3108. [Google Scholar] [CrossRef]
- Jin, Y.; Lin, B.; Rollett, A.D.; Rohrer, G.S.; Bernacki, M.; Bozzolo, N. Thermo-mechanical factors influencing annealing twin development in nickel during recrystallization. J. Mater. Sci. 2015, 50, 5191–5203. [Google Scholar] [CrossRef]
- Wang, W.; Brisset, F.; Helbert, A.L.; Solas, D.; Drouelle, I.; Mathon, M.H.; Baudin, T. Influence of stored energy on twin formation during primary recrystallization. Mater. Sci. Eng. A 2014, 589, 112–118. [Google Scholar] [CrossRef]
- Jin, Y.; Lin, B.; Bernacki, M.; Rohrer, G.S.; Rollett, A.D.; Bozzolo, N. Annealing twin development during recrystallization and grain growth in pure nickel. Mater. Sci. Eng. A 2014, 597, 295–303. [Google Scholar] [CrossRef] [Green Version]
- Jin, Y. Annealing Twin Formation Mechanism. Ph.D. Thesis, Mines-ParisTech, Paris, France, December 2014. [Google Scholar]
- Detrois, M.; Goetz, R.L.; Helmink, R.C.; Tin, S. Modeling the effect of thermal-mechanical processing parameters on the density and length fraction of twin boundaries in Ni-base superalloy RR1000. Mater. Sci. Eng. A 2015, 647, 157–162. [Google Scholar] [CrossRef]
- Pande, C.S.; Imam, M.A.; Rath, B.B. Study of annealing twins in FCC metals and alloys. Metall. Trans. A 1990, 21, 2891–2896. [Google Scholar] [CrossRef]
- Hu, H.; Smith, C.S. The formation of low-energy interfaces during grain growth in alpha and alpha-beta brasses. Acta Metall. 1956, 4, 638–646. [Google Scholar] [CrossRef]
- Lin, B.; Jin, Y.; Hefferan, C.M.; Li, S.F.; Lind, J.; Suter, R.M.; Bernacki, M.; Bozzolo, N.; Rollett, A.D.; Rohrer, G.S. Observation of annealing twin nucleation at triple lines in nickel during grain growth. Acta Mater. 2015, 99, 63–68. [Google Scholar] [CrossRef]
- Gleiter, H. The formation of annealing twins. Acta Metall. 1969, 17, 1421–1428. [Google Scholar] [CrossRef]
- Bernard, P.; Bag, S.; Huang, K.; Logé, R.E. A two-site mean field model of discontinuous dynamic recrystallization. Mater. Sci. Eng. A 2011, 528, 7357–7367. [Google Scholar]
- Hillert, M. On the theory of normal and abnormal grain growth. Acta Metall. 1965, 13, 227–238. [Google Scholar] [CrossRef]
- Bystrzycki, J.; Przetakiewicz, W.; Kurzydłowski, K.J. Study of annealing twins and island grains in FCC alloy. Acta Metall. Mater. 1993, 41, 2639–2649. [Google Scholar] [CrossRef]
- Song, K.H.; Chun, Y.B.; Hwang, S.K. Direct observation of annealing twin formation in a Pb-base alloy. Mater. Sci. Eng. A 2007, 454–455, 629–636. [Google Scholar] [CrossRef]
- Bernacki, M.; Logé, R.E.; Coupez, T. Level set framework for the finite element modeling of recrystallization and grain growth in polycrystalline materials. Scr. Mater. 2011, 64, 525–528. [Google Scholar] [CrossRef]
- Jin, Y.; Bozzolo, N.; Rollett, A.D.; Bernacki, M. 2D finite element modeling of misorientation dependent anisotropic grain growth in polycrystalline materials: Level set versus multi-phase-field method. Comput. Mater. Sci. 2015, 104, 108–123. [Google Scholar] [CrossRef]
- Scholtes, B.; Shakoor, M.; Settefrati, A.; Bouchard, P.O.; Bozzolo, N.; Bernacki, M. New finite element developments for the full field modeling of microstructural evolutions using the level-set method. Comput. Mater. Sci. 2015, 109, 388–398. [Google Scholar] [CrossRef]
- Saltykov, S.A. The determination of the size distribution of particles in an opaque material from a measurement of the size distribution of their sections. In Proceedings of the Second International Congress for Stereology, Chicago, IL, USA, 8–13 April 1967; pp. 163–173.
© 2015 by the authors; licensee MDPI, Basel, Switzerland. This article is an open access article distributed under the terms and conditions of the Creative Commons by Attribution (CC-BY) license (http://creativecommons.org/licenses/by/4.0/).
Share and Cite
Jin, Y.; Bernacki, M.; Agnoli, A.; Lin, B.; Rohrer, G.S.; Rollett, A.D.; Bozzolo, N. Evolution of the Annealing Twin Density during δ-Supersolvus Grain Growth in the Nickel-Based Superalloy Inconel™ 718. Metals 2016, 6, 5. https://doi.org/10.3390/met6010005
Jin Y, Bernacki M, Agnoli A, Lin B, Rohrer GS, Rollett AD, Bozzolo N. Evolution of the Annealing Twin Density during δ-Supersolvus Grain Growth in the Nickel-Based Superalloy Inconel™ 718. Metals. 2016; 6(1):5. https://doi.org/10.3390/met6010005
Chicago/Turabian StyleJin, Yuan, Marc Bernacki, Andrea Agnoli, Brian Lin, Gregory S. Rohrer, Anthony D. Rollett, and Nathalie Bozzolo. 2016. "Evolution of the Annealing Twin Density during δ-Supersolvus Grain Growth in the Nickel-Based Superalloy Inconel™ 718" Metals 6, no. 1: 5. https://doi.org/10.3390/met6010005