
Toughness of Bulk Metallic Glasses

CSIR-National Metallurgical Laboratory, Jamshedpur 831007, India
Metals 2015, 5(3), 1279-1305; https://doi.org/10.3390/met5031279
Submission received: 1 June 2015
/
Revised: 6 July 2015
/
Accepted: 10 July 2015
/
Published: 17 July 2015
(This article belongs to the Special Issue Metallic Glasses)
Abstract
:Bulk metallic glasses (BMGs) have desirable properties like high strength and low modulus, but their toughness can show much variation, depending on the kind of test as well as alloy chemistry. This article reviews the type of toughness tests commonly performed and the factors influencing the data obtained. It appears that even the less-tough metallic glasses are tougher than oxide glasses. The current theories describing the links between toughness and material parameters, including elastic constants and alloy chemistry (ordering in the glass), are discussed. Based on the current literature, a few important issues for further work are identified.
1. Introduction
The past 25 years have seen the emergence of newer alloys with a lower critical cooling rate for vitrification (0.1–1000 K/s), which permits the use of conventional casting techniques to obtain metallic glasses in bulk form, i.e., >1 mm thickness [1,2]. The availability of these bulk metallic glasses (BMGs) has triggered intense research activity on various topics like their mechanical properties [3,4], studies on diffusion [5,6], and transformations like phase separation and crystallization [7,8,9]. BMGs exhibit certain attractive properties like high strength, hardness and wear resistance [10,11] and in some cases, good corrosion resistance [12]. Unlike crystalline alloys, BMGs do not work-harden and deformation in these materials tend to be localized into narrow regions called shear bands. Although the percent strain within a shear band is enormous, it contributes little to the overall plastic strain [13]. However, this is not to suggest that BMGs have low resistance to fracture initiation; indeed some compositions can show fracture toughness values comparable to engineering materials like Ti-6Al-4V, or maraging steels [14]. Other BMG compositions, like Mg-, or Fe-based show lower toughness and earlier reports suggested that their fracture energy approaches that of ideal brittle materials [15]. What really controls the toughness of BMGs has been a subject of intense research and debate. Furthermore, since BMGs are finding niche applications as in micro-gears, sensors or coatings [16,17,18,19], toughness is clearly of practical relevance. Excellent reviews exist on broader topics related to mechanical behavior of BMGs, including BMG-based composites [13,20] as well as a focused review on toughness [21]. However, the theories on intrinsic toughness of BMGs are still evolving and in light of the rapid progress made in recent years, it is worth summarizing the developments. The present short review is focused on toughness of monolithic BMGs—to put matters into context, it aims to first discuss the kind of toughness tests performed, including some current issues. Also included are some recent findings on the size-dependence of fracture toughness, particularly toughness and fracture in glassy thin films, since these are of fundamental significance as well as have implications for nano- and micro-scale applications of metallic glasses. A more detailed treatment of size-dependent mechanical properties in general will not be covered here since it has been extensively reviewed elsewhere [22]. Secondly, the evolving theories and open questions on correlations between toughness and material constants will be discussed, since such correlations are of importance in alloy design for enhanced toughness.
2. Techniques of Measuring Toughness
2.1. KIc/Notch Toughness Tests
The availability of amorphous alloys in bulk form has enabled the measurement of fracture toughness using standard techniques. The most investigated systems are those based on zirconium. Essentially, toughness has been measured either on fatigue pre-cracked specimens to give KIc values, or on notched samples (without pre-cracking) to yield notch toughness data. Conner et al. [14] first reported the notch toughness for Vitreloy 1 (Zr41.25Ti13.75Cu12.5Ni10Be22.5) as 55–59 MPa.m1/2, followed by tests on fatigue pre-cracked specimens of this alloy which showed KIc~30–68 MPa.m1/2 [23]. Lowphaphandu and Lewandowski [24] reported that the toughness depends significantly on the notch root radius. In their work, fatigue pre-cracked samples showed a KIc ~18.4 MPa.m1/2, whereas for the notched samples, it increased to 101–131 MPa.m1/2, depending on the notch root radius, which varied from 65–250 μm. Kim et al. [25] reported toughness data for a range of newer Zr-based BMGs; the Zr44Ti11Ni10.2Cu9.3Be25Fe0.5 shows a KIc of ~27 MPa.m1/2, whereas the notch toughness of Zr33.5Ti24Cu15Be27.5 is reported to be 80 MPa.m1/2. It appears that usually notch toughness is higher than true KIc toughness because multiple shear bands form at the notch root and also fracture path does not remain planar, but instead shows bifurcation, processes that increase the energy absorbed during fracture [24].
A variety of other factors can also affect toughness. Compressive residual stresses in the surface of a cast sample can increase the KIc, e.g., from 34 MPa.m1/2 to 51 MPa.m1/2 for Zr44Ti11Ni10Cu10Be25 [26]. Also, the state of relaxation, i.e., free volume content can markedly affect BMG toughness, as amply demonstrated by Launey et al. [26], where the toughness can drop from 34 MPa.m1/2 to 3 MPa.m1/2 for relaxed samples. Another major factor is the oxygen content in the alloy, as demonstrated by Keryvin et al. [27] for a Zr55Cu30Al10Ni5 glass—at an oxygen level of 1000 appm, KIc is 37 MPa.m1/2, whereas samples with 300 appm oxygen are much tougher leading to difficulties in fatigue pre-cracking and obtaining a valid KIc.
The stress state also plays a role. Flores and Dauskardt [28,29] were the first to report the mode II fracture toughness (KIIc) of Vitreloy 1, which is 75 MPa.m1/2, 4–5 times higher than KIc (16 MPa.m1/2); suggesting that flow and fracture are affected by the stress normal to the failure plane. The hypothesis is that an applied tensile stress causes a local increase in free volume, which decreases the shear stress needed to cause flow.
It should be noted that for certain BMGs, toughness is almost independent of whether they are notched or fatigue pre-cracked. For instance, in Ti40Zr25Cu12Ni3Be20, extensive shear banding blunts a pre-crack, effectively turning it into a notch, leading to high toughness [30]. Other recently developed alloys show similar traits. The Pd79Ag3.5P6Si9.5Ge2 glass shows an apparent KIc of 150 MPa.m1/2 and is one of the most damage-tolerant BMGs known [31]. Similarly, the Zr61Ti2Cu25Al12 glass has toughness of 130 ± 20 MPa.m1/2 and a rising R-curve [32] which arises due to extensive shear banding at the crack tip that leads to crack deflection and a change in the local loading (at the crack tip) from pure mode I to mixed mode I/II. Mixed mode loading is known to enormously increase the toughness values [33]. Although the above toughness data are not strictly KIc values, it is impressive that certain compositions are able to show such profuse shear banding so as to change the loading mode. The key question is, why do only some compositions (and not all BMGs) show such behavior? Some insight has recently been provided by Xu et al. [34]. They postulated that the copious shear banding seen in glasses like Zr61Ti2Cu25Al12 is related to the presence of geometrically unfavored motifs (GUMs) in the glassy structure. Essentially, these are clusters of atoms that are more flexible and amenable to rearrangement upon application of stress. For example, the GUMs may include clusters with a higher or lower coordination number than expected from the alloy composition and atomic radii. The hypothesis was supported by molecular dynamics simulations of binary Cu64Zr36 and Cu20Zr80 glasses. The former alloy had a higher fraction of the geometrically favored full icosahedra and these resist deformation. The Cu20Zr80 glass, however, possesses a greater variety of local motifs, which are amenable to change upon experiencing stress, thereby leading to a greater proliferation of shear bands in the alloy during deformation. A further discussion on compositional effects will be presented in Section 3.1.
An issue of particular interest is the sample size dependence of KIc values. Gludovatz et al. [35] investigated the Zr52.5Cu17.9Ni14.6Al10Ti5 (Vitreloy 105) BMG and stated that KIc for compact tension (CT) specimens is 25.3 MPa.m1/2, whereas it increases to 35.7 MPa.m1/2 for single-edge (SE) notch bend specimens—a difference just below the threshold for statistical significance. Furthermore, their data suggest that toughness may increase with decreasing ligament size, even if the samples meet the size requirements specified by the ASTM E399 for KIc testing. This is quite unlike crystalline metals and alloys, and could be possibly related to the size-dependent ductility well known for glassy metals, e.g., their bending ductility increases with decreasing plate thickness, as shown by Conner et al. [36]. Also pertinent may be the fact that BMGs show strain softening behavior, unlike the work hardening seen in crystalline alloys. The authors recommend cautiously accepting ASTM E399 as providing specimen size-independent KIc data for BMGs.
2.2. Toughness from Fracture Surfaces
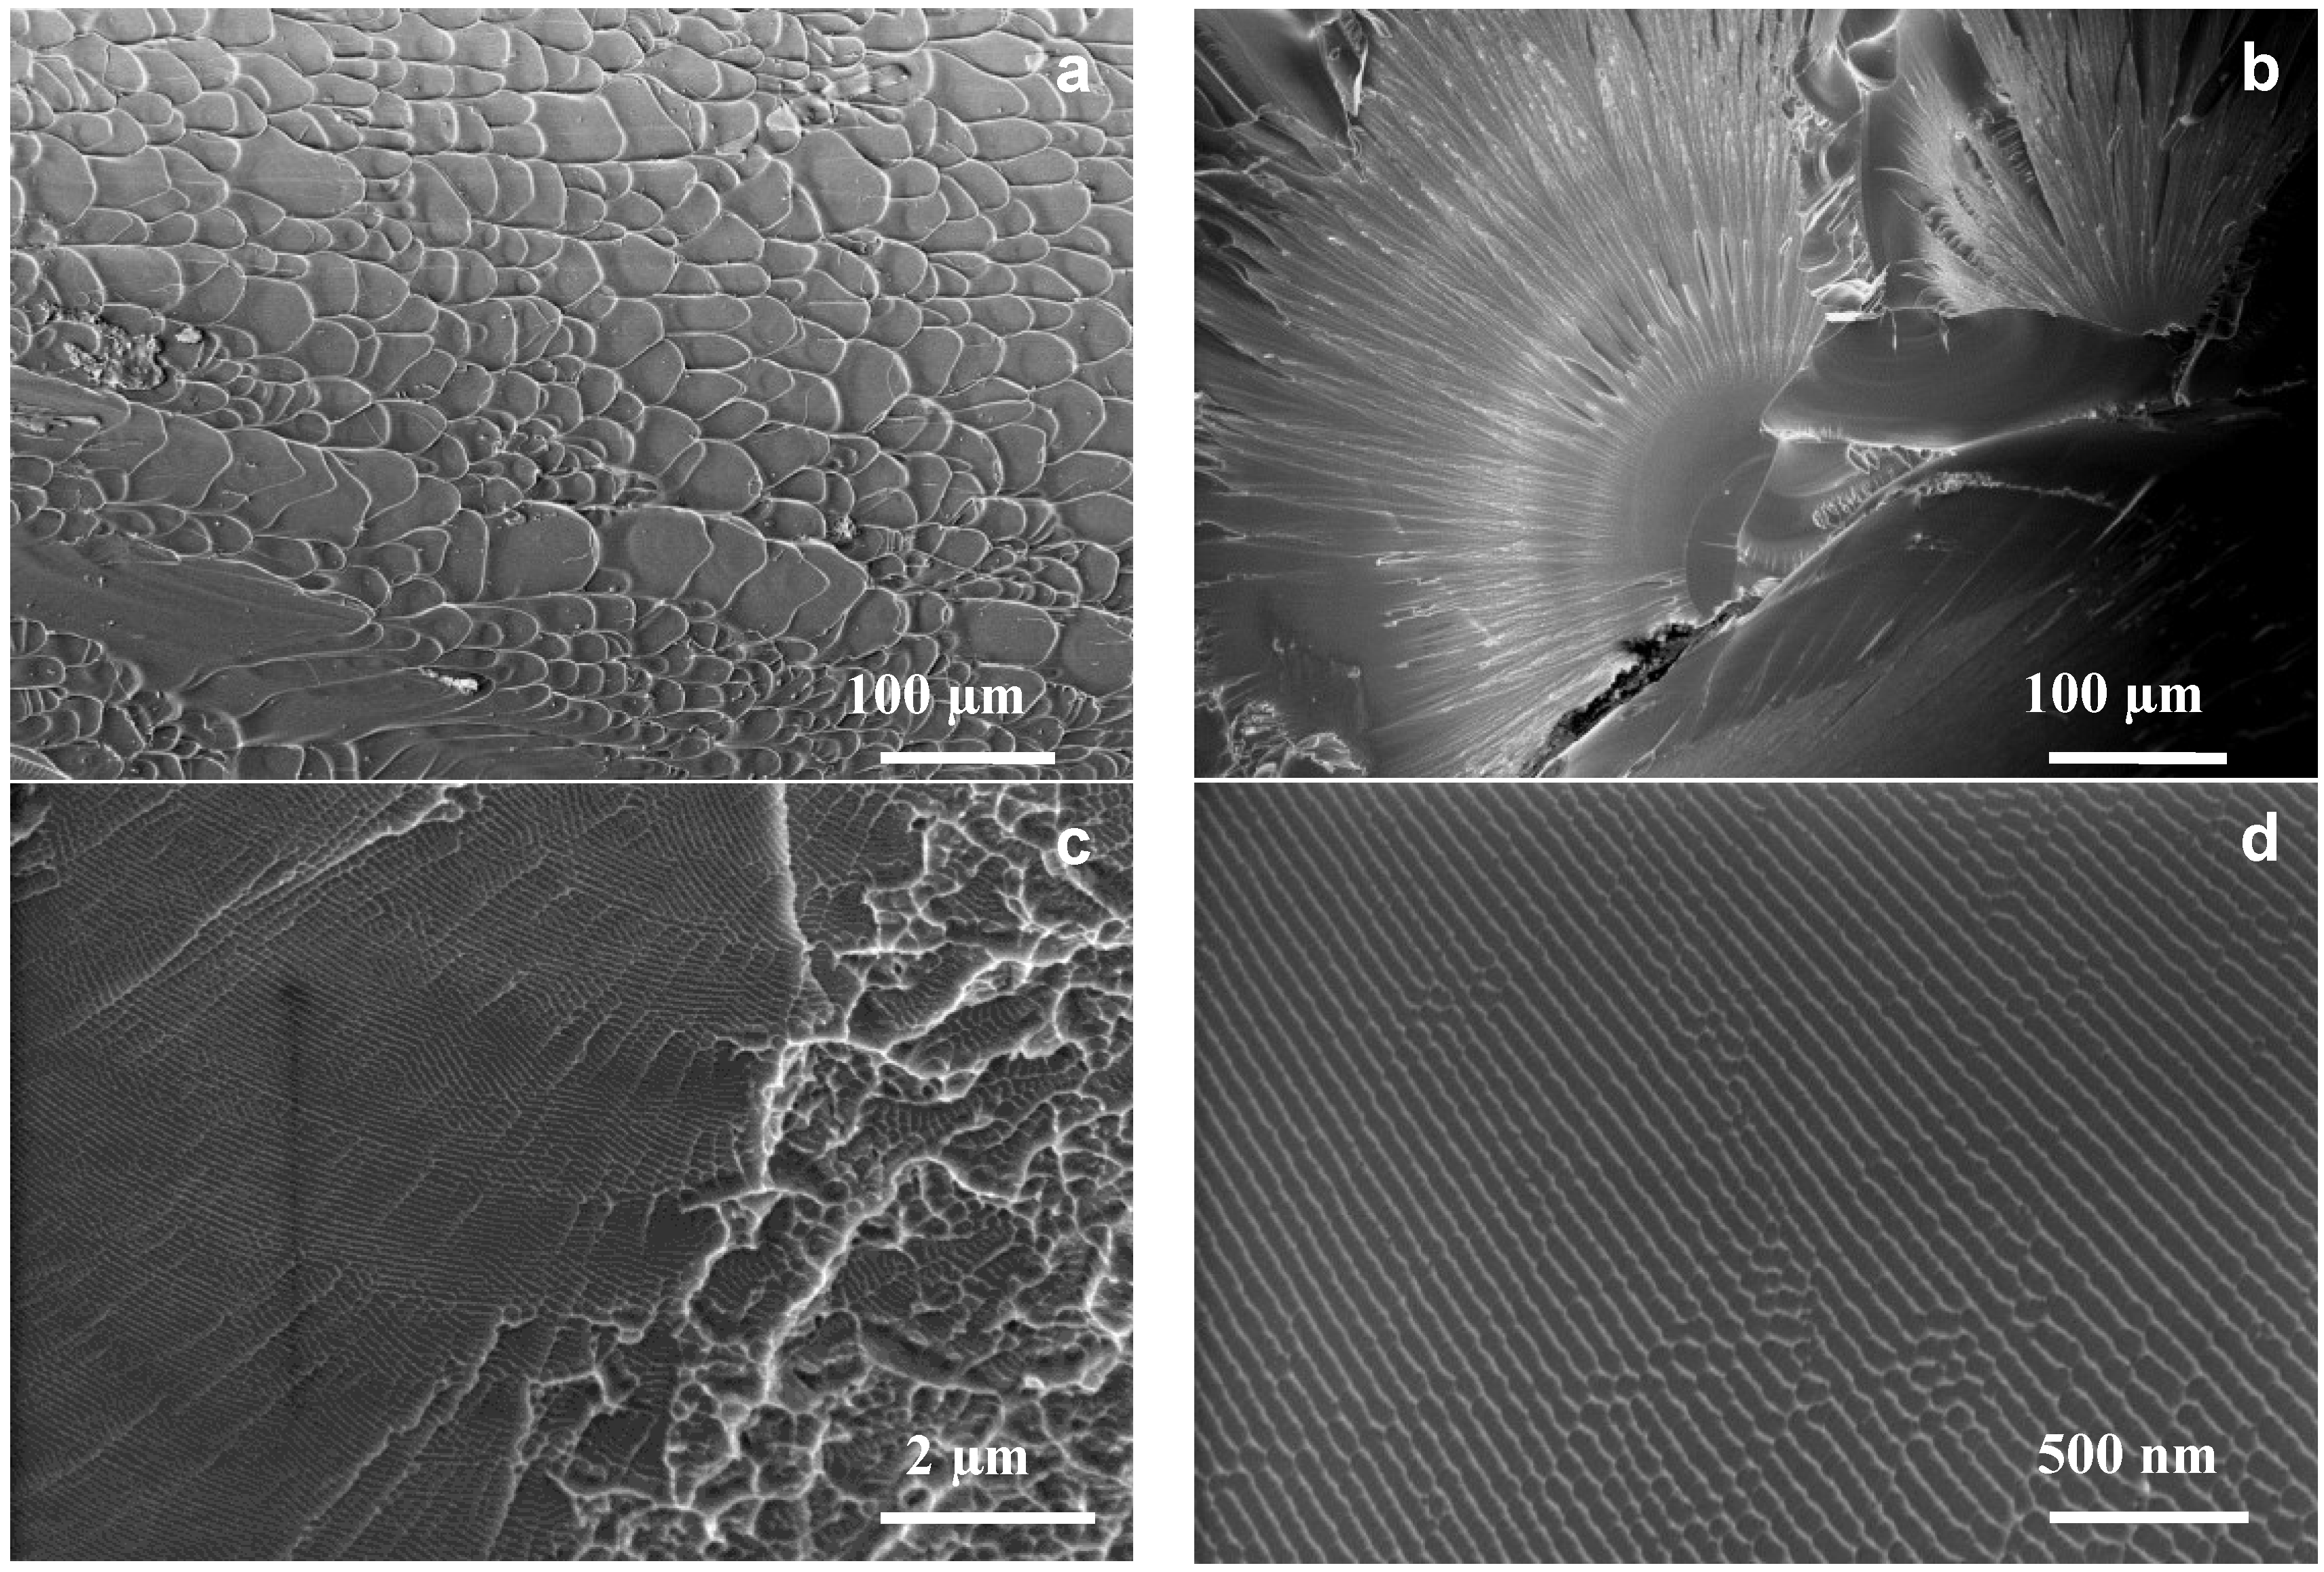
It is also possible to estimate toughness from the length scale of features on BMG fracture surfaces. Metallic glasses basically show two types of fracture, shear (ductile) or brittle (quasi-cleavage). Figure 1a shows an example of shear fracture in Cu49Hf42Al9, characterized by shear band vein patterns. The mechanism of their formation will now be briefly considered. Shear bands form ahead of a crack tip and the material within these bands has a lowered viscosity due to structural changes and heating. Thus, the glass inside a shear band behaves like a viscous fluid, with the crack tip acting as a fluid meniscus that can advance under the action of a stress gradient, dσ/dx ahead of the crack tip. Argon and Salama [37] showed that a perturbation in the fluid meniscus with wavelength λ will grow unstably, via fingering into the viscous material in the shear band, if dσ/dx overcomes the surface tension χ. Specifically, the relation is as follows:
where λc is a critical wavelength. In other words, only a perturbation with initial wavelength (λ) greater than λc will be able to grow. Once this condition is met, the crack tip (meniscus) breaks down into a series of parallel protrusions (fingers) that advance into the viscous material inside the shear band. These fingers grow and eventually, the ligaments connecting them rupture, thus causing the crack to advance. The corresponding fracture surface then shows the vein patterns typified by Figure 1a. These patterns resemble those found on separating two glass plates with a viscous medium in between and this mechanism fracture is called the fluid meniscus instability (FMI) mechanism [13,37,38]. A key parameter here is also the curvature radius of the crack tip, R. As shown by Jiang et al. [39], the FMI mechanism can operate only if the curvature radius, R is higher than λc. The curvature radius in turn depends on factors like crack speed, cracking mode and the intrinsic material toughness [39]. If R < λc, the glass will fail not through shear, but brittle (quasi-cleavage) fracture.
Figure 1b shows a typical example of brittle failure, as in a Fe48Cr15Mo14Er2C15B6 glass, with mirror, mist and hackle zones. Figure 1c,d show higher magnification views of the hackle zone—nanoscale corrugations (NCs) are visible. Brittle fracture features are very similar for all BMGs, ranging from the less tough Mg- or La-based alloys to the tougher Zr-based glasses. Their exact formation mechanism has been intensely debated. Earlier work [40] explained the features in terms of an FMI mechanism, similar to the vein patterns discussed above. The material at the crack tip is at a temperature close to the glass transition (Tg) and the crack tip acts as a fluid meniscus showing perturbations. Under the action of a stress gradient, perturbations with a critical wavelength will grow into the material ahead of the crack tip, in the process creating a new crack tip with a viscous zone ahead of it. The process repeats, leading to the formation of nanoscale corrugations (NCs) [38,40]. Others, however, hold different views and it has been asserted that FMI is unlikely to play a role in NC formation [38,41]. Narasimhan et al. [38], for example, have argued that the FMI mechanism predicts the formation of fingers that should run perpendicular to the crack front, whereas the NCs (as in Figure 1d) run parallel to the crack front. Molecular dynamics simulations by Murali et al. [42] on a ductile glass (CuZr) and a brittle glass (FeP) have shed considerable light on the possible mechanisms. They could show that extensive shear banding tends to dominate in the CuZr glass, causing ductile fracture. Brittle fracture in the FeP glass is preceded by cavitation in the zone ahead of the crack tip and it is correlated with nanoscale density fluctuations in the glass, where cavitation occurs preferentially in areas having a lower local density/strength.
Figure 1.
(a) An example of shear fracture in a Cu49Hf42Al9 based glass tested in compression, showing vein patterns. (b) Brittle fracture in the Fe48Cr15Mo14Er2C15B6 glass, showing mirror, mist and hackle zones. (c,d) Higher magnification views showing nanoscale dimples and corrugations on the fracture surface of Fe48Cr15Mo14Er2C15B6.

The formation of NCs can then be explained as follows: Cavitation leads to the formation of nanovoids ahead of a crack tip, which grow under the action of a stress, and eventually, the ligaments between the crack tip and the voids break and the crack extends. The process continues, leading to a fracture surface as in Figure 1d, where broken ligaments are visible as nano-corrugations, and the crack has propagated perpendicular to these NCs. The periodicity of the NCs reflects the average wavelength of the strength fluctuations in the metallic glass.
As is apparent from this discussion, the scale of vein patterns (Figure 1a) should reflect the scale of the fracture process zone size. Hence, there has been interest in correlating fracture toughness with the scale of shear band vein patterns, as seen in early work by Kimura and Masumoto [43]. Recently, Xi et al. [44] utilized 3-point bending of single-edge notched specimens and showed that the scale of shear band vein patterns (w) represents the process zone size in a BMG and the fracture toughness (Kc) can be simply calculated from the yield strength (σy) using the following relationship
It seems that the Kc is a mixed mode I/II toughness, and thus significantly larger than true KIc. For example, Xi et al. report Kc for Vitreloy 1 to be 86 MPa.m1/2, compared to KIIc of 75 MPa.m1/2 and KIc of ~16 MPa.m1/2 [28,29]. Although this relation was originally developed for bending fracture of notched samples, it has also been used for reliably estimating KIIc toughness from compressive fracture surfaces i.e., from the shear band vein patterns as in Figure 1a; but using the size of nanoscale features (Figure 1c) does not yield reliable estimates of fracture toughness [45].
The above discussion applies to glasses in bulk form. However, the toughness and fracture behavior of thin film metallic glasses can be very different, as reported by Ghidelli et al. [46,47]. They investigated fracture (in bending) of a range of Ni–Zr glassy films with extremely low thickness, varying between 200 to 900 nm. Although the glassy films are intrinsically (i.e., structurally) similar to glasses in bulk form, a much lower toughness was noted, attributed to the very low film thickness, which restricts the development of a fracture process zone. It was also observed [46,47] that because of such low thickness and the resultant geometrical confinement (an extrinsic factor), the meniscus instability mechanism does not operate, leading to an absence of vein patterns on the fracture surface. Instead, nanoscale corrugations are seen for films with thickness down to 500 nm, below which even the corrugations disappear, leaving a featureless fracture surface. Additionally, toughness also depends on the film composition. These issues will be important in micro- or nano-scale applications of metallic glasses.
2.3. Compression Testing
Uniaxial compression testing has been one of the most popular techniques for assessing plasticity in BMGs, with compressive plastic strain being often used to evaluate BMGs. Interestingly, a larger plastic strain does not necessarily indicate higher fracture toughness, as seen in the work of Gu, et al. [30] on a Ti-based BMG. They studied samples with different sizes, with cross-sectional area ranging from 5 × 5 mm2 to 1 × 1 mm2. The latter were machined from the 5 × 5 mm2 samples. Although the smaller samples showed higher compressive plasticity than the 5 × 5 mm2 material (which showed no plasticity), toughness tests on fatigue pre-cracked specimens showed that the 5 × 5 mm2 samples in fact had a high fracture toughness of 110 MPa.m1/2. The findings emphasize that compressive plasticity may not always indicate a higher toughness. The larger plasticity for smaller samples seems related to a size effect, as also noted by Conner et al. [36], where thinner BMG plates show larger plastic strain in bending, arising from a greater number of operating shear bands.
The size-dependence of plasticity was more thoroughly investigated by Han et al. [48], who showed that in addition to sample size, stiffness of the testing machine plays a major role. Han et al. defined a fundamental parameter called the shear band instability index (S), as follows:
where EY is Young’s modulus of the sample, d its diameter, ρ is the aspect ratio (height-to-diameter ratio) and kM is the machine stiffness. They neatly showed that for S below a critical value (Scr), deformation occurs through multiple shear banding leading to large plastic strain; but once S > Scr, a single shear band dominates, leading to catastrophic failure. The Scr cannot be determined from first principles and it has to be obtained experimentally. The key idea from their work is that S should be low for a given test, i.e., plastic strain will be larger for smaller samples and higher machine stiffness. The question that remains is, what is the link between plasticity and fracture toughness? Intuitively, one can expect them to be directly related. As stated in [48], the parameter Scr is a measure of the intrinsic toughness of a metallic glass—the higher the Scr, the greater the toughness, as with Pd-, Pt-, and Zr-based BMGs and conversely, the lower the Scr, the lower the toughness, as for Mg-based glasses.
The above discussion suggests that plasticity/toughness will increase with reducing sample size, but will this continue indefinitely, to extremely small sample sizes? This aspect was investigated by Ghidelli et al. [46,47] on Ni–Zr thin films with sub-micron thickness. Interestingly, (as also stated in Section 2.2), for sizes below 1 μm, different mechanisms dominate. Unlike bulk samples, the fracture process zone cannot fully develop and the meniscus instability mechanism leading to shear band vein patterns does not operate anymore. Instead, brittle fracture occurs, with the formation of nanoscale corrugations and the material exhibits low fracture toughness.
Some glassy alloys display a very large compressive strain to failure, thereby suggesting high fracture toughness e.g., Zr59Cu18Ni8Ta5Al10 shows about 20% plastic strain [49]. As shown by the authors, this can be misleading, because, in fact, the samples already crack at a lower strain (~10%), manifest as an inflection in the stress–strain curve, and the sample is held intact by a pattern of interlocking shear bands and cracks. The interlocking cracks are evident in scanning electron microscopy (SEM) observations of the tested samples. Thus, unusually high plasticity accompanied by an inflection in the stress–strain curves of monolithic BMGs should be treated with caution and microscopy should be used to ascertain that the large plastic strain really arises from multiple shear banding.
Recent work by Madge et al. [45] has shown that the mode II fracture toughness (KIIc) can be reliably estimated from the compressive fracture surfaces, which show shear band vein patterns, such as those in Figure 1a for a Cu49Hf42Al9 BMG. As mentioned in Section 2.2, the relevant parameters may be put into Equation (2) to estimate KIIc fracture toughness [45].
As one would expect, another way of judging the toughness of a material is the area under the stress-strain curve. However, as mentioned earlier, data for a Ti-based BMG [30] reveal that higher compressive plasticity may not always indicate higher fracture toughness. In this regard, tensile tests could be more reliable, particularly for probing brittleness, which should be evident in low fracture strength (hence area under the curve). A fine example can be found in the work of Li et al. [50] on a Zr-based BMG. They conducted tensile and compressive tests on samples structurally relaxed by annealing below Tg for various times. The severely embrittled samples showed drastically reduced tensile strength (<600 MPa) instead of the 1660 MPa for as-cast samples. In contrast, the compressive strength remains unchanged and embrittlement is manifest only through fractography, with a change in fracture mode from shear (ductile) to brittle fracture. Embrittlement can also occur because of oxygen contamination, as demonstrated for the Cu49Hf42Al9 BMG [51]. In this case too, the compressive fracture strength stays unchanged, and the embrittlement is only evident from the change in fracture mode to quasi-cleavage for samples with higher oxygen. Perhaps the tensile strength may be drastically lowered, although it was not tested in their work.
2.4. Indentation Fracture Toughness
For brittle materials, indentation tests can provide a rapid method of estimating toughness without the need for extensive fracture mechanics testing. Indentation fracture toughness (Kr) is related to the length of cracks emanating from the corners of a Vickers indent and can be estimated using Equation (4) for half-penny shaped cracks [52].
where E is Young’s modulus, H is hardness, P is the indentation load and c is the half crack length on the surface. If the cracks are radial, instead of half-penny, modified equations are used as discussed in [52].
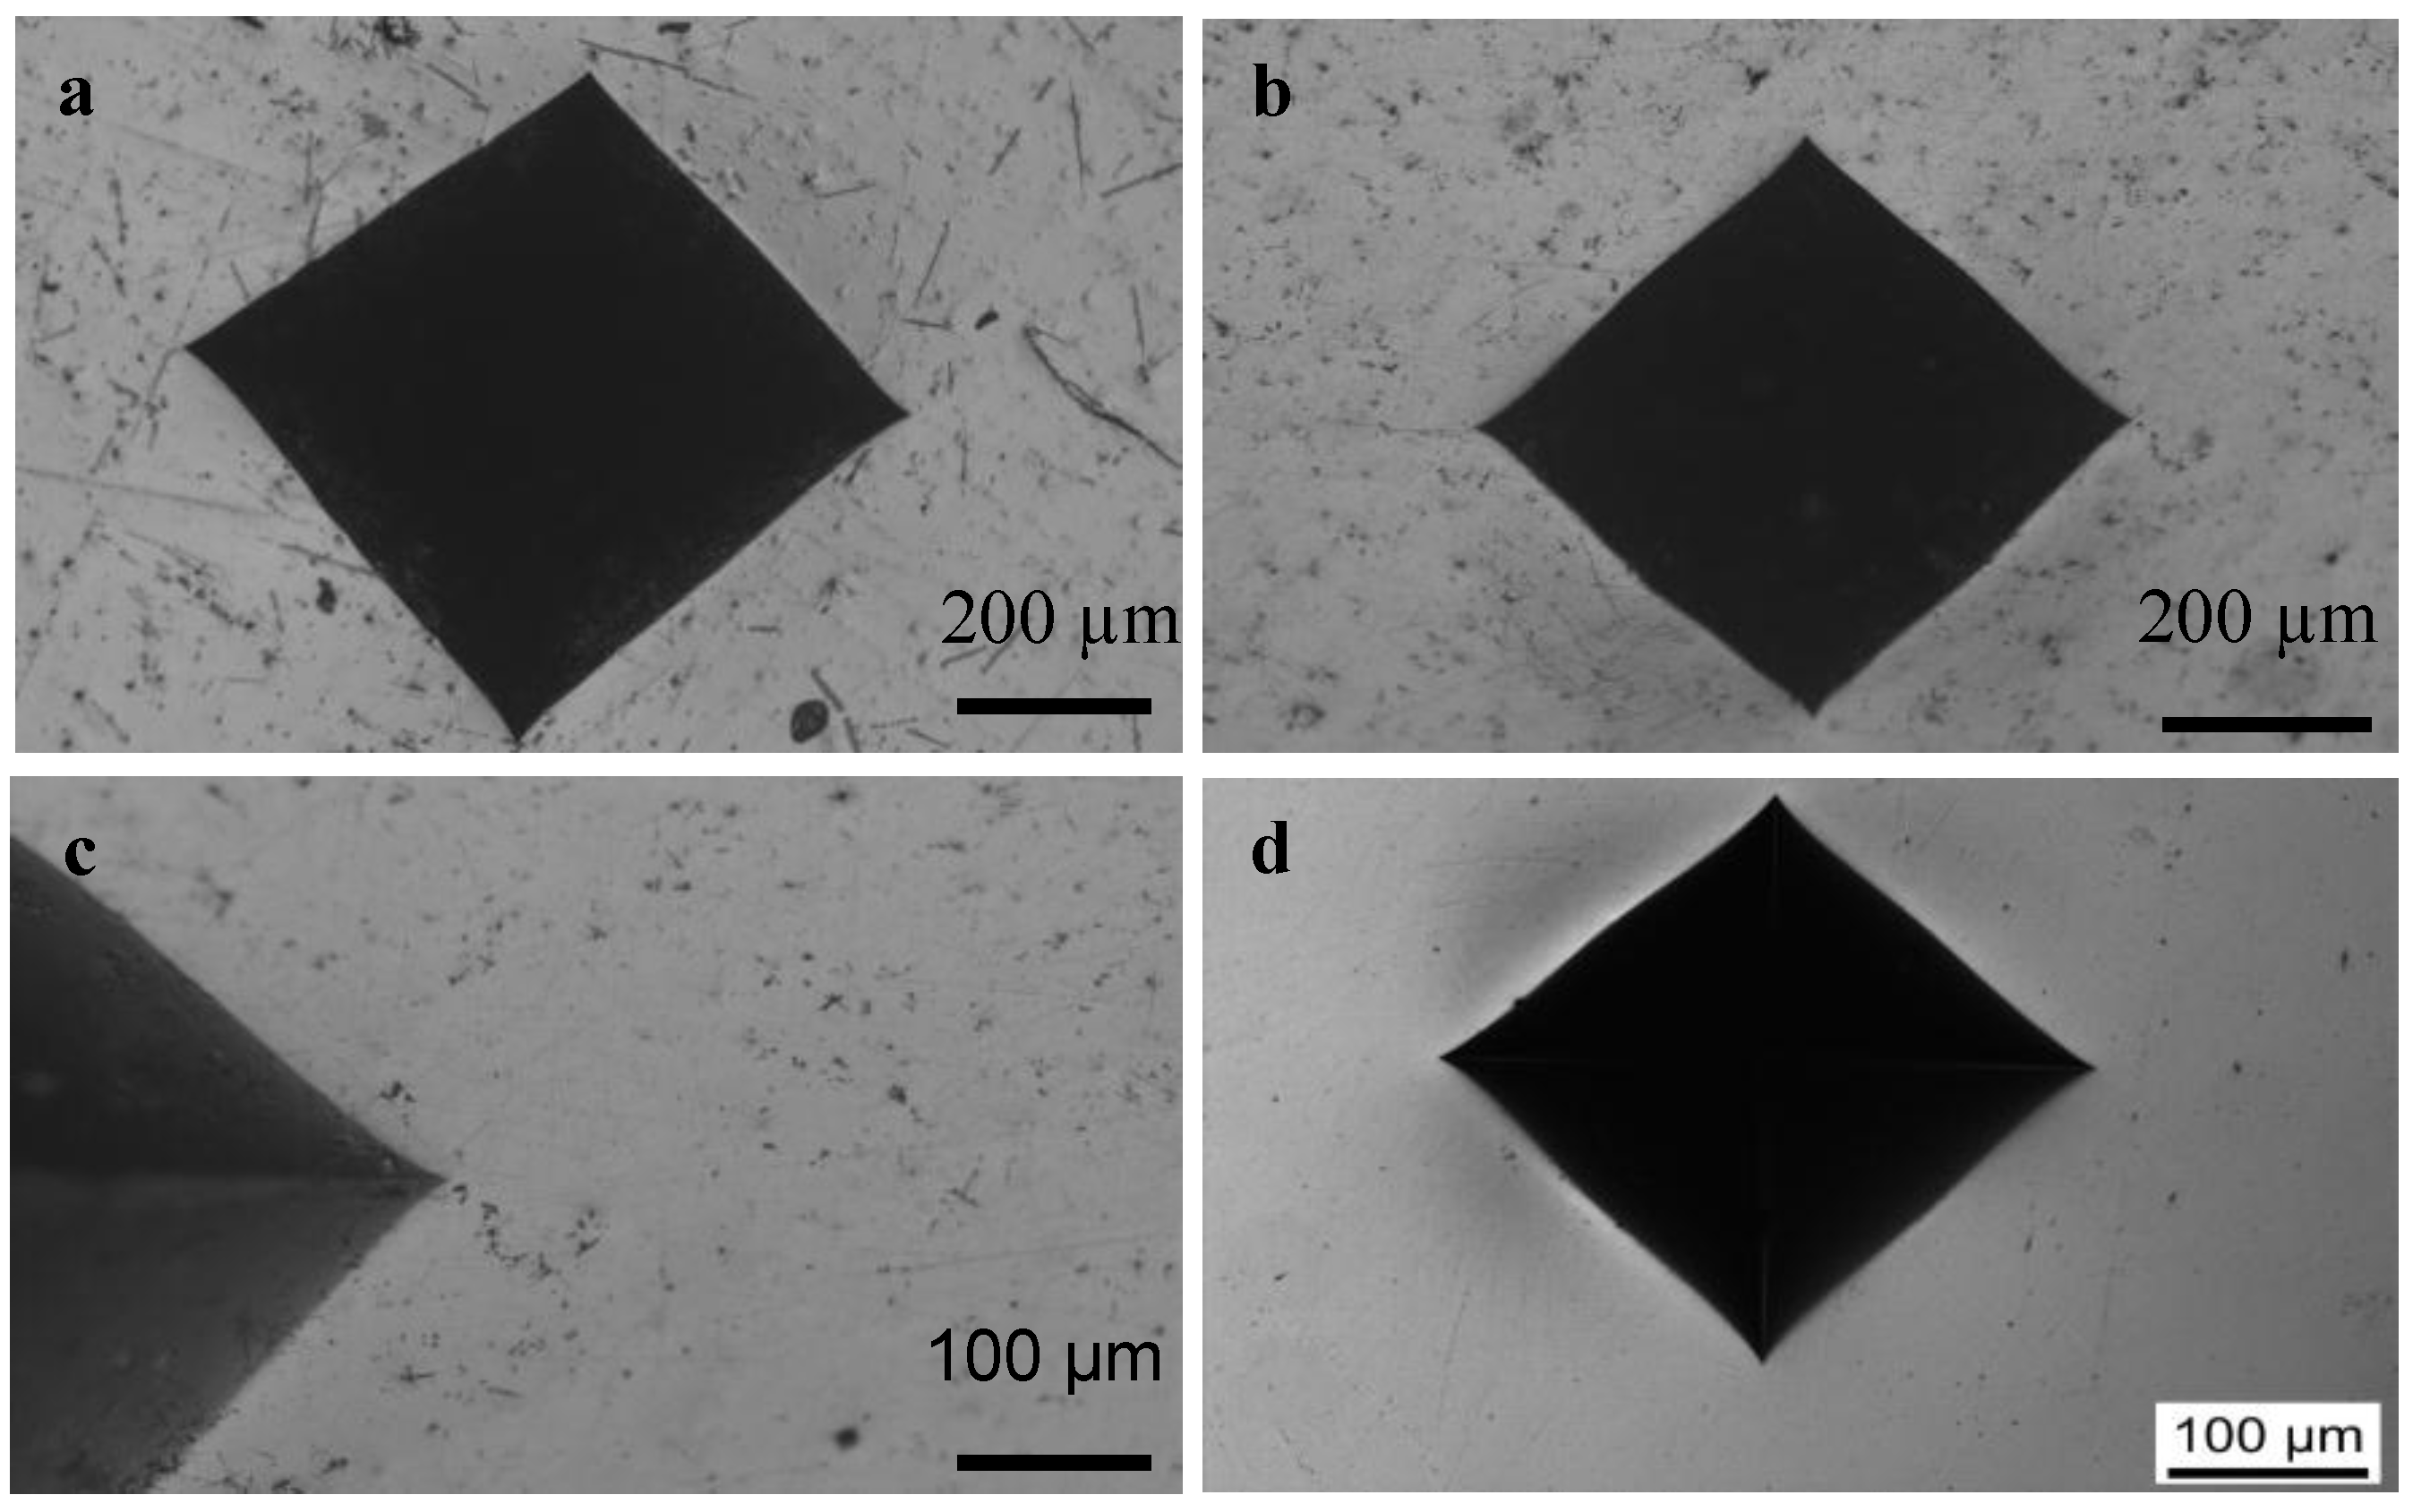
The first data on indentation toughness were reported by Hess et al. [52] for an amorphous steel, Fe48Cr15Mo14Er2C15B6, which has a critical load for cracking between 31.4 and 41.2 N and an indentation toughness between 3.2–3.8 MPa.m1/2, depending on the sample thickness. Previously, Gilbert et al. [24] had also evaluated indentation toughness of partially crystallized Vitreloy 1 specimens. Keryvin et al. [53] reported a lower critical load (between 5–10 N) for cracking and a toughness of 2.94 MPa.m1/2 for a Fe–Co–Cr–Mo–C–B–Y bulk glass. It is important to note, however, that indentation toughness does not directly yield KIc values and its use has been criticized [54]. At best, these data can be used as a semi-quantitative estimate of toughness. One might expect the other supposedly brittle BMGs, like those based on Mg-, La- or Ce to also be suitable for indentation tests. Surprisingly, not all of these materials actually have such low toughness as to permit indentation tests. Figure 2 shows images of indents made in such BMGs—despite very high loads, no cracks are seen in the Ce-, La- and Fe-based BMGs; the measurements were repeated after re-polishing the indented specimens.
Figure 2.
Vickers indents made in a variety of less-tough glasses, showing a surprising lack of crack initiation: (a) Ce60Al20Cu10Ni10 glass, at 589 N load; (b,c) La55Co5Cu10Ni10Al20 at 491 N; and (d) Fe64Mo14C15B6Er1 at 589 N. The present alloys appear to be tougher than other glasses with similar chemistries.

Table 1 summarizes the currently available indentation toughness data for a range of BMGs as well as their elastic properties, i.e., Poisson’s ratio, shear modulus and shear transformation zone (STZ) barrier energy densities. These parameters and their link with toughness will be discussed in Section 3.1 and Section 3.3.

| Alloy Composition (at. %) | Poisson’s Ratio (ν) | Yield Strength (σy) GPa | Shear Modulus (μ) GPa | STZ Barrier Energy Density. ρ (GJ/m3) | Indentation Toughness (MPa.m1/2) | Reference |
|---|---|---|---|---|---|---|
| Ce60Al20Cu10Ni10 * | 0.317 * | 0.8 | 15 * | 0.0259 | Tough | This work, [55] |
| La55Co5Cu10Ni10Al20 | 0.34 | 0.85 | 15.6 | 0.02815 | Tough | This work, [55] |
| Mg58Cu31Y11 | 0.318 | 0.986 | 20.4 | 0.02897 | 2.91 | [55,56] |
| Fe64Mo14C15B6Er1 | 0.316 | 3.9 | 75.4 ** | ~0.122 | Tough | This work, [55,57] |
| Fe48Cr15Mo14Er2C15B6 | 0.318 | 3.75 | 80.8 | 0.1059 | 3.8 ± 0.3 | [52,57] |
| Fe41Co7Cr15Mo14C15B6Y2 | 0.334 | 3.5 | 84.1 | 0.0886 | 2.26 ± 0.4 | [53,58] |
* ν and μ are available in literature for the Ce70Al10Cu10Ni10 glass. For the present Ce60Al20Cu10Ni10, they were estimated using the approach given by Zhang and Greer [59], from the measured alloy density (6.479 g/cc). ** μ is taken as an average of two neighboring compositions Fe65Mo14C15B6 (73 GPa) and Fe63Mo14C15B6Er2 (77.8 GPa) from [55].
2.5. Impact Toughness
This is yet another technique of measuring toughness of BMGs, at moderately high strain rates and is relatively simple to perform. Nagendra et al. [60] correlated the decrease in impact energy with crystallization in a La-based glass and showed that the formation of brittle intermetallics strongly reduces the impact toughness of the material. Degradation of toughness upon crystallization of a Zr–Ti–Cu–Ni–Be–Al glass was also noted by Raghavan et al. [61], as expected, because of the formation of brittle phases that aid crack nucleation. Surprising results were reported by Yokoyama et al. [62,63] for Zr–Cu–Al glasses—the hypo-eutectic Zr60Cu30Al10 alloy shows an increase in impact toughness upon structural relaxation, in stark contrast to the usual embrittlement seen upon annealing. On the other hand, the eutectic Zr50Cu40Al10 shows the usual reduced impact toughness upon annealing. They attributed this anomaly to structural changes, i.e., short-range ordering in the glass.
2.6. Wear Resistance (An Indirect Indication of Toughness)
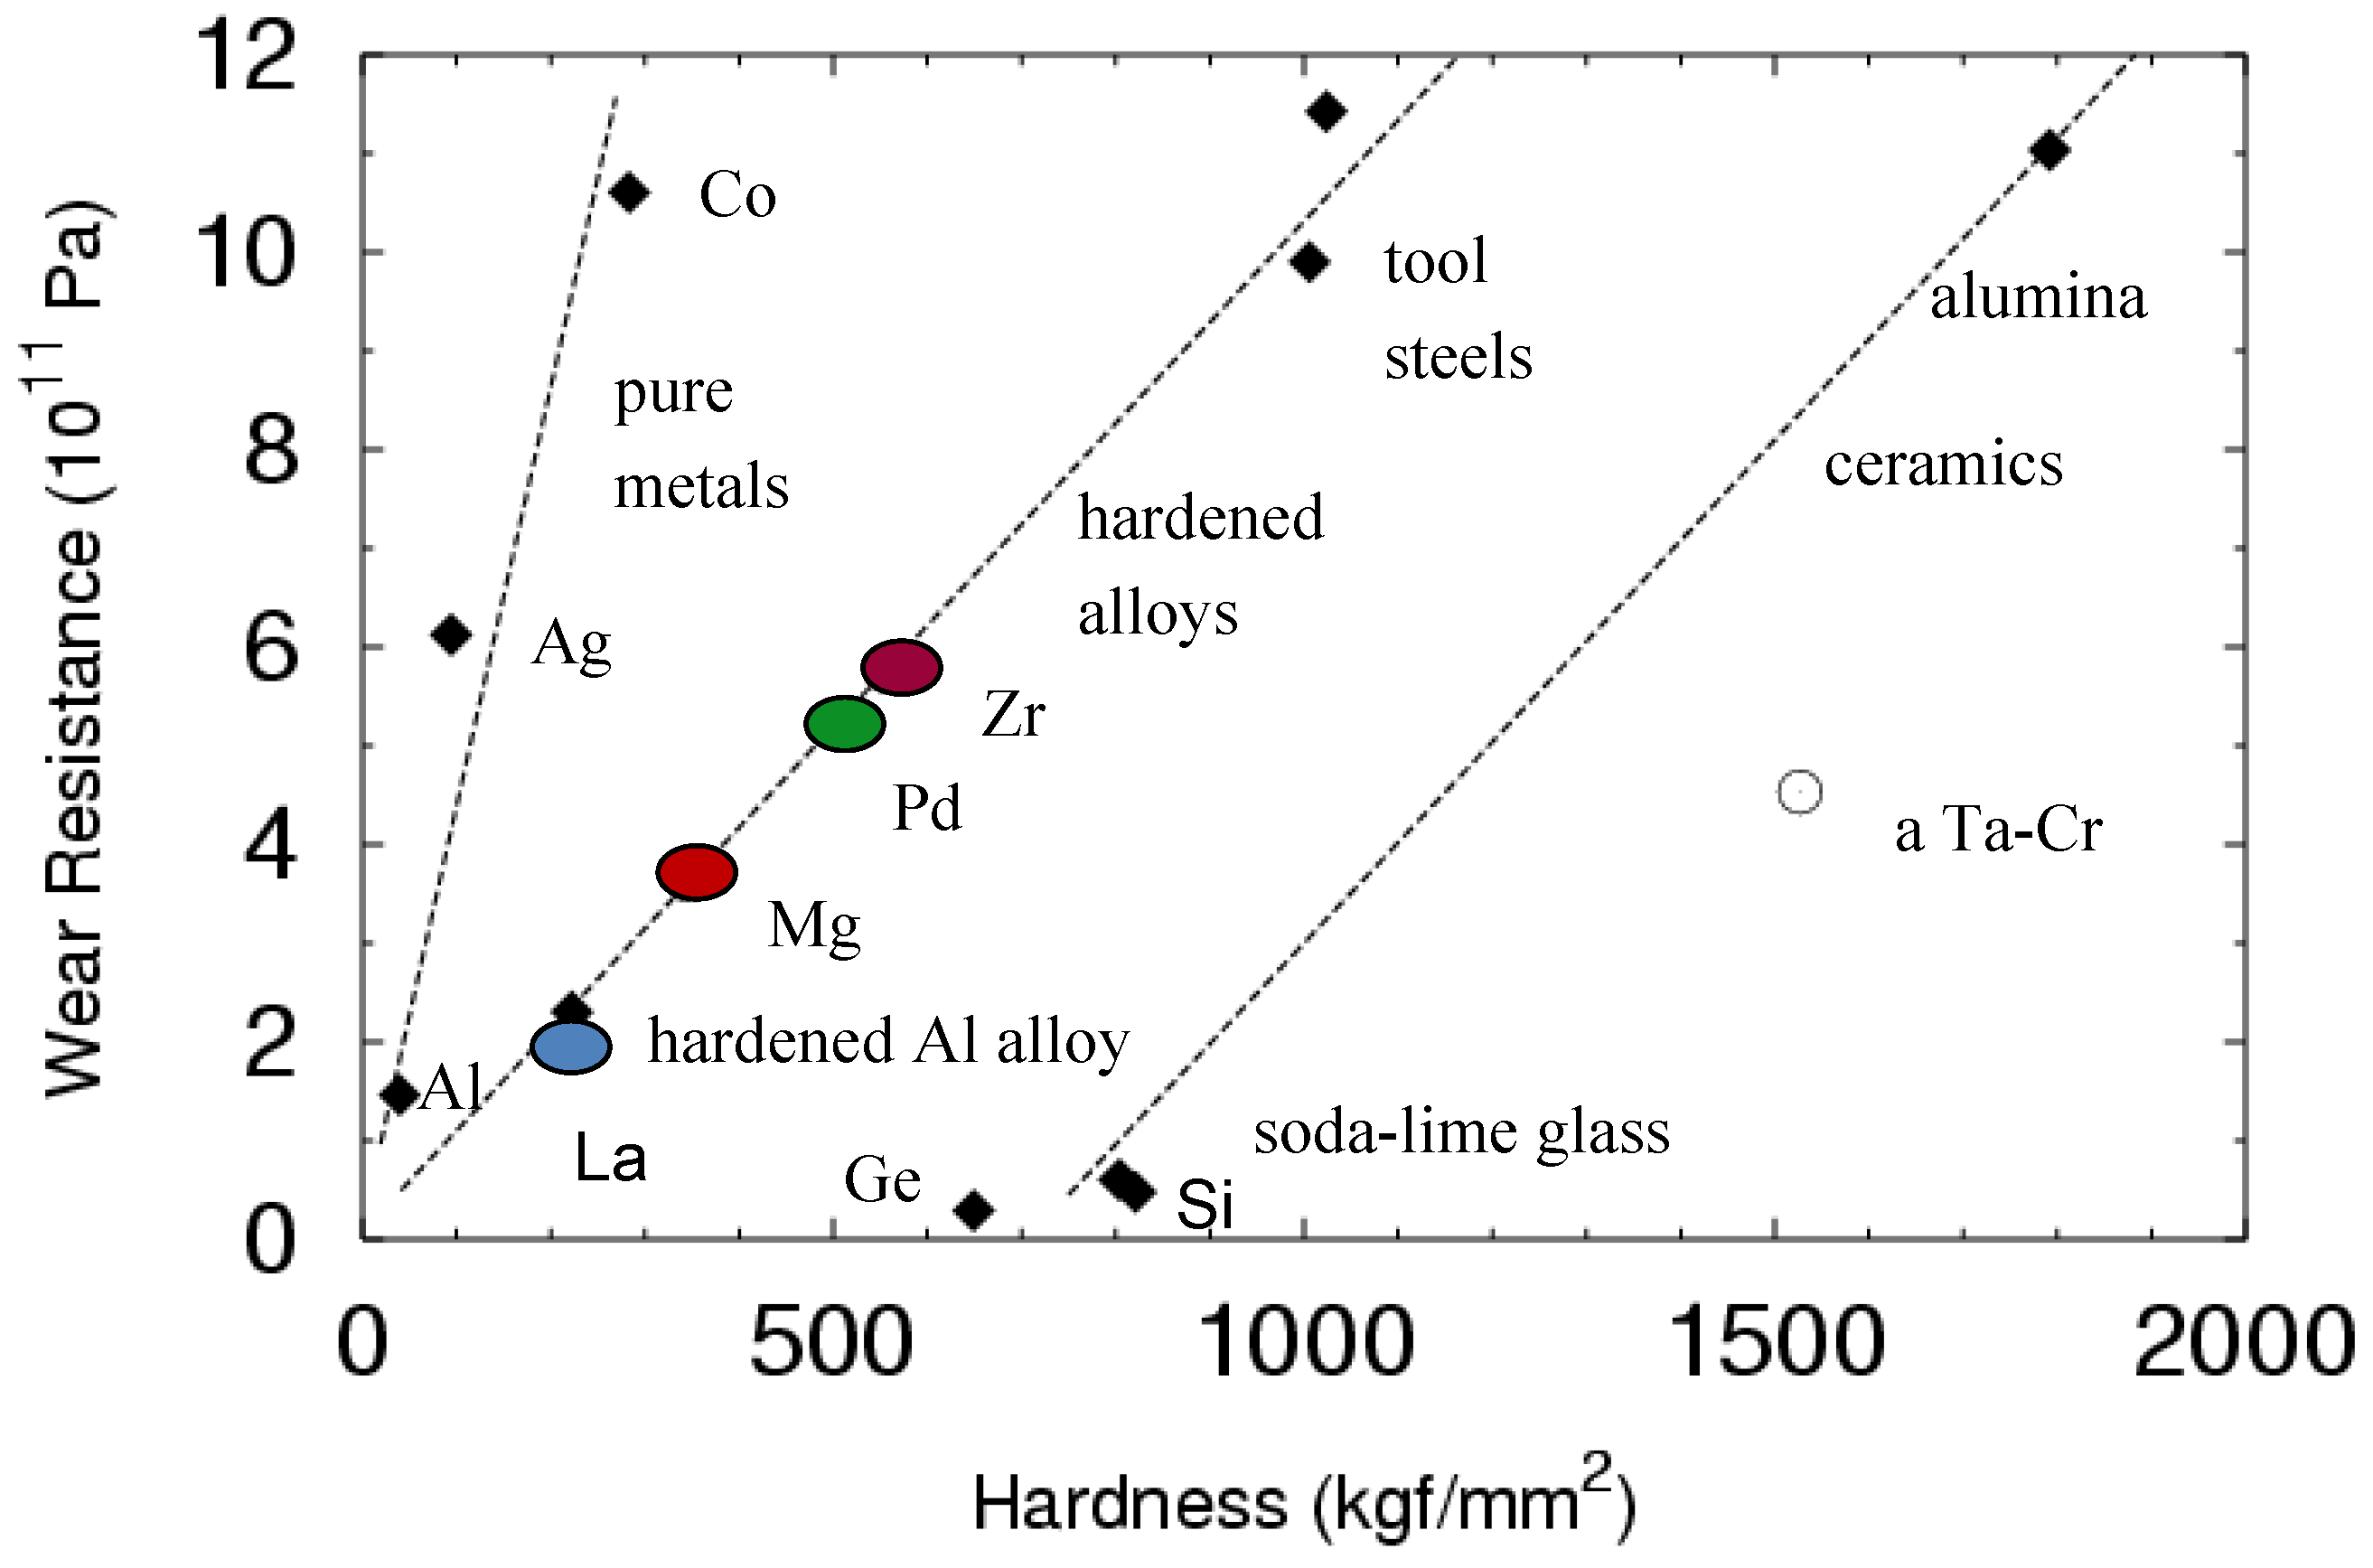
The wear resistance of any material is a property that derives from a combination of hardness and toughness. Abrasive wear resistance of BMGs has now been well characterized and representative data are shown in Figure 3, including data for conventional materials [10,64]. The plot shows data for pure metals, alloys and ceramics—within each class of material, wear resistance increases linearly with hardness, unless the material is brittle, in which case brittle fracture becomes a wear mechanism.
BMGs tend to obey Archard’s wear law,
where Vw is wear volume, S is sliding distance, N is the normal load, H is hardness and K is the dimensionless wear coefficient, a fundamental measure of the wear severity [10]. If a material is less wear-resistant, say due to brittleness, it has higher K. Thus, the parameter K is important in detecting brittleness of a material. Upon embrittlement, metallic glasses show a lower wear resistance and a higher K, as discussed with examples in the comprehensive review by Greer et al. [10]. Table 2 summarizes the K values for 3-body abrasive wear, extracted from Figure 3. All BMGs, including the Mg- and La-based compositions, have rather similar wear coefficients and are in the category of hardened alloys. On the other hand, typically brittle materials like Si, have much larger K values, consistent with their brittleness. This shows that at least for the testing conditions used in these wear tests, all BMGs behave similarly, i.e., are almost equally tough. Based on these data, past work raised the possibility that La- and Mg-based BMGs are probably much tougher than typically brittle materials like oxide glasses [45].
Figure 3.
Correlation of the abrasive wear resistance with hardness for several different material classes [10,64]. Colored oval symbols show data for the bulk glasses with the alloy system being represented by the main element, e.g., Zr for Zr-based BMGs, etc. Within each class of material, the wear resistance scales linearly with hardness. All BMGs lie in the category of hardened alloys instead of ceramics.

Table 2.
Dimensionless Wear Coefficients for selected materials shown in Figure 3.
| Material | Wear Coefficient, K (3-body Abrasive Wear) |
|---|---|
| Zr–Cu–N–Al | 1.03 × 10⁻² |
| Pd-BMG | 0.96 × 10⁻² |
| Mg-BMG | 0.9 × 10⁻² |
| La-BMG | 1.1 × 10⁻² |
| Tool Steel | 0.98 × 10⁻² |
| Hardened Al alloy | 0.93 × 10⁻² |
| Pure Co | 0.2 × 10⁻² |
| Pure Si | 0.15 |
3. What Controls Toughness of Bulk Metallic Glasses?
Bulk glasses can exhibit a range of toughness values, with alloys based on Zr, Cu, or Pd being typically tough, whereas the La-, Mg- and Fe-based systems are less tough [13]. What controls the toughness of glassy alloys has been an issue of much interest. Earlier work has shown that the free volume in a glass plays a major role. For instance, Wu and Spaepen [65] investigated embrittlement in a Fe-based glass upon structural relaxation and reported that, upon heating, the relaxed specimens undergo a brittle-to-ductile transition and the transition temperature (TDB) is a measure of the degree of embrittlement. Furthermore, a neat correlation between TDB and fractional free volume could be established; lower the free volume, greater the TDB. However, it has also been noted that free volume alone may not always explain experimental findings, e.g., Raghavan et al. [66] reported that for relaxation-induced embrittlement in a Zr-based BMG, for the same free volume fraction, TDB can vary widely. This has prompted detailed studies on the toughness of BMGs taking into account possible additional factors that may play a role.
The past decade has seen much activity in correlating toughness with physical properties like elastic moduli—which are not independent of free volume—but offer the advantage of being easily measurable. Moreover, this helps in developing tougher BMGs, since the moduli of most BMGs (apart from the metal-metalloid compositions) can be predicted reasonably well, based on the constituent elements [59]. In this section, we shall examine the various, often inter-related theories, on the toughness of BMGs.
3.1. Toughness–Poisson’s Ratio Correlation
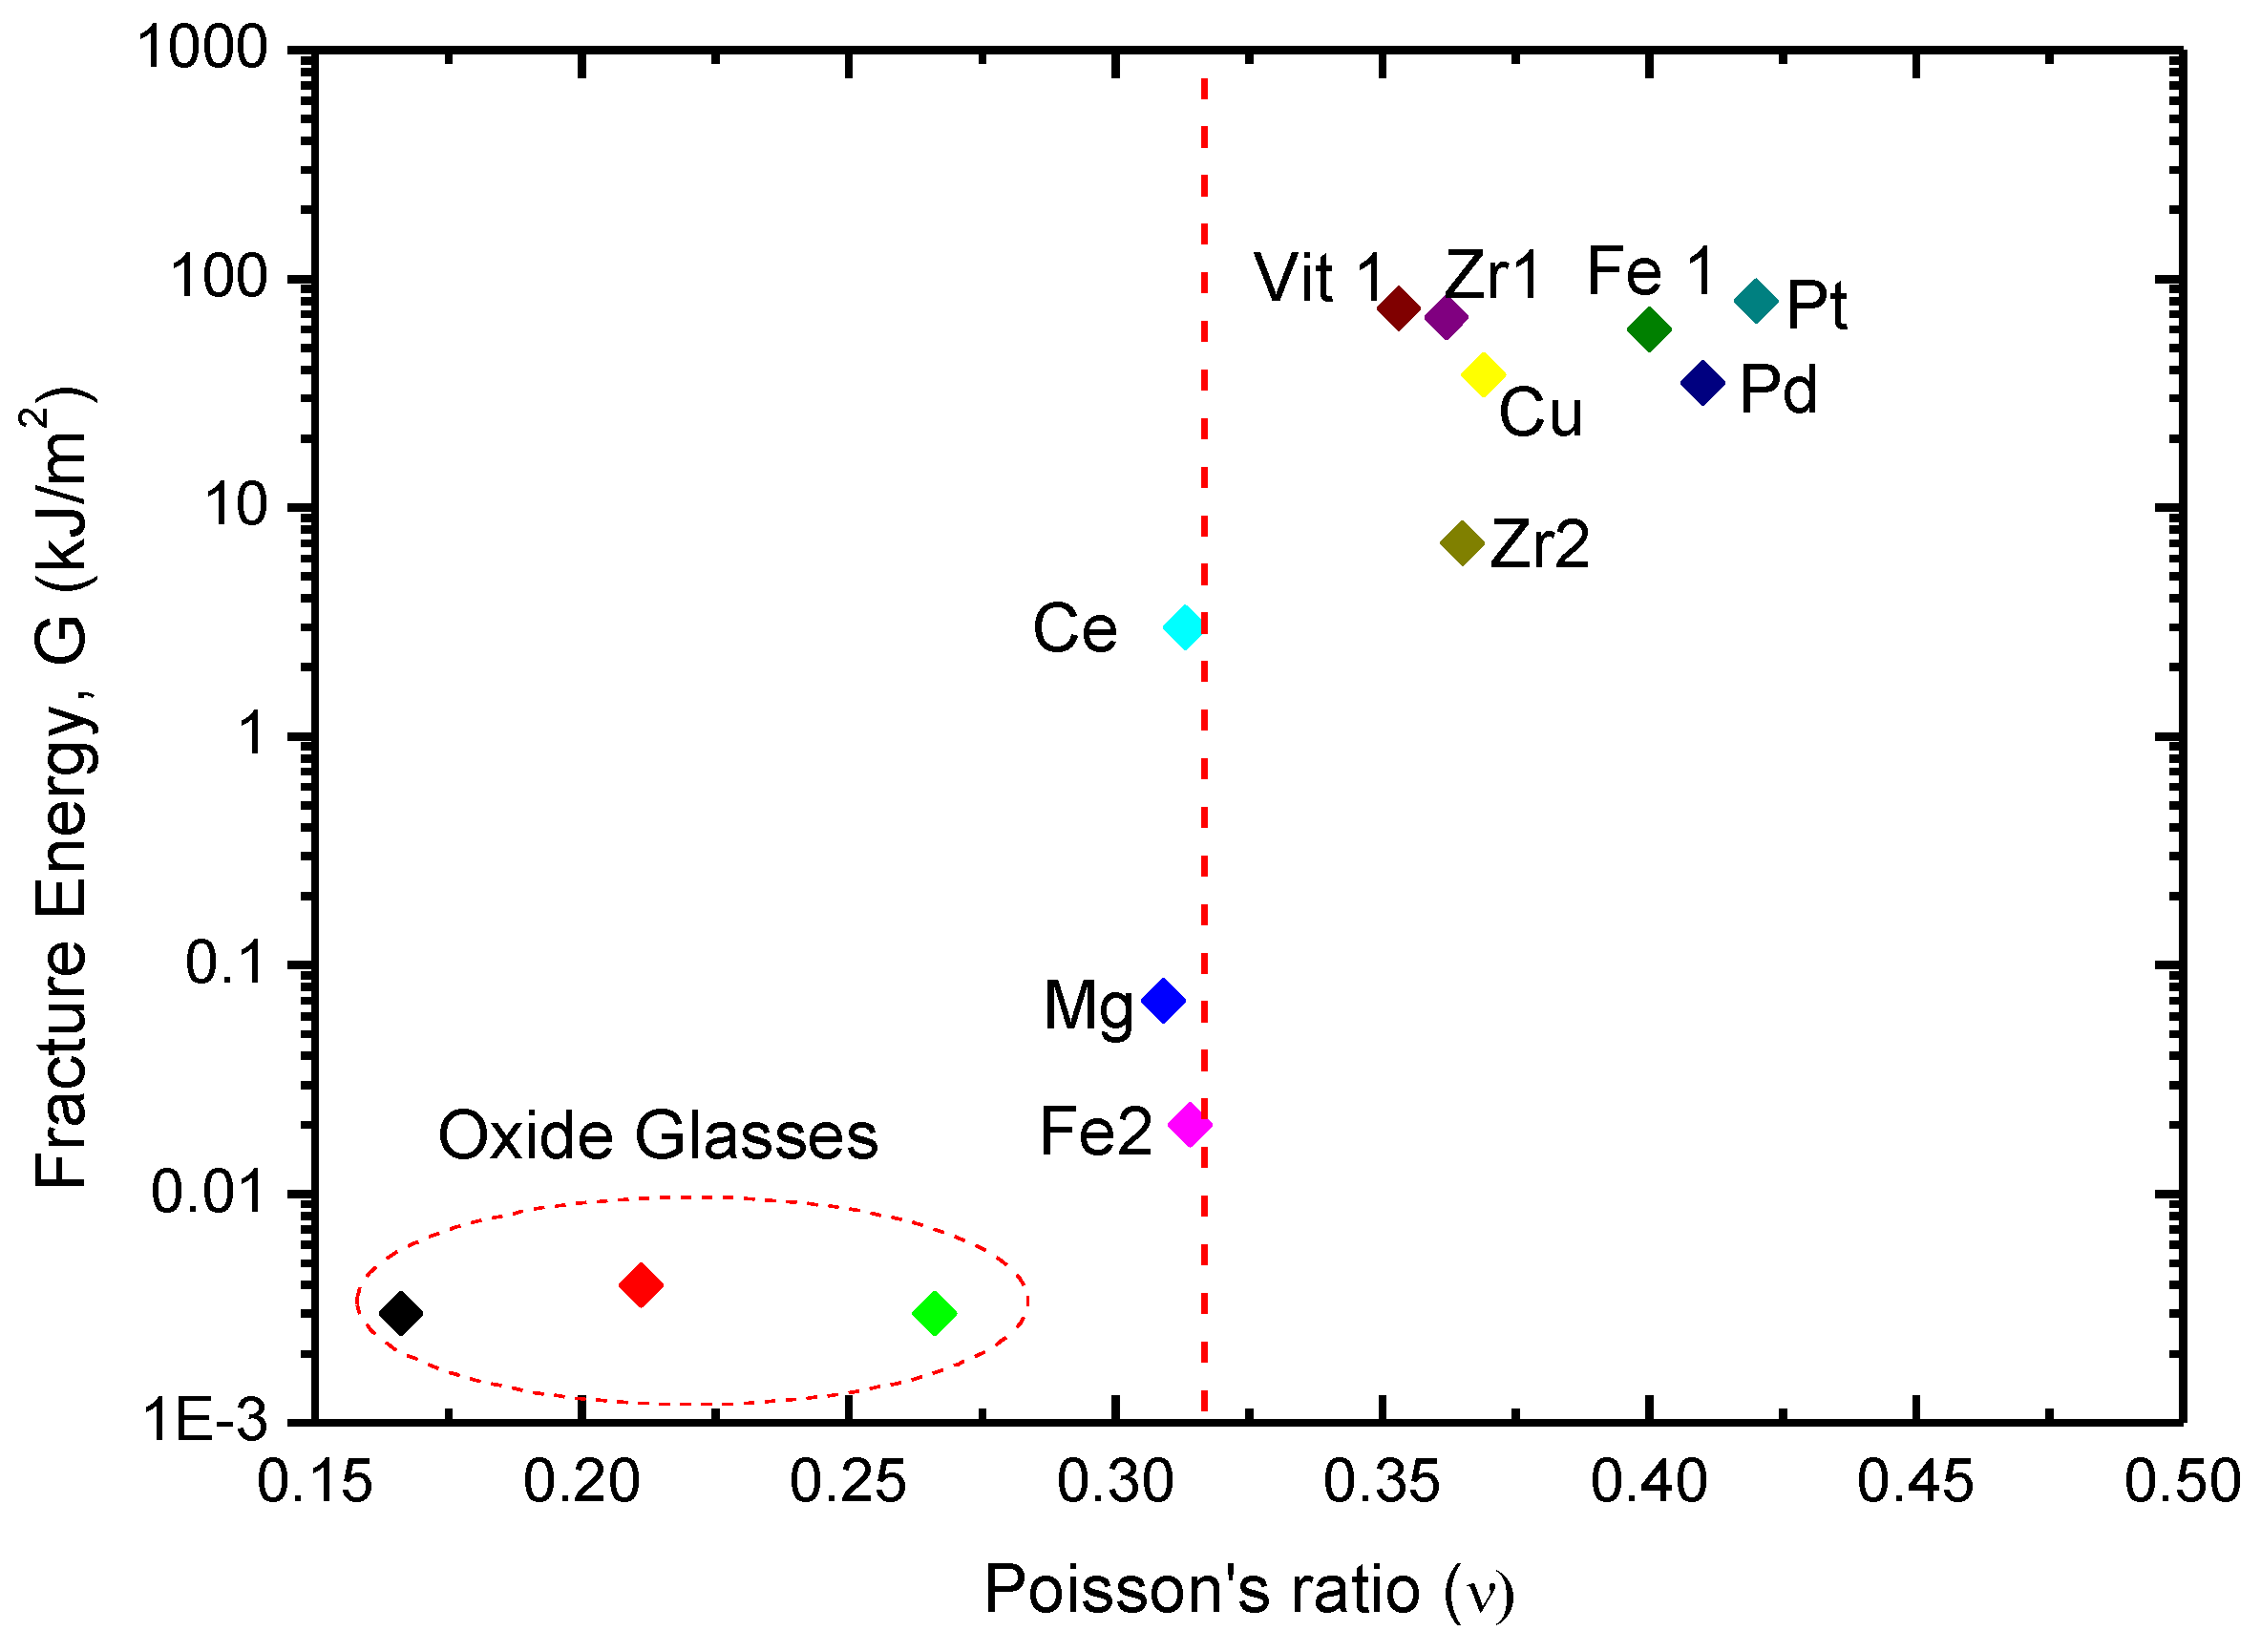
Chen et al. [67] first realized that the Poisson’s ratio (ν) of a metallic glass influences toughness, also later proposed to explain the high notch toughness of a Pt-based BMG [68]. The brittleness or plasticity of a wide range of BMGs was correlated with ν (or equivalently, the ratio of the shear modulus, μ, to bulk modulus, B) of the alloy [69,70]. The idea is that μ represents the resistance to shear flow and B, the resistance to volume dilatation involved in cracking; ultimately, toughness will be controlled by whether the material undergoes shear flow, or shows cracking and the ratio μ/B (or ν) should play a role in deciding toughness. Figure 4 replots the data (taken from [69]) for various as-cast BMGs, which shows that fracture energy (G) reduces with decreasing ν and there appears to be a critical ν of 0.31–0.32, below which toughness apparently plummets, almost to the level of oxide glasses. The physical origin of the low toughness (and Poisson’s ratio) of oxide glasses in comparison to most BMGs lies in their rigid covalent bonding, because of which cracking, rather than shearing (plastic flow) becomes the preferred deformation mechanism. In fact, recent work [71] has quantified the energy needed for the competing processes of fracture and shear in BMGs. Whether a glass undergoes shearing or cracking depends on two factors: (1) the ratio of the deformation strain energy density (UD) to volume strain energy density (UV) and (2) the ratio of the resistance of a glass to shearing (WD) to cracking (WV). These quantities are as under:
If (UD/UV) exceeds (WD/WV), the glass undergoes shear flow (is plastic), else it shows cracking (is brittle). The transition is predicted to occur at a ν = 0.31–0.32. The approach draws upon earlier work by Kelly et al. [72] on the ductility/brittleness of crystalline materials, who showed that the ratio of the largest tensile stress to the largest shear stress ahead of a crack tip controls ductile/brittle behavior. If this ratio exceeds the ratio of ideal cleavage stress to ideal shear stress of the material, brittle fracture would occur; for the converse case, some plasticity can be expected. However, for crystalline materials, the transition from ductile to brittle is not as sharp as the apparent transition that occurs for BMGs in Figure 4.
There have been mixed reports in the literature about the existence of a critical ν for BMGs. The notch toughness of Fe-based BMGs and compressive plasticity could be improved through alloying to increase the Poisson’s ratio to above 0.32 [57,73]. Conversely, the fracture toughness of Zr-based glasses, all with similar Poisson’s ratios (~0.36) varies widely from 27.3 to 96.8 MPa.m1/2 [25]. Likewise, the notch toughness of Cu-based BMGs [74] and annealing-induced embrittlement in two Zr-based BMGs was not found to bear any correlation with a critical ν [66,75].
Figure 4.
A plot of fracture energy versus Poisson’s ratio for a range of bulk metallic glasses and oxide glasses. Data are taken from Lewandowski et al. [69]. There seems to be an apparent tough-to-brittle transition at a critical Poisson’s ratio of 0.32, marked by the red dotted line. The symbols represent the following BMGs—Pt: Pt57.5Cu14.7Ni5.3P22.5; Vit 1: Zr41Ti14Cu12.5Ni10Be22.5; Zr 1: Zr57Ti5Cu20Ni8Al10; Fe1: Fe80P13C7; Cu: Cu60Zr20Hf10Ti10; Pd: Pd77.5Cu6Si16.5; Zr2: Zr57Nb5Cu15.4Ni12.6Al10; Ce: Ce70Al10Ni10Cu10; and Mg: Mg65Cu25Tb10; Fe2: Fe50Mn10Mo14Cr4C16B6.
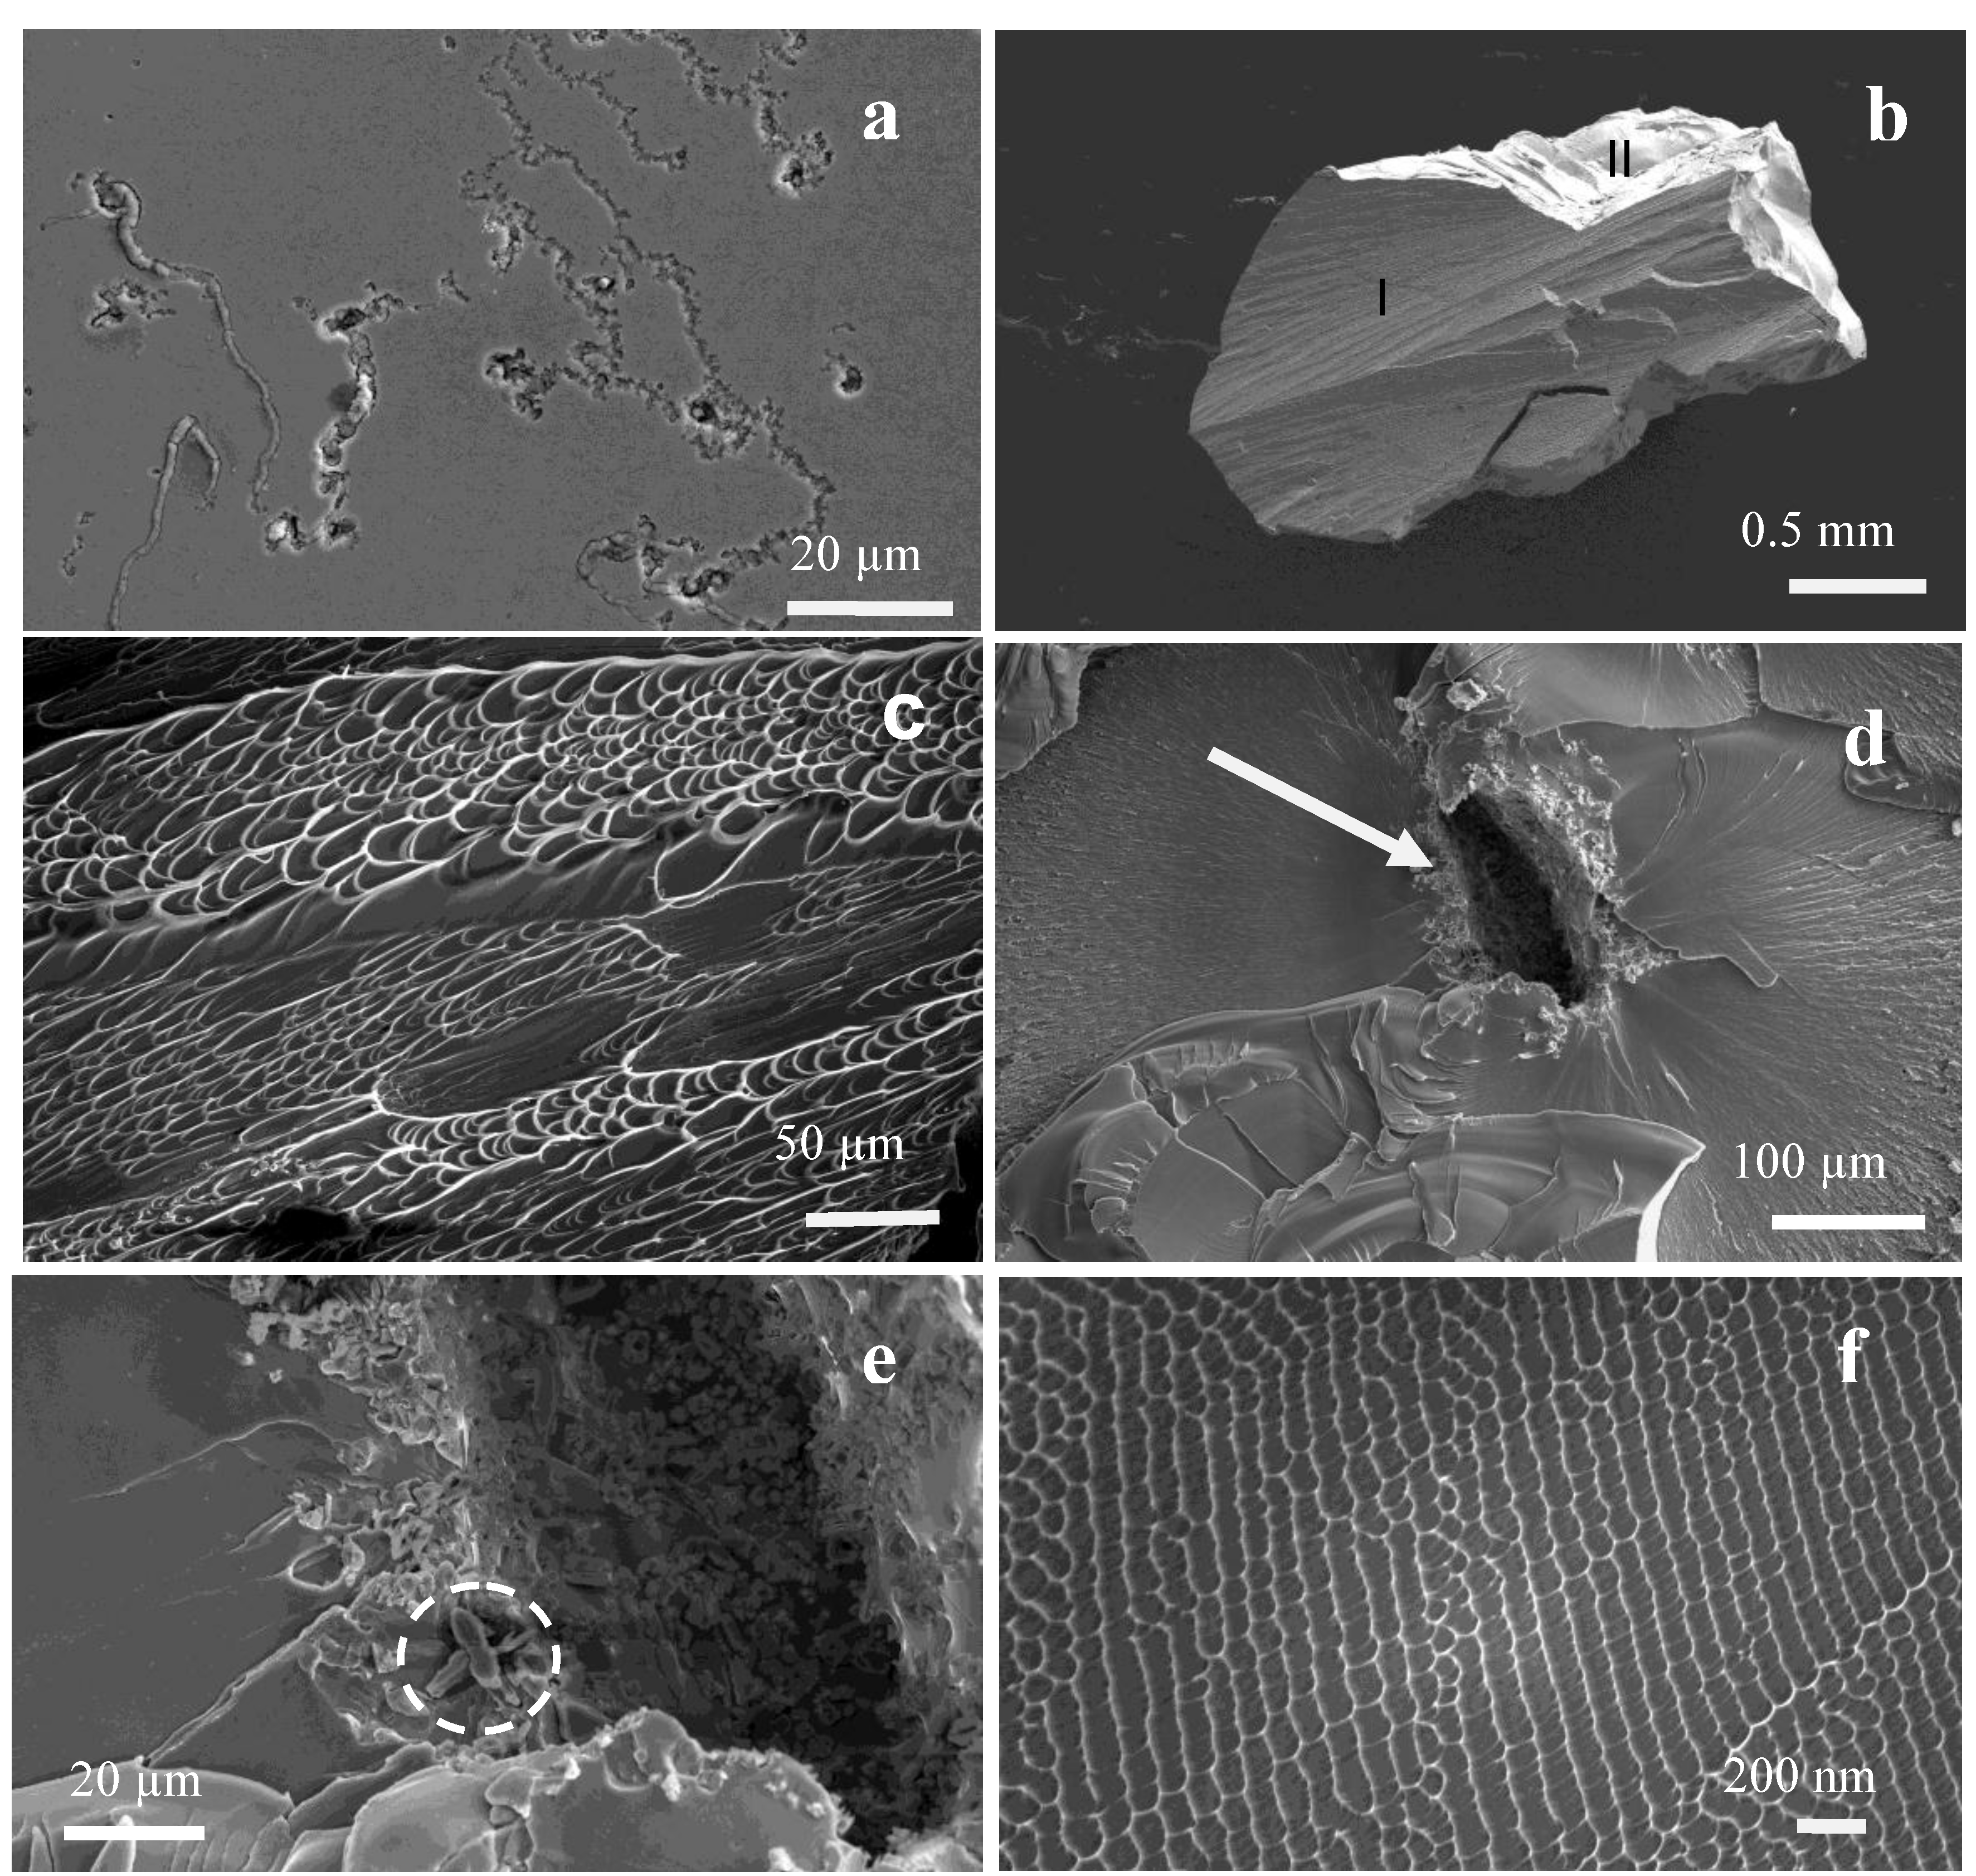
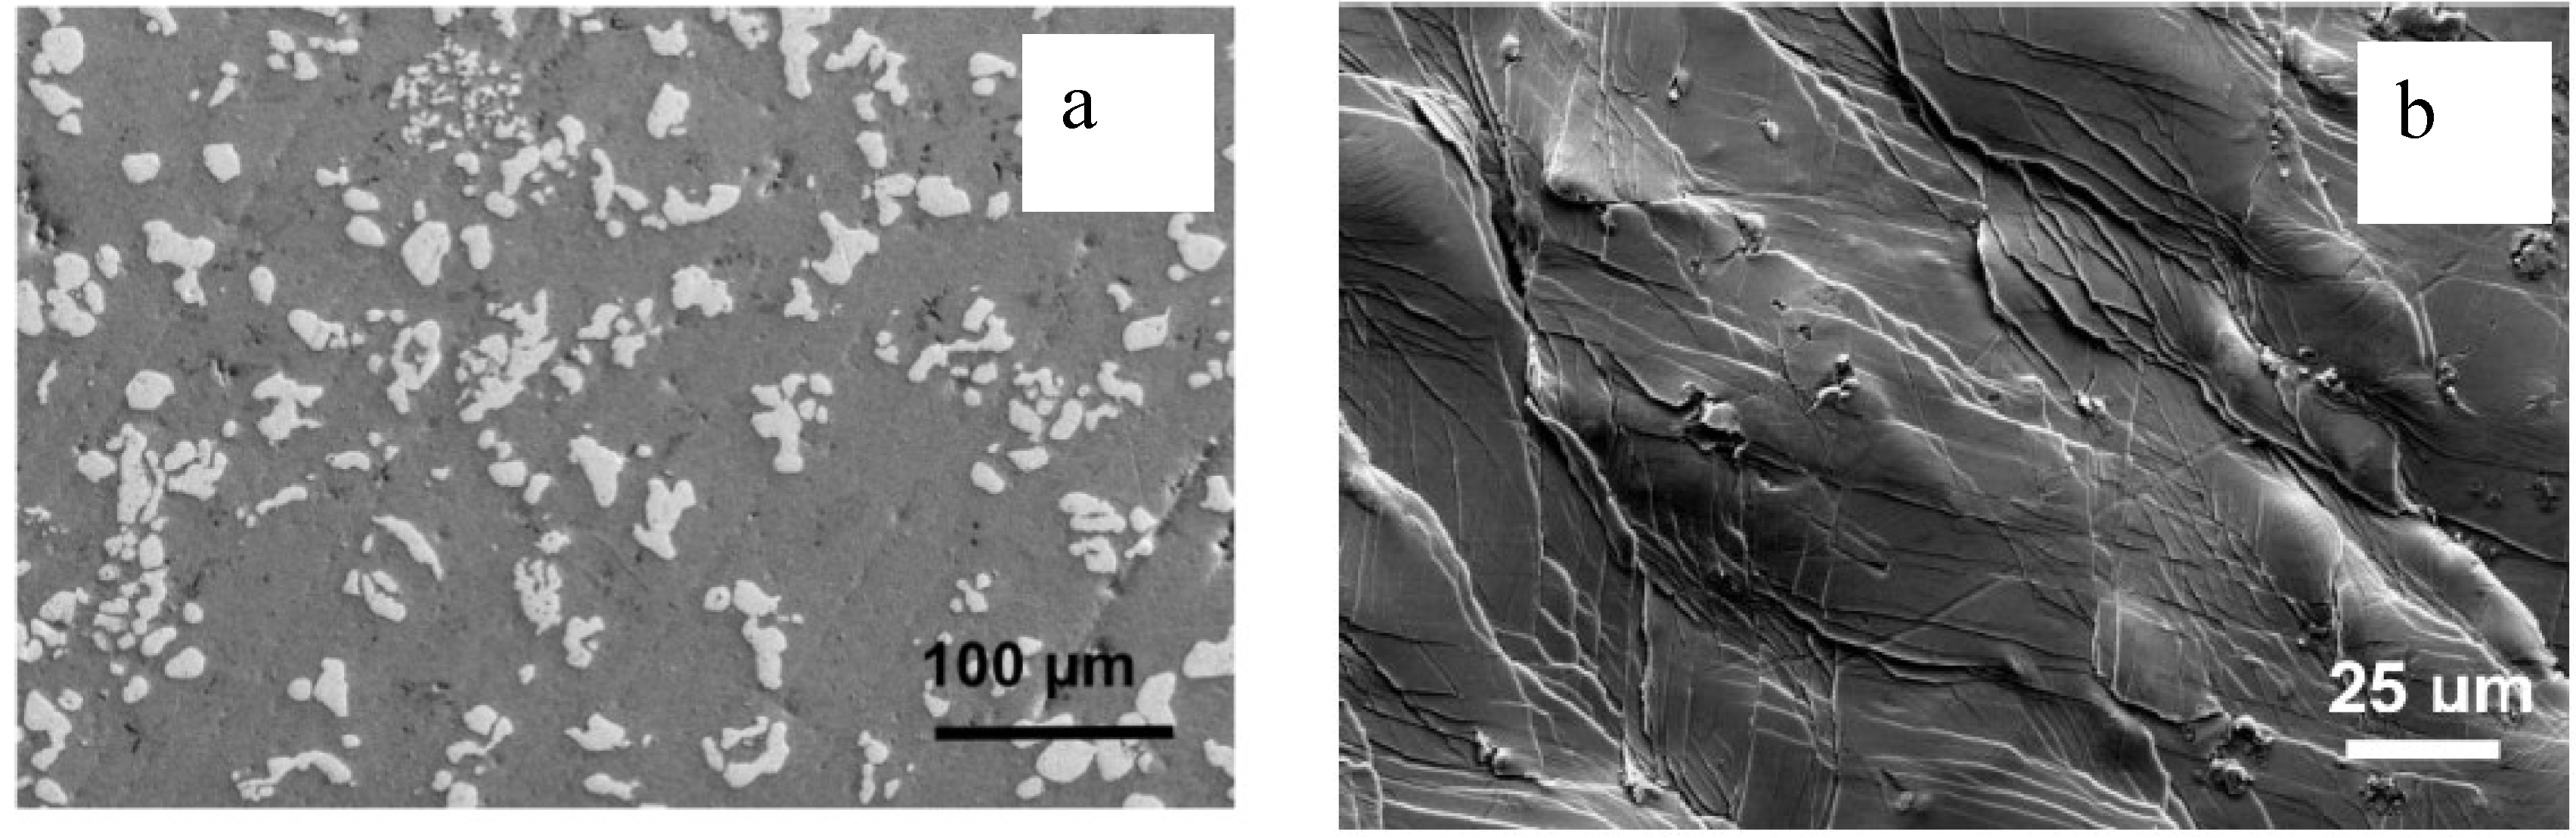
Recent work [45] raised the issue of extrinsic effects on toughness data. In Figure 4, it has been assumed that G is an intrinsic material property. But it was noted that alloys like Mg- or rare earth-based compositions are very reactive and, unlike Zr- or Ti-based BMGs, have very low solubility for oxygen, inevitably leading to oxide inclusions. Figure 5a shows an example of such inclusions dispersed in a Mg65Cu25Tb10 glass, containing ~1000 appm oxygen. It was argued that the material is inherently capable of shear flow, but inclusions initiate cleavage fracture. Figure 5b–f shows fractographs for the Mg-based glass—clearly, the material can show micron scale shear band vein patterns, indicative of shear flow.
Figure 5.
(a) Mixed oxides of Mg and Tb in a Mg65Cu25Tb10 glassy matrix. (b) A fractured piece of the alloy after compression testing. Two regions, I and II are seen, that correspond to shear failure and brittle fracture respectively. (c) Region I shows vein patterns with a size of ~10 μm. (d) Region II consists of a flat, mirror-like fracture surface. Clear crack initiation sites are visible, as pointed by the arrow. (e) A closer view of a crack initiation site, which is a cluster of oxide particles. The dotted circle highlights an individual oxide particle. (f) Typical nano-scale fractographic features are seen in region II. Reprinted from [45], with permission from Elsevier.

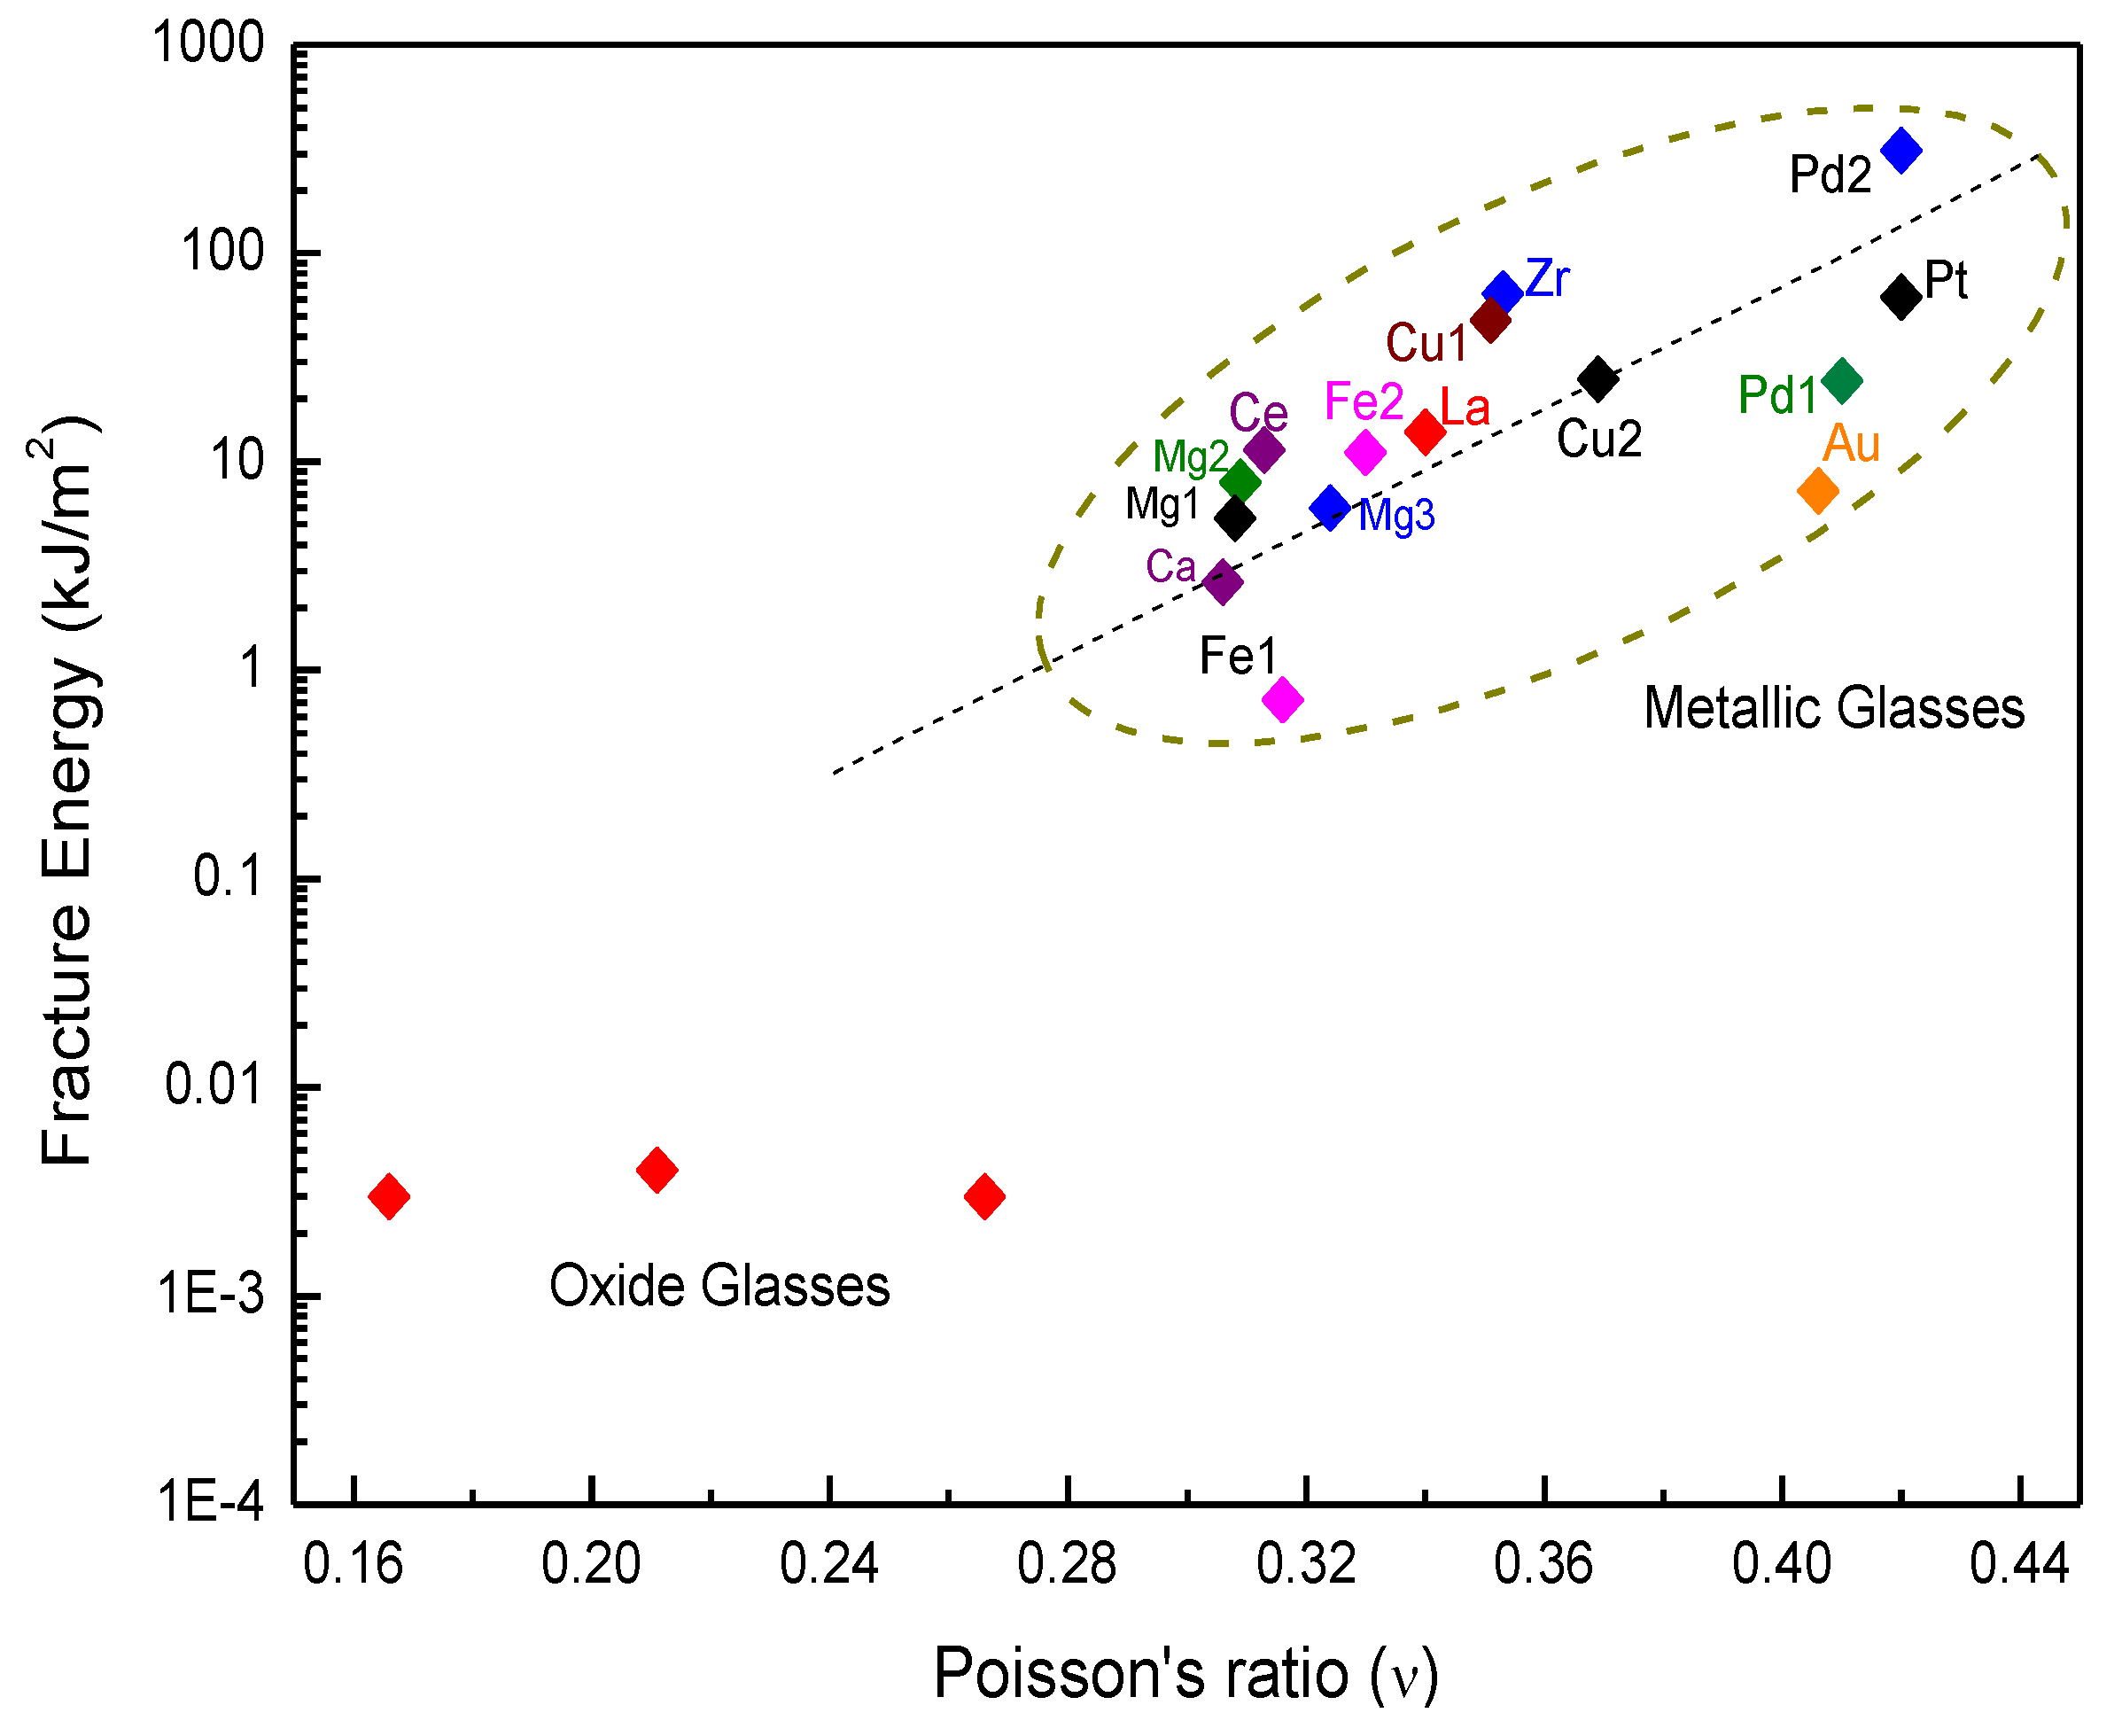
The findings, i.e., oxides nucleating cracks, were also found to hold good for the La-based glasses. It could be argued that the Mg- and La-based glasses are sensitive to oxides precisely because they lie close to the critical ν and hence have a low toughness. In other words, glasses having a higher ν would be immune to such embrittling effects. This aspect was investigated [45] and it was found that the tougher glasses like Cu49Hf42Al9 (ν = 0.351) also embrittle when oxygen is intentionally added to the alloy, at levels (~1700 appm) sufficient to form oxygen-rich phases. In this Cu-based glass, the fracture mode is normally shear, which changes to quasi-cleavage upon introducing the oxygen-rich phases. Similarly, Zr-based glasses undergo embrittlement due to brittle phases, either oxygen-containing [76,77] or other intermetallics [78]. Even for Pd-based BMGs with high ν, Granata et al. [79] found plastic strain to decrease with oxygen content. It was thus argued in [45] that most of those BMGs in Figure 4 are capable of shear flow (at least under compression) but it is the presence of oxides, which induces quasi-cleavage fracture with nanoscale corrugations. The fundamental question is why do BMGs that usually form shear bands, should undergo quasi-cleavage fracture, when the glass is dispersed with just 1–3 volume percent brittle oxide phases? The author speculates that the oxides may be effectively behaving like cracks with a curvature radius (R) lower than the critical wavelength (λc) for meniscus instability essential for shear fracture. As stated in Section 2.2, shear fracture will be suppressed in such a scenario. However, this needs further investigation. Madge et al. [45] used the length scale of shear fracture features, i.e., vein patterns, to estimate the mode II toughness of all BMGs via Equation (2). Figure 6 reproduces their data showing the re-calculated mode II fracture energies as a function of Poisson’s ratio, for a range of BMGs. The trend now seen is quite different—the fracture energy spans two orders of magnitude, instead of four orders, and the sharpness of the ductile-brittle transition is lost; instead fracture energy gradually decreases with decreasing ν.
Figure 6.
The correlation between mode II fracture energy (based on shear band vein patterns) and Poisson’s ratio. The BMGs represented are, Fe1: Fe48Cr15Mo14Er2C15B6; Fe2: Fe66Cr3Mo14C15B6; Ca: Ca65Mg15Zn20; Mg1: Mg65Cu25Gd10; Mg2: Mg65Cu25Tb10; Mg3: Mg64Ni21Nd15; Ce: Ce60Al20Cu10Ni10; La: La55Al25Co5Cu10Ni5; Cu1: Cu49Hf42Al9; Cu2: Cu60Zr20Ti10Hf10; Pd1: Pd77.5Cu6Si16.5; Pd2: Pd79Ag3.5P6Si9.5Ge2; Pt: Pt57.5Cu14.7Ni5.3P22.5; Au: Au49Ag5.5Pd2.3Cu26.9Si16.3; and Zr: Zr41.2Ti13.8Cu10Ni12.5Be22.5. All BMGs are much tougher than oxide glasses and their toughness gradually increases with Poisson’s ratio instead of an abrupt increase at a critical value of the Poisson’s ratio. Reprinted from [45], with permission from Elsevier.

It is noteworthy that glasses with similar ν show widely varying fracture energy (about an order of magnitude), suggesting that the alloy chemistry also plays a major role. Indeed, the indentation toughness data shown earlier (Figure 2 and Table 1) show much variation for alloys with similar Poisson’s ratio. Another point is that BMGs are tougher than oxide glasses, also reflected in the wear data in Figure 3 and Table 2.
That Mg- or La-based glasses are capable of forming shear bands is also evident through the large compressive plasticity seen in composites based on these glasses. For example, Mg65Cu25Tb10 reinforced with Ti shows extensive shear banding and large plastic strain under compression [80]. La-based BMGs also show similarly high plasticity when reinforced with Ti [81] or Ta [82] particles. Figure 7 shows an example of a La-based glass reinforced with Ta particles—under compression, multiple shear bands form that lead to large plastic strains of up to 40%. A profoundly brittle material, even when reinforced with 10–20 vol. % ductile particles, is unexpected to show legitimate shear flow.
Figure 7.
(a) A scanning electron micrograph showing Ta particles dispersed in a La55Al25Cu10Ni10 glassy matrix. (b) Multiple shear band offsets can be seen on samples tested under compression, which reach strains up to 40% (reproduced from [82]).
Figure 7.
(a) A scanning electron micrograph showing Ta particles dispersed in a La55Al25Cu10Ni10 glassy matrix. (b) Multiple shear band offsets can be seen on samples tested under compression, which reach strains up to 40% (reproduced from [82]).
A characteristic of very brittle materials is a large difference in their tensile and compressive fracture strength, because any flaws in the material cause pre-mature fracture under tension. For BMGs, this can be seen in the work of Li et al. [50] who studied the effect of annealing on tensile/compressive behavior of a Zr-based glass (Vit 105). The embrittled Vit 105 shows a tensile strength <600 MPa compared to compressive strength of 1660 MPa. For some samples, tensile tests were not even possible due to extreme brittleness, although the compressive strength remained high, at 1876 MPa. So, a truly brittle BMG might be expected to possess a large asymmetry in the tensile and compressive fracture strength. Yet, Lee et al. [83] have reported identical tensile and compressive strengths of 550 MPa for a La62Al14Cu12Ni12 BMG. The compressive fracture strength for a Mg65Cu25Tb10 glass is ~900 MPa [45], whereas the yield (fracture) strength for this glass under 3-point bending (which entails mixed mode I/II loading) is reported to be 660 MPa [44], which is probably not a huge difference, especially considering that the samples were prepared in different laboratories and may contain varying amount of oxide inclusions. These facts, though preliminary, suggest that La- or Mg-based BMGs may have much greater fracture energy under tension than oxide glasses. However, more data are necessary to draw any firm conclusions.
Also, the stress state is expected to significantly affect toughness [45,84]. Figure 6 relates only to mode II failure, but the trend may be very different for other states of loading. A good approach would be performing valid KIc tests on fatigue pre-cracked samples and comparing toughness data for all BMGs. However, this would mean first designing better casting/filtration techniques to ensure that samples are free from oxide inclusions, which would otherwise affect all toughness data.
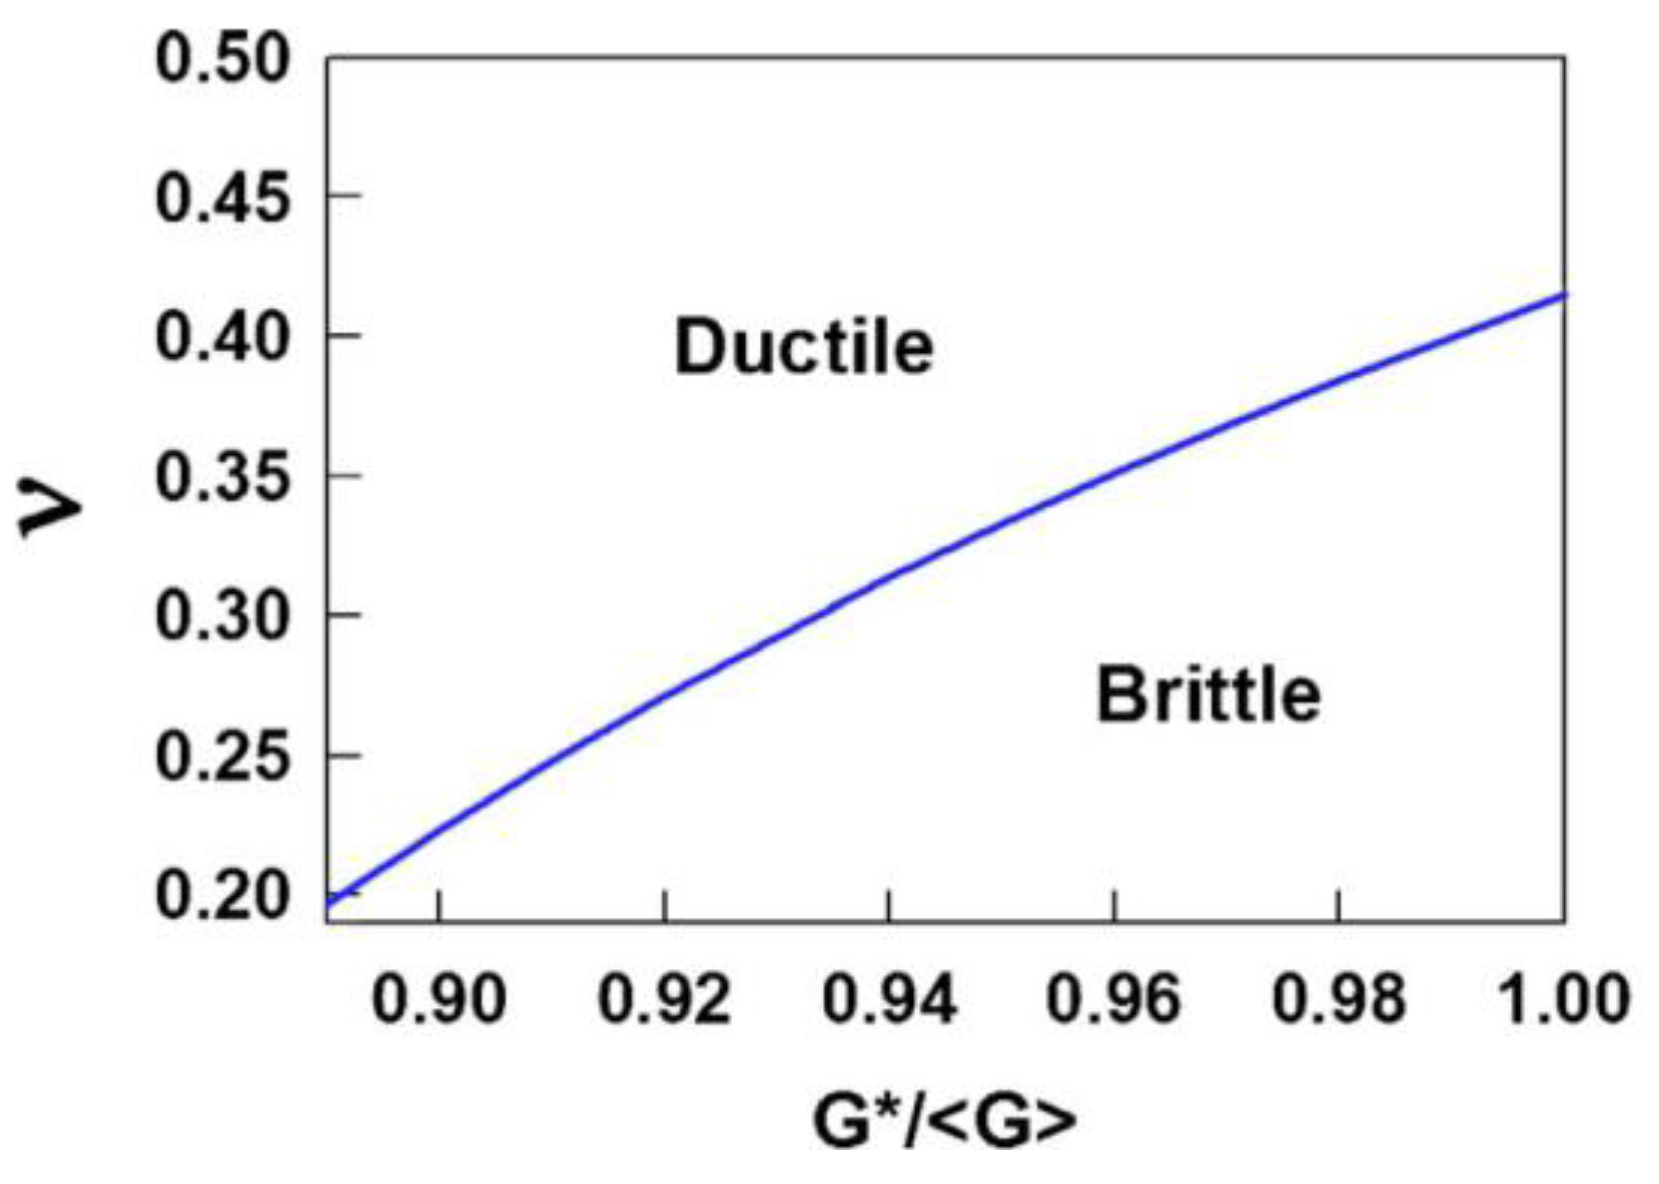
So, the question is how does one reconcile the experimental facts in Figure 6 with the theory by Liu et al. [71], which predicts a critical Poisson’s ratio? The answer may lie in local elastic moduli. It has been suggested that apart from Poisson’s ratio, the local structure, i.e., short-range order in the glass can affect toughness [84,85]. Poon et al. [85] have clearly shown that for a given global Poisson’s ratio, local fluctuations in shear modulus at the STZ scale, arising from topological and chemical ordering in the glass, also influence the tendency to form shear bands and thus the toughness of the alloy. Their findings are reproduced in Figure 8; a glass can move between the ductile and brittle regimes depending on Poisson’s ratio and local shear modulus. Modeling work on a variety of amorphous systems has indicated that a change in the local coordination number can affect toughness [86]. This seems the most plausible explanation for the scatter in fracture energy for a given Poisson’s ratio in Figure 6, e.g., in spite of high ν, the Au-based glass possesses much lower toughness/fracture energy than Pt- or Pd-based systems.
Thus, it is reasonable to infer that toughness of BMGs depends significantly on elastic properties like Poisson’s ratio. However, other factors like alloy chemistry, ordering and stress state also play a role such that there is significant variation in toughness/fracture energy at any given Poisson’s ratio and hence the transition between tough and brittle glasses is probably less sharp than once thought. In a sense, it may be similar to the ductile-brittle transition for crystalline materials [72], with the boundary between ductile and brittle materials not being very sharp.
Figure 8.
Plasticity or brittleness of BMGs depends on Poisson’s ratio as well as local fluctuations in shear modulus. G* is the local shear modulus and <G> is the global shear modulus of a glassy alloy. Reproduced from [85] with permission from Applied Physics Letters. Copyright (2008), AIP Publishing LLC (Melville, NY, USA).

3.2. Toughness and Shear Transformation Zones (STZs)
The fundamental carriers of plasticity in metallic glasses are shear transformation zones (STZs), which are clusters of atoms in the glassy structure that, upon application of stress, undergo cooperative rearrangement from one low energy configuration to another (in the potential energy landscape), in the process surmounting a barrier corresponding to an activated state with greater energy [13,87,88]. In a metallic glass subjected to a critical shear stress, an STZ first forms at a site of greater free volume; secondary STZs may form around the primary STZ due to local strain fields and any free volume generated by the primary STZ. The process can repeat, leading to the formation of a shear band nucleus, which consists of a series of STZs. Above a critical shear strain, the nucleus propagates as a shear band, seen as macroscopic yielding in the metallic glass [13,20,88].
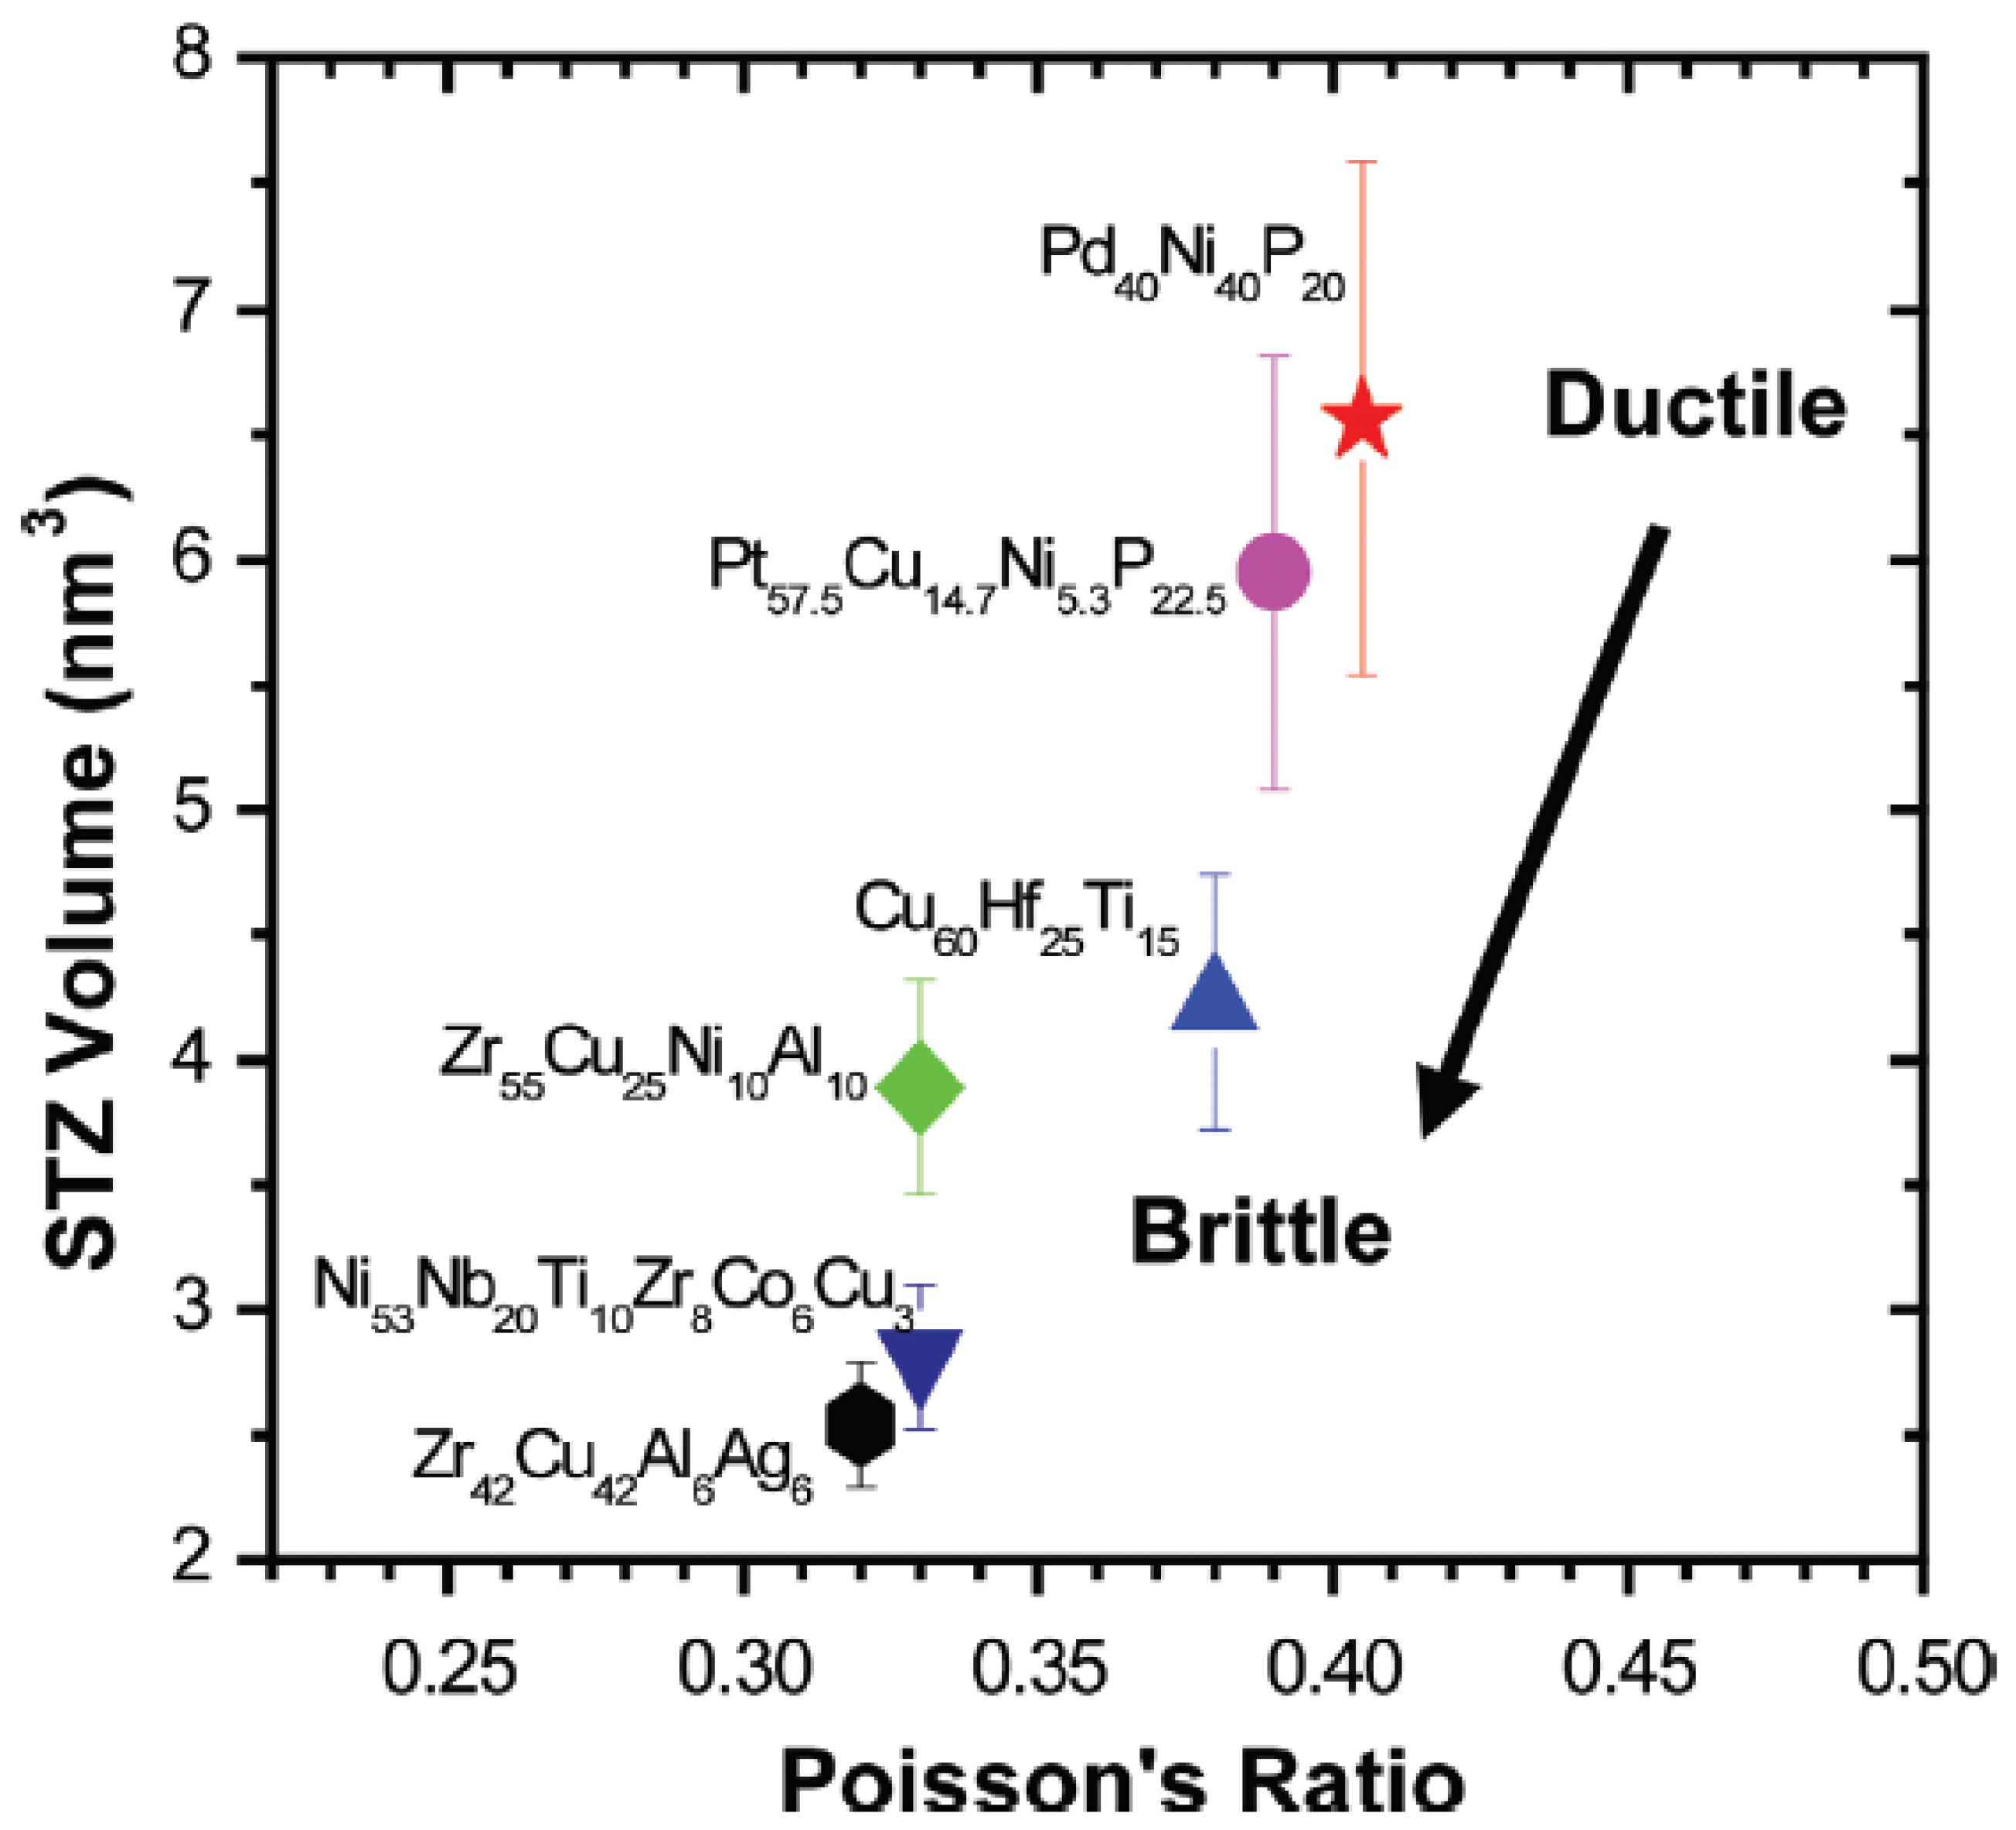
STZ size is now known to be important to BMG toughness and it has been experimentally estimated through nano-indentation at varying loading rates [88]. Pan et al. [88] estimated the activation volume for shear transformations through the strain rate sensitivity of hardness and the STZ volume was further calculated from the activation volume, using the cooperative shear model proposed earlier [89]. It was shown that the tougher BMGs have a larger STZ volume as well as Poisson’s ratio (Figure 9). Physically, a larger STZ, in contrast to a smaller STZ, requires the activation of a lower number of STZs for the nucleation of a shear band. With smaller STZ sizes, a greater number of them need to cooperatively shear to generate a shear band, and instead, the competing process of local tensile failure may be favored [90]. The STZ size in BMGs appears to play a similar role as the width of dislocation cores in crystalline materials, where a wider core confers better ductility.
Figure 9.
Correlation of shear transformation zone (STZ) volume with Poisson’s ratio. The tougher glasses tend to have larger STZ volume and Poisson’s ratio. Reprinted from [88], with permission from Proceedings of the National Academy of Sciences PNAS. Copyright (2008) National Academy of Sciences (Washington, DC, USA).

The ductile-brittle transition (DBT) in a Zr-based BMG could not be explained in terms of a critical ν nor free volume content, and it was suggested that STZ size is the parameter controlling DBT [66]. In crystalline materials, toughness is well known to depend upon the testing temperature and strain rate. Recent work has aimed to capture effects of such testing parameters on DBT in BMGs and correlating them with STZ size [50,90,91]. Li et al. [50] related the DBT, caused by structural relaxation, in the Vit 105 BMG to the STZ size and it was demonstrated that STZ size depends on three factors: (i) test temperature; (ii) strain rate; and (iii) free volume fraction in the glass, through Equation (8).
where Ω is the STZ volume, f(T) is a temperature-dependent function, ωo is an attempt frequency, C a constant, is the strain rate, Vf/∆V* is fractional free volume. The tough-brittle transition corresponds to a reduction in STZ volume ~0.17 nm3, below which STZs do not operate, and fracture occurs not through shear but through the quasi-cleavage mechanism involving local tensile failure. As elegantly shown in their work, a higher strain rate, lower temperature or a decrease in free volume, all lead to a reduction in STZ volume, and ultimately to a DBT below a critical STZ size. Likewise, STZ size increases with temperature, lower strain rate and a larger free volume fraction (higher Poisson’s ratio), leading to higher toughness. The theory takes the view that whether a BMG is brittle or tough depends on where it resides in the 3D space of temperature, strain rate and fractional free volume. An example of high strain rates causing brittle fracture in the otherwise tough Vitreloy-1 BMG is seen in the experiments of Jiang et al. [39]. The idea of STZ volume thus seems to offer a more complete picture of ductile-brittle behavior, compared to studies on say the effect of testing temperature [65], which effectively analyzed a 2D section, i.e., free volume and temperature. For metallic glasses, this work is probably the first unified approach that illustrates the complexity of BMG toughness.
It would be interesting to use this approach in investigating the change in toughness of the less-tough glasses with low Poisson’s ratio, i.e., Mg- or La-based alloys. The Au-based BMG (Figure 6) presents a peculiar case—it has a Tg of ~110 °C, so room temperature represents a high homologous temperature (T/Tg = 0.76), and according to the present model, it should have a large STZ volume and toughness. Yet, it has strangely low fracture energy despite its high Poisson’s ratio. Does this mean, for some reason, a low STZ volume? Or do other effects like local changes to the elastic moduli, arising out of ordering play a more dominant role? These questions may be of interest for future work.
3.3. Toughness–Shear Modulus
The shear modulus (μ) is another parameter reported to affect fracture toughness. Based on the cooperative shear model, Johnson and Samwer [89] proposed that the energy barrier to shear flow (W) is related to μ and the molar volume (Vm) for a glass configuration frozen at Tg through the following relation:
The idea is that a glass with low μ and low Tg should have a lower energy barrier to the operation of shear transformation zones (the precursors of shear bands) and hence higher toughness. Demetriou et al. [92] developed newer Fe-based BMGs starting from Fe80P12.5C7.5 and found a greater notch toughness for alloys with lower μ.
The ideas presented in [89] were adapted by Liu et al. [55] to arrive at the barrier energy density for STZ activation (ρ), defined as the barrier energy that must be overcome per unit volume of STZs, for their operation. Alloys with lower values of ρ are expected to be tougher.
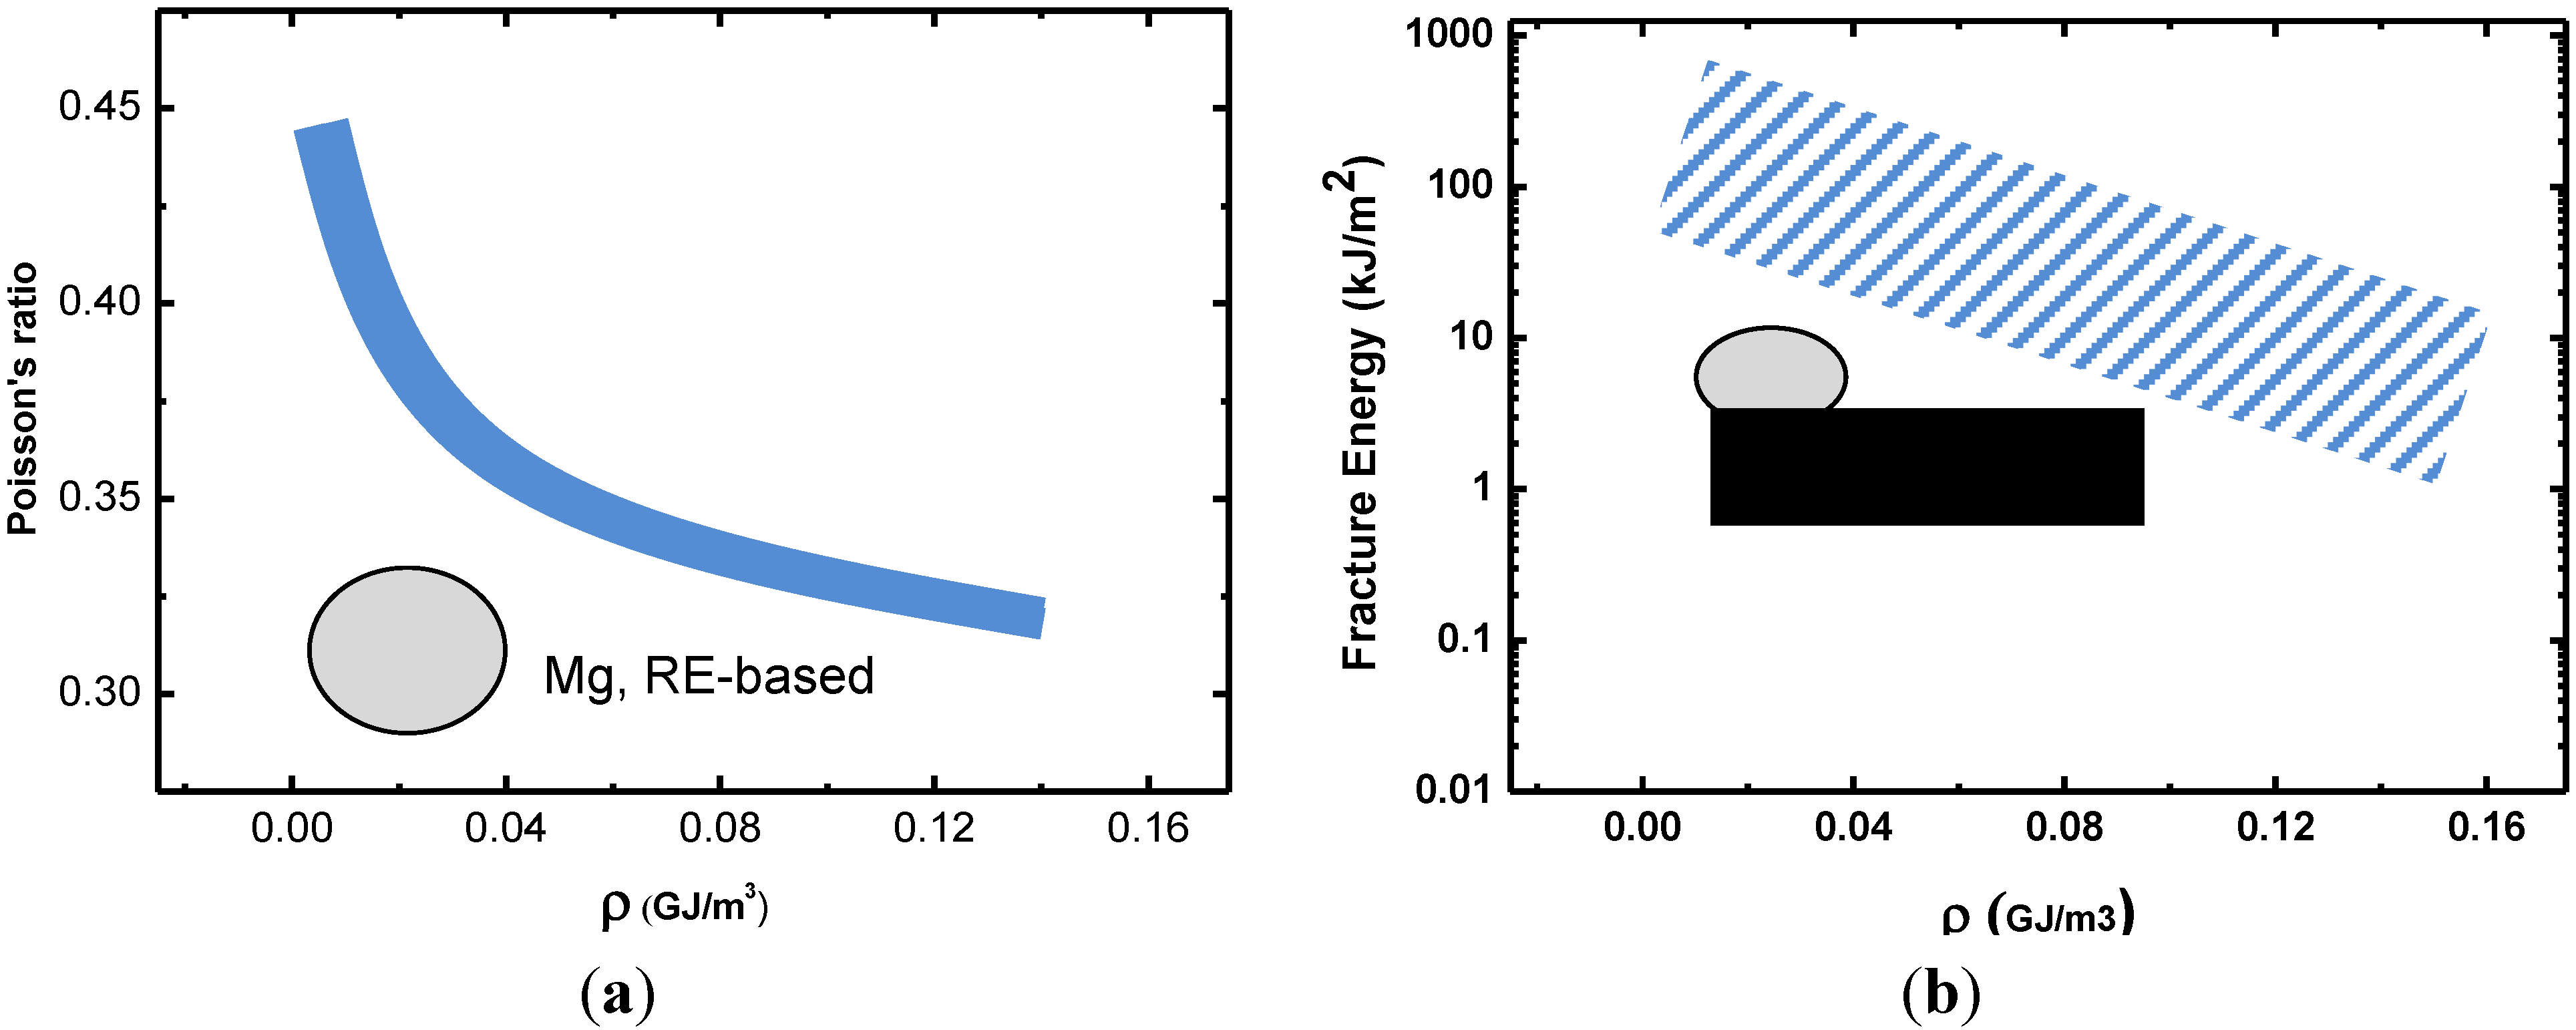
Their findings are shown schematically in Figure 10. In general, a higher Poisson’s ratio correlates with a lower ρ [Figure 10a] and fracture energy (G) increases with 1/ρ, as seen in Figure 10b. The Mg-, Ce- and La-based glasses are outliers in both graphs, attributed by the authors to their low Tg, meaning that deformation at room temperature (a significant fraction of Tg) may be in the transition region from shear bands to homogeneous flow. For any given ρ, there is significant scatter in fracture energy (about an order of magnitude), suggesting that some other factors are at work too. Likewise, indentation toughness varies considerably for BMGs with a similar ρ (Table 1). This is consistent with the scatter in toughness–Poisson’s ratio correlation in Figure 6 and the “other” influencing factors may possibly be short-range ordering in the BMG, leading to fluctuations in the local shear modulus as depicted in Figure 8. Chemistry effects on toughness are clearly seen for a series of Zr–TM–Al (TM = Co, Ni, Cu)—toughness generally increases with ν or a lower μ, but, for a given ν (or μ), alloy chemistry exerts an additional influence [93].
Figure 10.
Schematic plots based on the work in [55], showing inverse correlation between STZ barrier energy density and (a) Poisson’s ratio and (b) fracture energy. The Mg- and rare earth (RE)-based BMGs are outliers, probably because of their low glass transition temperature.
Figure 10.
Schematic plots based on the work in [55], showing inverse correlation between STZ barrier energy density and (a) Poisson’s ratio and (b) fracture energy. The Mg- and rare earth (RE)-based BMGs are outliers, probably because of their low glass transition temperature.
3.4. Toughness and the Critical Fictive Temperature
In glass physics, the fictive temperature (Tf) is defined as the temperature where a thermodynamic property (e.g., specific volume) extrapolated on the glass line intersects the line of the equilibrium liquid [94,95]. As mentioned by Badrinarayanan et al. [95], the fictive temperature correlates with the structural state of a glass, and can be measured upon heating, whereas the glass transition temperature (Tg) is strictly measured on cooling. However, as clearly shown in their work [95], Tf is only about 1.5 °C lower than Tg and thus, the two are practically the same and both depend on the imposed cooling rate [95,96]. Certainly, the calorimetric Tg measured upon heating in a differential scanning calorimeter (DSC) can be safely taken to be Tf. Faster cooling of the undercooled liquid leads to a higher Tg and a higher fraction of free volume [96]. More slowly cooled alloys possess a lower Tg and the glass so obtained is more structurally relaxed, i.e., has less fraction of free volume. Structural relaxation is well known to lead to a reduction in toughness [65,66]. So, it can be imagined that if the freezing/glass transition temperature happens to be too low (assuming crystallization does not intervene), the glass obtained will be so relaxed, that it can be brittle. This freezing temperature corresponding to the onset of brittleness is defined as the critical fictive temperature (Tfc) by Kumar et al. [97] and it is a material property, linked to the structural configuration of the glass.
Kumar et al. [97] studied annealing-induced embrittlement in Zr-, Pd- and a Pt-based BMG and explained their findings using the concept of Tfc. They annealed specimens at various temperatures around the calorimetric Tg, in order to fully relax them and attain a structural configuration characteristic of the annealing temperature. In other words, they obtained glassy specimens having a fictive temperature that equals the annealing temperature. Such specimens were tested in bending and specimens showing 2.5% strain to failure were considered brittle; those with larger strain were called ductile. Through these experiments, they identified the annealing temperature that leads to embrittlement (2.5% failure strain), and this annealing temperature is the Tfc for the particular BMG. Based on these experiments, it was proposed in [97] that the intrinsic plasticity of BMGs in their as-cast state depends on how the Tfc of the glass compares with the glass transition temperature (Tg). For glasses like Pt-BMG, Tg–Tfc ~57 K, and the glass is always ductile in the as-cast state; further it is also resistant to annealing-induced embrittlement. This is because the supercooled liquid congeals into a glass before it ever reaches the structural state (free volume fraction) characteristic of Tfc. For Zr-BMGs, Tg–Tfc ~25 K, so the alloy is ductile in the as-cast state, but is susceptible to relaxation-induced embrittlement upon sub-Tg annealing. Importantly, it was also hypothesized that Mg- or Fe-based BMGs are brittle in the as-cast state because their Tfc is much higher than Tg, and during cooling at usual rates to form bulk glasses, the liquid already acquires a structural configuration characteristic of Tfc, and it is thus difficult to avoid embrittlement.
They also argued that all the Zr, Pd and Pt-BMGs in their experiments, even after relaxation, have Poisson’s ratios well above the critical 0.32 discussed earlier, suggesting that embrittlement cannot be explained in terms of a change in the Poisson’s ratio, in contrast to the theory advanced in [69]. However, it must be stressed that in [69], brittleness is defined in terms of fracture energy, whereas Kumar et al. [97] considered a glass to have embrittled once it showed a failure strain of 2.5%. The concomitant drop in fracture energy has not been reported. As stated in Section 2.3, Gu et al. [30] showed that a reduction in the failure strain may not always mean a drop in fracture toughness/energy. It would be worthwhile to also correlate the toughness drop with Tfc.
From the perspective of alloy development, knowing the Tfc of a new composition, a priori, is difficult, but the concept of a critical fictive temperature is appealing and poses questions about its microscopic origins, e.g., does it mean a critical free volume for all BMGs at the Tfc? Or is it a critical STZ volume? These questions would make for an interesting research topic. Also, a question that comes up is whether the Tfc is related to the fragility of the undercooled liquid? Because fragility tells us how the viscosity (free volume) changes with temperature [98,99], and since Tfc is related to a structural state, it is reasonable to expect a link.
4. Concluding Remarks
The toughness of BMGs has now been measured using a range of techniques and various parameters like Poisson’s ratio (ν), barrier energy density of STZs (ρ), STZ volume and critical fictive temperature have been proposed to explain toughness. Such parameters are broadly consistent with each other, e.g., tougher alloys have higher ν, higher STZ volume and a lower ρ. Some key issues can be summarized as follows:
(1) The testing technique can influence toughness values, e.g., notch tests versus fatigue pre-cracked fracture toughness tests, and in comparing different BMGs, it would be useful to have valid KIc data for a broad range of alloys. The very reactive Mg- or RE-based glasses often contain oxide inclusions (more so than other glasses), which impair toughness and make comparison between various BMGs difficult. Hence one theme of research is to design processing routes to obtain alloys free from oxides. This will be challenging, but better filtration techniques, or electrolytic reduction of alloy melts [100] could offer possibilities.
(2) Although mode II fracture energy increases only gradually with Poisson’s ratio (without an abrupt brittle-to-ductile transition), the stress state may well affect this correlation. It is of clear interest to examine the correlation with KIc data, obtained from samples free of extrinsic effects like oxides.
(3) Some BMGs show unusually high toughness arising from multiple shear banding in KIc tests, e.g., Zr61Ti2Cu25Al12 [32]. Why only certain compositions show profuse shear banding and enhanced toughness is not clear and uncovering the underlying mechanisms is of much interest.
(4) A related issue is that of local fluctuations in shear modulus, arising from ordering in the glass, which can affect toughness significantly. The question now must be how can these fluctuations be predicted and described in a tangible form so as to aid alloy design?
(5) Using the STZ volume to describe ductile–brittle transition appears to be quite successful for Zr-BMGs and it would be worthwhile investigating other, less tough alloys like Fe- or Mg-based glasses in this framework.
(6) The microscopic origins of the critical fictive temperature are not entirely clear and thus represent an interesting research topic.
(7) Toughness of metallic glasses in thin film form has shown interesting results, such as the suppression of shear fracture, and this can be an area of further research, since it will be relevant to applications in micro-electro-mechanical systems (MEMS).
Acknowledgments
The author thanks the anonymous reviewers for their comments and Mr Shravan Kumar (Monash University, Australia), for his help with the manuscript.
Conflicts of Interest
The author declares no conflict of interest.
References
- Inoue, A. Stabilization of metallic supercooled liquid and bulk amorphous alloys. Acta Mater. 2000, 48, 279–306. [Google Scholar] [CrossRef]
- Peker, A.; Johnson, W.L. A highly processable metallic glass: Zr41.2Ti13.8Cu12.5Ni10Be22.5. Appl. Phys. Lett. 1993, 63, 2342–2344. [Google Scholar] [CrossRef]
- Conner, R.D.; Dandliker, R.B.; Johnson, W.L. Mechanical properties of tungsten and steel fiber reinforced Zr41.25Ti13.75Cu12.5Ni10Be22.5 metallic glass matrix composites. Acta Mater. 1998, 46, 6089–6102. [Google Scholar] [CrossRef]
- Choi-Yim, H.; Busch, R.; Köster, U.; Johnson, W.L. Synthesis and characterization of particulate reinforced Zr57Nb5Al10Cu15.4Ni12.6 bulk metallic glass composites. Acta Mater. 1999, 47, 2455–2462. [Google Scholar] [CrossRef]
- Tang, X.-P.; Geyer, U.; Busch, R.; Johnson, W.L.; Wu, Y. Diffusion mechanisms in metallic supercooled liquids and glasses. Nature 1999, 402, 160–162. [Google Scholar]
- Zumkley, T.; Naundorf, V.; Macht, M.-P.; Frohberg, G. Effect of reversible structural relaxation on diffusion in a ZrTiCuNiBe bulk glass. Scr. Mater. 2001, 45, 471–477. [Google Scholar] [CrossRef]
- Gangopadhyay, A.K.; Croat, T.K.; Kelton, K.F. The effect of phase separation on subsequent crystallization in Al88Gd6La2Ni4. Acta Mater. 2000, 48, 4035–4043. [Google Scholar] [CrossRef]
- Madge, S.V.; Alexander, D.T.L.; Greer, A.L. An EFTEM study of compositional variations in Mg–Ni–Nd bulk metallic glasses. J. Non-Cryst. Solids 2003, 317, 23–29. [Google Scholar] [CrossRef]
- Park, E.S.; Kim, D.H. Phase separation and enhancement of plasticity in Cu–Zr–Al–Y bulk metallic glasses. Acta Mater. 2006, 54, 2597–2604. [Google Scholar] [CrossRef]
- Greer, A.L.; Rutherford, K.L.; Hutchings, I.M. Wear resistance of amorphous alloys and related materials. Int. Mater. Rev. 2002, 47, 87–112. [Google Scholar] [CrossRef]
- Madge, S.V.; Caron, A.; Gralla, R.; Wilde, G.; Mishra, S.K. Novel W-based metallic glass with high hardness and wear resistance. Intermetallics 2014, 47, 6–10. [Google Scholar] [CrossRef]
- Xu, T.; Pang, S.; Li, H.; Zhang, T. Corrosion resistant Cr-based bulk metallic glasses with high strength and hardness. J. Non-Cryst. Solids 2015, 410, 20–25. [Google Scholar] [CrossRef]
- Schuh, C.A.; Hufnagel, T.C.; Ramamurty, U. Mechanical behavior of amorphous alloys. Acta Meter. 2007, 55, 4067–4109. [Google Scholar] [CrossRef]
- Conner, R.D.; Rosakis, A.J.; Johnson, W.L.; Owen, D.M. Fracture toughness determination for a beryllium-bearing bulk metallic glass. Scr. Mater. 1997, 37, 1373–1378. [Google Scholar] [CrossRef]
- Lewandowski, J.J.; Shazly, M.; Shamimi Nouri, A. Intrinsic and extrinsic toughening of metallic glasses. Scr. Mater. 2006, 54, 337–341. [Google Scholar] [CrossRef]
- Nishiyama, N.; Amiya, K.; Inoue, A. Novel applications of bulk metallic glass for industrial products. J. Non-Cryst. Solids 2007, 353, 3615–3621. [Google Scholar] [CrossRef]
- Inoue, A.; Takeuchi, A. Recent development and application products of bulk glassy alloys. Acta Mater. 2011, 59, 2243–2267. [Google Scholar] [CrossRef]
- Liquidmetal Technologies. Available online: http://liquidmetal.com/ (accessed on 14 May 2015).
- Nanosteel. Available online: https://nanosteelco.com/ (accessed on 14 May 2015).
- Greer, A.L.; Cheng, Y.Q.; Ma, E. Shear bands in metallic glasses. Mater. Sci. Eng. R 2013, 74, 71–132. [Google Scholar] [CrossRef]
- Xu, J.; Ramamurty, U.; Ma, E. The fracture toughness of bulk metallic glasses. JOM 2010, 62, 10–18. [Google Scholar] [CrossRef]
- Greer, J.R.; de Hosson, J.T.M. Plasticity in small-sized metallic systems: Intrinsic versus extrinsic size effect. Prog. Mater. Sci. 2011, 56, 654–724. [Google Scholar] [CrossRef]
- Gilbert, C.J.; Schroeder, V.; Ritchie, R.O. Mechanisms for fracture and fatigue-crack propagation in a bulk metallic glass. Metall. Mater. Trans. A 1999, 30, 1739–1753. [Google Scholar] [CrossRef]
- Lowhaphandu, P.; Lewandowski, J.J. Fracture toughness and notched toughness of bulk amorphous alloy: Zr–Ti–Cu–Ni–Be. Scr. Mater. 1998, 38, 1811–1817. [Google Scholar] [CrossRef]
- Kim, C.P.; Suh, J.Y.; Wiest, A.; Lind, M.L.; Conner, R.D.; Johnson, W.L. Fracture toughness study of new Zr-based Be-bearing bulk metallic glasses. Scr. Mater. 2009, 60, 80–83. [Google Scholar] [CrossRef]
- Launey, M.E.; Busch, R.; Kruzic, J.J. Effects of free volume changes and residual stresses on the fatigue and fracture behavior of a Zr–Ti–Ni–Cu–Be bulk metallic glass. Acta Mater. 2008, 56, 500–510. [Google Scholar] [CrossRef]
- Keryvin, V.; Nadot, Y.; Yokoyama, Y. Fatigue pre-cracking and toughness of the Zr55Cu30Al10Ni5 bulk metallic glass for two oxygen levels. Scr. Mater. 2007, 57, 145–148. [Google Scholar] [CrossRef]
- Flores, K.M.; Dauskardt, R.H. Fracture and deformation of bulk metallic glasses and their composites. Intermetallics 2004, 12, 1025–1029. [Google Scholar] [CrossRef]
- Flores, K.M.; Dauskardt, R.H. Mode II fracture behavior of a Zr-based bulk metallic glass. J. Mech. Phys. Solids 2006, 54, 2418–2435. [Google Scholar] [CrossRef]
- Gu, X.J.; Poon, S.J.; Shiflet, G.J.; Lewandowski, J.J. Compressive plasticity and toughness of a Ti-based bulk metallic glass. Acta Mater. 2010, 58, 1708–1720. [Google Scholar] [CrossRef]
- Demetriou, M.D.; Launey, M.E.; Garrett, G.; Schramm, J.P.; Hofmann, D.C.; Johnson, W.L.; Ritchie, R.O. A damage-tolerant glass. Nat. Mater. 2011, 10, 123–128. [Google Scholar] [CrossRef] [PubMed]
- He, Q.; Shang, J.K.; Ma, E.; Xu, J. Crack-resistance curve of a Zr–Ti–Cu–Al bulk metallic glass with extraordinary fracture toughness. Acta Mater. 2012, 60, 4940–4949. [Google Scholar] [CrossRef]
- Varadarajan, R.; Thurston, A.K.; Lewandowski, J.J. Increased toughness of zirconium-based bulk metallic glasses tested under mixed mode conditions. Metall. Mater. Trans. A 2010, 41, 149–158. [Google Scholar] [CrossRef]
- Xu, J.; Ma, E. Damage-tolerant Zr–Cu–Al bulk metallic glasses with record-breaking fracture toughness. J. Mater. Res. 2014, 29, 1489–1499. [Google Scholar] [CrossRef]
- Gludovatz, B.; Naleway, S.E.; Ritchie, R.O.; Kruzic, J.J. Size-dependent fracture toughness of bulk metallic glasses. Acta Mater. 2014, 70, 198–207. [Google Scholar] [CrossRef]
- Conner, R.D.; Li, Y.; Nix, W.D.; Johnson, W.L. Shear band spacing under bending of Zr-based metallic glass plates. Acta Mater. 2004, 52, 2429–2434. [Google Scholar] [CrossRef]
- Argon, A.S.; Salama, M. The mechanism of fracture in glassy materials capable of some inelastic deformation. Mater. Sci. Eng. 1976, 23, 219–230. [Google Scholar] [CrossRef]
- Narasimhan, R.; Tandaiya, P.; Singh, I.; Narayan, R.L.; Ramamurty, U. Fracture in metallic glasses: Mechanics and mechanisms. Int. J. Fract. 2015, 191, 53–75. [Google Scholar] [CrossRef]
- Jiang, M.Q.; Ling, Z.; Meng, J.X.; Dai, L.H. Energy dissipation in fracture of bulk metallic glasses via inherent competition between local softening and quasi-cleavage. Philos. Mag. 2008, 88, 407–426. [Google Scholar] [CrossRef]
- Wang, G.; Chan, K.C.; Xu, X.H.; Wang, W.H. Instability of crack propagation in brittle bulk metallic glass. Acta Mater. 2008, 56, 5845–5860. [Google Scholar] [CrossRef]
- Narayan, R.L.; Tandaiya, P.; Narasimhan, R.; Ramamurty, U. Wallner lines, crack velocity and mechanisms of crack nucleation and growth in a brittle bulk metallic glass. Acta Mater. 2014, 80, 407–420. [Google Scholar] [CrossRef]
- Murali, P.; Guo, T.F.; Zhang, Y.W.; Narasimhan, R.; Li, Y.; Gao, H.J. Atomic scale fluctuations govern brittle fracture and cavitation behaviour in metallic glasses. Phys. Rev. Lett. 2011, 107, 215501. [Google Scholar] [CrossRef] [PubMed]
- Kimura, H.; Masumoto, T. Deformation and fracture of an amorphous Pd–Cu–Si alloy in V-notch bending tests-II. Ductile-brittle transition. Acta Metall. 1980, 28, 1677–1693. [Google Scholar] [CrossRef]
- Xi, X.K.; Zhao, D.Q.; Pan, M.X.; Wang, W.H.; Wu, Y.; Lewandowski, J.J. Fracture of Brittle metallic glasses: Brittleness or plasticity. Phys. Rev. Lett. 2005, 94, 125510. [Google Scholar] [CrossRef] [PubMed]
- Madge, S.V.; Louzguine-Luzgin, D.V.; Lewandowski, J.J.; Greer, A.L. Toughness, extrinsic effects and Poisson’s ratio of bulk metallic glasses. Acta Mater. 2012, 60, 4800–4809. [Google Scholar] [CrossRef]
- Ghidelli, M.; Gravier, S.; Blandin, J.-J.; Raskin, J.-P.; Lani, F.; Pardoen, T. Size-dependent failure mechanisms in ZrNi thin metallic glass films. Scr. Mater. 2014, 89, 9–12. [Google Scholar] [CrossRef]
- Ghidelli, M.; Gravier, S.; Blandin, J.-J.; Djemia, P.; Mompiou, F.; Abadias, G.; Raskin, J.-P.; Pardoen, T. Extrinsic mechanical size effects in thin ZrNi metallic glass films. Acta Mater. 2015, 90, 232–241. [Google Scholar] [CrossRef]
- Han, Z.; Wu, W.F.; Li, Y.; Wei, Y.J.; Gao, H.J. An instability index of shear band for plasticity in metallic glasses. Acta Mater. 2009, 57, 1367–1372. [Google Scholar] [CrossRef]
- Mondal, K.; Kumar, G.; Ohkubo, T.; Oishi, K.; Mukai, T.; Hono, K. Large apparent compressive strain of metallic glasses. Philos. Mag. Lett. 2007, 87, 625–635. [Google Scholar] [CrossRef]
- Li, G.; Jiang, M.Q.; Jiang, F.; He, L.; Sun, J. The ductile to brittle transition behavior in a Zr-based bulk metallic glass. Mater. Sci. Eng. A 2015, 625, 393–402. [Google Scholar] [CrossRef]
- Madge, S.V.; Wada, T.; Louzguine-Luzgin, D.V.; Greer, A.L.; Inoue, A. Oxygen embrittlement in a Cu–Hf–Al bulk metallic glass. Scr. Mater. 2009, 61, 540–543. [Google Scholar] [CrossRef]
- Hess, P.A.; Poon, S.J.; Shiflet, G.J.; Dauskardt, R.H. Indentation fracture toughness of amorphous steel. J. Mater. Res. 2005, 20, 783–786. [Google Scholar] [CrossRef]
- Keryvin, V.; Hoang, V.H.; Shen, J. Hardness, toughness, brittleness and cracking systems in an iron-based bulk metallic glass by indentation. Intermetallics 2009, 17, 211–217. [Google Scholar] [CrossRef]
- Kruzic, J.J.; Kim, D.K.; Koester, K.J.; Ritchie, R.O. Indentation techniques for evaluating the fracture toughness of biomaterials and hard tissues. J. Mech. Behav. Biomed. Mater. 2009, 2, 384–395. [Google Scholar] [CrossRef] [PubMed]
- Liu, Y.H.; Wang, K.; Inoue, A.; Sakurai, T.; Chen, M.W. Energetic criterion on the intrinsic ductility of bulk metallic glasses. Scr. Mater. 2010, 62, 586–589. [Google Scholar] [CrossRef]
- Hsieh, P.J.; Lin, S.C.; Su, H.C.; Jang, J.S.C. Glass forming ability and mechanical properties characterization on Mg58Cu31Y11−xGdx bulk metallic glasses. J. Alloys Compd. 2009, 483, 40–43. [Google Scholar] [CrossRef]
- Lewandowski, J.J.; Gu, X.J.; Shamimi Nouri, A.; Poon, S.J.; Shiflet, G.J. Tough Fe-based bulk metallic glasses. Appl. Phys. Lett. 2008, 92, 091918. [Google Scholar] [CrossRef]
- Wang, W.H. The elastic properties, elastic models and elastic perspectives of metallic glasses. Prog. Mater. Sci. 2012, 57, 487–656. [Google Scholar] [CrossRef]
- Zhang, Y.; Greer, A.L. Correlations for predicting plasticity or brittleness of metallic glasses. J. Alloys. Compd. 2007, 434–435, 2–5. [Google Scholar] [CrossRef]
- Nagendra, N.; Ramamurty, U.; Goh, T.T.; Li, Y. Effect of crystallinity on the impact toughness of a La-based bulk metallic glass. Acta Mater. 2000, 48, 2603–2615. [Google Scholar] [CrossRef]
- Raghavan, R.; Shastry, V.V.; Kumar, A.; Jayakumar, T.; Ramamurty, U. Toughness of as-cast and partially crystallized composites of a bulk metallic glass. Intermetallics 2009, 17, 835–839. [Google Scholar] [CrossRef]
- Yokoyama, Y.; Yamasaki, T.; Liaw, P.K.; Inoue, A. Study of the structural relaxation-induced embrittlement of hypoeutectic Zr–Cu–Al ternary bulk glassy alloys. Acta Mater. 2008, 56, 6097–6108. [Google Scholar] [CrossRef]
- Yokoyama, Y.; Yamasaki, T.; Nishijima, M.; Inoue, A. Drastic increase in the toughness of structural relaxed hypoeutectic Zr59Cu31Al10 bulk glassy alloy. Mater. Trans. JIM 2007, 48, 1276–1281. [Google Scholar] [CrossRef]
- Madge, S.V. Mg-based Bulk Metallic Glasses. Ph.D. Thesis, University of Cambridge, Cambridge, UK, 2003. [Google Scholar]
- Wu, T.; Spaepen, F. The relation between embrittlement and structural relaxation of an amorphous metal. Philos. Mag. B 1990, 61, 739–750. [Google Scholar] [CrossRef]
- Raghavan, R.; Murali, P.; Ramamurty, U. On the factors influencing the ductile-to-brittle transition in a bulk metallic glass. Acta Mater. 2009, 57, 3332–3340. [Google Scholar] [CrossRef]
- Chen, H.S.; Krause, J.T.; Coleman, E. Elastic constants, hardness and their implications to flow properties of metallic glasses. J. Non-Cryst. Solids 1975, 18, 157–171. [Google Scholar] [CrossRef]
- Schroers, J.; Johnson, W.L. Ductile bulk metallic glass. Phys. Rev. Lett. 2004, 93, 255506. [Google Scholar] [CrossRef] [PubMed]
- Lewandowski, J.J.; Wang, W.H.; Greer, A.L. Intrinsic plasticity or brittleness of metallic glasses. Philos. Mag. Lett. 2005, 85, 77–87. [Google Scholar] [CrossRef]
- Greaves, G.N.; Greer, A.L.; Lakes, R.S.; Rouxel, T. Poisson’s ratio and modern materials. Nat. Mater. 2011, 10, 823–837. [Google Scholar] [CrossRef] [PubMed]
- Liu, Z.Q.; Wang, W.H.; Jiang, M.Q.; Zhang, Z.F. Intrinsic factor controlling the deformation and ductile-to-brittle transition of metallic glasses. Philos. Mag. Lett. 2014, 94, 658–668. [Google Scholar] [CrossRef]
- Kelly, A.; Tyson, W.R.; Cottrell, A.H. Ductile and brittle crystals. Philos. Mag. 1967, 15, 567–586. [Google Scholar] [CrossRef]
- Gu, X.J.; McDermott, A.G.; Poon, S.J.; Shiflet, S.J. Critical Poisson’s ratio for plasticity in Fe–Mo–C–B–Ln bulk amorphous steel. Appl. Phys. Lett. 2006, 88, 211905. [Google Scholar] [CrossRef]
- Jia, P.; Zhu, Z.; Ma, E.; Xu, J. Notch toughness of Cu-based bulk metallic glasses. Scr. Mater. 2009, 61, 137–140. [Google Scholar] [CrossRef]
- Kumar, G.; Rector, D.; Conner, R.D.; Schroers, J. Embrittlement of Zr-based bulk metallic glasses. Acta Mater. 2009, 57, 3572–3583. [Google Scholar] [CrossRef]
- Leonhard, A.; Xing, L.Q.; Heilmaier, M.; Gebert, A.; Eckert, J.; Schultz, L. Effect of crystalline precipitates on the mechanical behavior of bulk glass forming Zr-based alloys. Nanostr. Mater. 1998, 10, 805–817. [Google Scholar] [CrossRef]
- Keryvin, V.; Bernard, C.; Sanglebœuf, J.-C.; Yokoyama, Y.; Rouxel, T. Toughness of Zr55Cu30Al10Ni5 bulk metallic glass for two oxygen levels. J. Non-Cryst. Solids 2006, 352, 2863–2868. [Google Scholar] [CrossRef]
- Madge, S.V.; Sharma, P.; Louzguine-Luzgin, D.V.; Greer, A.L.; Inoue, A. Mechanical behaviour of Zr-La-Cu-Ni-Al glass-based composites. Intermetallics 2011, 19, 1474. [Google Scholar] [CrossRef]
- Granata, D.; Fischer, E.; Wessels, V.; Loeffler, J.F. Fluxing of Pd–Si–Cu bulk metallic glass and the role of cooling rate and purification. Acta Mater. 2014, 71, 145–152. [Google Scholar] [CrossRef]
- Kinaka, M.; Kato, H.; Hasegawa, M.; Inoue, A. High specific strength Mg-based bulk metallic glass matrix composite highly ductilized by Ti dispersoid. Mater. Sci. Eng. A 2008, 494, 299–303. [Google Scholar] [CrossRef]
- Madge, S.V.; Sharma, P.; Louzguine-Luzgin, D.V.; Greer, A.L.; Inoue, A. New La-based glass-crystal ex situ composites with enhanced toughness. Scr. Mater. 2010, 62, 210–213. [Google Scholar] [CrossRef]
- Madge, S.V.; Louzguine-Luzgin, D.V.; Inoue, A.; Greer, A.L. Large compressive plasticity in a la-based glass-crystal composite. Metals 2013, 3, 41–48. [Google Scholar] [CrossRef]
- Lee, M.L.; Li, Y.; Schuh, C.A. Effect of a controlled volume fraction of dendritic phases on tensile and compressive ductility in La-based metallic glass matrix composites. Acta Mater. 2004, 52, 4121–4131. [Google Scholar] [CrossRef]
- Lewandowski, J.J. Modern fracture mechanics. Philos. Mag. 2013, 93, 3893–3906. [Google Scholar] [CrossRef]
- Poon, S.J.; Zhu, A.; Shiflet, G.J. Poisson’s ratio and intrinsic plasticity of metallic glasses. Appl. Phys. Lett. 2008, 92, 261902. [Google Scholar] [CrossRef]
- Shi, Y.; Luo, J.; Yuan, F.; Huang, L. Intrinsic ductility of solids. J. Appl. Phys. 2014, 115, 043528. [Google Scholar] [CrossRef]
- Spaepen, F. A microscopic mechanism for steady state inhomogeneous flow in metallic glasses. Acta Metall. 1977, 25, 407–415. [Google Scholar] [CrossRef]
- Pan, D.; Inoue, A.; Sakurai, T.; Chen, M.W. Experimental characterization of shear transformation zones for plastic flow of bulk metallic glasses. Proc. Natl. Acad. Sci. 2008, 105, 14769–14772. [Google Scholar] [CrossRef] [PubMed]
- Johnson, W.L.; Samwer, K. A universal criterion for plastic yielding of metallic glasses with a (T/Tg)2/3 temperature dependence. Shear transformation zone volume dertermining ductile-brittle transition of bulk metallic glasses. Phys. Rev. Lett. 2005, 95, 195501. [Google Scholar] [CrossRef] [PubMed]
- Jiang, F.; Jiang, M.Q.; Wang, H.F.; Zhao, Y.L.; He, L.; Sun, J. Shear transformation zone volume determining ductile-brittle transition of bulk metallic glasses. Acta Mater. 2011, 59, 2057–2068. [Google Scholar] [CrossRef]
- Jiang, M.Q.; Wilde, G.; Chen, J.H.; Qu, C.B.; Fu, S.Y.; Jiang, F.; Dai, L.H. Cryogenic-temperature-induced transition from shear to dilatational failure in metallic glasses. Acta Mater. 2014, 77, 248–257. [Google Scholar] [CrossRef]
- Demetriou, M.D.; Kaltenboech, G.; Suh, J.; Garrett, G.; Floyd, M.; Crewdson, C.; Hofmann, D.C.; Kozachkov, H.; Wiest, A.; Schramm, J.P.; et al. Glassy steel optimized for glass-forming ability and toughness. Appl. Phys. Lett. 2009, 95, 041907. [Google Scholar] [CrossRef]
- He, Q.; Cheng, Y.Q.; Ma, E.; Xu, J. Locating bulk metallic glasses with high fracture toughness: Chemical effects and composition optimization. Acta Mater. 2011, 59, 202–215. [Google Scholar] [CrossRef]
- Egami, T. Formation and deformation of metallic glasses: Atomistic theory. Intermetallics 2006, 14, 882–887. [Google Scholar] [CrossRef]
- Badrinarayanan, P.; Zheng, W.; Li, Q.; Simon, S.L. The glass transition temperature versus the fictive temperature. J. Non-Cryst. Solids 2007, 353, 2603–2612. [Google Scholar] [CrossRef]
- Cahn, R.W.; Greer, A.L. Metastable states of alloys. In Physical Metallurgy, 4th ed.; Cahn, R.W., Haasen, P., Eds.; Elsevier Science: Amsterdam, The Netherlands, 1996; Volume 2, pp. 1724–1830. [Google Scholar]
- Kumar, G.; Neibecker, P.; Liu, Y.H.; Schroers, J. Critical fictive temperature for plasticity in metallic glasses. Nat. Commun. 2013, 4. [Google Scholar] [CrossRef]
- Angell, C.A. Formation of glasses from liquids and biopolymers. Science 1995, 267, 1924–1935. [Google Scholar] [CrossRef] [PubMed]
- Busch, R.; Liu, W.; Johnson, W.L. Thermodynamics and kinetics of the Mg65Cu25Y10 bulk metallic glass forming liquid. J. Appl. Phys. 1998, 83, 4134–4141. [Google Scholar] [CrossRef]
- Bossuyt, S.; Madge, S.V.; Chen, G.Z.; Castellero, A.; Deledda, S.; Eckert, J.; Fray, D.J.; Greer, A.L. Electrochemical removal of oxygen for processing glass-forming alloys. Mater. Sci. Eng. A 2004, 375–377, 240–243. [Google Scholar] [CrossRef]
© 2015 by the authors; licensee MDPI, Basel, Switzerland. This article is an open access article distributed under the terms and conditions of the Creative Commons Attribution license (http://creativecommons.org/licenses/by/4.0/).
Share and Cite
MDPI and ACS Style
Madge, S.V. Toughness of Bulk Metallic Glasses. Metals 2015, 5, 1279-1305. https://doi.org/10.3390/met5031279
AMA Style
Madge SV. Toughness of Bulk Metallic Glasses. Metals. 2015; 5(3):1279-1305. https://doi.org/10.3390/met5031279
Chicago/Turabian StyleMadge, Shantanu V. 2015. "Toughness of Bulk Metallic Glasses" Metals 5, no. 3: 1279-1305. https://doi.org/10.3390/met5031279