Article

Effect of Indium Content on the Microstructure, Mechanical Properties and Corrosion Behavior of Titanium Alloys

Department of Dental Materials and Medical Research Center for Biomineralization Disorders, School of Dentistry, Chonnam National University, Gwangju 500-757, Korea
*
Author to whom correspondence should be addressed.
Metals 2015, 5(2), 850-862; https://doi.org/10.3390/met5020850
Submission received: 24 March 2015 / Accepted: 18 May 2015 / Published: 22 May 2015
(This article belongs to the Special Issue Titanium Alloys)

Abstract

:
Ti-xIn (x = 0, 5, 10, 15 and 20 wt%) alloys were prepared to investigate the effect of indium on the microstructure, mechanical properties, and corrosion behavior of titanium with the aim of understanding the relationship between phase/microstructure and various properties of Ti-xIn alloys. The Ti-xIn alloys exhibited a lamellar α-Ti structure at an indium content of up to 20 wt%. High-resolution TEM images of the Ti-xIn alloys revealed that all the systems contained a fine, acicular martensitic phase, which showed compositional fluctuations at the nanoscopic level. The mechanical properties and corrosion behavior of Ti-xIn alloys were sensitive to the indium content. The Vickers hardness increased as the In content increased because of solid solution strengthening. The Ti-xIn alloys exhibited superior oxidation resistance compared to commercially pure Ti (cp-Ti). Electrochemical results showed that the Ti-xIn alloys exhibited a similar corrosion resistance to cp-Ti. Among the alloys tested, Ti-10In showed a potential for use as a dental material.

1. Introduction

Titanium (Ti) and Ti-based alloys have received widespread attention for orthopedic and dental implant applications because of their favorable mechanical properties, including high specific strength, corrosion resistance, and good biocompatibility after implantation [1,2]. However, Ti has several drawbacks, such as low deformability, low wear resistance, and high reactivity with surrounding impurities, such as oxygen and nitrogen, at elevated temperatures [3,4]. Enhanced properties, such as the lower modulus of elasticity, increased corrosion resistance, and improved machinability, are possible through alloying Ti with a variety of elements.
Several Ti–X binary alloys have been developed, such as Ti–Nb [5,6,7], Ti–Ag [8,9], Ti–Au [10], Ti–Hf [11], Ti–Mn [12], Ti–Cr [13,14], Ti–Mo [15], Ti–Sn [16], Ti–Zr [17,18,19], Ti–Ta [20,21], Ti–Co [22], Ti–Pd [23], Ti–Ge [24] and Ti–Cu [25] alloys. The mechanical properties of Ti alloys are influenced by their microstructure, which, in turn, depends on chemical composition and synthetic processing. In fact, the key to this research resides in the judicious choice of the alloying elements. Therefore, in order to improve the mechanical properties of Ti, it is necessary to understand the effect of the alloying elements on the microstructure and the mechanical properties of the alloys.
There are several studies on developing Ti alloys containing indium. It was found that indium-containing Ti alloys were biocompatible. It was recently found that the addition of indium to Ti improves clinical performance of dental implant, such as mechanical properties, corrosion resistance, and biocompatibility [26,27]. Other than this, little experimental investigation has been attempted regarding Ti-In alloys. Sufficient information about the relationship between mechanical properties and phases is not available in the literature. Therefore, it is important to pursue a comprehensive structural analysis of this phase to provide an in-depth understanding of the mechanical properties.
In this study, the goal of which was the development of a dental titanium alloy with better mechanical properties than cp-Ti, the effect of alloying indium on the microstructure, mechanical properties, and corrosion behavior of Ti-In binary alloys was investigated by adding 5, 10, 15, and 20 wt% In. Henceforth, in this work, “Ti-xIn” will stand for “Ti-x wt% In”.

2. Experimental Section

2.1. Preparation of Ti-xIn Alloys

Experimental Ti-xIn alloys (0, 5, 10, 15, and 20 wt% In) were prepared by arc-melting stoichiometric quantities of the elements in a water-cooled copper hearth using a tungsten electrode in a high-purity argon atmosphere. The starting materials (Ti sponge, Alfa Aesar, Ward Hill, MA, USA, 99.95%; In ingot, LS-Nikko, Seoul, Korea, 99.95%) were used without purification. During the arc-melting procedure, a titanium getter was heated prior to melting the reactant mixture to further purify the argon atmosphere. The samples were remelted seven times to promote sample homogeneity. Subsequently, the samples were heat treated for 4 h in an argon atmosphere using a tube furnace at temperatures below 150 °C to the respective solidus temperatures by cooling in a furnace at a rate of 10 °C/min down to 600 °C and then air-cooling to room temperature. These heat treatment conditions were chosen in accordance with the binary Ti–In phase diagrams [28]. Figure 1 shows a Ti-rich portion of the Ti–In phase diagram exhibiting the four alloys investigated and the temperature range of heat-treatment.
Figure 1. Ti-rich portion of the Ti–In system according to the published Ti-In equilibrium phase diagram [28]. The four alloys investigated and the temperature ranges of heat-treatment are marked.
Metals 05 00850 g001

2.2. Material Characterization

Phase analysis and structural characterization were performed using X-ray diffraction (XRD, PANalytical B.V., Almelo, The Netherlands). The XRD diffraction patterns were collected with an X’Pert PRO Multi-Purpose X-Ray Diffractometer (40 kV and 40 mA) using Cu Kα radiation (λ = 1.54056 Å). The scanning speed was 2°/min, and the scanning angle, 2θ, ranged from 20° to 80°. The lattice parameters were obtained by least squares refinement of the data with the aid of a Rietveld refinement program [29]. The microstructure of the samples was examined using a metallurgical microscope (Epiphot FX-35WA, Nikon, Tokyo, Japan), high-resolution transmission electron microscopy (HRTEM, Technai-F20, Philips, Amsterdam, The Netherlands) and selected area electron diffraction (SAED).

2.3. Measurement of Mechanical Properties

The microhardness of the polished alloys was measured using a Vickers microhardness tester (Zwick, Postfach 4350, Ulm, Germany) with a 500 g load maintained for 30 s. Elastic modulus testing was performed using a Nanoindenter XP (MTS Co., Dubuque, IA, USA) with a maximum indentation depth of 2 μm. The oxidation behavior of Ti with different In contents was tested using thermogravimetric analysis (TGA, SDTA 851e, Mettler-Toledo, Columbus, OH, USA), which enabled measurement of the change in mass due to oxidation. Samples measuring 4.5 × 4.2 × 1.0 mm3 in size were heated to 795 °C and 1000 °C at a heating rate of 10 °C/min and air flow rate of 50 mL/min. After fracture by an Instron 4302 testing machine at a crosshead speed of 1.5 mm/min, the fracture surface morphology was investigated using a scanning electron microscope (SEM, S-3000N, Hitachi, Tokyo, Japan). The surface roughness of the ground surface (0.4 × 0.3 mm2 in size) was measured using a Nanosurface 3D optical Profiler (NV-E1000, NanoSystem, Daejeon, Korea).

2.4. Electrochemical Analysis

To observe the corrosion behavior of the Ti-xIn alloys, potentiodynamic anodic polarization tests were conducted at a scan rate of 5 mV/s from −1.5 V to +1.5 V (saturated calomel electrode: SCE) using a potentiostat (WAT100, WonA Tech Co., Ltd., Seoul, Korea) in a 0.9% NaCl solution at 37 ± 1 °C. Three samples were tested to confirm the experimental results through repetition. The surfaces of the samples 10 mm in diameter were mechanically polished using SiC paper up to 2000 grit. Electrochemical measurements were recorded using the three electrode technique, which involves the use of a working electrode (test samples), counter electrode (high density graphite), and reference electrode (SCE) [30]. Ar gas was bubbled into the electrolyte at 150 mL/min for over 20 min to eliminate residual oxygen in the electrolyte. The used electrolyte was replaced with a fresh one before each measurement. The exposed surface area of samples in the electrolyte was 0.283 cm2. Potentiodynamic polarization curves were plotted using an automatic data acquisition system. Both the corrosion current density and potential were estimated with Tafel plots using both the anodic and cathodic branches.

3. Results and Discussion

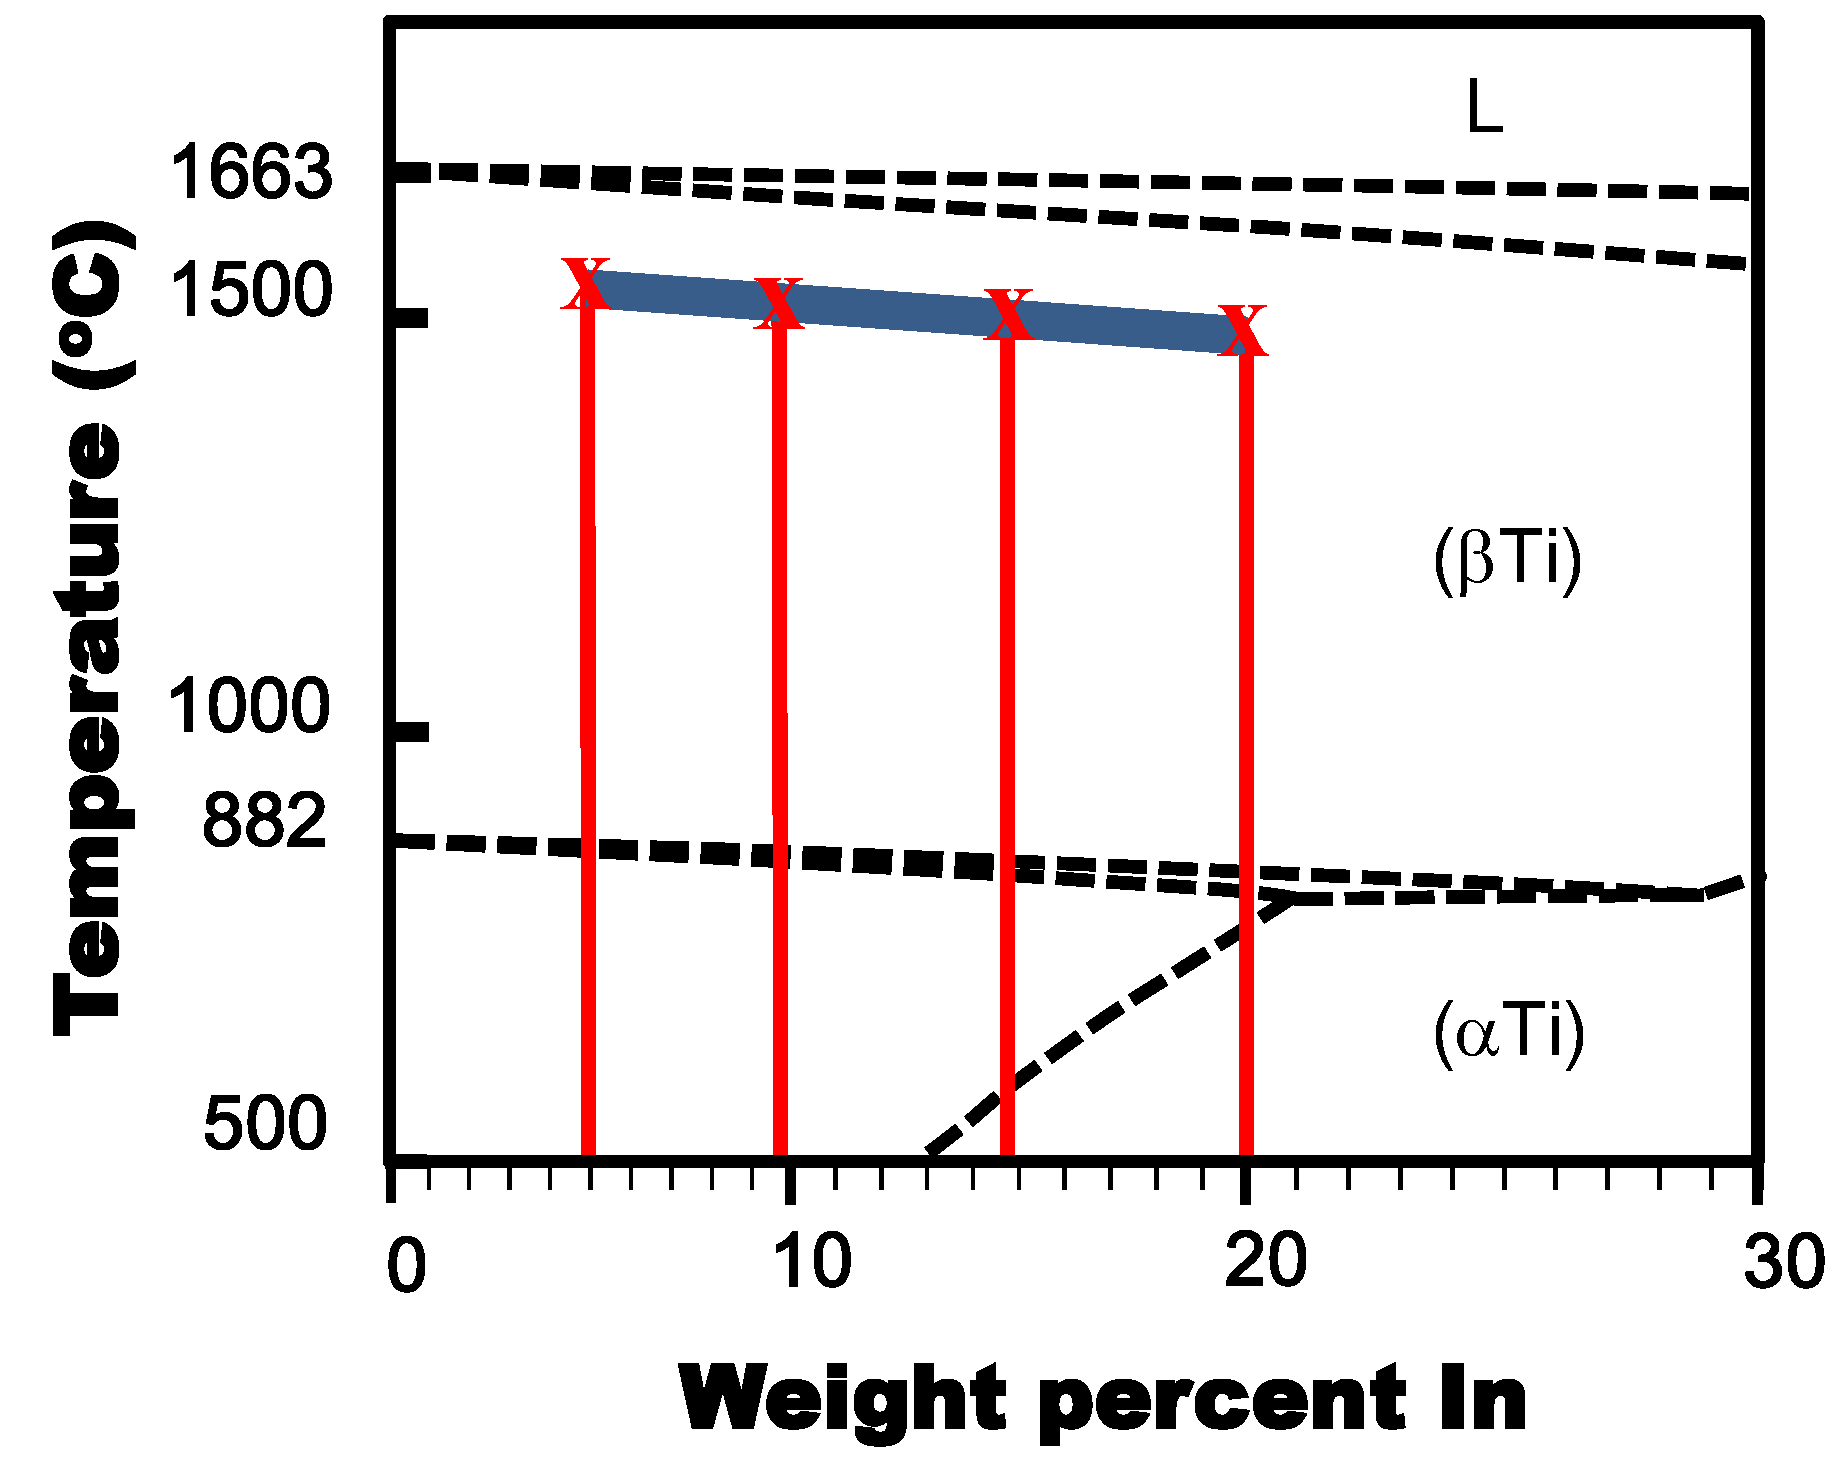
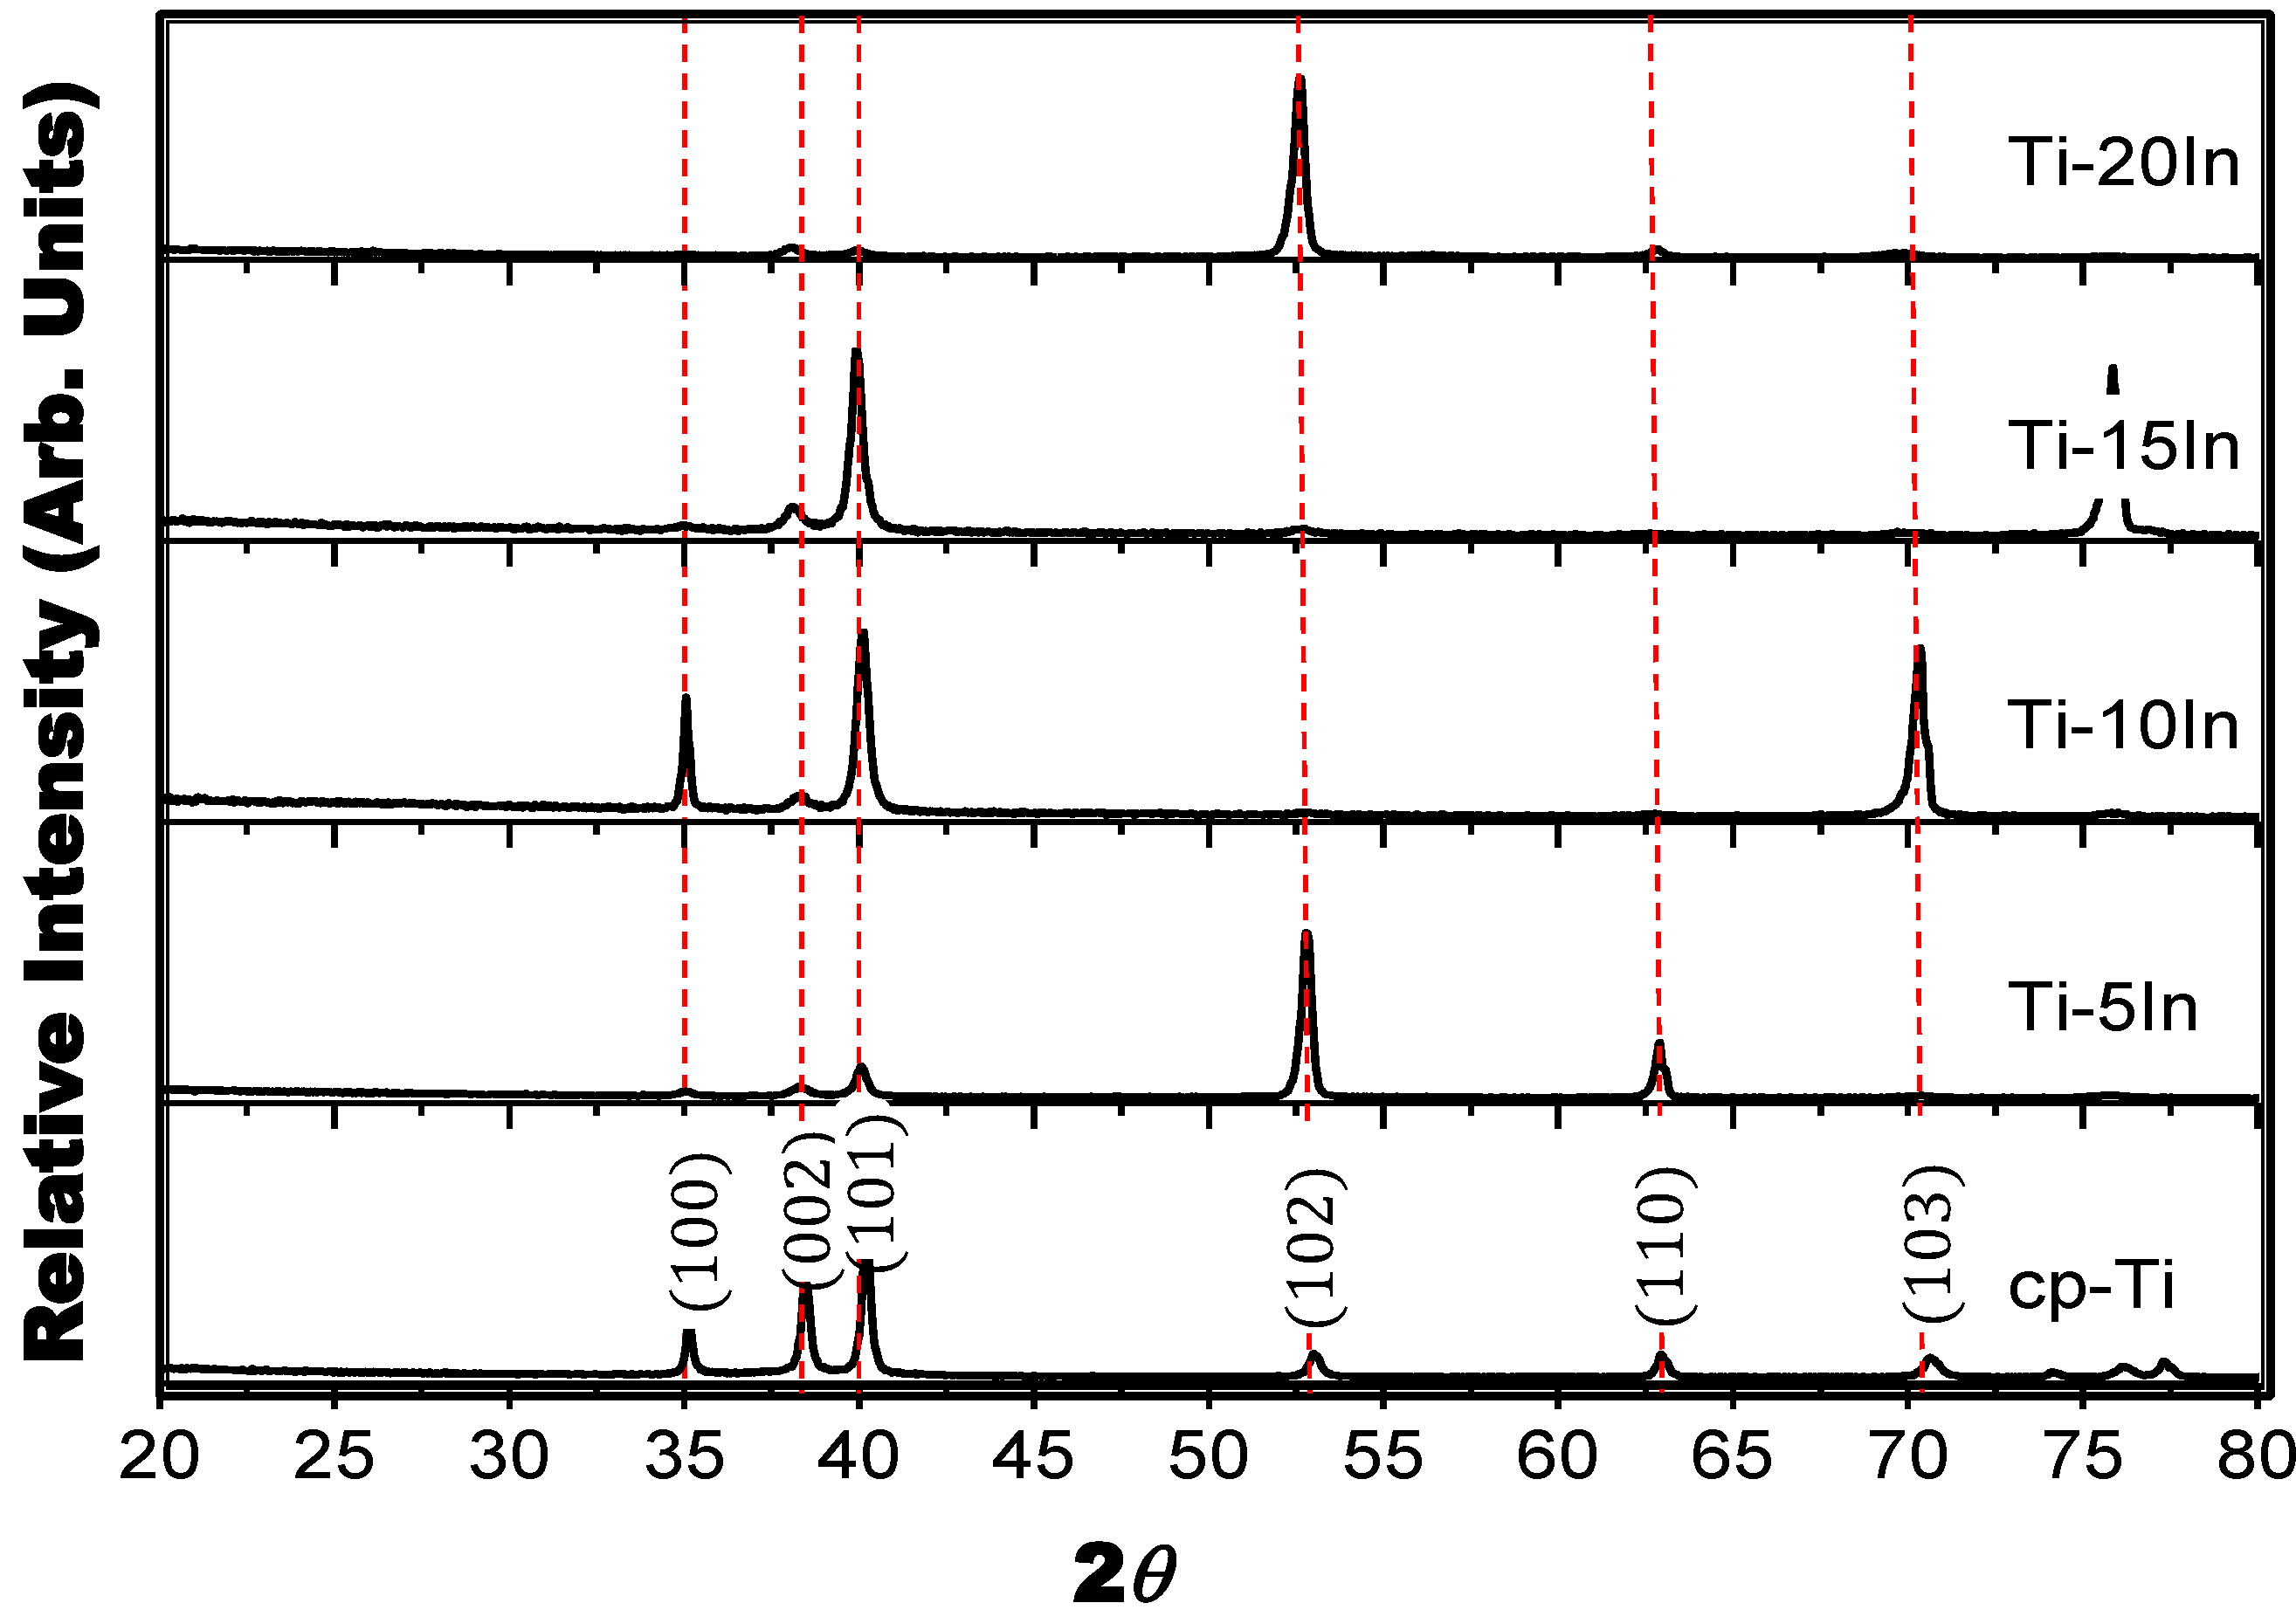
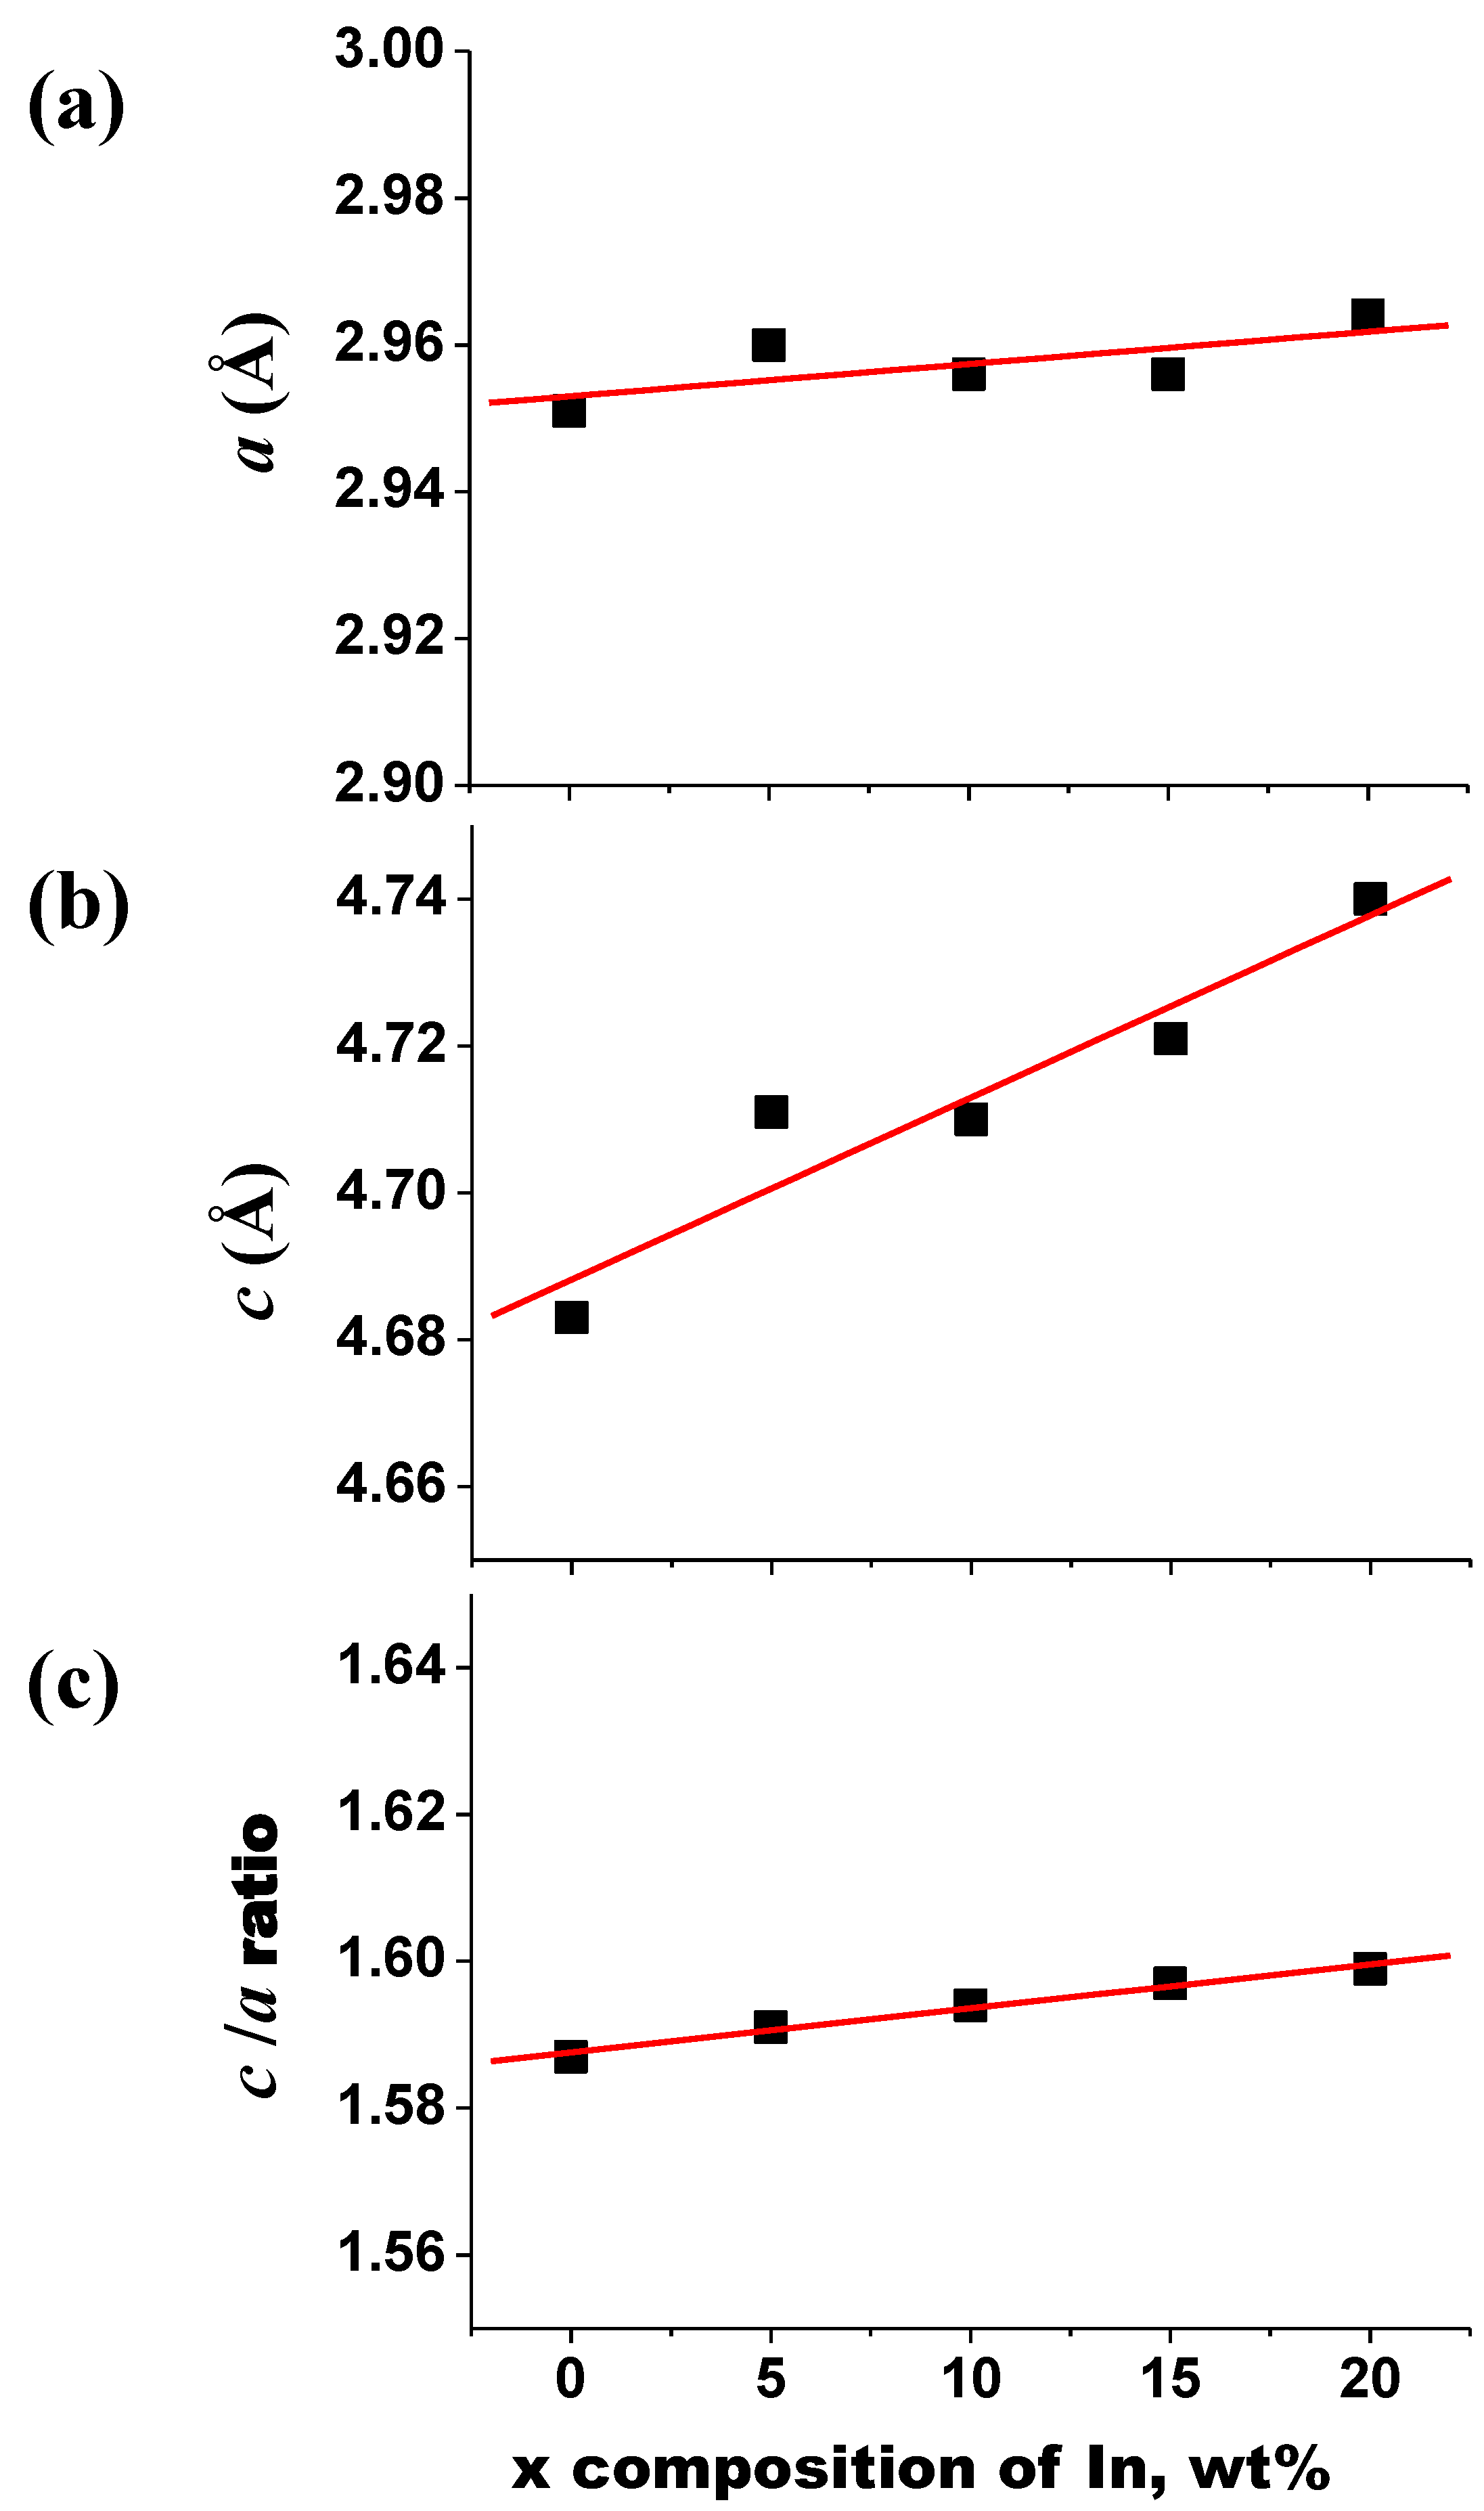
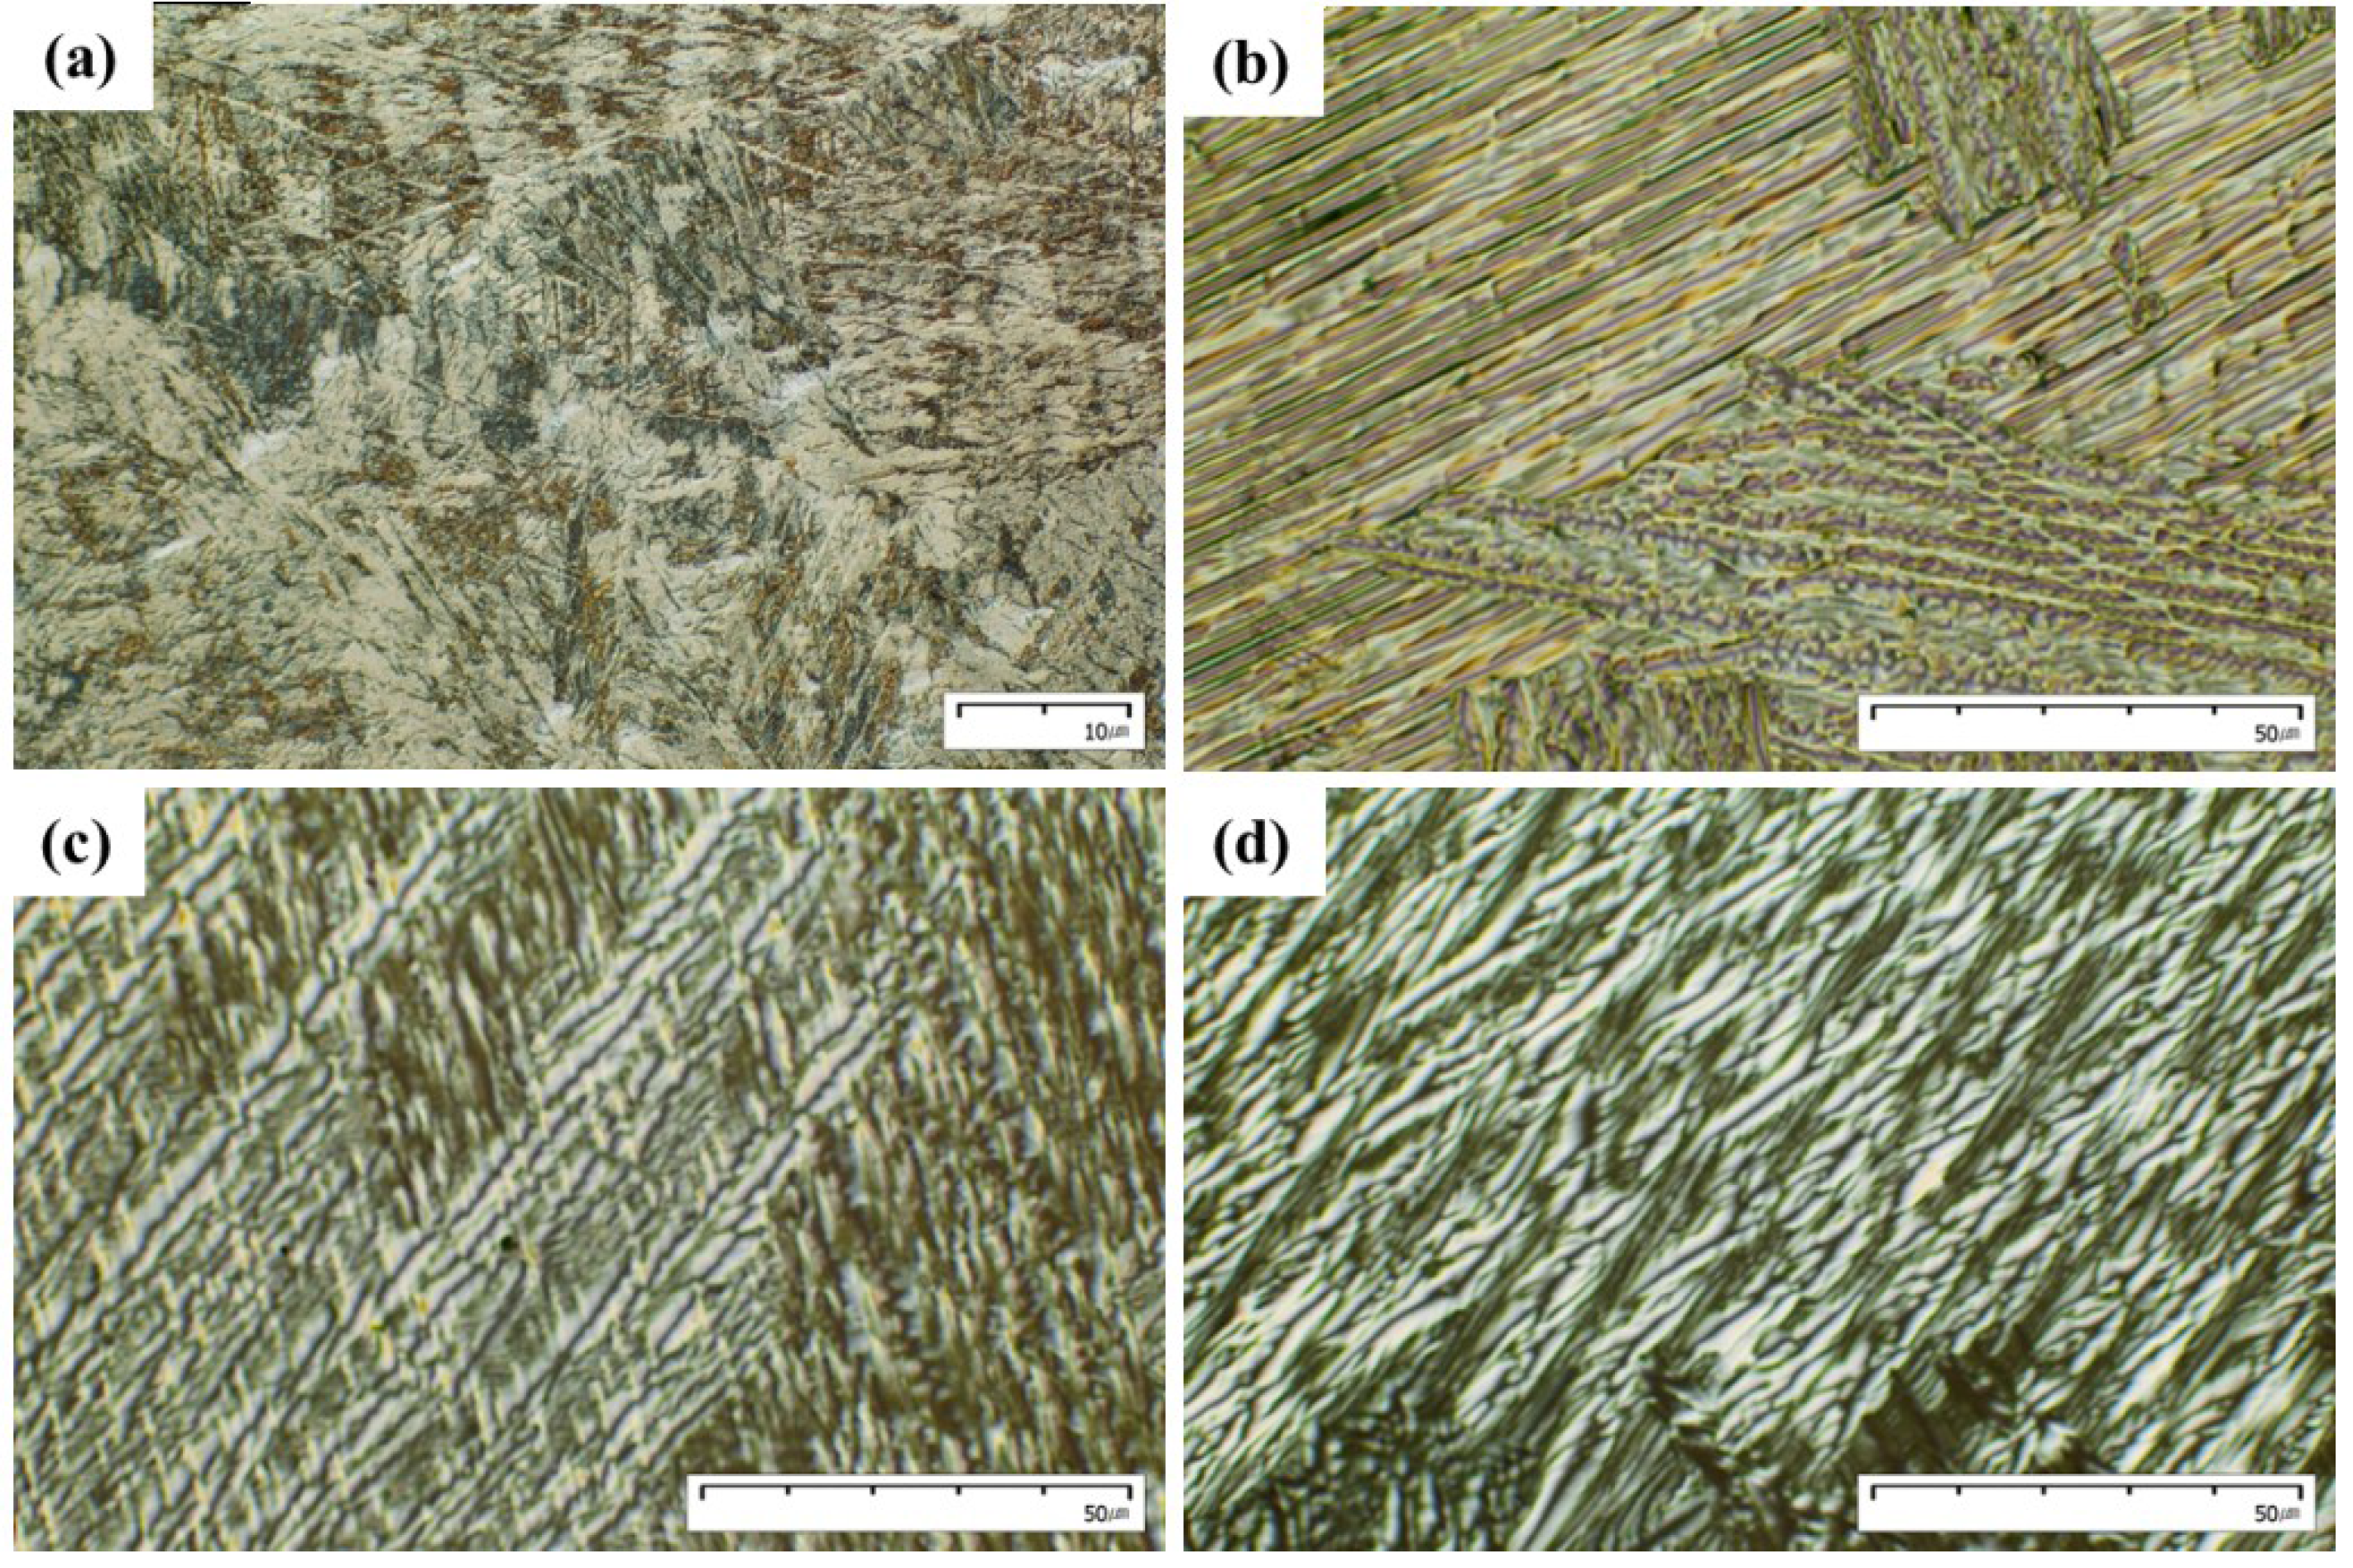
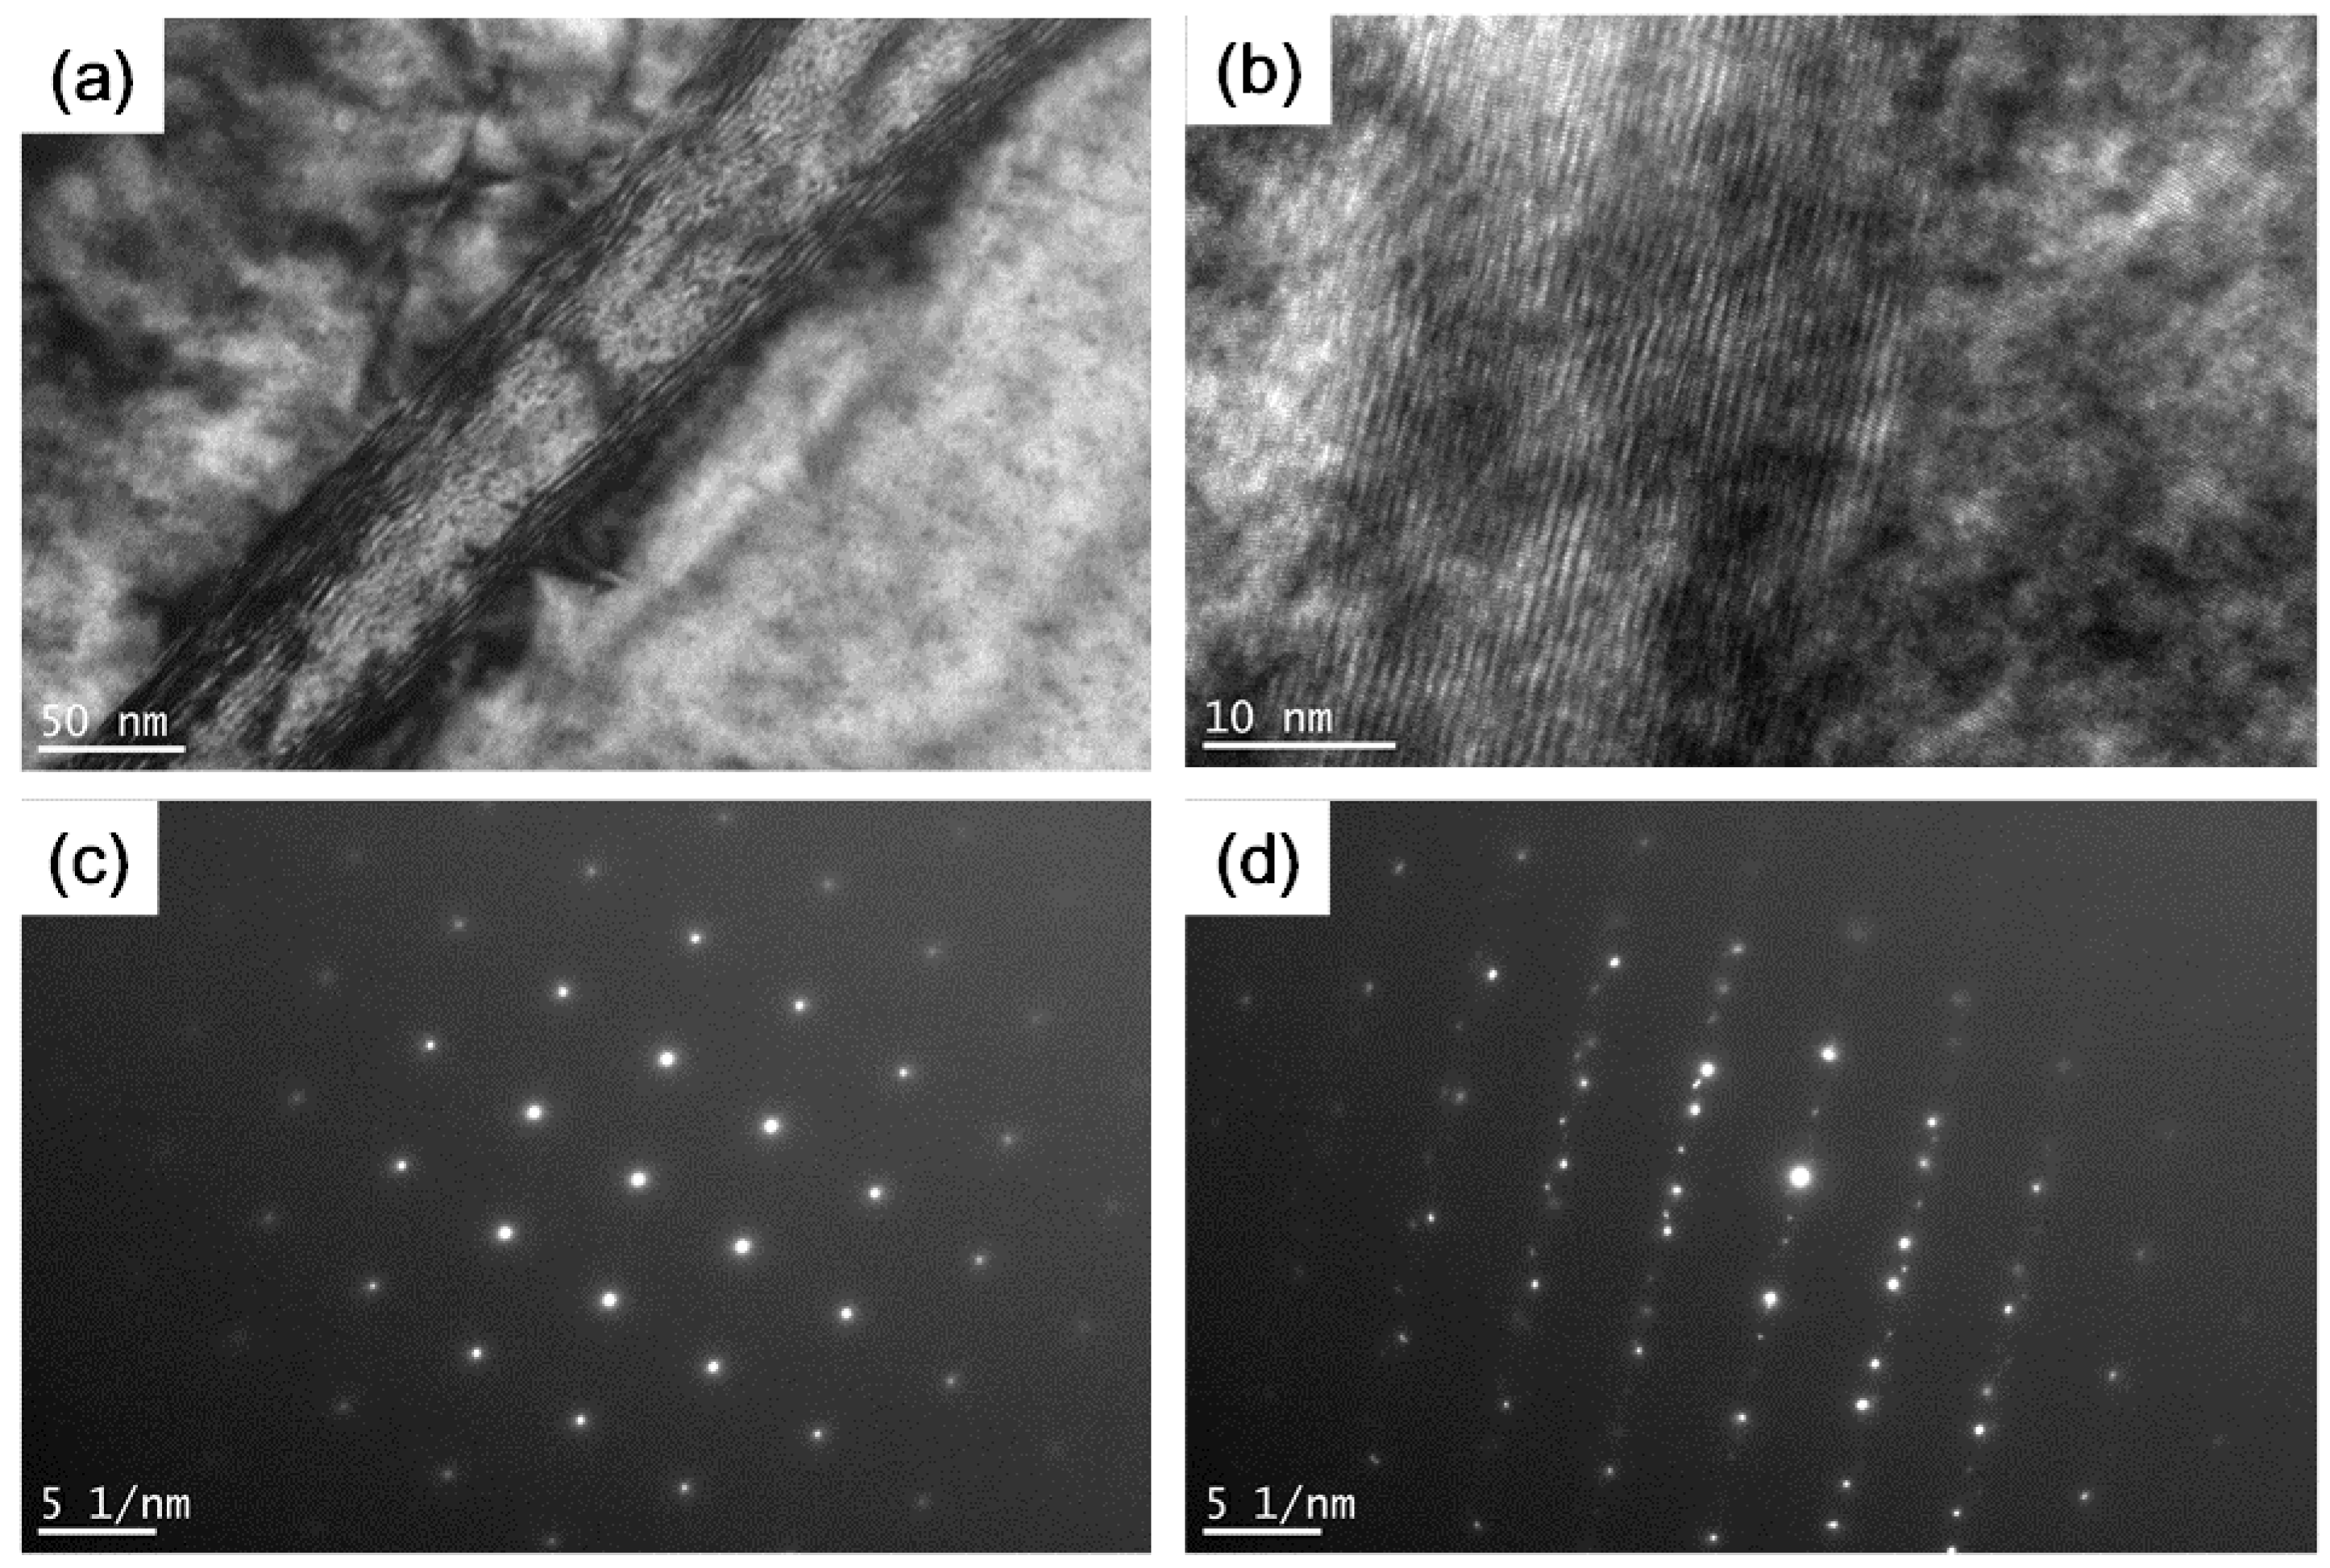
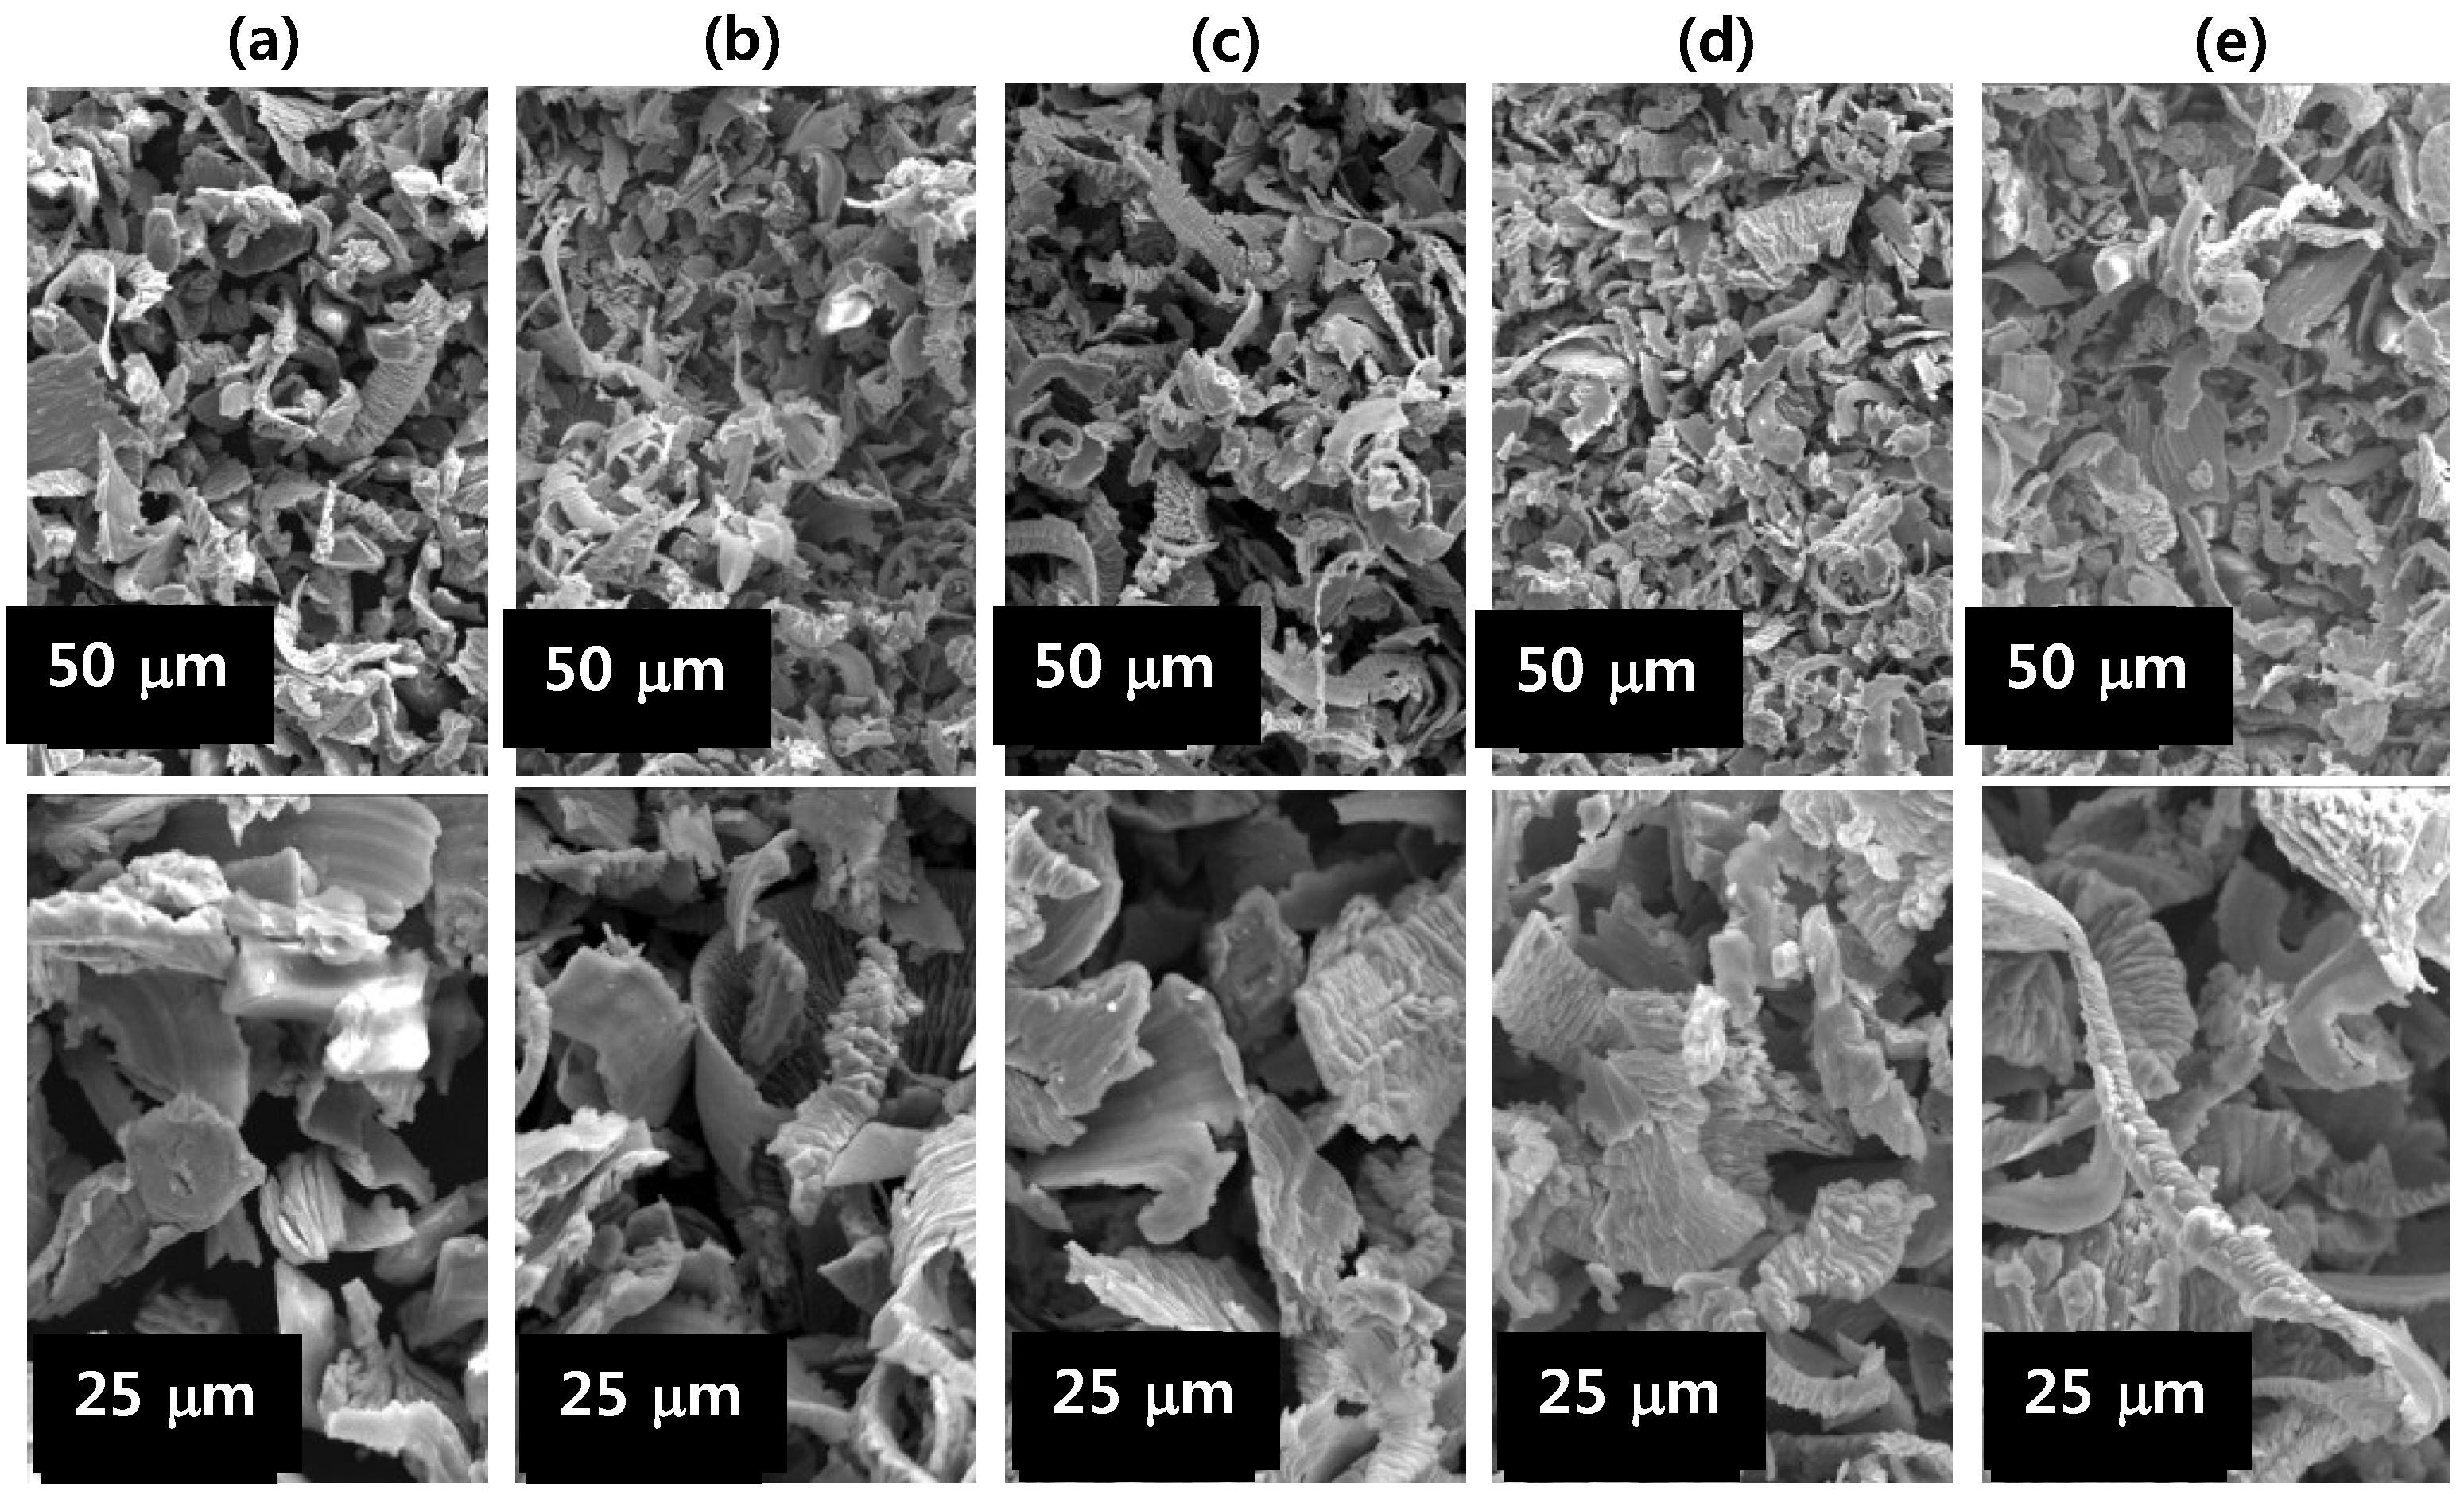
3.1. Phase and Microstructure

Figure 2 shows the XRD patterns as a function of x for the Ti-xIn (x = 0, 5, 10, 15, and 20 wt%) samples. There was no obvious change in the diffraction patterns and peak positions as the In content changed. The patterns of Ti-xIn alloys can be indexed as a hexagonal α-Ti type structure (the space group of P63/mmc). In all of the Ti-xIn alloys, no peak splitting was observed, which indicated that the structural transformation from α-Ti to β-Ti did not occur.
Figure 2. X-ray diffraction (XRD) patterns of commercially pure Ti (cp-Ti) and the series of binary Ti-xIn alloys. The vertical dotted line in the figure is a guide to the eye, and it connects the peak positions of the α-Ti phase.
Metals 05 00850 g002
Rietveld refinements were done to investigate the effect of In on the lattice parameters, and the results are shown in Figure 3. The bigger atomic radius of In (approximately 1.67 Å) compared to Ti (approximately 1.47 Å) [31] meant the addition of In atoms caused the lattice parameters to increase. This caused the XRD peaks to shift toward lower angles. The lattice parameters a and c increased linearly with increasing In content in the Ti-xIn alloys, but the c axis increased much more rapidly than the a axis. As a result, the c/a ratio increased linearly as the In content increased, which is in agreement with previous findings [28]. The unit cell constants of cp-Ti were a = 2.951 (1) Å and c = 4.683 (1) Å (c/a ratio = 1.581), corresponding with those in the literature (JCPDS card No. 44-1294) [32], whereas the unit cell parameters of Ti-20In were a = 2.964 (1) Å and c = 4.740 (1) Å (c/a ratio = 1.599). Based on the linear relationship of the lattice parameters in the Ti-xIn alloys, we estimated that up to 20 wt% In dissolved to form a solid solution, in agreement with the binary Ti-In phase diagram [28].
Figure 3. (a, b) Lattice parameters (a and c) of cp-Ti and Ti-xIn alloys and (c) the variation in the ratio (c/a) of lattice parameters.
Metals 05 00850 g003
Figure 4 shows the representative optical micrographs of the Ti-xIn alloys. All the Ti-xIn alloys exhibited lamellar pattern microstructure. Detailed microstructure analyses were performed using TEM. As shown in Figure 5, the fine, acicular martensitic phase was observed, especially in Ti-10In alloy. The SAED patterns of the Ti-10In alloy consisted of a characteristic single α-Ti phase (Figure 5c) in the matrix which showed a perfect atomic arrangement and a highly faulted sub-microstructure (Figure 5d) due to Ti and In solid solution formation.
Figure 4. Optical micrographs of Ti-xIn alloys: (a) Ti-5In, (b) Ti-10In, (c) Ti15In, and (d) Ti-20In.
Metals 05 00850 g004
Figure 5. Transmission electron microscopy (TEM) and selected area electron diffraction (SAED) patterns of Ti-10In alloy. (a) TEM image, (b) magnified TEM image, and (c,d) representative SAED patterns.
Metals 05 00850 g005

3.2. Mechanical Properties

Table 1 shows the Vickers hardness and elastic modulus of Ti-xIn alloys compared to those of cp-Ti (n = 5). All the Ti-xIn alloys had significantly higher Vickers hardness values (p < 0.05) than that of cp-Ti. Of the Ti-In alloys, the alloy with 10 wt% In content showed the highest hardness value (522 HV), which was about three times larger than that of cp-Ti (165 HV). The abnormal hardness of the Ti-10In alloy was probably caused by the combined effect of the solid-solution strengthening of the α-phase and the hardening of the fine, acicular martensitic phase. This was in agreement with previous results by Ho et al [15]. They reported a sharp increase in hardness caused by the presence of a martensitic phase in the Ti-Mo system. On the other hand, no consistent trend in the elastic modulus related to changes in In concentration in the Ti-xIn alloys was observed. The elastic modulus for cp-Ti was 132 GPa. The elastic moduli of the Ti-5In and Ti-15In alloys were slightly higher than that of cp-Ti, whereas the elastic moduli of the Ti-10In and Ti-20In alloys were lower (p < 0.05). The values for Ti-10In and Ti-20In alloys were about 124 GPa. Therefore, the Ti-10In and Ti-20In alloys are more suitable for dental applications because of their low modulus and high strength. The appearance of metal chips resulting from metal grinding at 10,000 rpm was examined using an SEM and is shown in Figure 6. Although no quantitative evaluation was performed, chips of Ti-xIn alloys appeared larger than those of cp-Ti. As the In concentration increased, the chips became longer.
Table 1. Vickers hardness values of Ti-xIn alloys compared with cp-Ti.
Alloy codeHardness (VHN)Elastic modulus (GPa)
cp-Ti164.54 (3.54) *,a132.35 (12.22) a
Ti-5In402.60 (128.12) b159.80 (2.57) c
Ti-10In522.40 (61.03) b124.10 (4.61) a
Ti-15In303.20 (89.38) c141.10 (4.01) b
Ti-20In332.00 (46.80) c124.43 (4.69) a
* Within the same column, the different alphabet in superscript indicated statistically different mean values at a 5% level (p < 0.05) according to Duncan’s multiple range test.
Figure 7 shows profiles of the ground surfaces of the Ti-xIn alloys, which were ground at 10,000 rpm using a SiC. Grinding marks were observed on all of the Ti-xIn alloys. However, there was no pronounced difference in the appearances of the ground surfaces of all the Ti-xIn samples. A surface roughness parameter (Ra) was selected to express the surface roughness. The cp-Ti showed a mean Ra value of 1.4 (3) μm. The Ra values for Ti-xIn alloys were in the range of 1.2 (2)–1.8 (2) μm. The Ti-5In showed the highest mean Ra value of 1.8 (2) μm. The mean Ra value decreased as the In concentration increased in Ti-xIn alloys. The oxidation behavior of Ti-xIn alloys was assessed using thermogravimetric analysis (TGA).
Figure 6. Metal chips resulting from grinding at 10,000 rpm (two magnifications): (a) cp-Ti, (b) Ti-5In, (c) Ti-10In, (d) Ti-15In, and (e) Ti-20In.
Metals 05 00850 g006
Figure 7. Profiles of ground surfaces of Ti-xIn alloys at a grinding speed of 10,000 rpm: (a) Ti-5In, (b) Ti-10In, (c) Ti-15In, and (d) Ti-20In.
Metals 05 00850 g007
Figure 8. Thermogravimetric analysis (TGA) of cp-Ti and Ti-xIn alloys showing various degrees of weight gain (%) after heating in air up to 795 °C and 1000 °C.
Metals 05 00850 g008
Figure 8 shows the result of TGA when the cp-Ti and Ti-xIn alloys were heated up to 795 °C and 1000 °C at a heating rate of 10 °C/min in air (n = 2). At temperatures higher than 500 °C, the Ti-xIn alloys were rapidly oxidized, resulting in a significant increase in mass. All of the In-containing samples showed weight gain of about 0.1% at a temperature of 795 °C, whereas at 1000 °C, a significant change in mass of 0.8%–1.2% was observed. Among the tested Ti-xIn alloys, the final mass change in the Ti-10In alloy was significantly less than that after the oxidation of cp-Ti, indicating that the addition of In to cp-Ti could restrain the oxidation rate of the alloy, and Ti-10In alloys had stronger oxidation resistance.

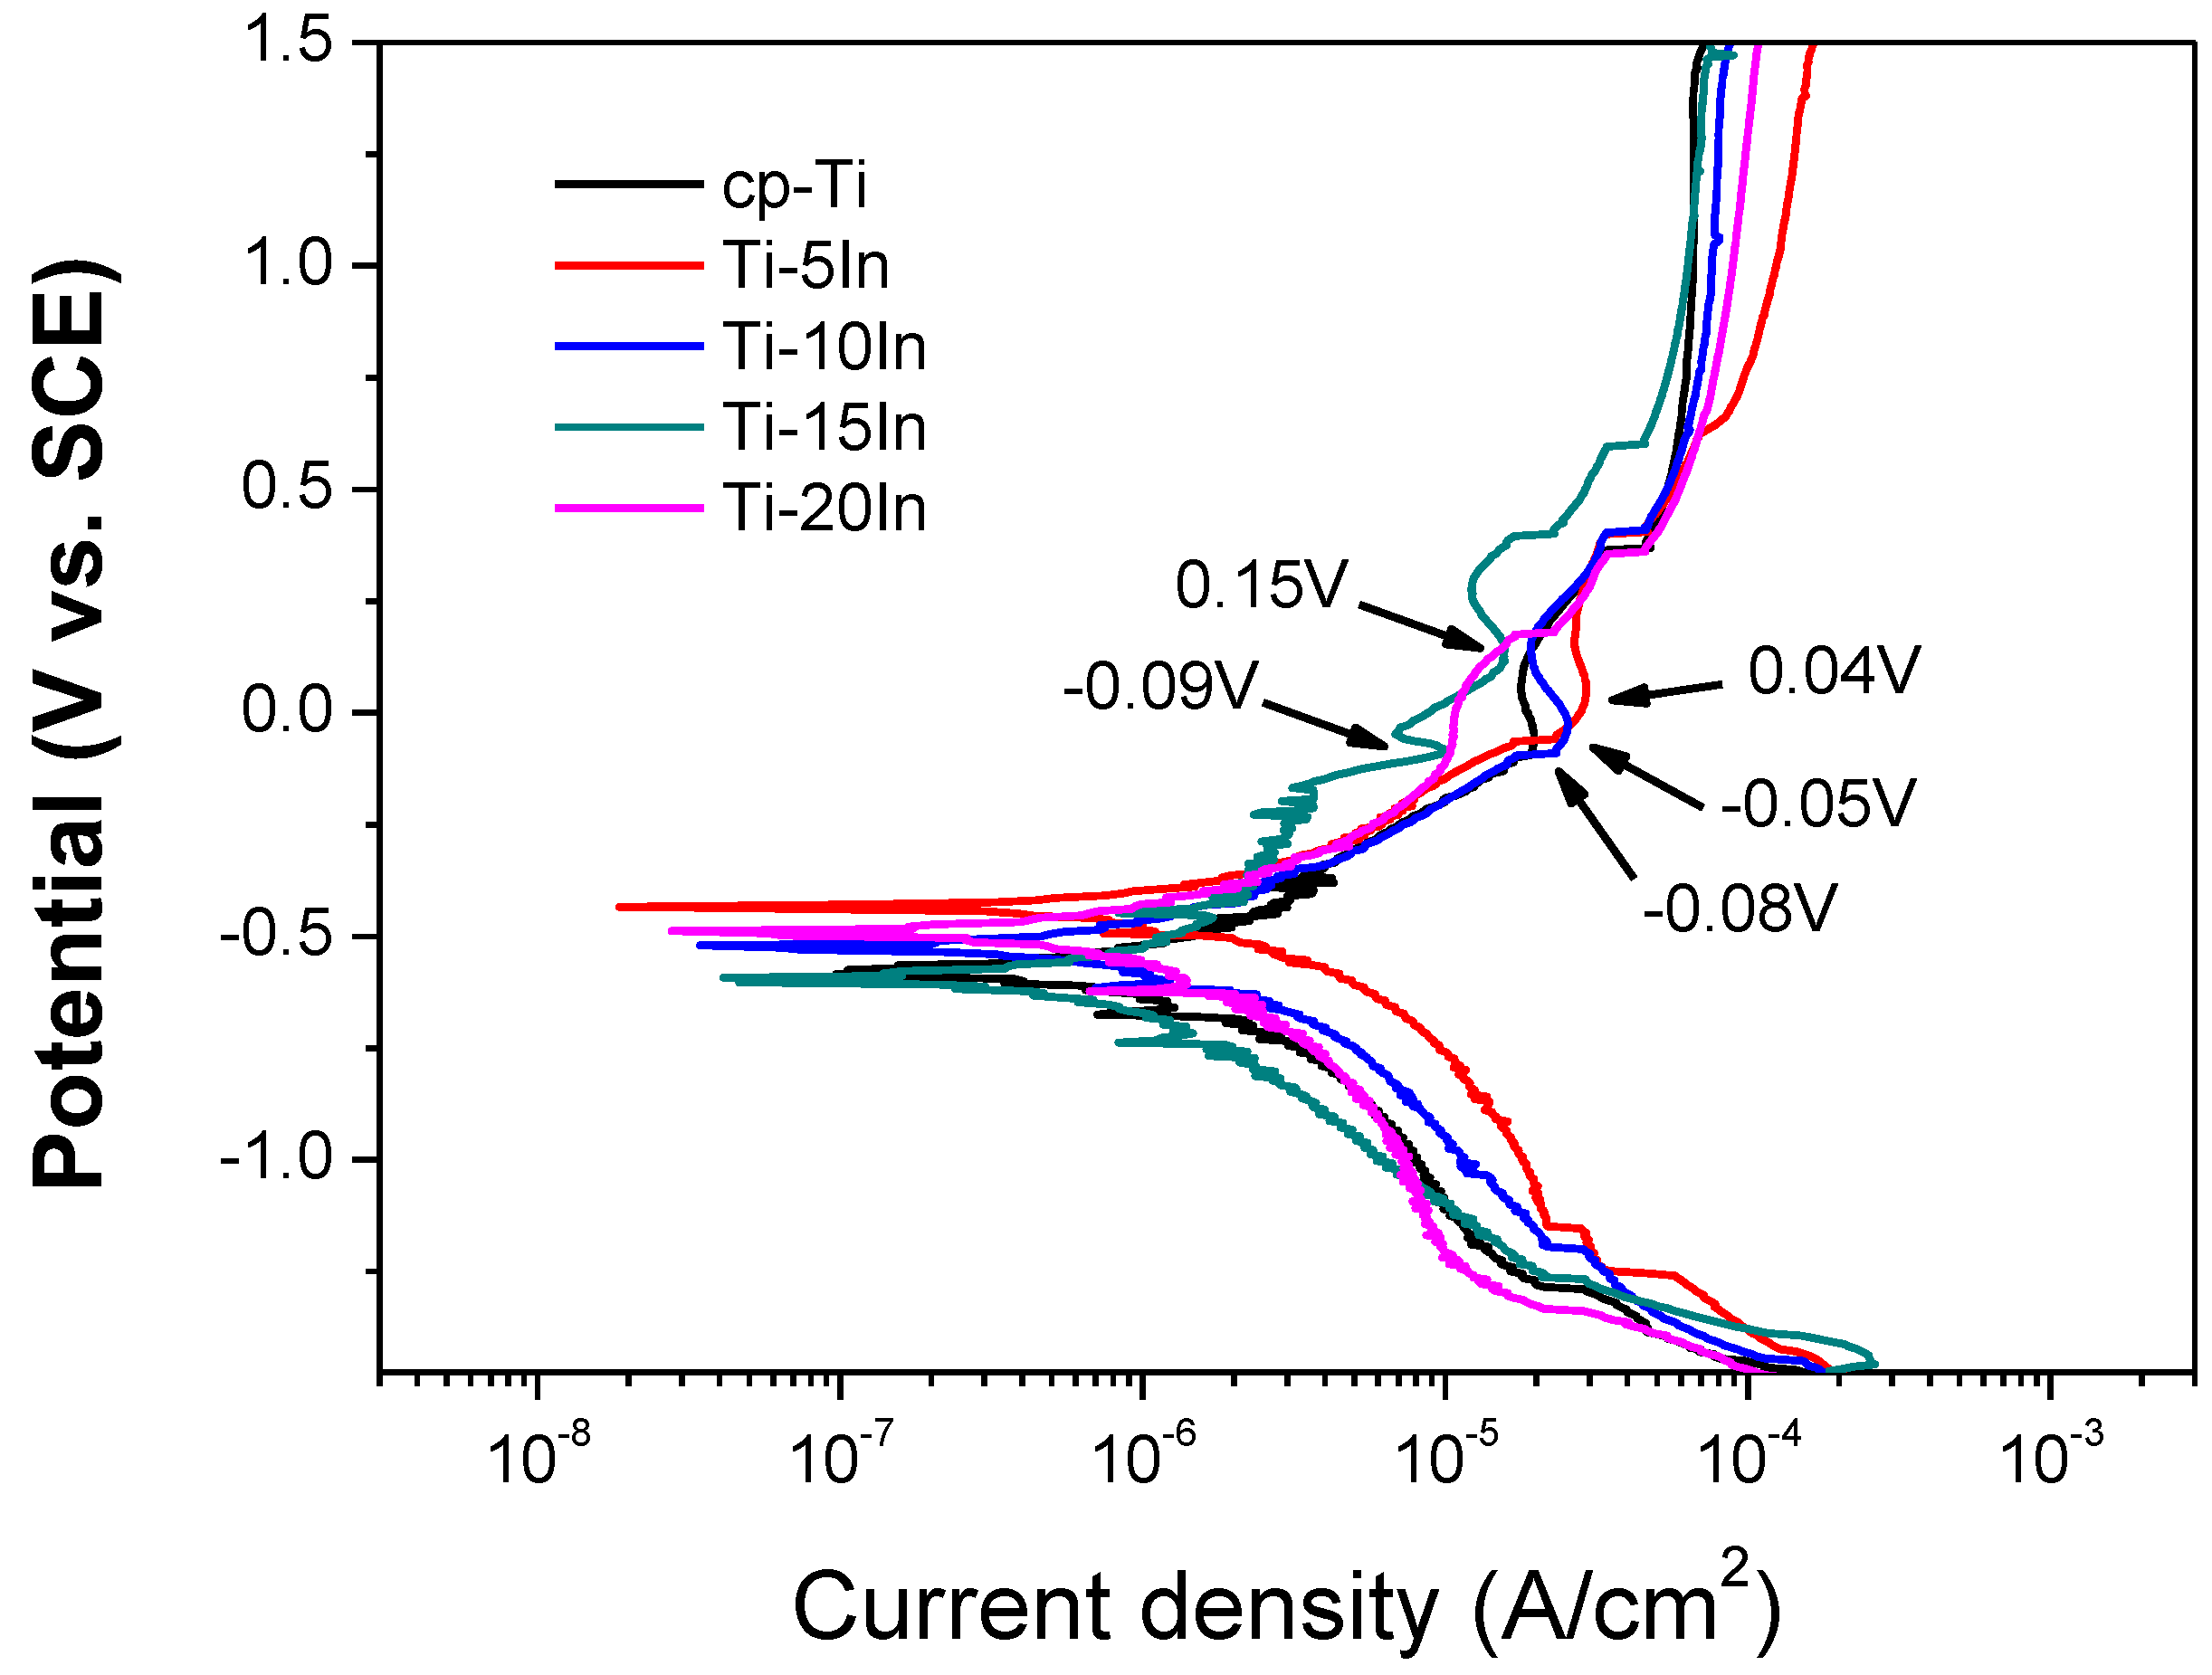
3.3. Corrosion Behavior

The corrosion behavior of the Ti-xIn alloys were evaluated using potentiodynamic polarization and the results are shown in Figure 9. The anodic polarization curves reveal typical anodic reactions below −0.08 V, initial passive oxide formation at −0.05–0.25 V. The cp-Ti, Ti-10In, and Ti-15In displayed passive behavior above 0.6 V, while the Ti-5In and Ti-20In revealed transpassive behavior above 0.6 V. Ti-15In showed a rapid current increase at approximately −0.08 V, which may be attributed to localized corrosion or pitting corrosion on the surface defects. The critical potentials of cp-Ti, Ti-5In, and Ti-10In were observed at −0.08, 0.04, and −0.05 V, respectively. Ti-20In showed no critical potential in the −0.08–0.16 V range. The initial passive current densities were in the following order: Ti-5In (2.6 × 10⁻⁶ μA/cm2) > Ti-10In (1.9 × 10⁻⁶ μA/cm2) > cp-Ti (1.7 × 10⁻⁶ μA/cm2) > Ti-15In (1.2 × 10⁻⁶ μA/cm2) > Ti-20In (1.1 × 10⁻⁶ μA/cm2). Ti-20In and Ti-5In showed pseudopassive behavior. The current densities at 1.0 V were in the following order: Ti-5In (123 × 10−6 μA/cm2) > Ti-20In (89 × 10−6 μA/cm2) > Ti-10In (76 × 10−6 μA/cm2) > Ti-15In (63 × 10−6 μA/cm2) > cp-Ti (66 × 10−6 μA/cm2). Using the Tafel extrapolation method, we calculated the corrosion parameters of cp-Ti and Ti-xIn alloys from both the anodic and cathodic branches of the potentiodynamic polarization curves. These results are summarized in Table 2. A cathodic shift in Ecorr compared to cp-Ti was observed in the Ti-5In, Ti-10In, and Ti-20In alloys. All investigated Ti-xIn samples exhibited similar Icorr (0.35–0.73 μA/cm2) compared to that (0.61 μA/cm2) of cp-Ti.
Figure 9. Representative potentiodynamic polarization curves for cp-Ti and Ti-xIn alloys. The arrows indicate the critical potential.
Metals 05 00850 g009
Table 2. Corrosion potential (Ecorr) and corrosion current density (Icorr) of cp-Ti and Ti-xIn alloys.
Alloy codeEcorr (±SD) (V)Icorr (±SD) (μA/cm2)
cp-Ti−0.58 (0.04) *,a0.61 (0.17) a,b
Ti-5In−0.49 (0.05) a0.73 (0.36) b
Ti-10In−0.59 (0.07) a0.42 (0.09) a,b
Ti-15In−0.58 (0.12) a0.35 (0.02) a
Ti-20In−0.54 (0.05) a0.44 (0.05) a,b
* Within the same column, the different alphabet in superscript indicated statistically different mean values at a 5% level (p < 0.05) according to Duncan’s multiple range test.

4. Conclusions

This study investigated the influence of In on the microstructure, mechanical properties, and corrosion behavior of commercially pure titanium (cp-Ti). All the Ti-xIn alloys with up to 20 wt% In content exhibited a hcp α structure. Based on the linear relationship of the lattice parameters with the In content, Ti alloys with up to 20 wt% In concentration formed solid solutions. The present study demonstrated that the mechanical properties and corrosion behavior of Ti-xIn alloys are sensitive to the In content. The Vickers hardness increased as the In content increased because of solid solution strengthening. Ti-10In alloy with a fine, acicular martensitic phase had the best Vickers hardness and oxidation resistance among all of the tested samples. Electrochemical results showed that the Ti-xIn alloys exhibited a similar corrosion resistance to cp-Ti. Considering the mechanical properties and corrosion behavior, Ti-xIn alloy with an In content of 10 wt% is a good candidate for dental casting alloys.

Acknowledgments

This study was financially supported by the National Research Foundation of Korea (NRF) grant funded by the Korea government (MSIP) (No. 2011-0030121), and by the Basic Science Research Program through the NRF funded by the Ministry of Education, Science, and Technology (2011-0002706).

Author Contributions

The microstructure analysis of Ti-xIn alloys was undertaken by Mi-Kyung Han. The mechanical analysis was performed by Jae-Bong Im. The electrochemical analysis was provided by Moon-Jin Hwang. The preparation of test samples was supported by Bong-Jun Kim and Hae-Young Kim. The research work outlined in this paper was designed and supervised by Yeong-Joon Park.

Conflicts of Interest

The authors declare no conflict of interest.

References

  1. Leyens, C.; Peters, M. Titanium and Titanium Aloys; Wiley Online Library: Weinheim, Germany, 2003. [Google Scholar]
  2. Lloyd, C.; Scrimgeour, S.; Brown, D.; Clarke, R.; Curtis, R.; Hatton, P.; Ireland, A.; McCabe, J.; Nicholson, J.; Setcos, J. Dental materials: 1995 literature review. J. Dent. 1997, 25, 173–208. [Google Scholar] [CrossRef] [PubMed]
  3. Ezugwu, E.; Wang, Z. Titanium alloys and their machinability—A review. J. Mater. Process. Technol. 1997, 68, 262–274. [Google Scholar] [CrossRef]
  4. Niinomi, M. Mechanical properties of biomedical titanium alloys. Mater. Sci. Eng. A 1998, 243, 231–236. [Google Scholar] [CrossRef]
  5. Lee, C.; Ju, C.-P.; Chern Lin, J. Structure—Property relationship of cast Ti-Nb alloys. J. Oral Rehabil. 2002, 29, 314–322. [Google Scholar] [CrossRef] [PubMed]
  6. Kikuchi, M.; Takahashi, M.; Okuno, O. Mechanical properties and grindability of dental cast Ti-Nb alloys. Dent. Mater. J. 2003, 22, 328–342. [Google Scholar] [CrossRef] [PubMed]
  7. Zhou, F.; Wang, B.; Qiu, K.; Lin, W.; Li, L.; Wang, Y.; Nie, F.; Zheng, Y. Microstructure, corrosion behavior and cytotoxicity of Zr–Nb alloys for biomedical application. Mater. Sci. Eng. C 2012, 32, 851–857. [Google Scholar] [CrossRef]
  8. Oh, K.-T.; Shim, H.-M.; Kim, K.-N. Properties of titanium-silver alloys for dental application. J. Biomed. Mater. Res. Part B Appl. Biomater. 2005, 74, 649–658. [Google Scholar] [CrossRef] [PubMed]
  9. Zhang, B.; Qiu, K.; Wang, B.; Li, L.; Zheng, Y. Surface characterization and cell response of binary ti-ag alloys with cp ti as material control. J. Mater. Sci. Technol. 2012, 28, 779–784. [Google Scholar] [CrossRef]
  10. Takahashi, M.; Kikuchi, M.; Okuno, O. Mechanical properties and grindability of experimental Ti-Au alloys. Dent. Mater. J. 2004, 23, 203–210. [Google Scholar] [CrossRef] [PubMed]
  11. Kikuchi, M.; Takahashi, M.; Sato, H.; Okuno, O.; Nunn, M.E.; Okabe, T. Grindability of cast Ti–Hf alloys. J. Biomed. Mater. Res. Part B Appl. Biomater. 2006, 77, 34–38. [Google Scholar] [CrossRef] [PubMed]
  12. Zhang, F.; Weidmann, A.; Nebe, B.; Burkel, E. Preparation of TiMn alloy by mechanical alloying and spark plasma sintering for biomedical applications. J. Phys. Conf. Ser. 2009, 012007. [Google Scholar]
  13. Hsu, H.-C.; Wu, S.-C.; Chiang, T.-Y.; Ho, W.-F. Structure and grindability of dental Ti–Cr alloys. J. Alloys Compd. 2009, 476, 817–825. [Google Scholar] [CrossRef]
  14. Ho, W.-F.; Chiang, T.-Y.; Wu, S.-C.; Hsu, H.-C. Mechanical properties and deformation behavior of cast binary Ti–Cr alloys. J. Alloys Compd. 2009, 468, 533–538. [Google Scholar] [CrossRef]
  15. Ho, W.; Ju, C.; Chern Lin, J. Structure and properties of cast binary Ti–Mo alloys. Biomaterials 1999, 20, 2115–2122. [Google Scholar] [CrossRef] [PubMed]
  16. Hsu, H.-C.; Lin, H.-C.; Wu, S.-C.; Hong, Y.-S.; Ho, W.-F. Microstructure and grindability of as-cast Ti–Sn alloys. J. Mater. Sci. 2010, 45, 1830–1836. [Google Scholar] [CrossRef]
  17. Ho, W.-F.; Chen, W.-K.; Wu, S.-C.; Hsu, H.-C. Structure, mechanical properties, and grindability of dental Ti–Zr alloys. J. Mater. Sci. Mater. Med. 2008, 19, 3179–3186. [Google Scholar] [CrossRef] [PubMed]
  18. Hsu, H.-C.; Wu, S.-C.; Hsu, S.-K.; Sung, Y.-C.; Ho, W.-F. Effects of heat treatments on the structure and mechanical properties of Zr–30Ti alloys. Mater. Charact. 2011, 62, 157–163. [Google Scholar] [CrossRef]
  19. Hsu, H.-C.; Wu, S.-C.; Sung, Y.-C.; Ho, W.-F. The structure and mechanical properties of as-cast Zr-Ti alloys. J. Alloys Compd. 2009, 488, 279–283. [Google Scholar] [CrossRef]
  20. Mareci, D.; Chelariu, R.; Gordin, D.-M.; Ungureanu, G.; Gloriant, T. Comparative corrosion study of Ti–Ta alloys for dental applications. Acta Biomater. 2009, 5, 3625–3639. [Google Scholar] [CrossRef] [PubMed]
  21. Zhou, Y.-L.; Niinomi, M. Ti–25Ta alloy with the best mechanical compatibility in Ti–Ta alloys for biomedical applications. Mater. Sci. Eng. C 2009, 29, 1061–1065. [Google Scholar] [CrossRef]
  22. Wang, R.; Welsch, G. Evaluation of an experimental Ti-Co alloy for dental restorations. J. Biomed. Mater. Res. Part B Appl. Biomater. 2013, 101, 1419–1427. [Google Scholar] [CrossRef] [PubMed]
  23. Moser, J.; Lin, J.C.; Taira, M.; Greener, E. Development of dental Pd−Ti alloys. Dent. Mater. 1985, 1, 37–40. [Google Scholar] [CrossRef] [PubMed]
  24. Lin, W.-J.; Wang, B.-L.; Qiu, K.-J.; Zhou, F.-Y.; Li, L.; Lin, J.-P.; Wang, Y.-B.; Zheng, Y.-F. Ti–Ge binary alloy system developed as potential dental materials. J. Biomed. Mater. Res. Part B Appl. Biomater. 2012, 100, 2239–2250. [Google Scholar] [CrossRef] [PubMed]
  25. Okabe, T.; Kikuchi, M.; Ohkubo, C.; Koike, M.; Okuno, O.; Oda, Y. The grindability and wear of Ti-Cu alloys for dental applications. JOM 2004, 56, 46–48. [Google Scholar] [CrossRef]
  26. Wang, Q.; Wang, Y.; Lin, J.; Zheng, Y. Development and properties of Ti-In binary alloys as dental biomaterials. Mater. Sci. Eng. C 2012, 33, 1601–1606. [Google Scholar] [CrossRef]
  27. Kim, T.-I.; Han, J.-H.; Lee, I.-S.; Lee, K.-H.; Shin, M.-C.; Choi, B.-B. New titanium alloys for biomaterials: A study of mechanical and corrosion properties and cytotoxicity. Bio-Med. Mater. Eng. 1997, 7, 253–263. [Google Scholar]
  28. Gulay, L.; Schuster, J. Investigation of the titanium–indium system. J. Alloys Compd. 2003, 360, 137–142. [Google Scholar] [CrossRef]
  29. Hunter, B.A.; Howard, C.J. Australian Nuclear Science and Technology Organization. Available online: ftp://ftp.ansto.gov.au/pub/physics/neutron/rietveld/Rietica_LHPM95/MANUAL.PDF (accessed on 18 May 2015).
  30. ASTM International. Standard Reference Test Method for Making Potentiostatic and Potentiodynamic Anodic Polarization Measurements; ASTM G5-94; ASTM International: West Conshohocken, PA, USA, 2011. [Google Scholar]
  31. Huheey, J.E.; Keiter, E.A.K.; Keiter, R.L.; Medhi, O.K. Inorganic Chemistry: Principles of Structure and Reactivity; Harper & Row: New York, NY, USA, 1983. [Google Scholar]
  32. Joint Committee on Powder Diffraction Standards (JCPDS)-International Centre for Diffraction Data (ICDD). Card No. 44-1294; Joint Committee on Powder Diffraction Standards (JCPDS)-International Centre for Diffraction Data (ICDD): Swarthmore, PA, USA, 1995. [Google Scholar]

