
Damage Behavior of Sintered Fiber Felts

Institute for Materials, TU Braunschweig, Langer Kamp 8, Braunschweig D-38106, Germany
*
Author to whom correspondence should be addressed.
Metals 2015, 5(2), 591-602; https://doi.org/10.3390/met5020591
Submission received: 1 October 2014
/
Revised: 25 March 2015
/
Accepted: 31 March 2015
/
Published: 10 April 2015
Abstract
:The reduction of aircraft noise is important due to a rising number of flights and the growth of urban centers close to airports. During landing, a significant part of the noise is generated by flow around the airframe. To reduce that noise porous trailing edges are investigated. Ideally, the porous materials should to be structural materials as well. Therefore, the mechanical properties and damage behavior are of major interest. The aim of this study is to show the change of structure and the damage behavior of sintered fiber felts, which are promising materials for porous trailing edges, under tensile loading using a combination of tensile tests and three dimensional computed tomography scans. By stopping the tensile test after a defined stress or strain and scanning the sample, it is possible to correlate structural changes and the development of damage to certain features in the stress-strain curve and follow the damage process with a high spatial resolution. Finally, the correlation between material structure and mechanical behavior is demonstrated.
1. Introduction
As the exposure to significant noise loads, caused by an increasing number of flights and airports close to residential areas, impairs physical health and productivity, a reduction of aircraft noise has become important in engineering [1,2]. A major factor for aircraft noise during landing is the noise generated by flow around the airframe. One way to lower that noise is to use porous surfaces, e.g., a porous trailing edge [3–7]. Ideally, the porous materials are supposed to bear mechanical loads. As the structural changes influence the aeroacoustic performance, not only the mechanical properties, but also the damage behavior is of major interest. X-ray tomography is a non-destructive tool that enables material characterization and in situ experiments to reveal structural changes and damage during mechanical tests and, therefore, it has been used in several studies [8–13]. In this study, the damage behavior is analyzed using a combination of tensile tests and three dimensional computed tomography, which allows determination of the damage location with a high resolution. To detect fiber rotation a line segmentation technique, wich allows to chartacterize the morphology and orientation of pores and ligaments, is applied [14–16]. For these experiments the sintered fiber felts SFF 3 and SFF 100, obtained from GKN Sinter Metals (GKN Sinter Metals GmbH, Dahlienstraße, Radevormwald, Germany), that showed a good acoustic performance were chosen and characterized extensively in previous studies [16,17]. The test sample was scanned to create a reference and afterwards used in a tensile test. The tensile test was then stopped at defined strains or significant changes in stress and the sample was analyzed for structural changes and damage.
2. Material Characterisation
The sintered fiber felts selected for this study consist of one functional layer (SFF 100), three functional layers (SFF 3), and a support grid with significantly bigger dimensions. Both fiber felts were manufactured from the CrNi alloy AISI 316L. The materials were characterized using 3D computed tomography as described in [17,18]. CT images of both fiber felts are shown in Figure 1. The material properties can be found in Table 1. The fibers of SFF 3 are finer and the porosity is lower compared to SFF 100. Additionally the wires of the support grid of SFF 3 are around 30% thinner than those of SFF 100. In relation to the overall thickness, SFF 3 has a relatively thick functional layer and SFF 100 a relatively thin one. The voxel size achieved with the samples used to characterize the sintered fiber felts was V ≈ 1 µm. This resolution is four times higher than the resolution achieved with the tensile samples (V ≈ 4 µm) due to an increasing sample size. Therefore all data in Table 1 results from scans and samples separate from the tensile tests.
3. Experimental Procedure
To analyze the damage behavior of sintered fiber felts, tensile test samples were repeatedly examined at defined strains and before the tensile tests to create a reference using computed tomography. Because the resolution of CT scans decreases with increasing field of view, the samples were kept small and the scan was divided into four scans along the gage length, which were subsequently merged to one reconstruction. Samples with a width of 7 mm turned out to be suitable for tensile testing and enabled a voxel size of V ≈ 4 µm m in the CT scan, which is sufficient for the selected sintered fiber felts. To support the relatively soft sintered fiber felts during the scan, they were scanned in a carbon fiber tube (see Figure 2a). As the carbon fiber tube has a low density and is nearly transparent to X-rays, it does not impair the scan quality and was neglected in the reconstruction. To ensure that after every tensile step the same part of the sample was scanned it was marked using copper strips. The investigated area lies between the two copper strips as shown in Figure 2b. The distance between the copper strips corresponds to the initial separation distance of the strain extensometer clips used for the tensile tests. The stress given in Figure 3 refers to the cross-sectional area of the sample without taking the porosity into account. For the first step of the tensile tests a maximum strain of ϵ = 2% was selected. For all following steps the tensile test was stopped after additional strains of ϵ = 5%.
3.1. Structure Analysis
As the sintered fiber felts deform during the tensile test, the fibers of the functional layers are expected to be rotating. X-ray tomography is a powerful tool to measure the fiber orientations in fibrous materials, as demonstrated in several works [11,13,19]. Usually, the fibers are idealized as cylinders and the orientation distribution of the cylinder axes is plotted. In this paper however, not the fiber orientations, but their evolution during the tensile test is analyzed. This is done using a line segmentation technique, which is mainly used to measure the sizes of pores and ligaments [14–16]. For this a lattice of parallel lines with a defined distance is superimposed to cross-sectional binarized black and white images of the sintered fiber felts, which were extracted from the CT scans. The lattice is then rotated 180° in steps of 1° and the lengths of the black and white segments is measured. The mean length of the black and white segments for all angles can then be plotted in structural ellipses [14].
The structural ellipses of a cross-sectional area perpendicular to the surface of the fiber felts and without a preferred fiber orientation would be circular. When the fibers rotate during the tensile test into a preferred orientation, the structural ellipses will change their appearance from a circular to a more elliptic shape. The line segmentation technique was applied to images perpendicular to the surface of the sintered fiber felt and parallel to the direction of loading (YZ plane in Figures 4 and 5). For every tensile test step five planes were analyzed and the results were averaged. Additionally, the longest and shortest mean segment length from the line segmentation analysis were used to define an aspect ratio. This aspect ratio can be used as an indicator for a preferred fiber orientation and fiber rotation. Note that the longest and shortest mean segment length are not equivalent to the long and short axis of the ellipses.
Due to the small fiber diameters of the inner functional layer of SFF 3 and the rather coarse resolution during the interrupted tensile tests, the line segmentation analysis was only applied to SFF 100.
4. Results and Discussion
The damage behavior analyses performed for SFF 3 and SFF 100 consist of eight tensile test steps accompanied by nine CT scans. The stress strain curves of both sintered fiber felts are shown in Figure 3. Selected CT images are given in Figure 4 for SFF 3 and Figure 5 for SFF 100.
SFF 3 After a strain of ϵ = 2%, SFF 3 does not show any damage or changes of the material structure in the CT images. The first structural changes can be observed after a strain of ϵ = 7% as shown in Figure 4b,c. While the outer functional layer (indicated as layer 1) and the layer directly on the support grid (indicated as layer 3) are intact, the middle layer shows a tear perpendicular to the direction of loading (see arrow in Figure 4b). The CT images clearly show how the tear opens in layer 2 and closes again in layer 3. This structural change corresponds to a drop of stress observed in the stress-strain curve of SFF 3. After the middle layer of SFF 3 fails, the stress remains essentially constant (strains between ϵ = 7% and ϵ ≈ 10%) while the two remaining functional layers fail. In this strain range the increase of stress in the wires of the support grid, caused by strain hardening of the metal, compensates for the reduction of the cross-sectional area. However, the tear does not expand into the adjacent layers, but new tears appear in locally weakened areas of the sample. The distance between the failure locations of layer 1 and layer 2 is approximately 4 mm in the Z-direction of the reconstruction as indicated by the arrows shown in Figure 4d. Between these two failure locations the interface between layer 1 and layer 2 delaminated parallel to the direction of loading. Because one clip of the strain extensometer was located near the tear in the outer layer it slipped on the surface resulting in the loop shown in the stress-strain curve. After complete failure of the functional layers (ϵ > 10%) only the support grid is bearing the mechanical load. Then individual wires of the support gird begin to fail in various regions of the sample resulting in multiple tears rather than one tear propagating from a single failure location. It can be observed that wires that were originally oriented perpendicular to the direction of loading rotate into the direction of loading and enable a very high strain after the functional layers and all wires originally in the direction of loading had failed (see Figure 4f). The support grid finally tears apart by a stepwise failure of single wires and failure at the intersections between the rotating wires and the wires that were originally oriented in the direction of loading. This stepwise failure is reflected by the small fluctuations in the last segment of the stress-strain curve.
SFF 100 Like SFF 3, SFF 100 does not show any damage or changes of the material structure in the CT images for ϵ = 2%. While SFF 3 shows a clear drop of stress corresponding to damage of the functional layer for strains smaller than ϵ = 12%, SFF 100 only shows a slightly decreasing slope in the stress-strain curve and local necking of the functional layer along with first signs of a tearing functional layer (see Figure 5b) for strains between ϵ = 12% and ϵ = 17%. A complete failure of the functional layer, shown in Figure 5c, was observed after ϵ = 22%. The first wires of the support gird failed at ϵ = 27%, corresponding with a drop in stress. The support grid then finally fails similarly to SFF 3 as shown in Figure 5d.
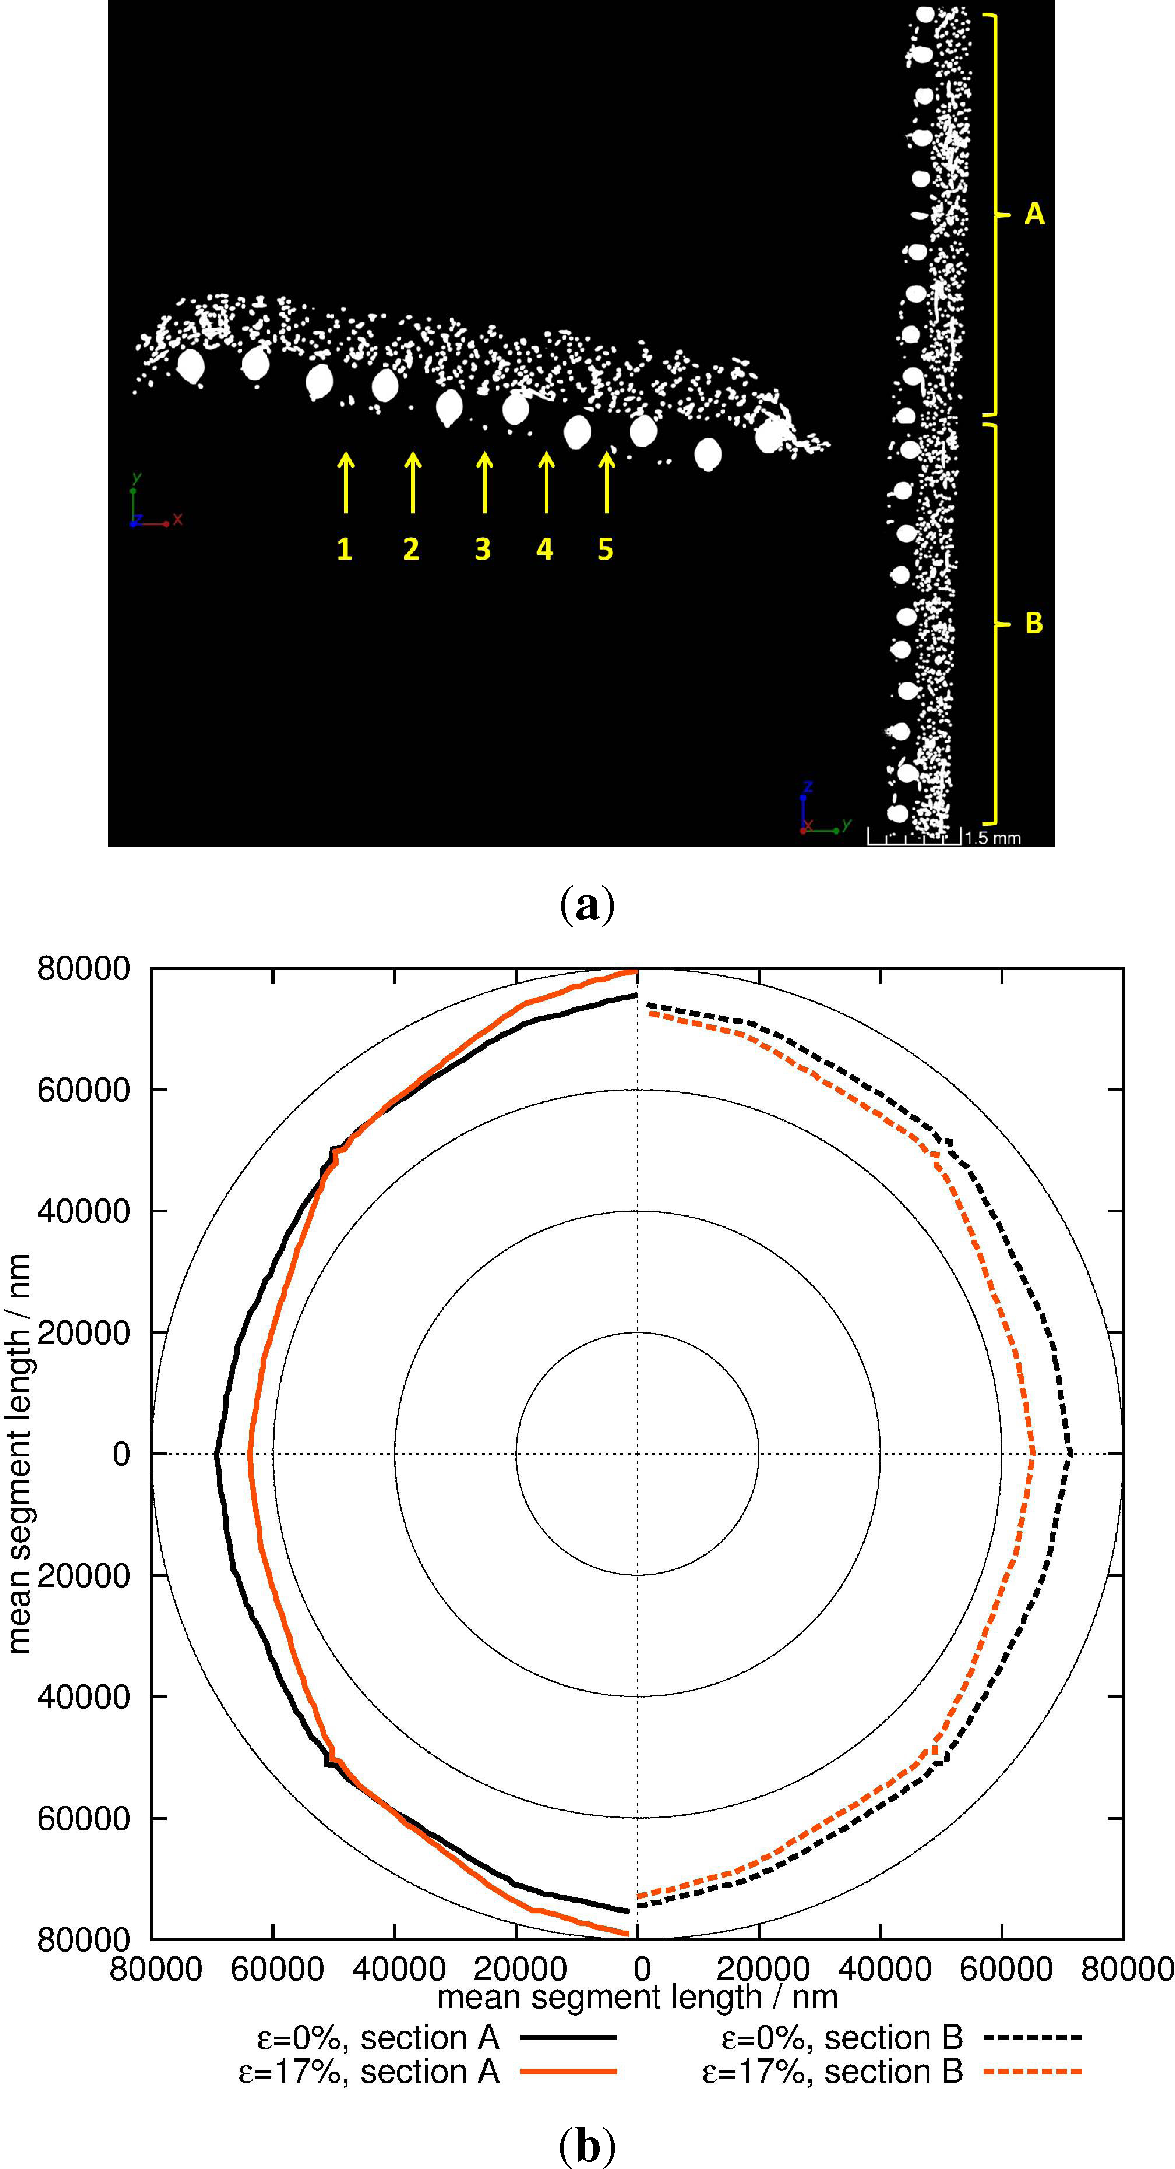
To analyze the fiber rotation in the functional layer, the line segmentation technique was applied to binarized images, which were extracted from the CT-scans of SFF 100. The images were extracted between wires oriented in the direction of loading at the position indicated in Figure 6a. As the three-dimensional images show local deformation and tearing of the functional layer, the line segmentation analysis was split into two sections. The upper section of the reconstruction, including the tear formation is indicated as section A. The lower section, without tear formation, is indicated as section B (compare Figure 6a).
Along with the necking and initial tear formation in the functional layer (between ϵ = 12% and ϵ = 17%), the line segmentation reveals a rotation of the fibers in the functional layer into the direction of loading. The structural ellipses for ϵ = 0% (section A and B) have a roughly circular shape, whereas the ellipses for ϵ = 17% are clearly elliptical. Although the fibers all over the gage length (section A and B) are rotating, the rotation is stronger in the vicinity of the tear (section A). The long axes of the ellipses in Figure 6b correspond to the direction of loading in the tensile test.
The aspect ratio given in Table 2 for section A is increasing up to a strain of ϵ = 17% and reaches a maximum of 1,272. The aspect ratio for section B stays roughly constant for strains higher than ϵ = 7% and reaches a maximum of 1,166. That indicates that the fiber rotation in section B stops when the tear starts to form in Section A. The functional layer delaminates from the support grid (compare Figure 5c) and its deformation is concentrated on the vicinity of the tear. After a complete tear formation and delamination of the functional layer, it is decoupled from the support grid and its fiber orientation is not influenced by the last tensile steps.
Comparison SFF 3, which has a complex structure with a relatively thick functional layer and fine fibers, shows a drop in stress around ϵ = 6%. This drop in stress is caused by a tearing of the inner functional layer (layer 2) with fine fibers and low porosity. At that point the outer functional layer (layer 1), with thicker fibers and higher porosity, is still intact. Because of this, the initial damage that occurs in layer 2 cannot be observed from the surface. The functional layer of SFF 100, which has the thickest fibers and highest porosity observed, fails at higher strains than the functional layers of SFF 3. The fibers of a functional layer with fine fibers and relatively low porosity have many connections, whereas the number of connections for thicker fibers and higher porosity is lower. As a result the functional layer of SFF 3 is stiffer than the one of SFF 100 and fails at lower strains. While the functional layer of SFF 100 fails, the fibers are rotating into the direction of loading. Here the fiber rotation is concentrated to the vicinity of the tear. As the functional layer of SFF 100 is thin in relation to the total thickness of the sintered fiber felt, it bears only a small portion of the applied load. Consequently, its failure is merely reflected by a decreasing slope in the stress-strain curve. In contrast, a drop in stress is observed in the stress-strain curve when the functional layers of SFF 3 start to fail. Which demonstrates that the functional layers of SFF 3 bear a significant part of the applied load.
5. Conclusions
The combination of tensile tests and computed tomography allows observation of the damage process and structural changes in sintered fiber felts with a high spatial resolution. It is possible to detect damage in the inner layers of a sintered fiber felt, which cannot be seen from the surface, and correlate the damage to certain features in the stress-strain curve. The application of a line segmentation technique to images extracted from the CT scans, makes it possible to detect fiber rotation in the functional layer of sintered fiber felts. For SFF 3, which has fine fibers, low porosity and a thick functional layer in relation to the total thickness of the sintered fiber felt, the functional layer has a significant influence on the mechanical strength at small strains. For SFF 100, which has a relatively thin functional layer, thicker fibers and higher porosity, the functional layer has no considerable effect on the mechanical strength. At high strains, only the support grid is bearing the mechanical load while the functional layer has already failed completely. Therefore, the functional range for aeroacoustic applications of sintered fiber felts is limited to strains lower than the failure strain of the functional layer, which depends on the material structure.
Acknowledgments
Financial support of the Deutsche Forschungsgemeinschaft in the frame of the SFB 880-Fundamentals of High-Lift for Future Commercial Aircraft is greatly appreciated.
Author Contributions
Nicolas Lippitz and Joachim Rösler conceived and designed the experiments; Nicolas Lippitz performed the experiments and analyzed the data; Nicolas Lippitz and Joachin Rösler wrote the paper.
Conflicts of Interest
The authors declare no conflict of interest.
References
- Haines, M.M.; Stansfeld, S.A.; Job, R.F.S.; Berglund, B.; Head, J. Chronic aircraft noise exposure, stress responses, mental health and cognitive performance in school children. Psychol. Med. 2001, 31, 265–277. [Google Scholar]
- Franssen, E.A.M.; van Wiechen, C.M.A.G.; Nagelkerke, N.J.D.; Lebert, E. Aircraft noise around a large international airport and its impact on general health and medication use. Occup. Environ. Med. 2004, 61, 405–413. [Google Scholar]
- Revell, J.; Revell, J.; Kuntz, H.; Balena, F.; Horne, C.; Storms, B.; Dougherty, R.; Kuntz, H.; Balena, F.; Horne, C.; et al. Trailing-edge flap noise reduction by porous acoustic treatment. In Aeroacoustics Conferences; American Institute of Aeronautics and Astronautics: Reston, VA, USA, 1997. [Google Scholar]
- Herr, M.; Dobrinsky, W. Experimental investigation in low-noise trailing edge design. AIAA J 2005, 43, 1167–1175. [Google Scholar]
- Herr, M. Design criteria for low-noise trailing-edges. In Aeroacoustics Conferences; American Institute of Aeronautics and Astronautics: Reston, VA, USA, 2007. [Google Scholar]
- Delfs, J.; Faßmann, B.; Lippitz, N.; Lummer, M.; Mößner, M.; Müller, L.; Rurkowska, K.; Uphoff, S. SFB 880: Aeroacoustic research for low noise take-off and landing. CEAS Aeronaut. J 2014, 5, 1–15. [Google Scholar]
- Herr, M.; Rossignol, K.S.; Delfs, J.; Lippitz, N.; Mößner, M. Specification of porous materials for low-noise trailing-edge applications. In AIAA Aviation; American Institute of Aeronautics and Astronautics: Reston, VA, USA, 2014. [Google Scholar]
- Salvo, L.; Cloetens, P.; Maire, E.; Zabler, S.; Blandin, J.; Buffière, J.; Ludwig, W.; Boller, E.; Bellet, D.; Josserond, C. X-ray micro-tomography an attractive characterisation technique in materials science. In Nuclear Instruments and Methods in Physics Research Section B: Beam Interactions with Materials and Atoms; Elsevier: Amsterdam, The Netherlands, 2003; Volume 200, pp. 273–286. [Google Scholar]
- Clyne, T.; Markaki, A.; Tan, J. Mechanical and magnetic properties of metal fibre networks, with and without a polymeric matrix. Compos. Sci. Technol. 2005, 65, 2492–2499. [Google Scholar]
- Adrien, J.; Maire, E.; Gimenez, N.; Sauvant-Moynot, V. Experimental study of the compression behaviour of syntactic foams by in situ X-ray tomography. Acta Mater. 2007, 55, 1667–1679. [Google Scholar]
- Tsarouchas, D.; Markaki, A. Extraction of fibre network architecture by X-ray tomography and prediction of elastic properties using an affine analytical model. Acta Mater. 2011, 59, 6989–7002. [Google Scholar]
- Maire, E.; Zhou, S.; Adrien, J.; Dimichiel, M. Damage quantification in aluminium alloys using in situ tensile tests in X-ray tomography. Eng. Fract. Mech. 2011, 78, 2679–2690. [Google Scholar]
- Neelakantan, S.; Bosbach, W.; Woodhouse, J.; Markaki, A. Characterization and deformation response of orthotropic fibre networks with auxetic out-of-plane behaviour. Acta Mater. 2014, 66, 326–339. [Google Scholar]
- Rösler, J.; Näth, O. Mechanical behaviour of nanoporous superalloy membranes. Acta Mater. 2010, 58, 1815–1828. [Google Scholar]
- Hinze, B.; Rösler, J.; Schmitz, F. Production of nanoporous superalloy membranes by load-free coarsening of γ’-precipitates. Acta Mater. 2011, 59, 3049–3060. [Google Scholar]
- Hinze, B.; Rösler, J.; Lippitz, N. Noise reduction potential of cellular metals. Metals 2012, 2, 195–201. [Google Scholar]
- Lippitz, N.; Rösler, J.; Hinze, B. Potential of metal fibre felts as passive absorbers in absorption silencers. Metals 2013, 3, 150–158. [Google Scholar]
- Lippitz, N.; Hinze, B.; Rösler, J. SFB 880-Fundamentals of High-Lift for Future Commercial Aircraft: Biennial Report; Technical University Campus Forschungsflughafen: Braunschweig, Germany, 2013; Chapter Characterization of Materials; pp. 29–39. [Google Scholar]
- Tan, J.C.; Elliot, J.A.; Clyne, T.W. Analysis of tomography images of bonded fibre networks to measure distributions of fibre segment length and fibre orientation. Adv. Eng. Mater. 2008, 8, 495–500. [Google Scholar]
Figure 1.
CT image of sintered fiber felts. (a) SFF 3; (b) SFF 100.
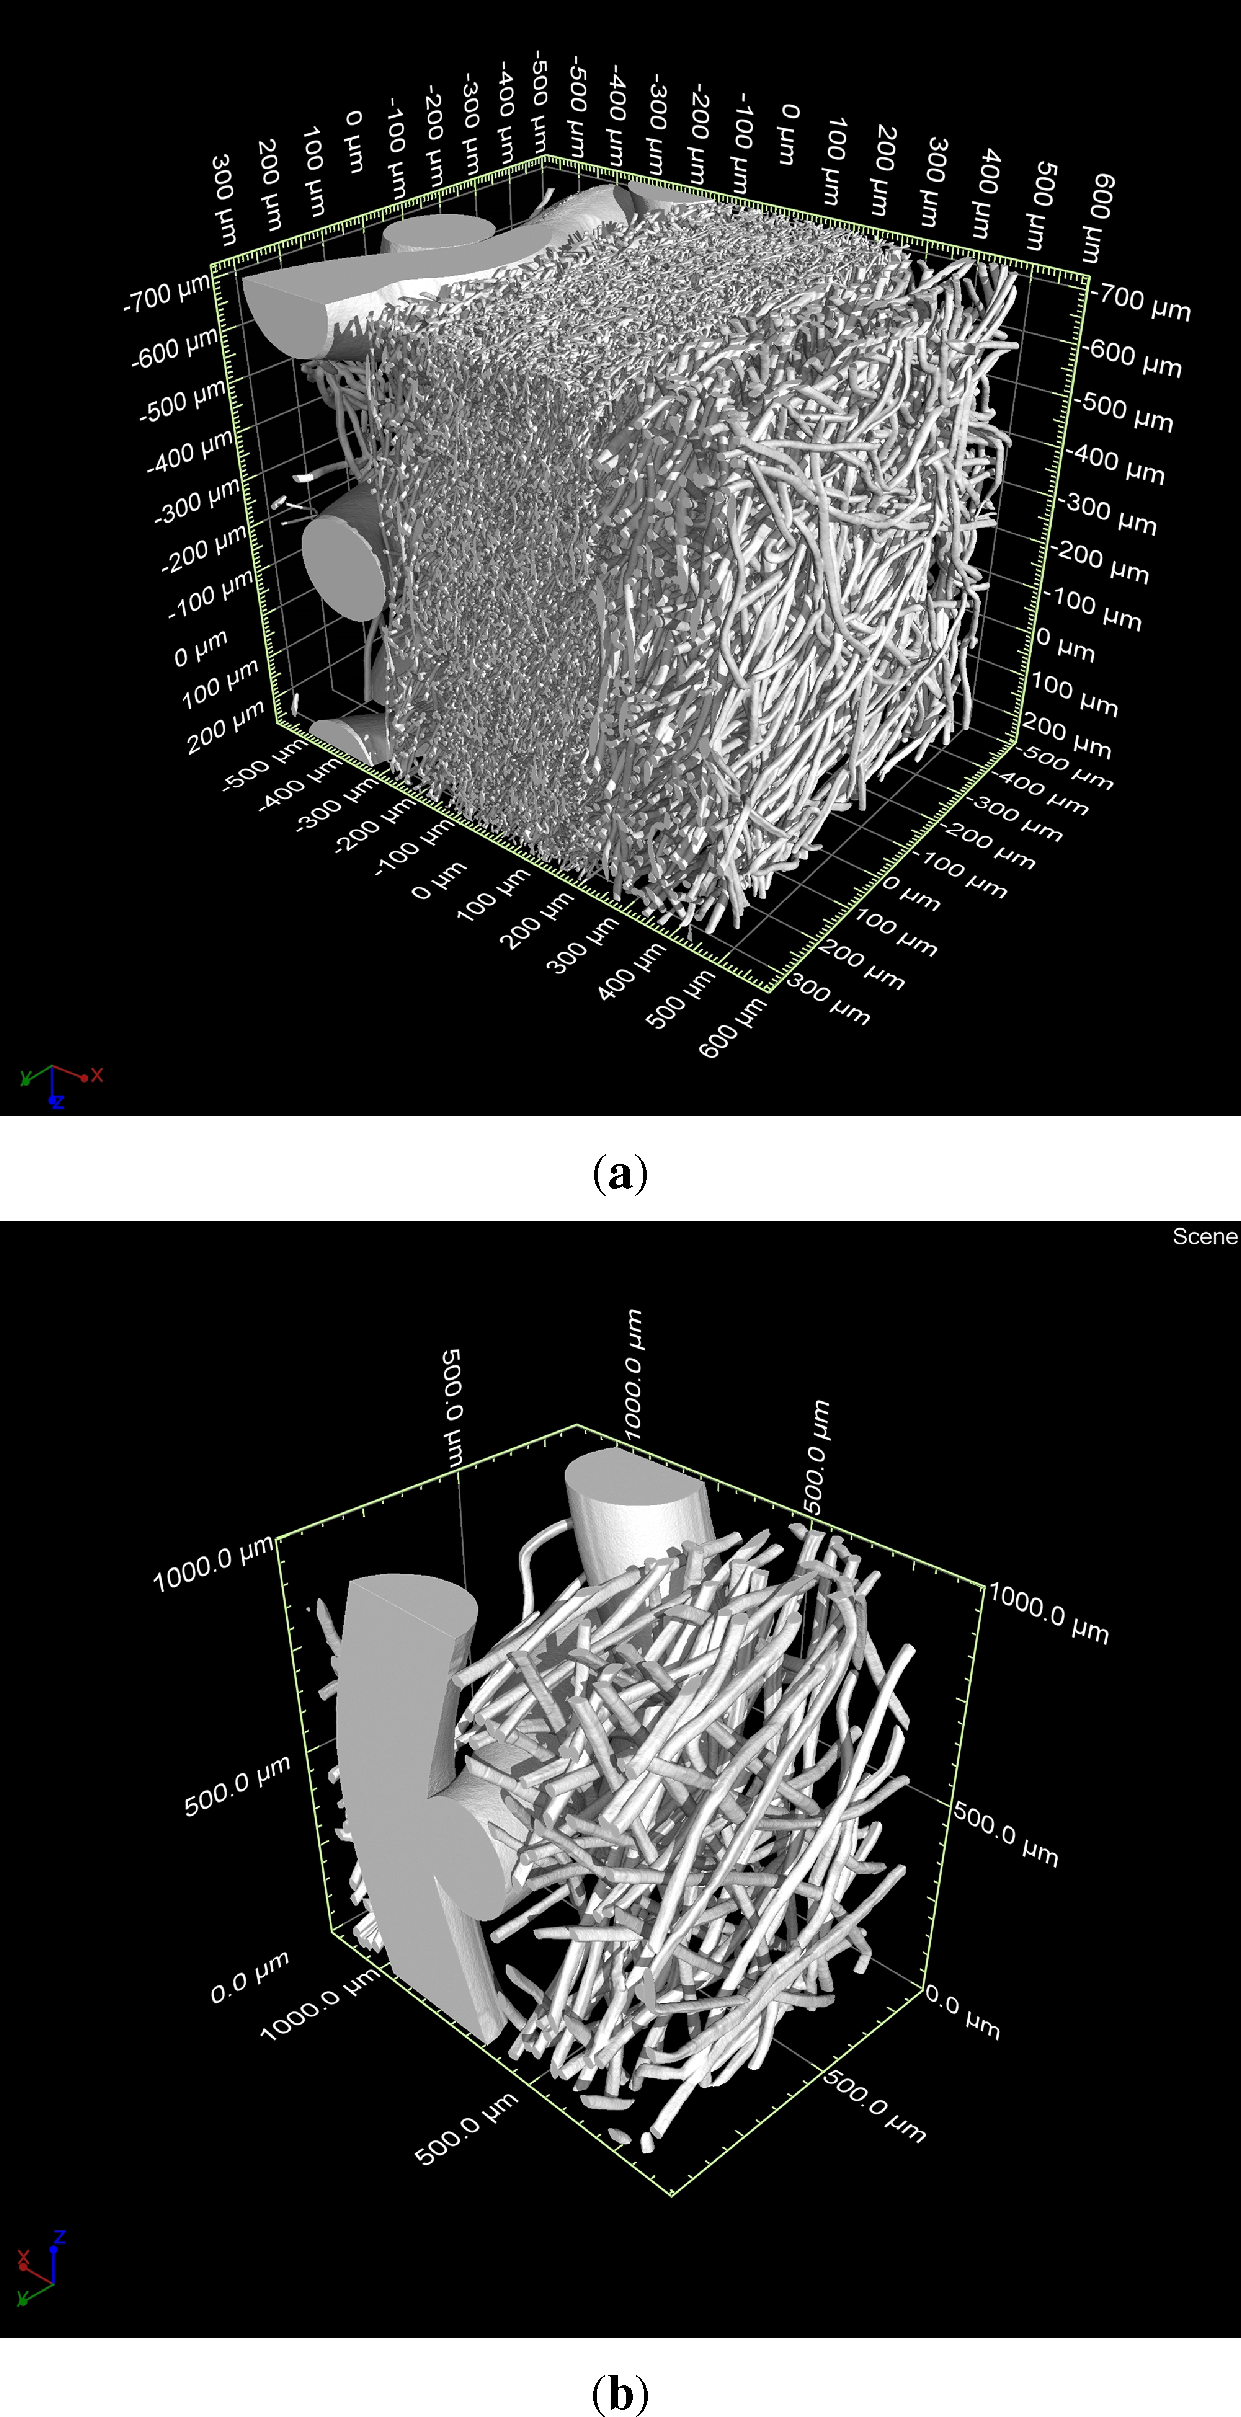
Figure 2.
Experimental setup. (a) sample in CT; (b) sample in tensile test machine.
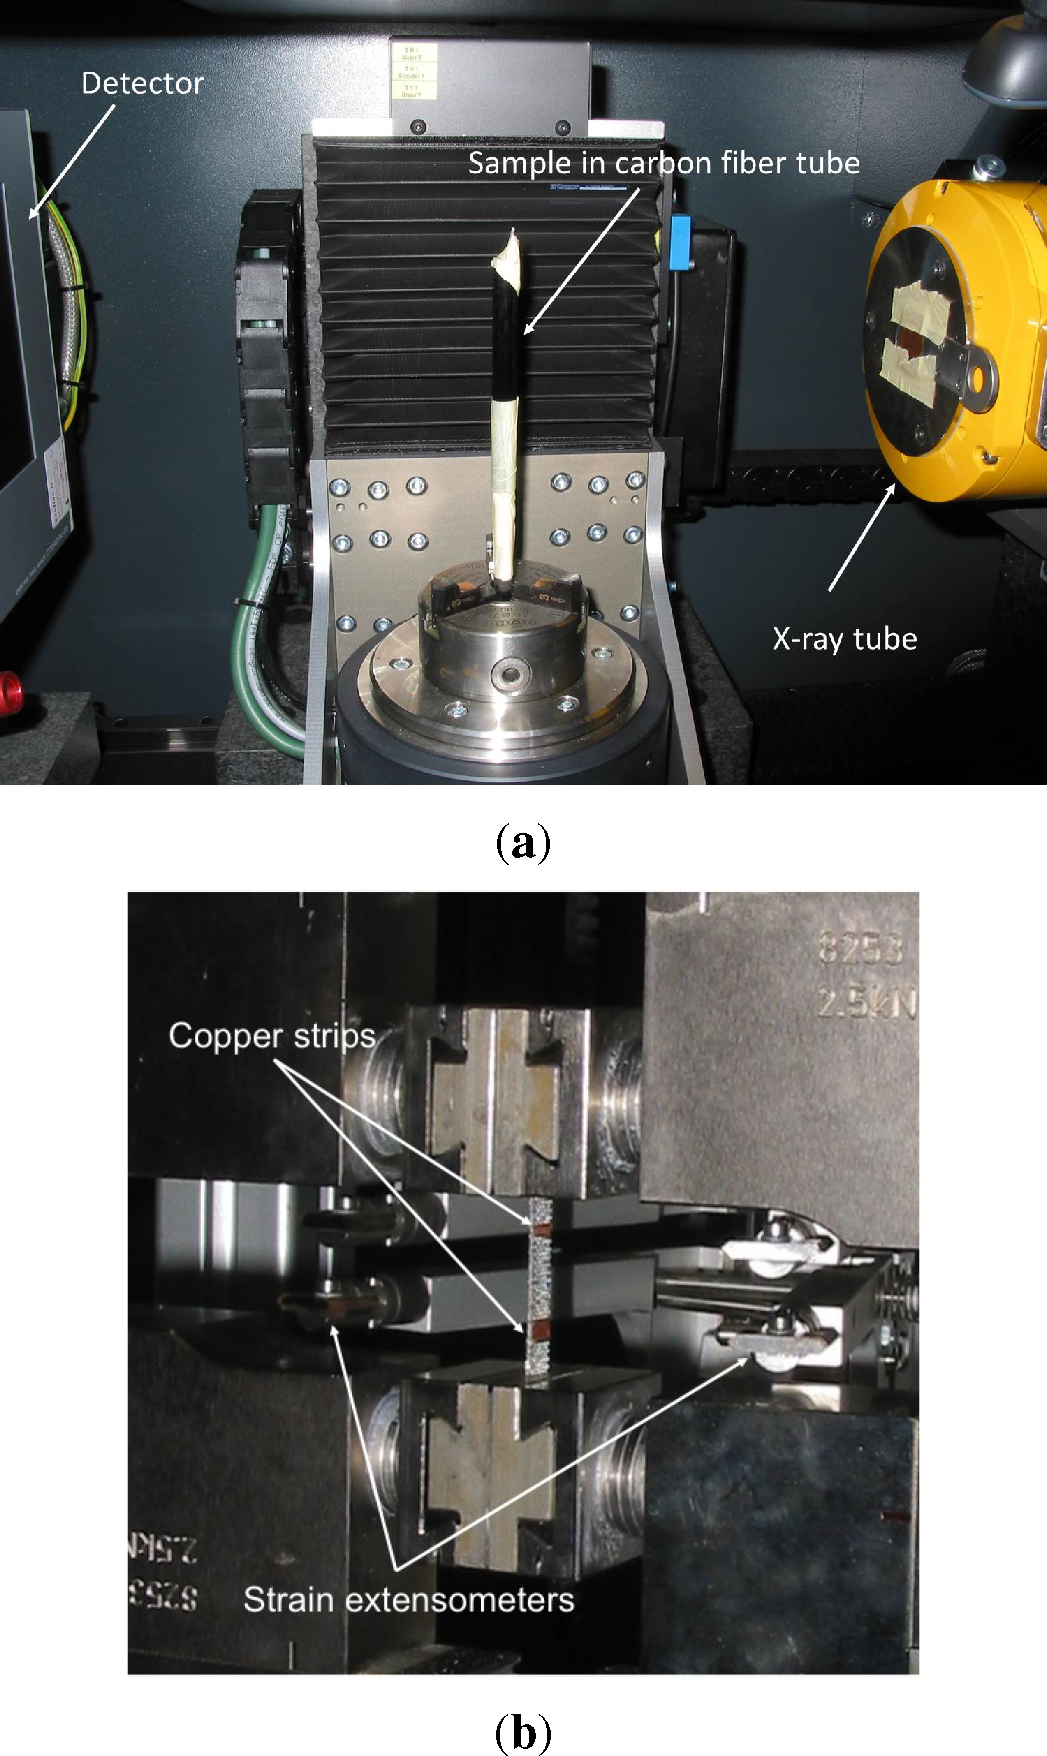
Figure 3.
Stress-strain curves of SFF 3 and SFF 100 after eight steps of tensile testing.
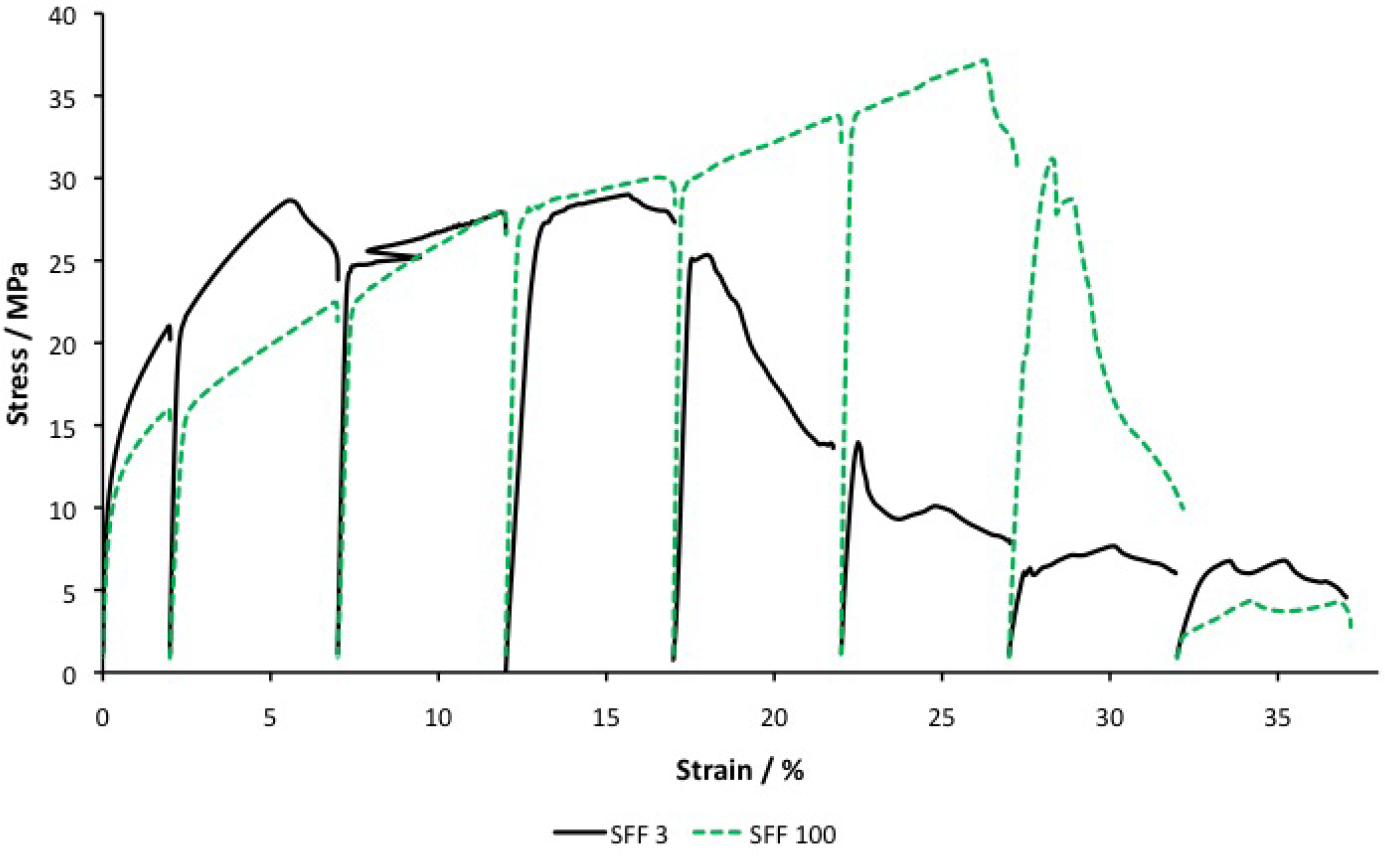
Figure 4.
CT images of the SFF 3 tensile test sample. (a) three dimensional view before tensile tests; (b) three dimensional view and sectional view of the y-z-plane oriented parallel to the direction of loading after ϵ = 7%; (c) sectional views of layer 1, 2 and 3 after ϵ = 7%; (d) three dimensional view after ϵ = 12%; (e) three dimensional view of the support grid after ϵ = 22%; (f) three dimensional view of the support grid after ϵ = 37%.
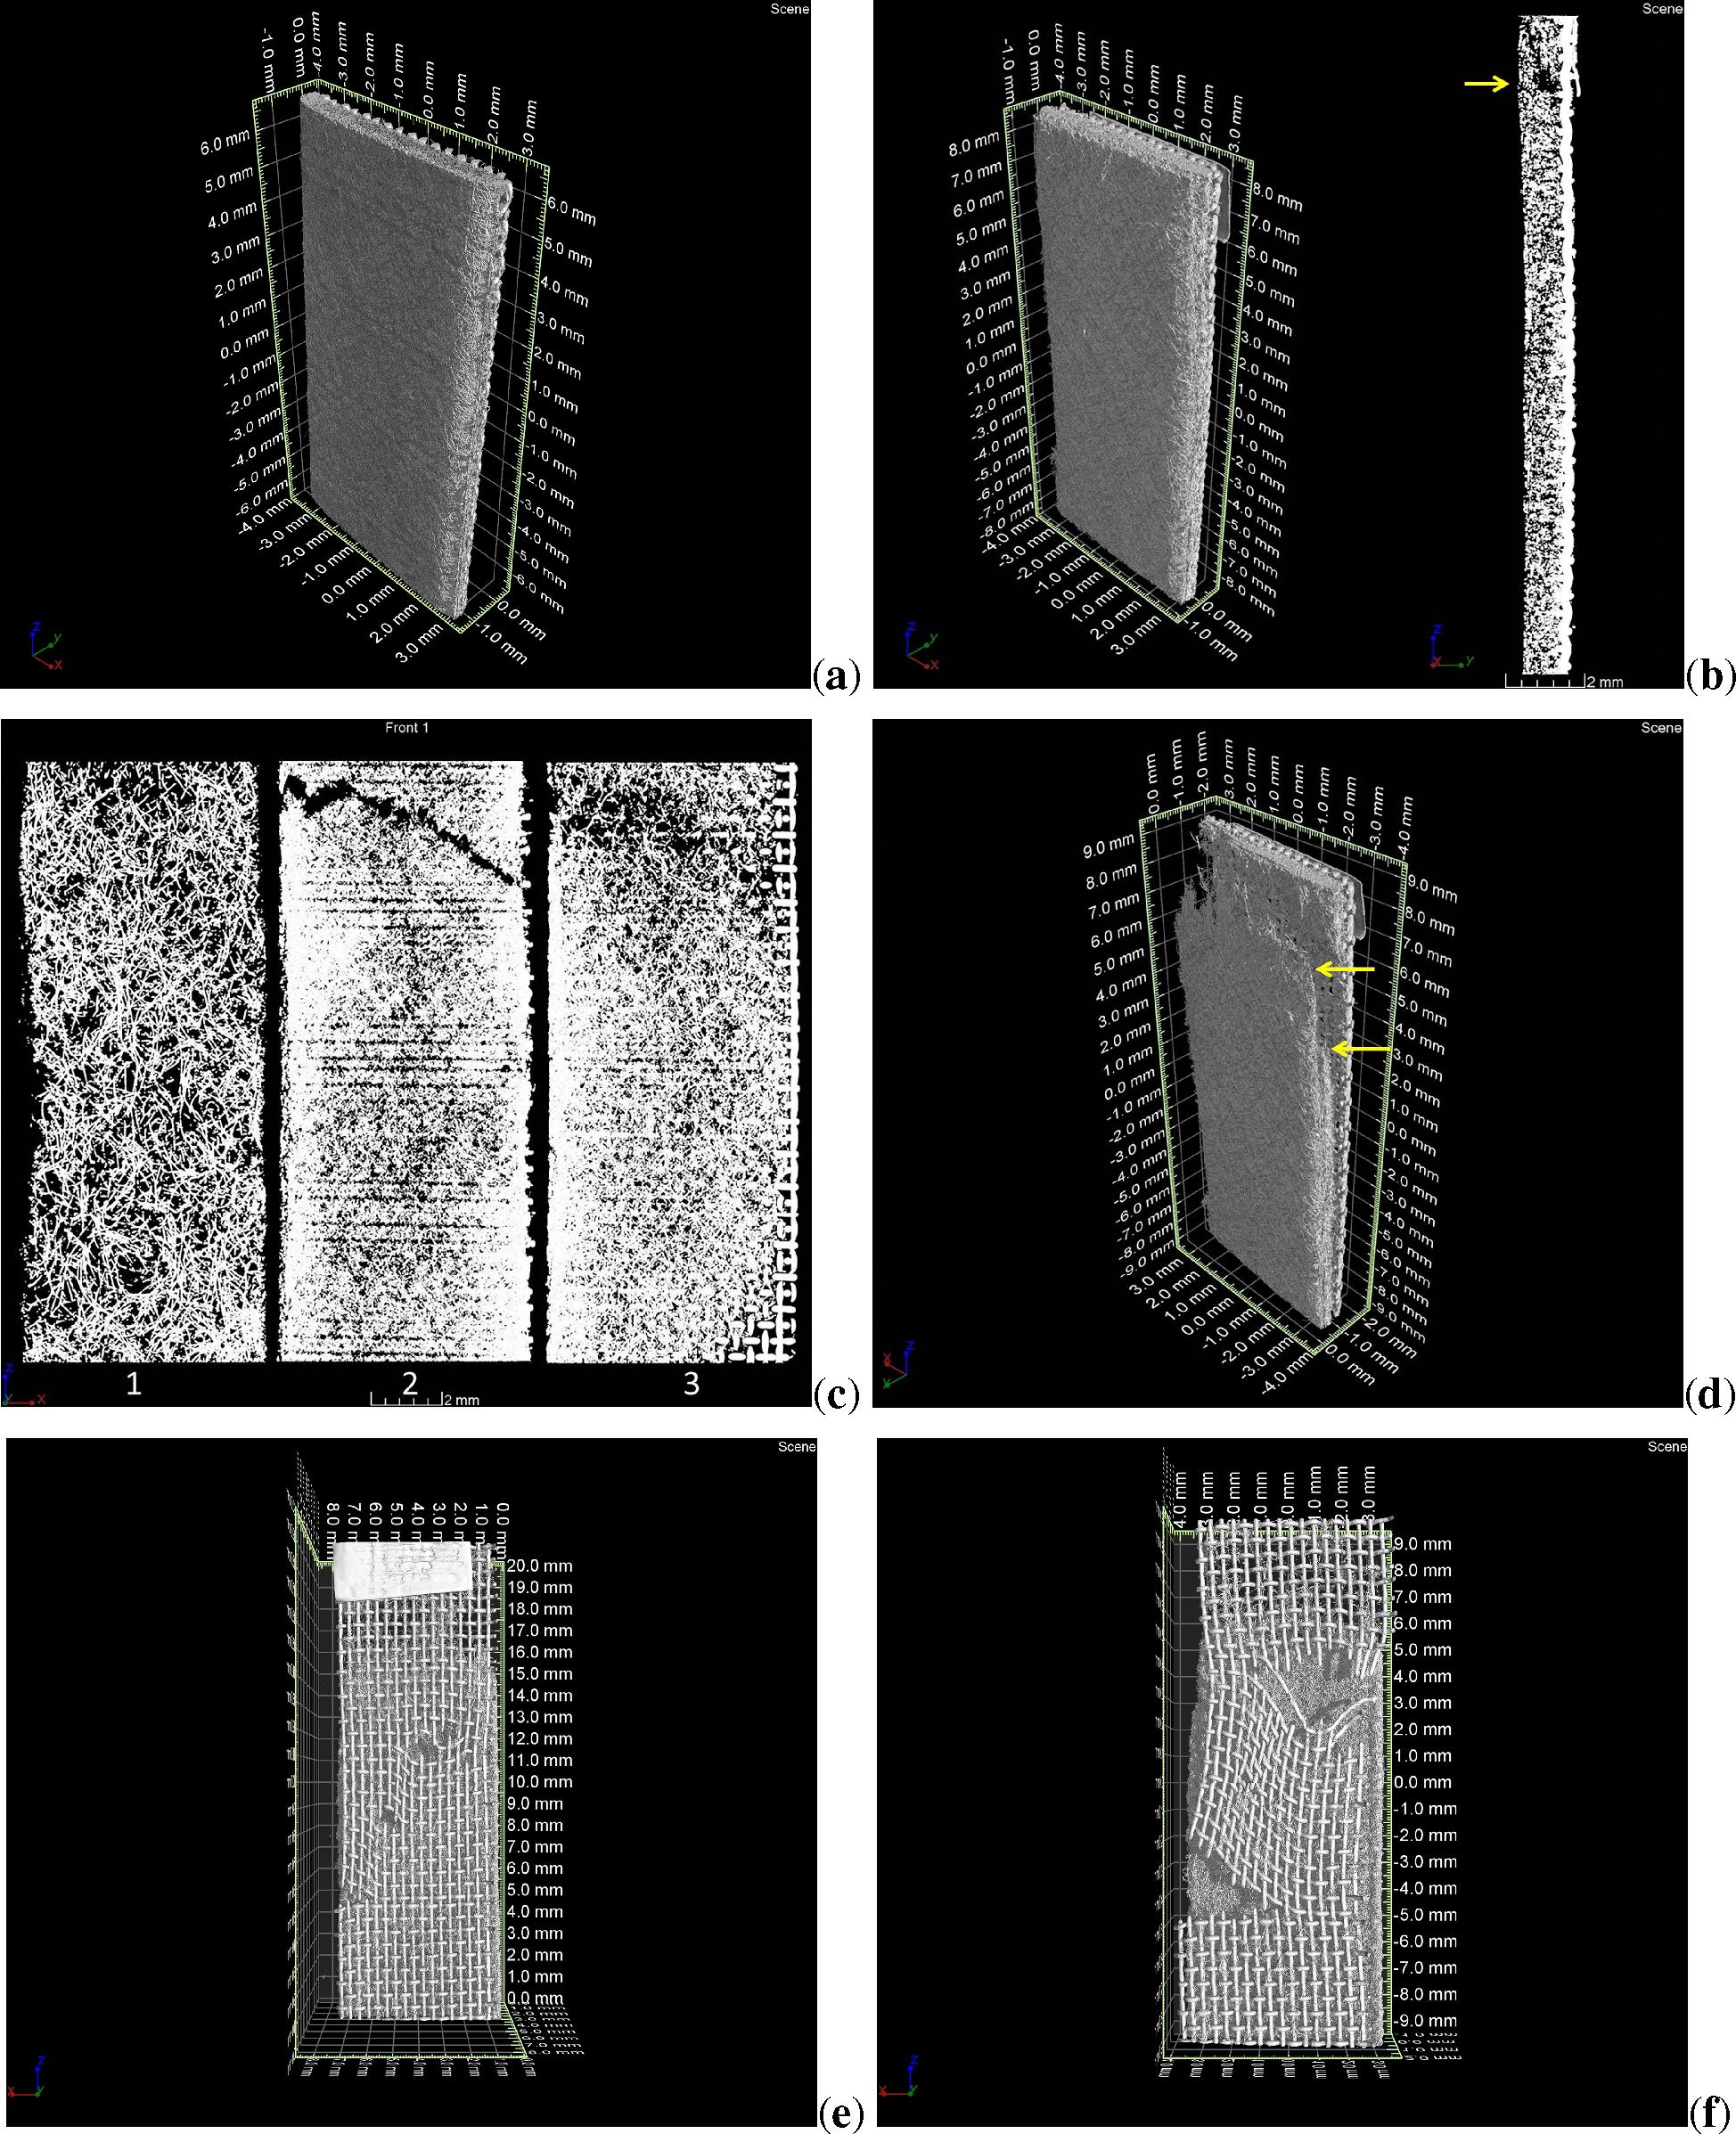
Figure 5.
CT images of the SFF 100 tensile test sample. (a) three dimensional view before tensile tests; (b) three dimensional view and sectional view of the y-z-plane oriented parallel to the direction of loading after ϵ = 17%; (c) three dimensional view after ϵ = 27%; (d) three dimensional view of the support grid after ϵ = 37%.
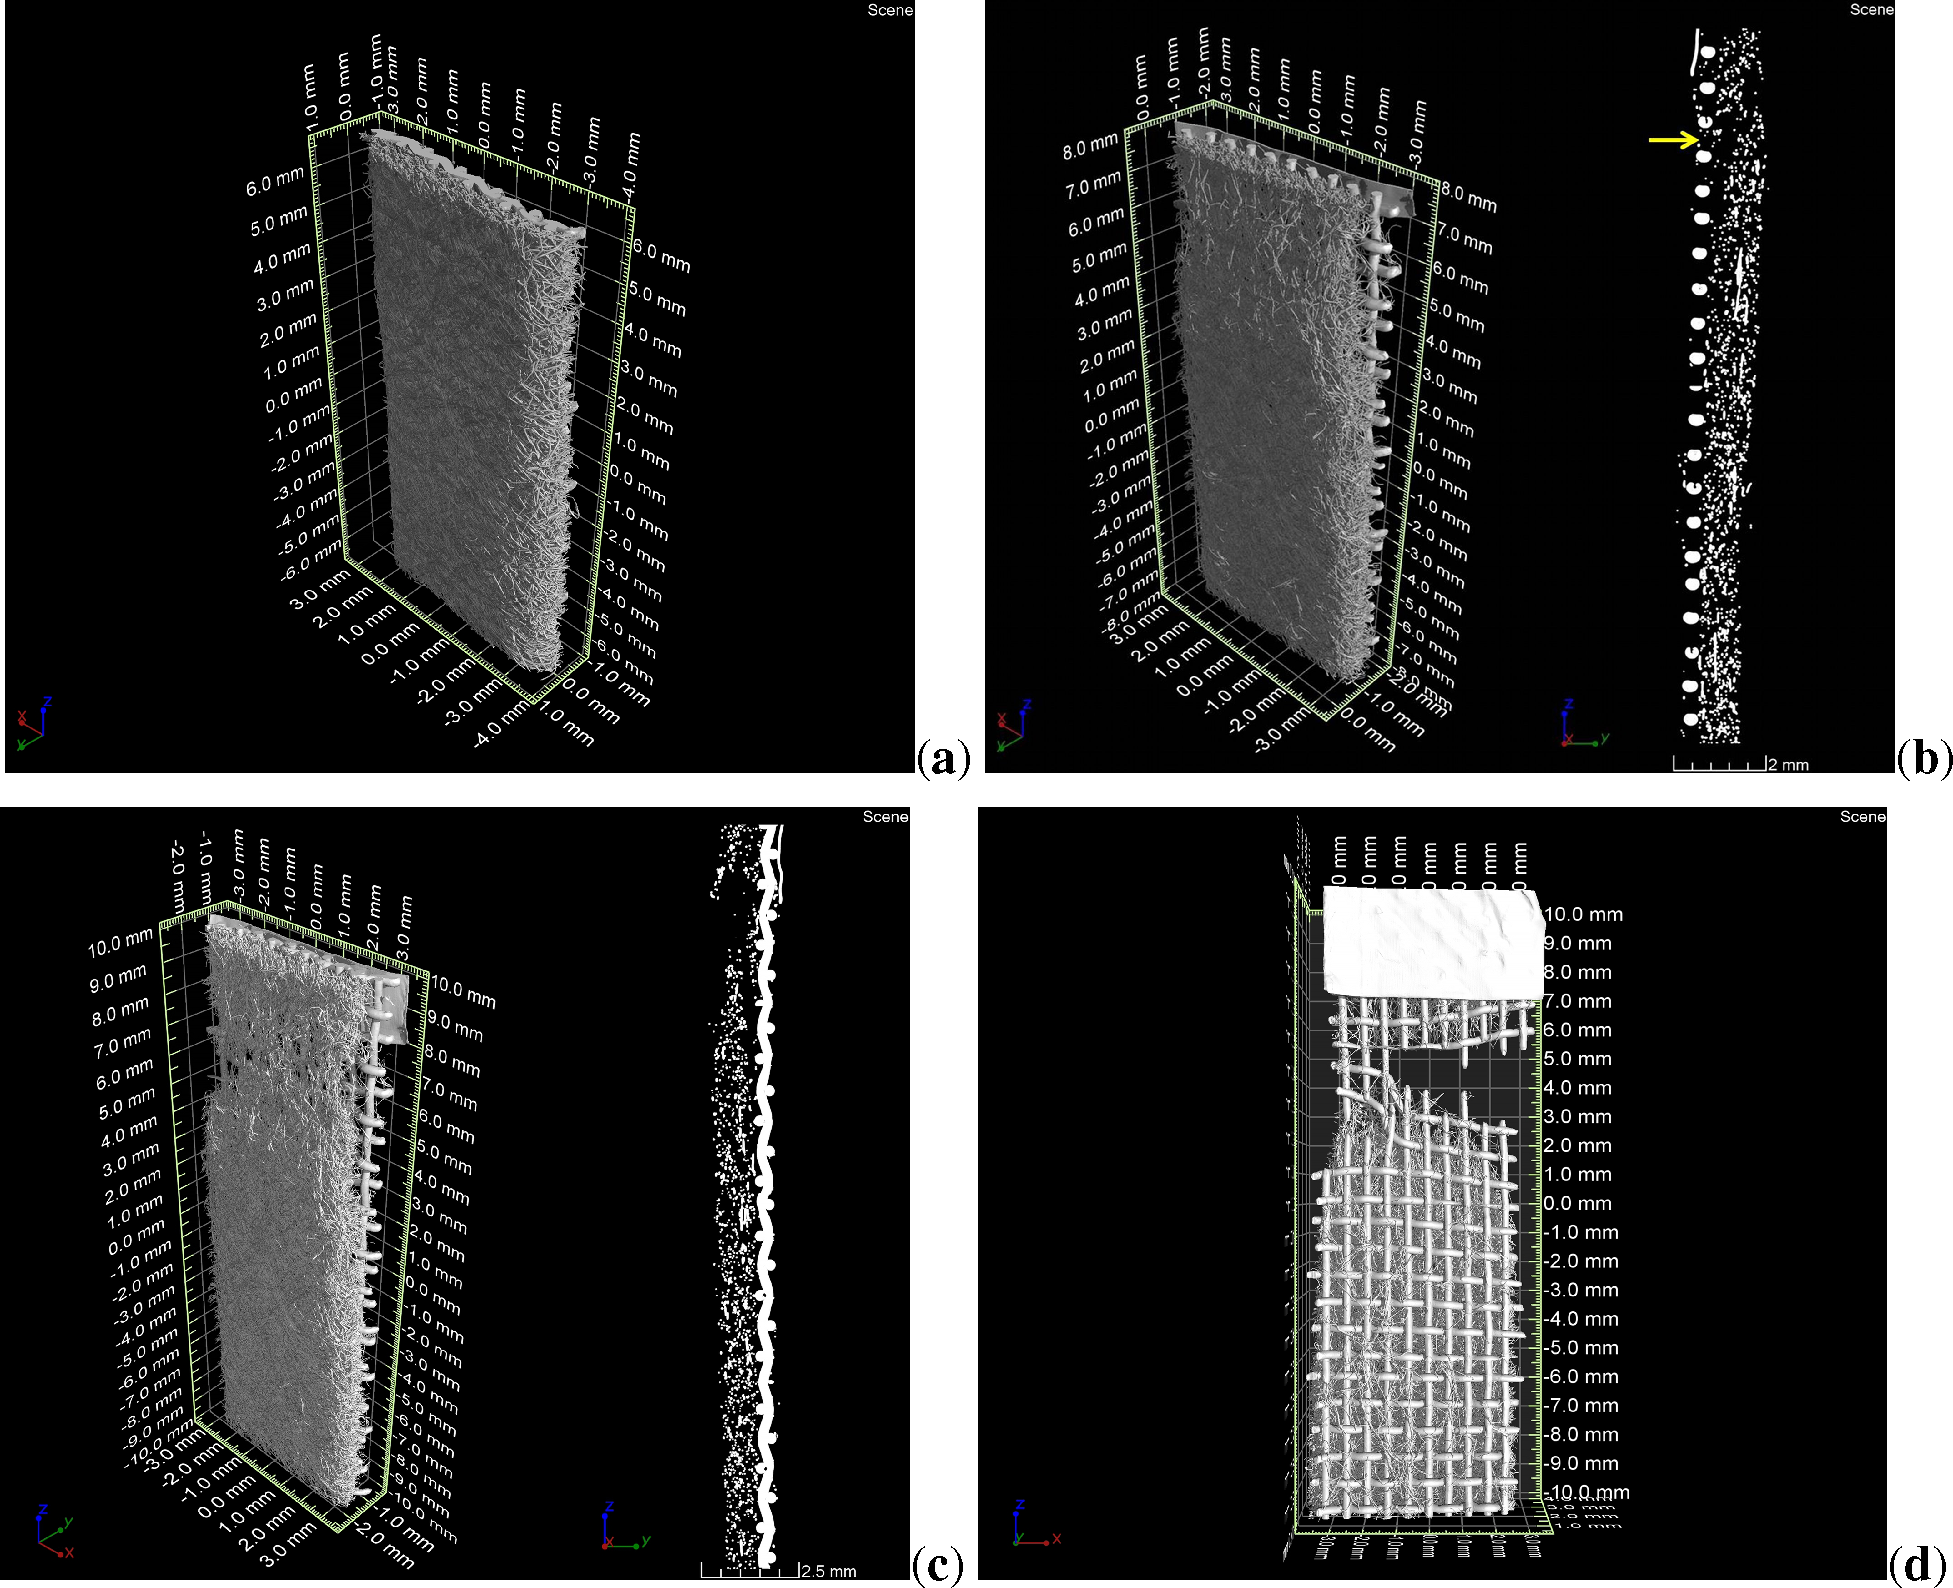
Figure 6.
(a) extracted planes of SFF 100 at ϵ = 0%; (b) structural ellipses of SFF 100 at ϵ = 0% and ϵ = 17%.
Figure 6.
(a) extracted planes of SFF 100 at ϵ = 0%; (b) structural ellipses of SFF 100 at ϵ = 0% and ϵ = 17%.

Table 1.
Material properties of sintered fiber felts (SFF), including porosity (ϕ), thickness of functional layer (di), fiber diameter of functional layers (Di) and diameter of the wires of the support grid (Dgrid); the layer designated as i = 1 corresponds to the outer layer which is not in contact with the support grid
| Material | Layer 1
| Layer 2
| Layer 3
| ||||||||
|---|---|---|---|---|---|---|---|---|---|---|---|
| ϕ1 | d1 | D1 | ϕ2 | d2 | D2 | ϕ3 | d3 | D3 | ϕtotal | Dgrid | |
| (%) | (µm) | (µm) | (%) | (µm) | (µm) | (%) | (µm) | (µm) | (%) | (µm) | |
| SFF 3 | 85 ± 24 | 260 | 14 ± 2 | 78 ± 62 | 340 | 5 ± 2 | 83 ± 42 | 140 | 8 ± 2 | 81 ± 36 | 174 ± 8 |
| SFF 100 | 92 ± 15 | 430 | 25 ± 2 | – | – | – | – | – | – | – | 253 ± 8 |
| Section | ϵ = 0% | ϵ = 2% | ϵ = 7% | ϵ = 12% | ϵ = 17% | ϵ = 22% | ϵ = 27% | ϵ = 32% | ϵ = 37% |
|---|---|---|---|---|---|---|---|---|---|
| A | 1,138 | 1,087 | 1,151 | 1,204 | 1,272 | 1,241 | 1,260 | 1,272 | 1,262 |
| B | 1,099 | 1,085 | 1,155 | 1,166 | 1,148 | 1,160 | 1,149 | 1,150 | 1,163 |
© 2015 by the authors; licensee MDPI, Basel, Switzerland This article is an open access article distributed under the terms and conditions of the Creative Commons Attribution license (http://creativecommons.org/licenses/by/4.0/).
Share and Cite
MDPI and ACS Style
Lippitz, N.; Rösler, J. Damage Behavior of Sintered Fiber Felts. Metals 2015, 5, 591-602. https://doi.org/10.3390/met5020591
AMA Style
Lippitz N, Rösler J. Damage Behavior of Sintered Fiber Felts. Metals. 2015; 5(2):591-602. https://doi.org/10.3390/met5020591
Chicago/Turabian StyleLippitz, Nicolas, and Joachim Rösler. 2015. "Damage Behavior of Sintered Fiber Felts" Metals 5, no. 2: 591-602. https://doi.org/10.3390/met5020591