1. Introduction
One of the important indices that accounts for the quality of cast iron is its chilling tendency, that is its tendency to solidify according to the Fe-C-X metastable system. The chilling tendency, CT, depends on the physical-chemical state of the liquid iron, while the chill (the fraction of eutectic cementite in the casting) formation depends additionally on the casting cooling rate. In foundry practice, the CT for the various types of cast iron is determined from comparisons of the exhibited fraction of eutectic cementite (chill) in castings solidified under similar cooling rates. Based only on these comparisons, the difference in the chilling tendency for various cast irons can be established, but the absolute CT values for given irons cannot be disclosed [
1].
It is well known that the chilling tendency of cast irons determines their subsequent performance in diverse applications. In particular, cast irons possessing a high CT tend to develop zones of white or mottled iron. Considering that these regions can be extremely hard, their machinability can be severely impaired. Alternatively, if white iron is the desired structure, a relatively small chilling tendency will favor the formation of gray iron. This, in turn, leads to low hardness and poor wear properties in as-cast components. Hence, considerable efforts [
1,
2,
3,
4,
5,
6,
7] have been made to correlate the inoculation practice, iron composition, pouring temperature,
etc., with the cast iron CT.
In the published literature, there are only a few attempts aimed at elucidating the mechanisms responsible for the chill of cast iron [
3,
8,
9,
10,
11]. Besides, none of the proposed hypotheses take into account the complexity of the solidification process. In most cases, the proposed theories assume that a single factor is the determinant in establishing the final solidification structure, while the remaining factors are ignored. In addition, various numerical models have been proposed [
12,
13] to predict whether a given casting or a part of it will solidify according to the stable or metastable Fe-C-X system. Yet, their application is tedious due to extensive numerical calculations. Accordingly, in this work, a simple analytical model is employed to account for the mechanism or mechanisms responsible for the CT of cast iron and, hence, the exhibited chill.
1.1. Analysis
During cast iron solidification, two processes become relevant: (a) nucleation; and (b) growth of eutectic cells, which have a direct effect on the final microstructure.
- (a)
Nucleation of eutectic cells
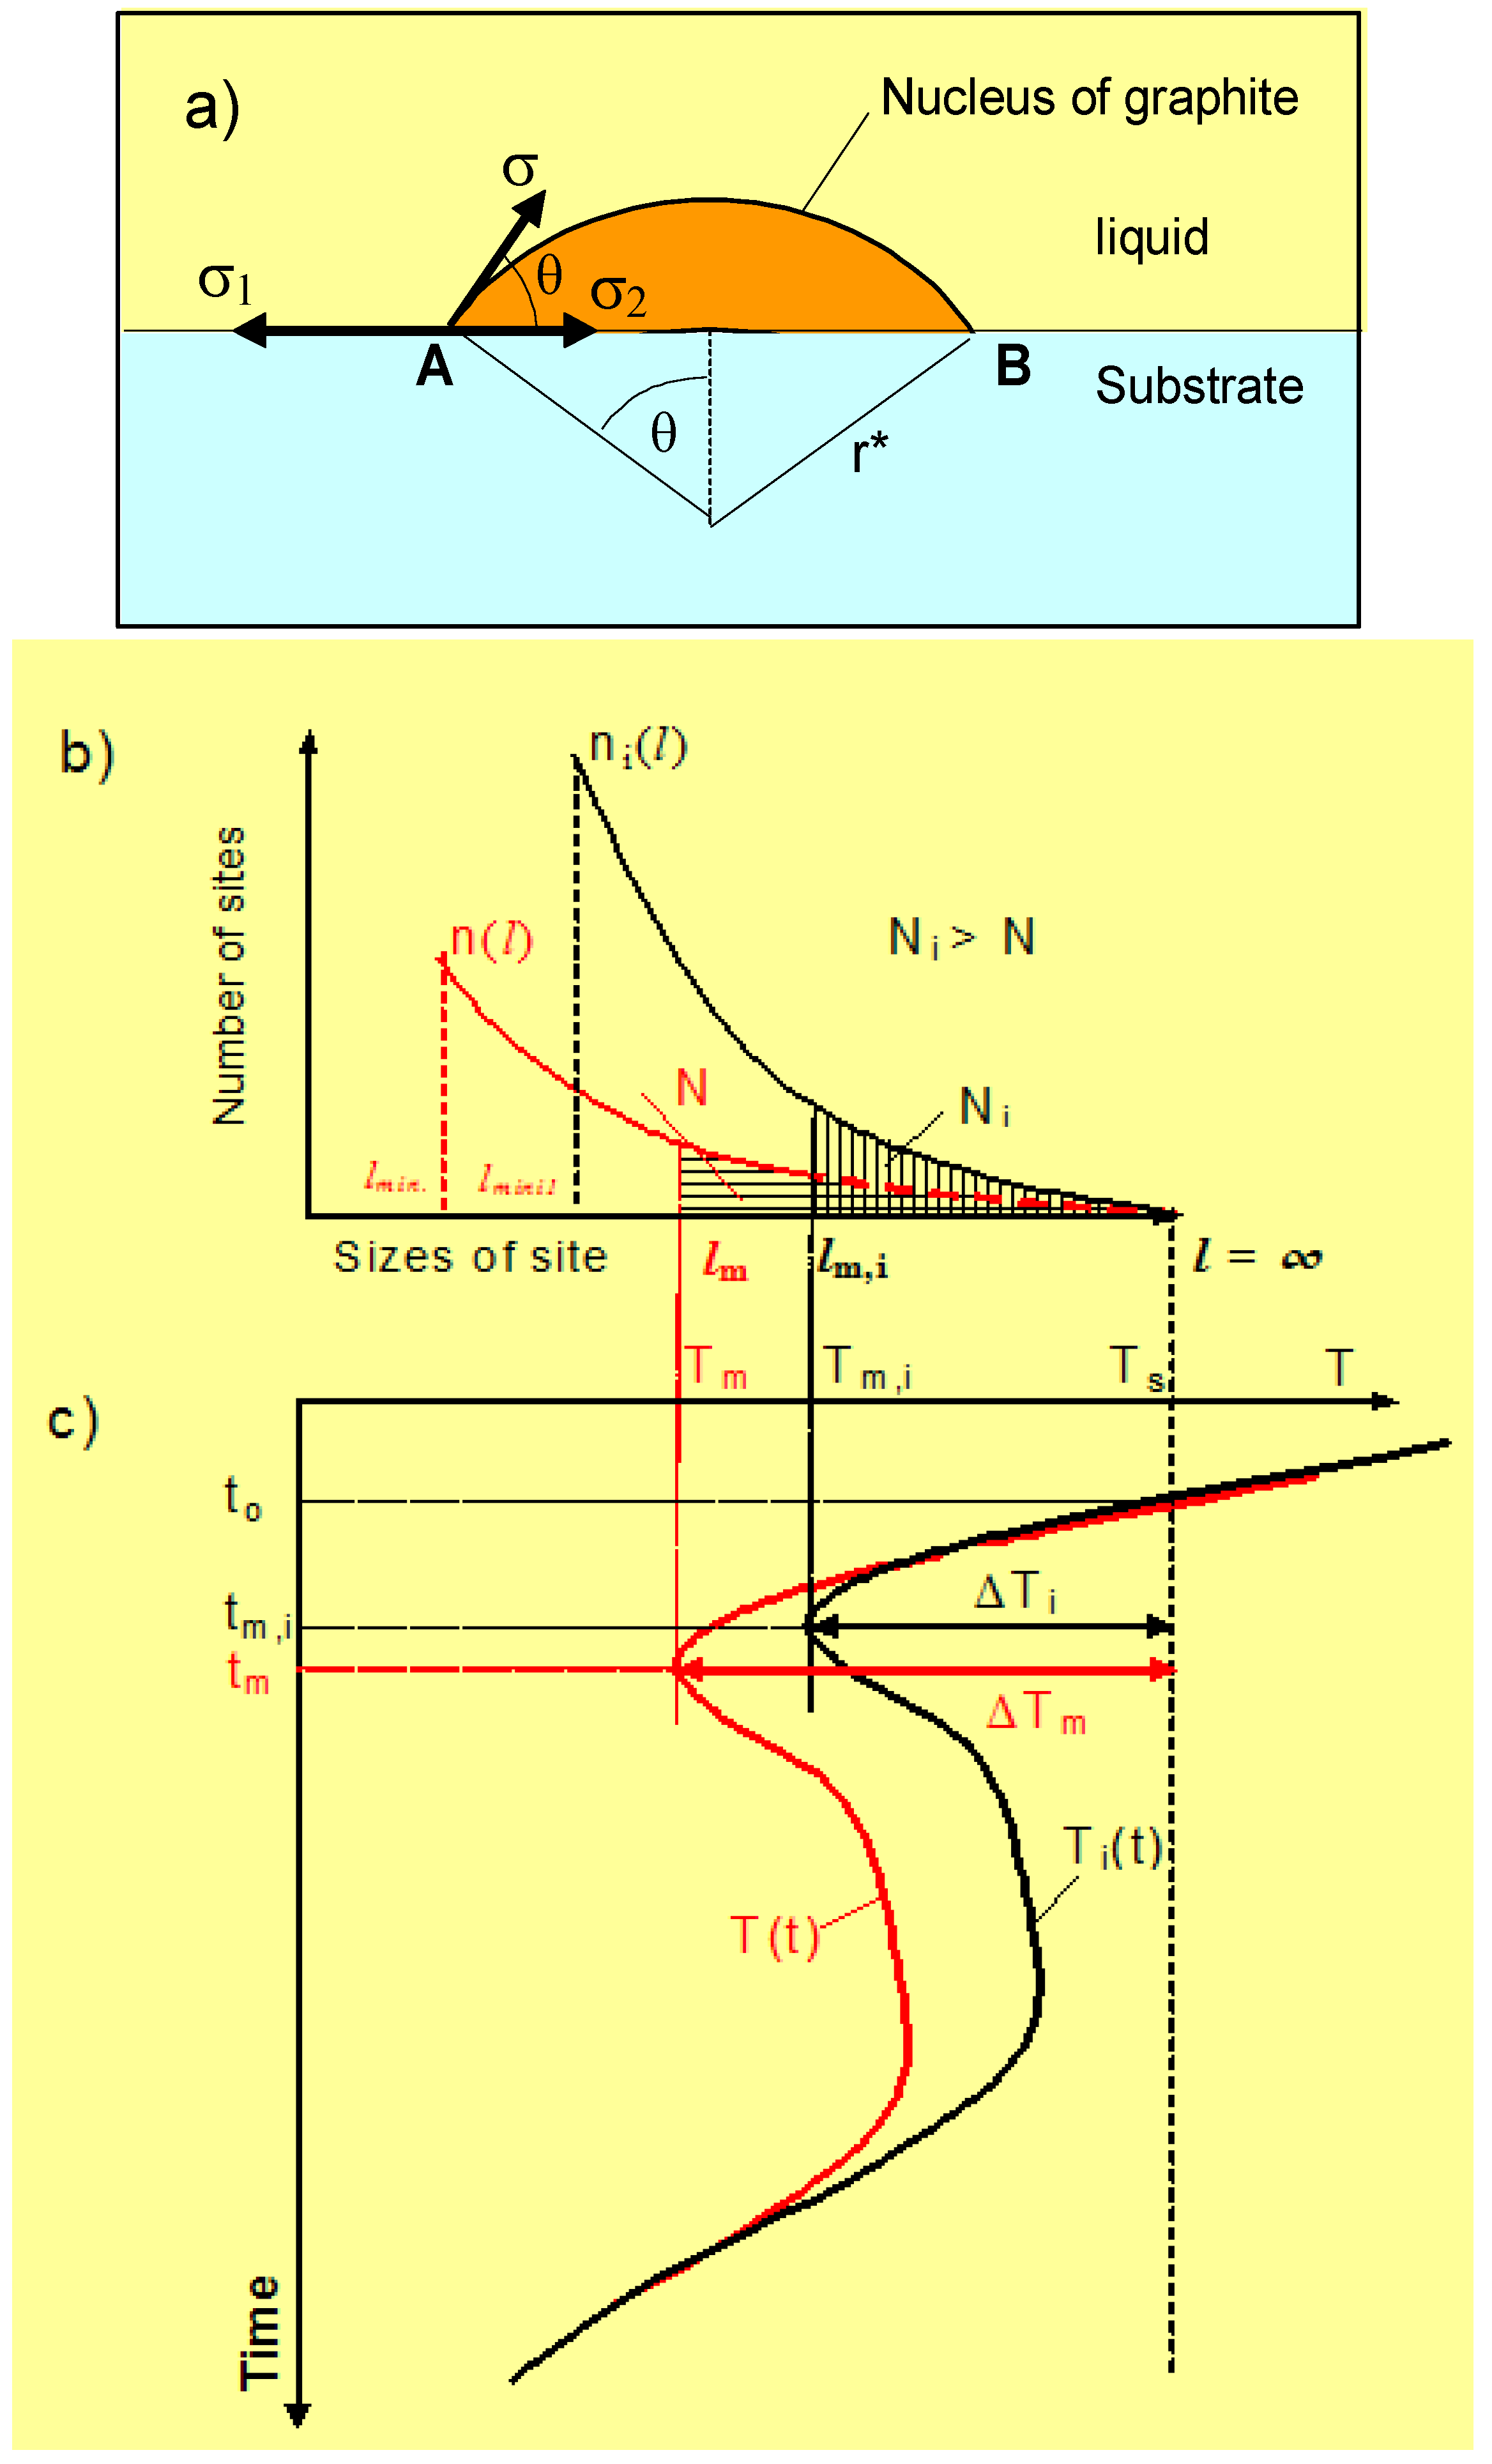
In liquid-solid transformations, nucleation is heterogeneous in nature. Accordingly, a simple model for heterogeneous nucleation of graphite in cast iron has recently been proposed [
14], which describes the nucleation of eutectic cells, N, by the following expression:
and
where
Ns and
b are the nucleation coefficients, ∆
Tm is the maximum degree of undercooling at the onset of graphite eutectic solidification,
Ts is the graphite eutectic equilibrium temperature and
Tm is the minimal temperature at the onset of graphite eutectic solidification (see
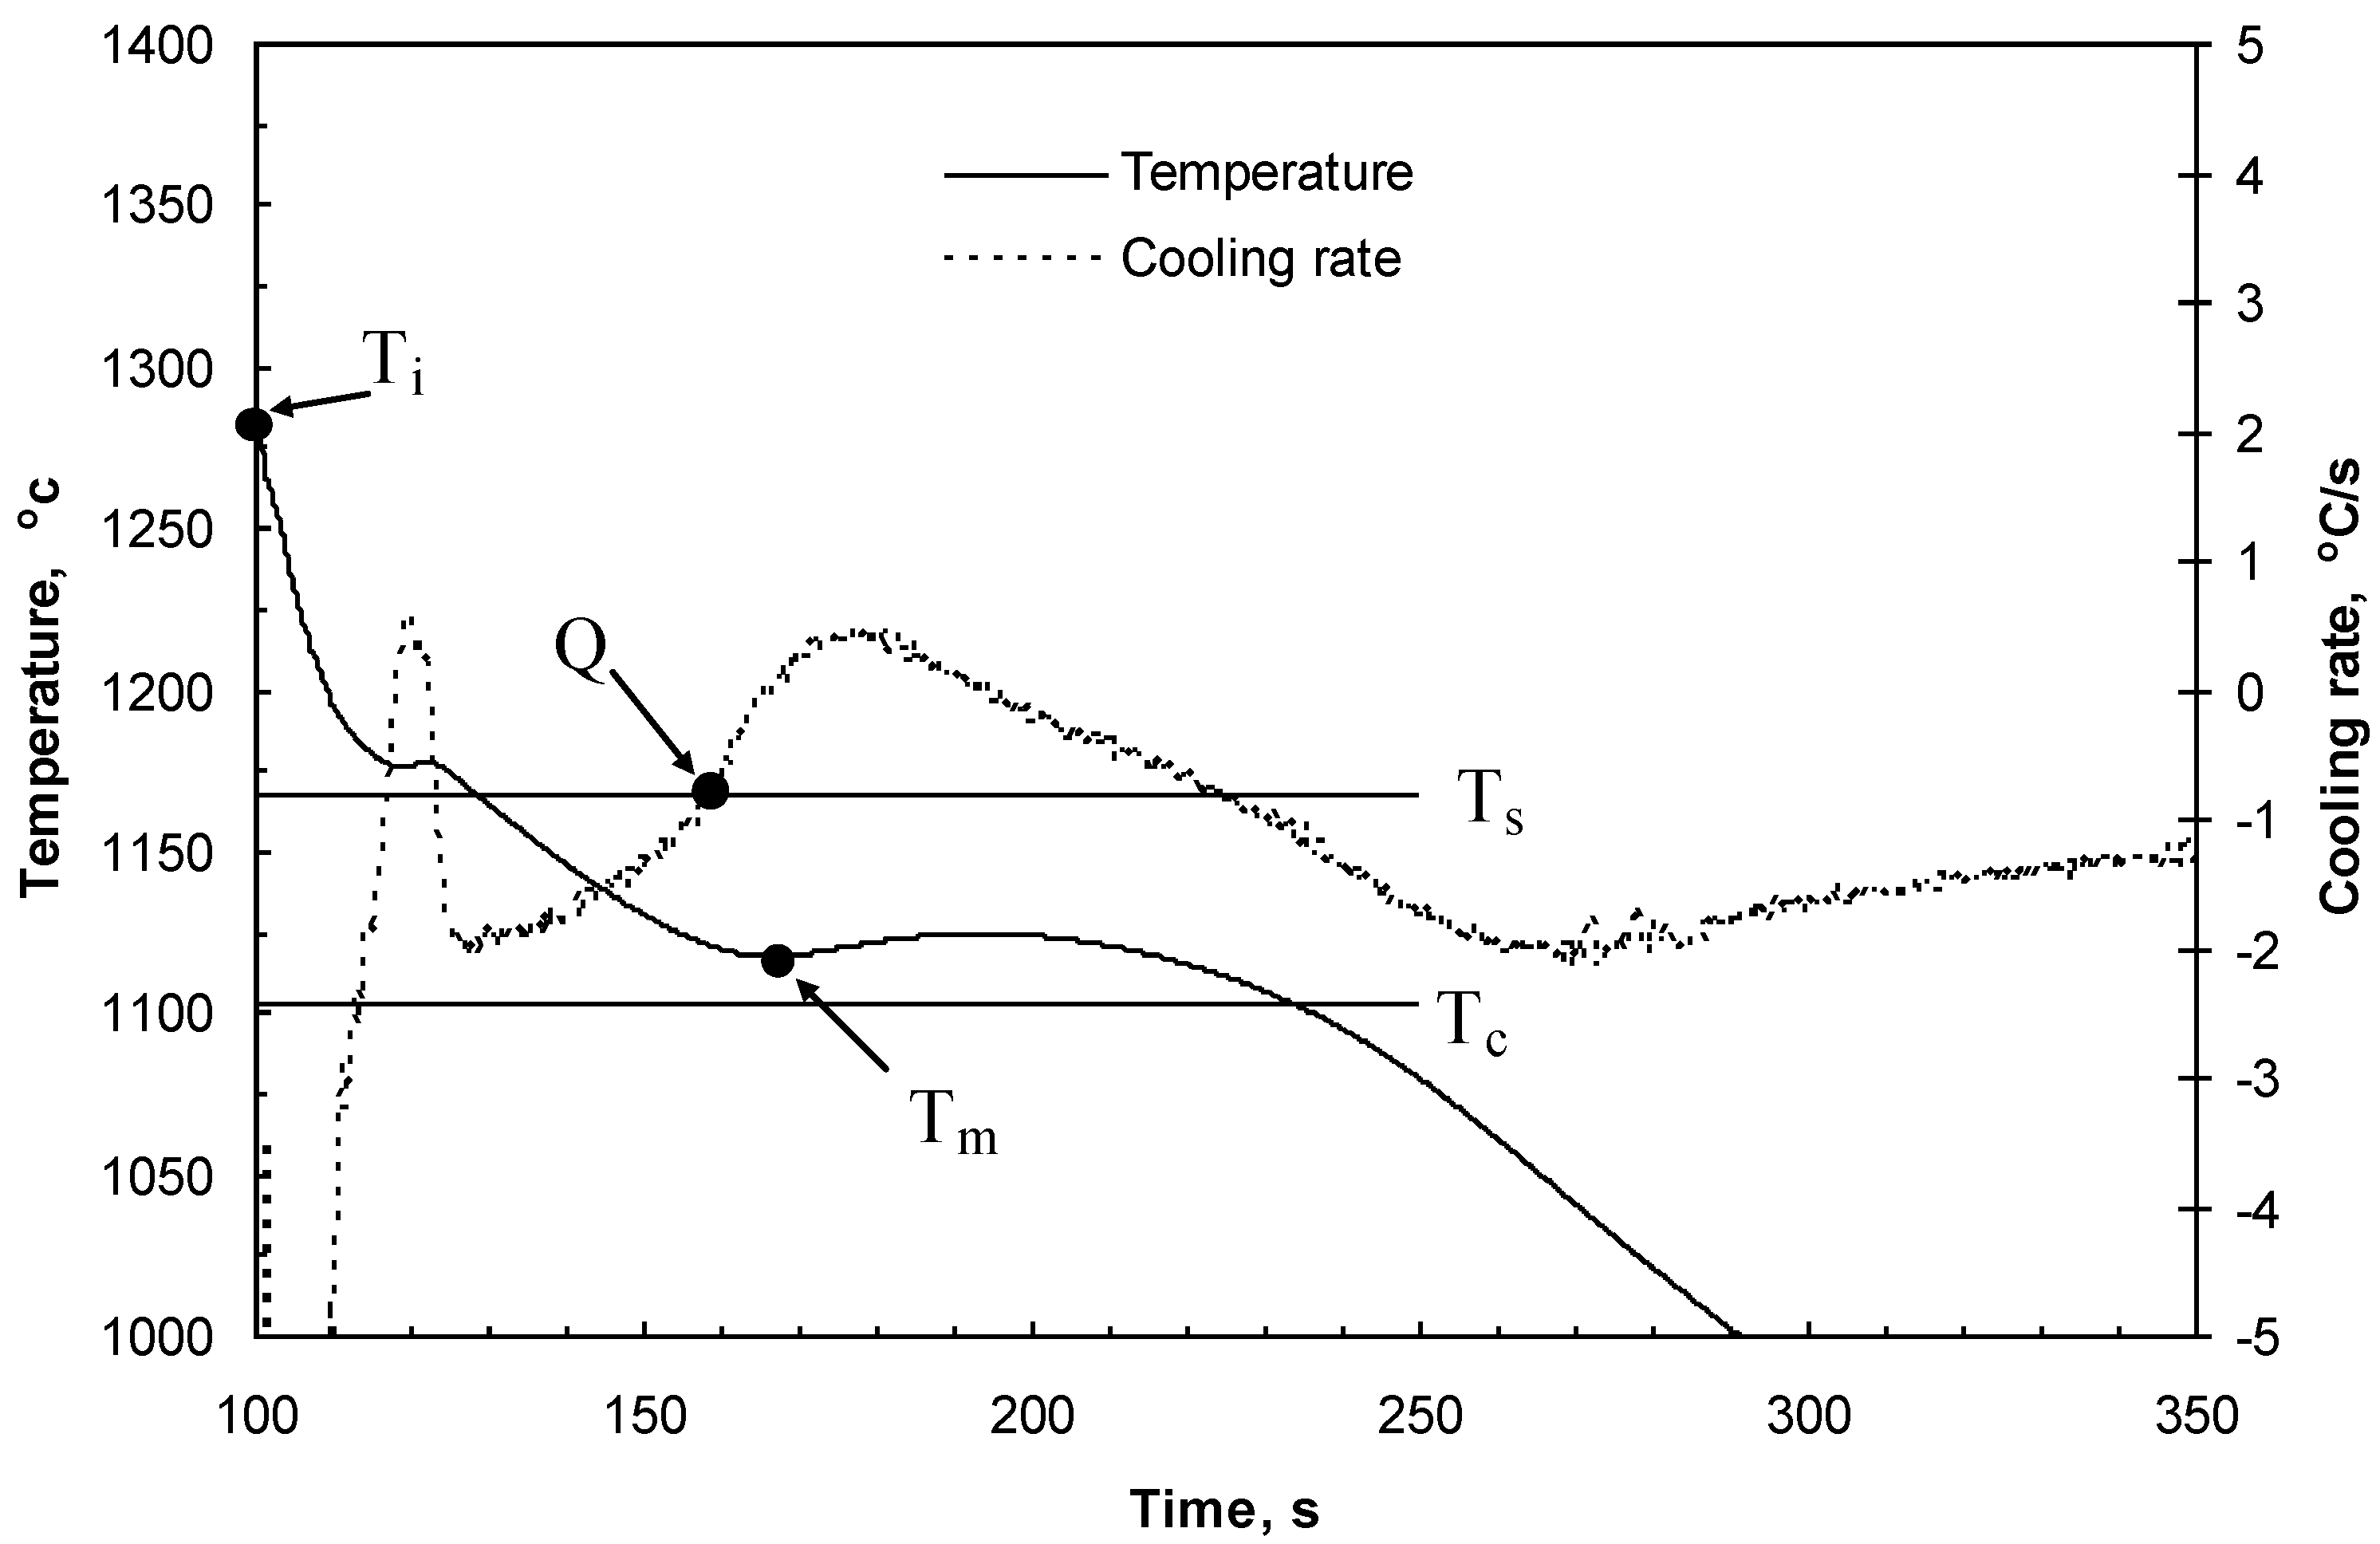
Figure 1).
Figure 1.
Cooling curves and cooling rate curves for cast iron. Ti = initial temperature of the metal in the mold cavity just after pouring; Ts = graphite eutectic equilibrium temperature; Tc = cementite equilibrium temperature; Tm = minimal temperature; and Q = cooling rate of cast iron at the onset of graphite eutectic solidification.
It is well known that each graphite nucleus gives rise to a single eutectic cell. Hence, it can be assumed that a measure of the graphite nuclei density is given by measurements of the eutectic cell count (cells/volume). Thus, the eutectic cell count can be related to the graphite nucleation potential through Equation (1), where the melt is characterized by the nucleation coefficients,
Ns, and
b.
- (b)
The growth rate of eutectic cells can be described by [
15]:
where μ is the growth coefficient of the eutectic cells and Δ
T is the melt undercooling.
1.2. Onset of Graphite Eutectic Solidification
The heat generated during the solidification of cast iron depends on both the cell count and the growth rate of the eutectic cells. Thus, by combining the heat extraction from the mold with the heat generated during the solidification of eutectic cells, the minimal temperature,
Tm (
Figure 1), or the maximum undercooling, Δ
Tm =
Ts −
Tm, at the onset of graphite eutectic solidification can be determined from [
4]:
where:
where
M is the casting modulus,
Ti is the initial liquid metal temperature just after pouring into the mold and
Tl,
Tlγ, a, c,
Le,
Lγ and f are various solidification parameters, defined in
Table 1.
Table 1.
Selected thermophysical data [14]. C, Si, P: % content of carbon, silicon and phosphorus in cast iron, respectively.
| Parameter | Value and Units |
|---|
| Latent heat of eutectic graphite | Le = 2,028.8; J/cm3 |
| Latent heat of austenite | Lγ = 1,904.4; J/cm3 |
| Specific heat of cast iron | c = 5.95; J/(cm3·°C) |
| Material mold ability to absorb heat | a = 0.11; J/(cm2·s1/2·°C) |
| Liquidus temperature for pro-eutectic austenite | Tl = 1,636 − 113(C + 0.25 Si + 0.5 P); °C |
| Carbon content in eutectic graphite | Ce = 4.26 − 0.30 Si − 0.36 P; % |
| Maximum carbon content in austenite at
Ts | Cγ = 2.08 − 0.11 Si − 0.35 P; % |
| Liquidus temperature of pre-eutectic austenite when its composition is
Cγ | Tlγ = 1,636 − 113(2.08 + 0.15 Si + 0.14 P); °C |
| Weight fraction of austenite cast iron at the beginning of eutectic solidification | gγ = (Ce − C)/(Ce −Cγ) |
| Austenite density | ργ = 7.51 g/cm3 |
| Liquid cast iron density | ρl = 7.1 g/cm3 |
| Volume fraction of liquid in cast iron at the beginning of eutectic solidification | f = ργ gl/[ργ gl + ρl (1 − gl)] |
Combining Equations (1) and (4) yields:
where:
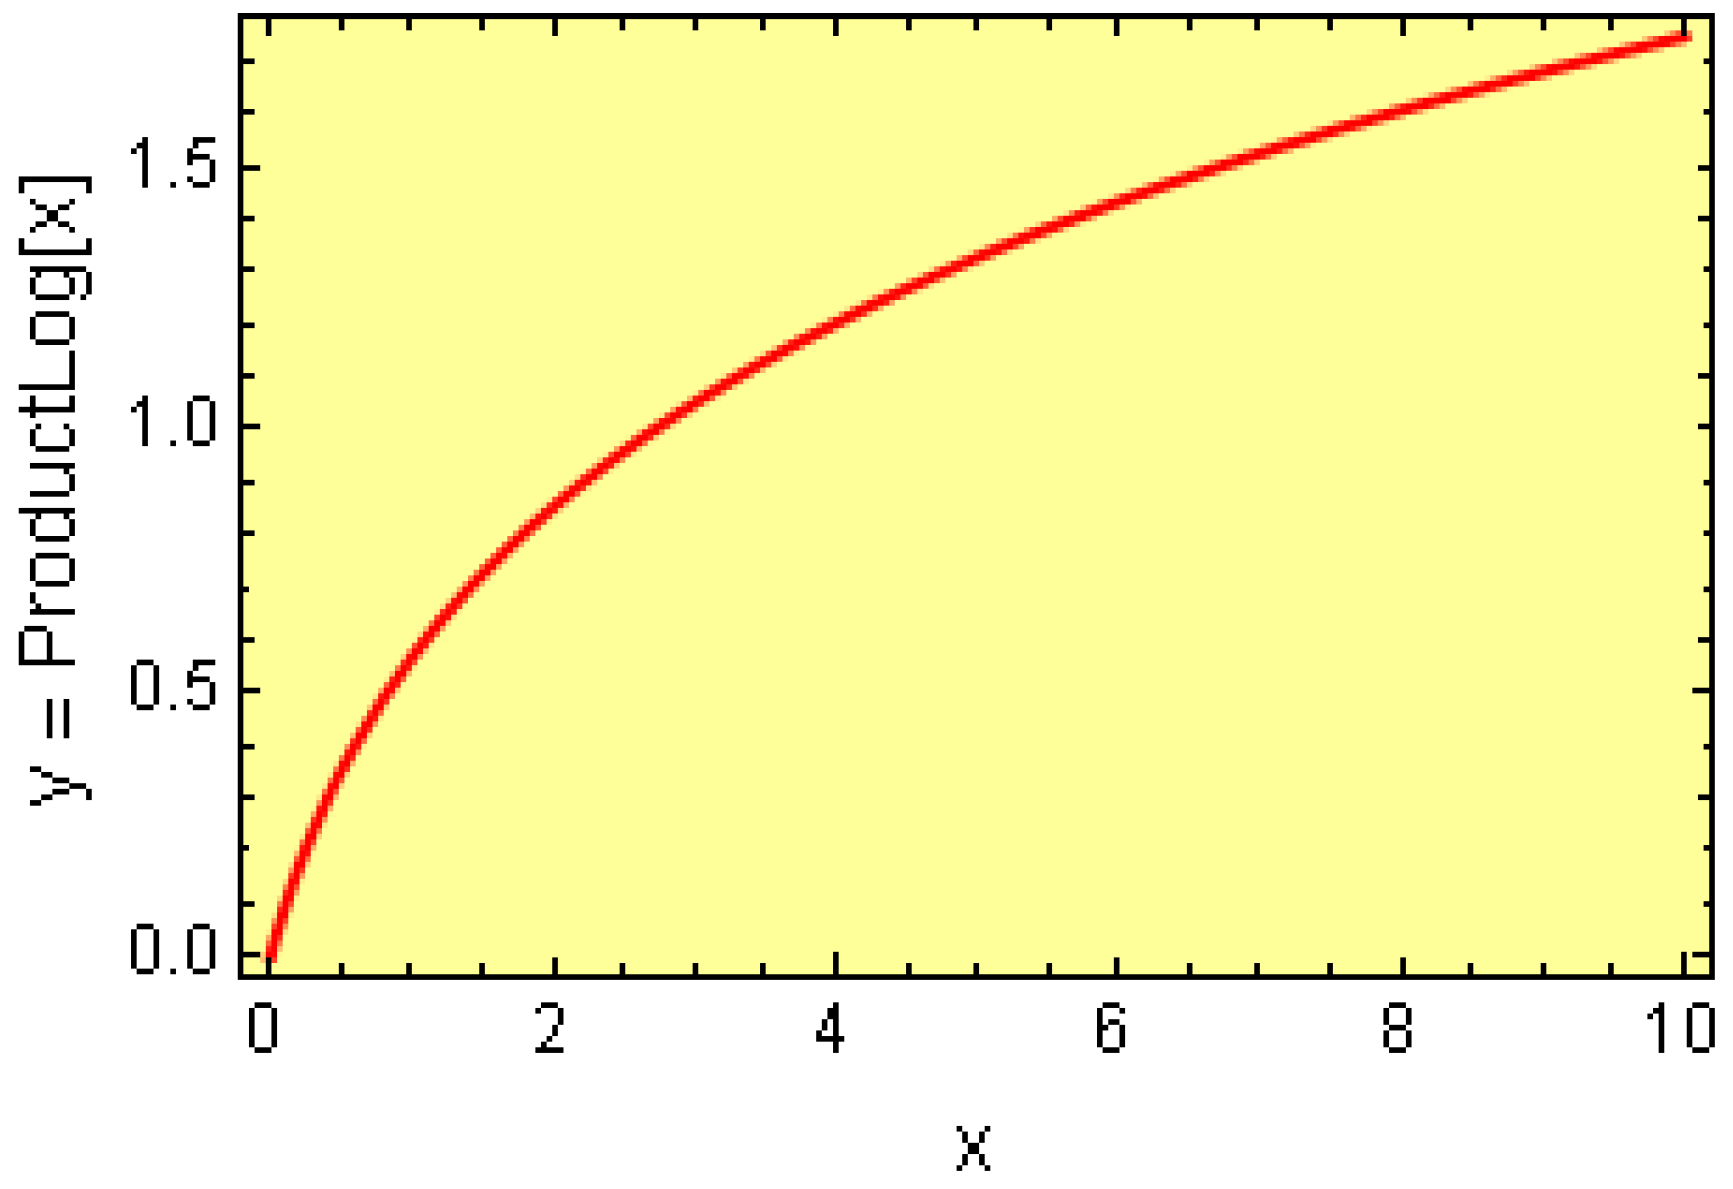
ProductLog[
y] =
x is the Lambert function (see
http://mathworld.wolfram.com./LambertW-function.html), also known as the omega function, graphically shown in
Figure 2. This function can be easily calculated by means of the instruction ProductLog[
y] in the Mathematica™ program.
Additionally:
Combining Equations (1) and (9), the spatial cell count can be determined from:
Figure 2.
Graphic representation of the ProductLog[y] function for y ≥ 0.
1.3. Chilling Tendency Index
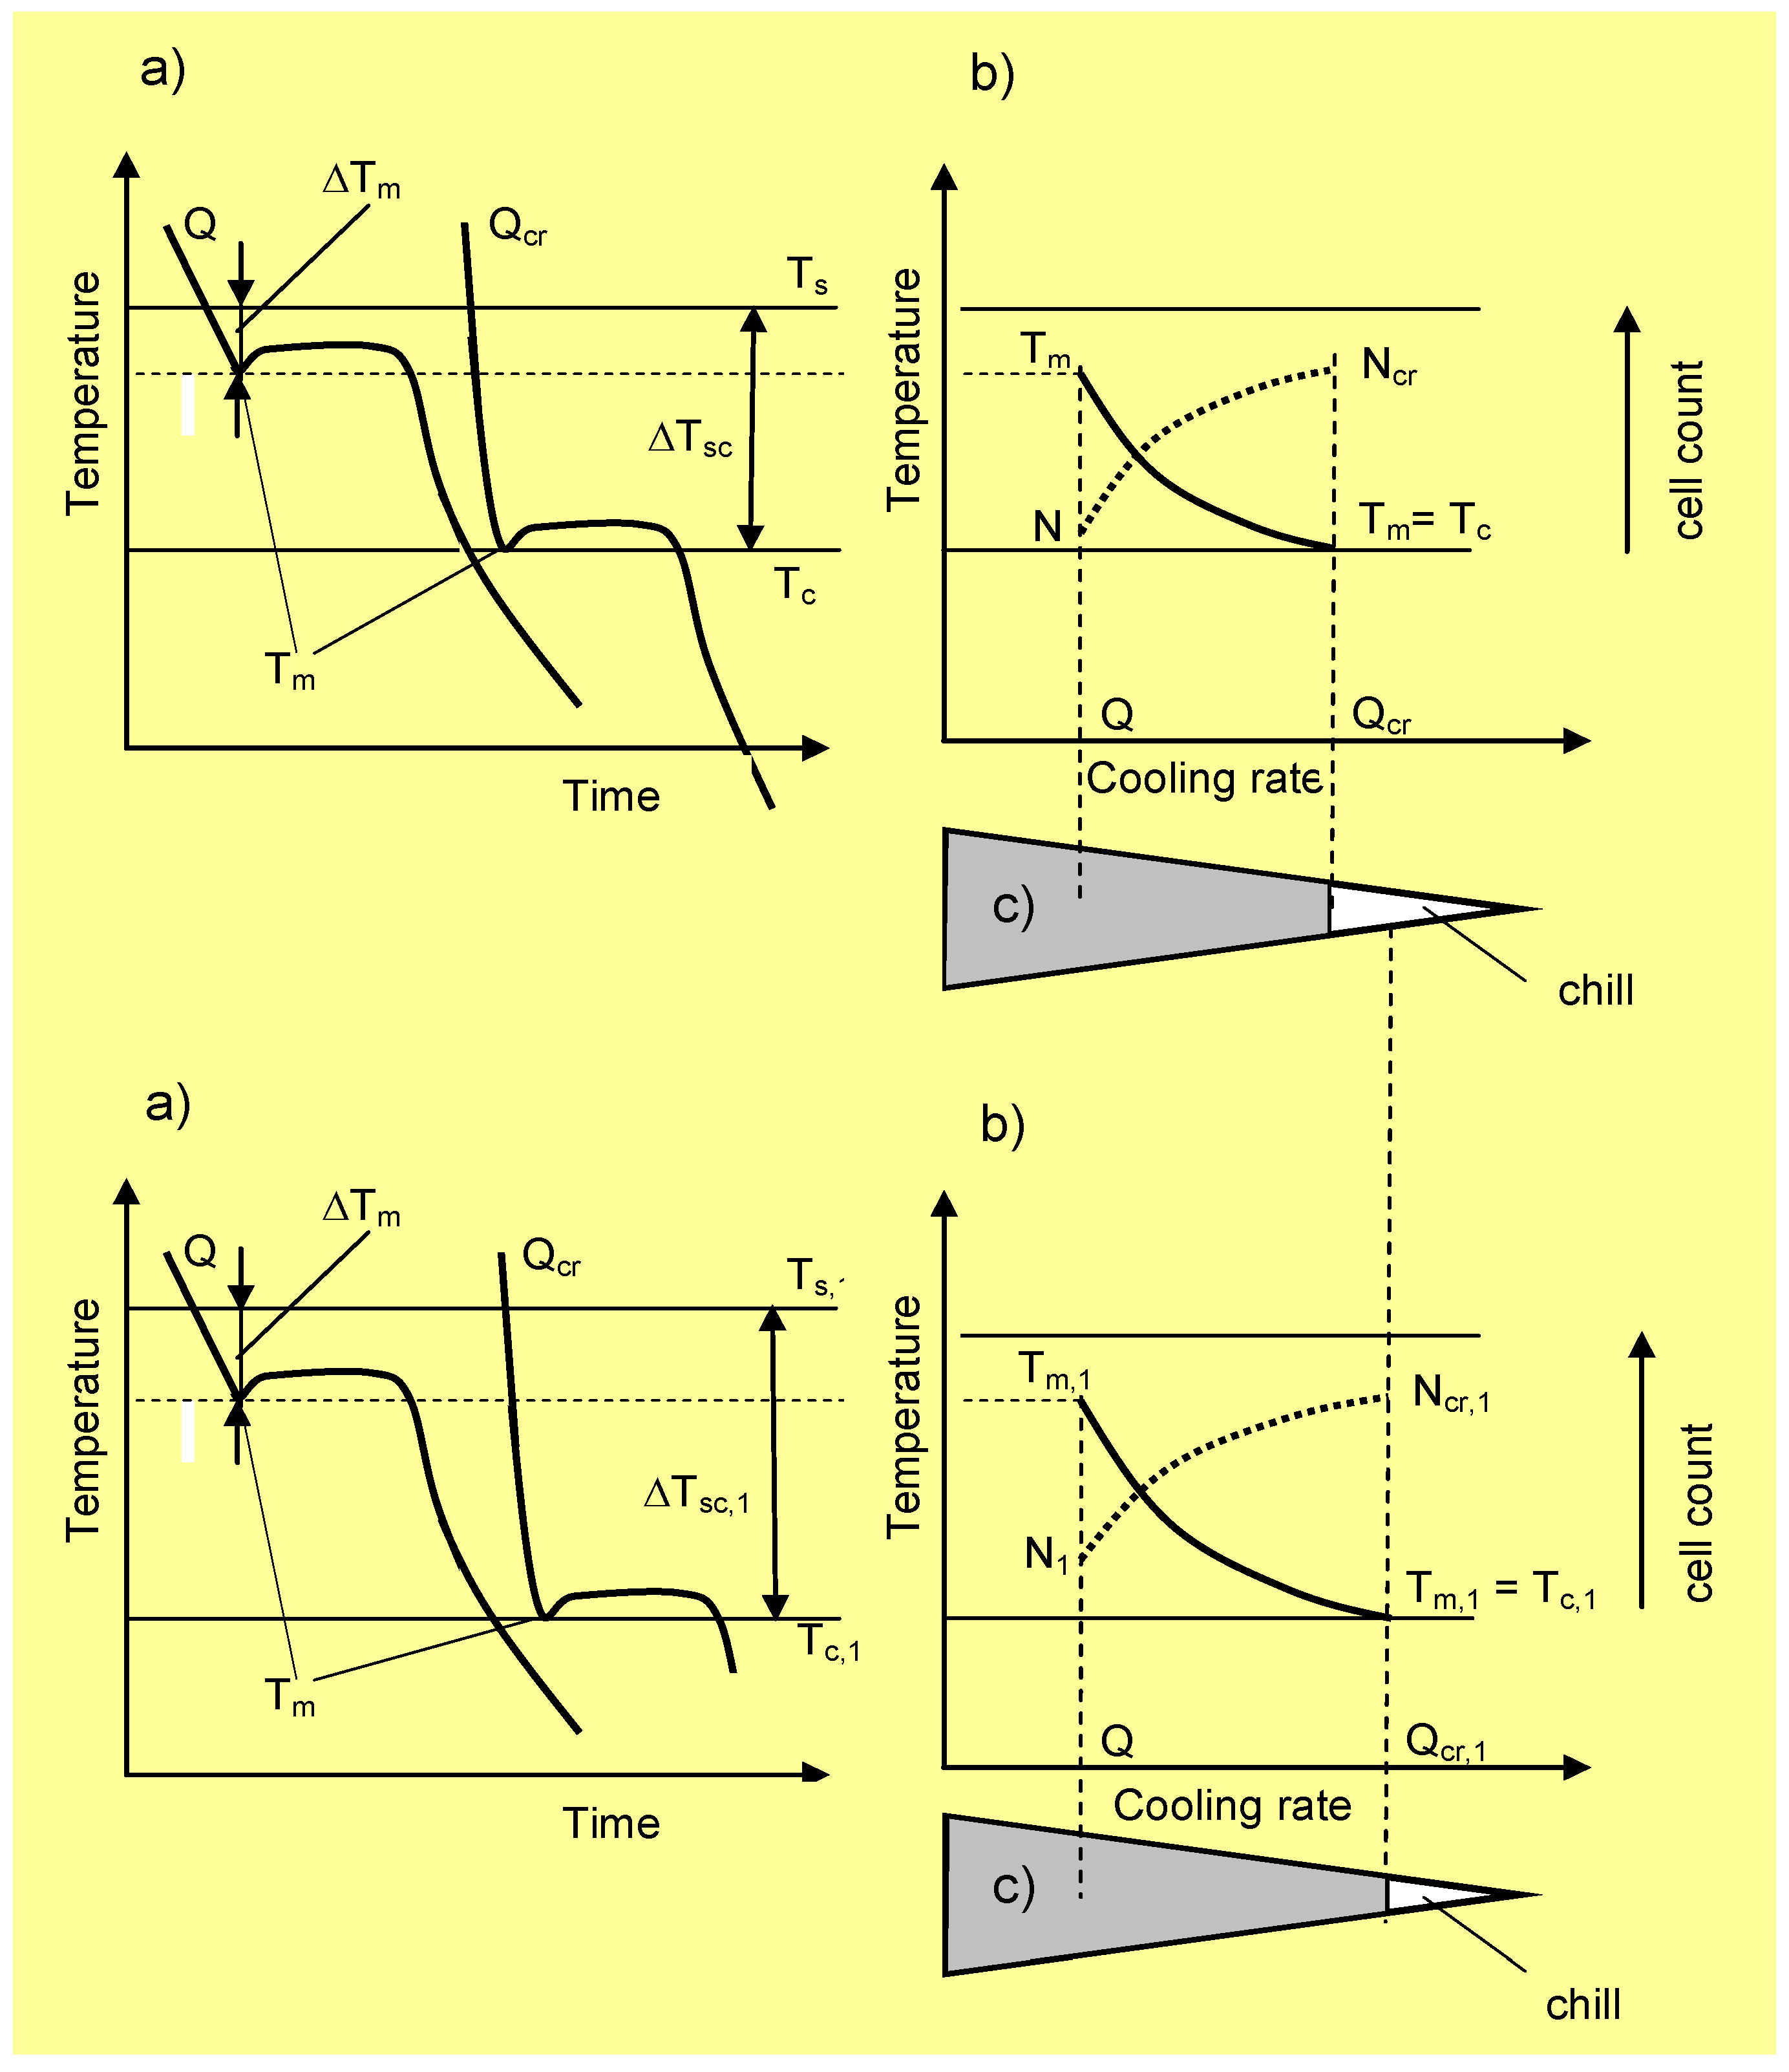
Figure 3 shows the cooling curves with the T
m values, including the eutectic graphite and N along the wedge axis for two solidified cast irons with different physical-chemical states. The temperature range ∆
Tsc =
Ts −
Tc is also given in
Figure 3. Notice that in the temperature range ∆
Tsc =
Ts −
Tc, eutectic graphite is the only growing structure (gray cast iron). From this figure, it is apparent that increasing
Q to values equal to
Qcr leads to an increase of eutectic cells from
N to
Ncr. Below
Tc, both graphite and eutectic cementite grow simultaneously, interfering with each other and giving rise to mottled cast iron. Accordingly,
Tc can be considered as the transition temperature for the solidification of eutectic cementite from eutectic graphite or the chill formation temperature. From this figure, it is apparent that an increase of the cooling rate from
Q to
Qcr leads to a reduction in
Tm to
Tc and, hence, to the formation of eutectic cementite (chill development). Thus, determination of the critical cooling rate,
Qcr, is key in establishing the critical conditions for the development of eutectic cementite (chill) in castings.
When
Q =
Qcr or
M =
Mcr and ∆
Tm = ∆
Tsc (
Figure 3), the critical cooling rate can be estimated from Equations (1) and (4) as:
Taking into account Equations (1) and (4) (for ∆
Tm = ∆
Tm) and (5), the critical casting modulus, M
cr, under which it is possible to develop a chill yields:
where:
and:
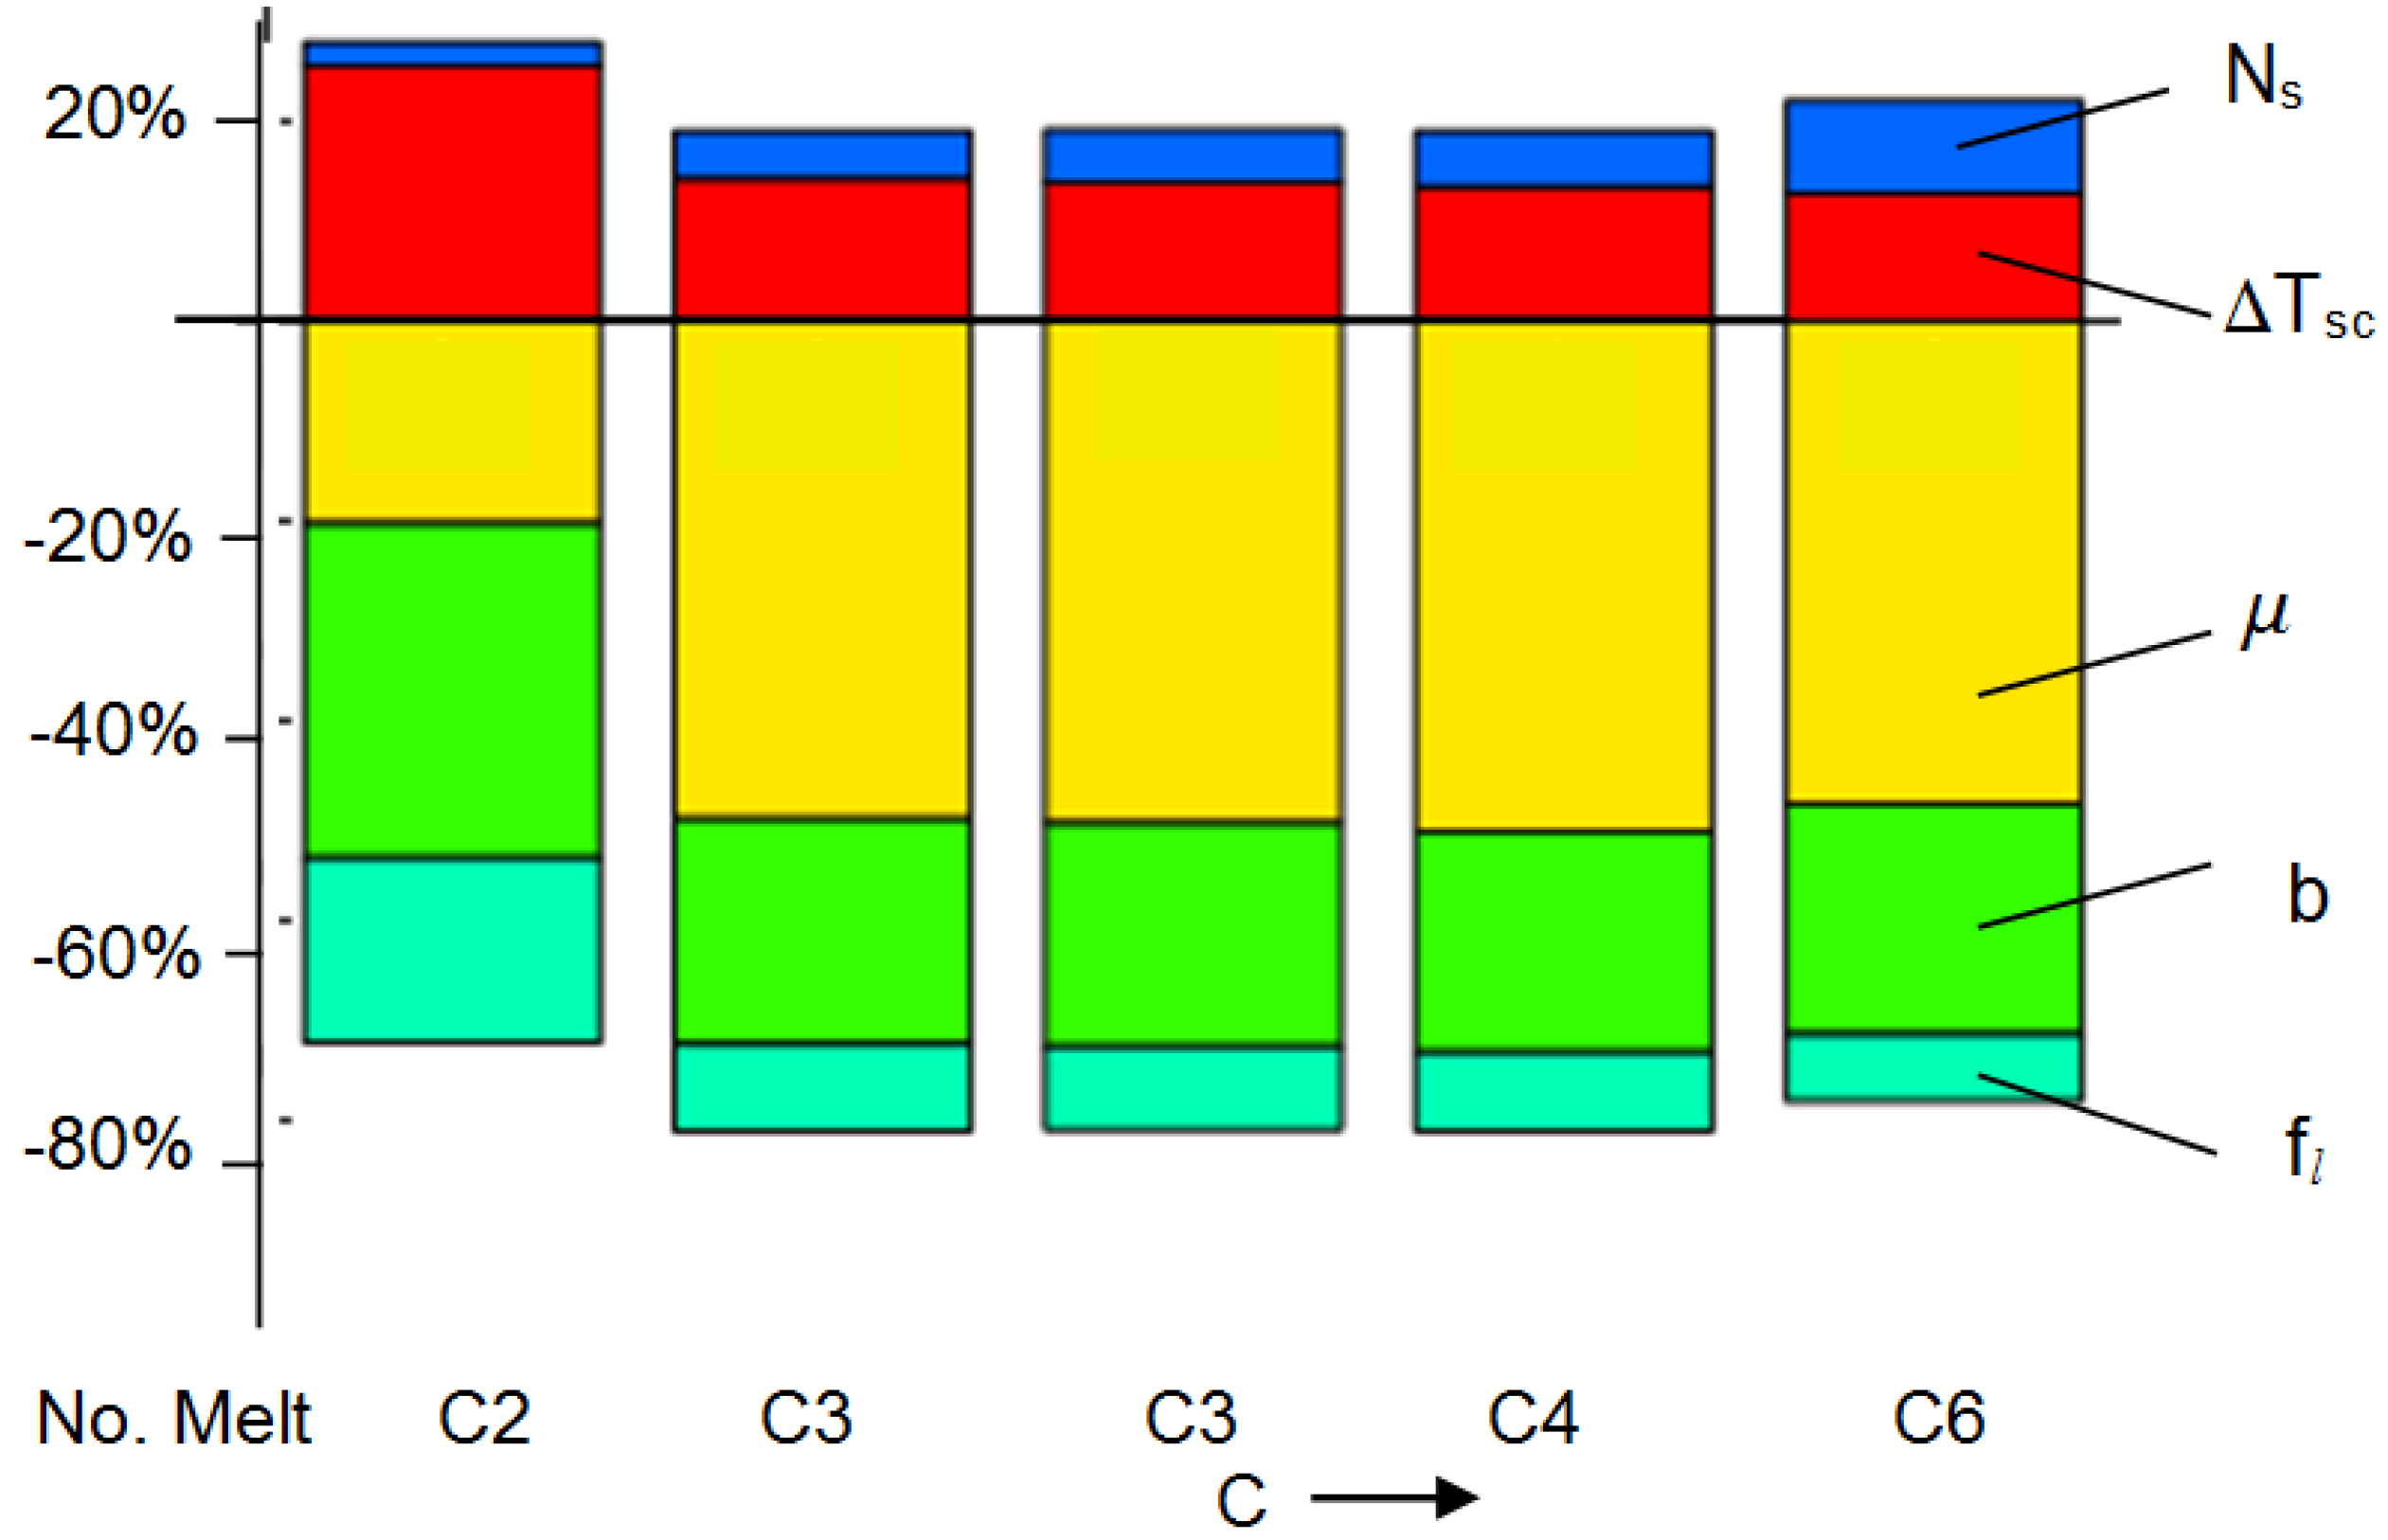
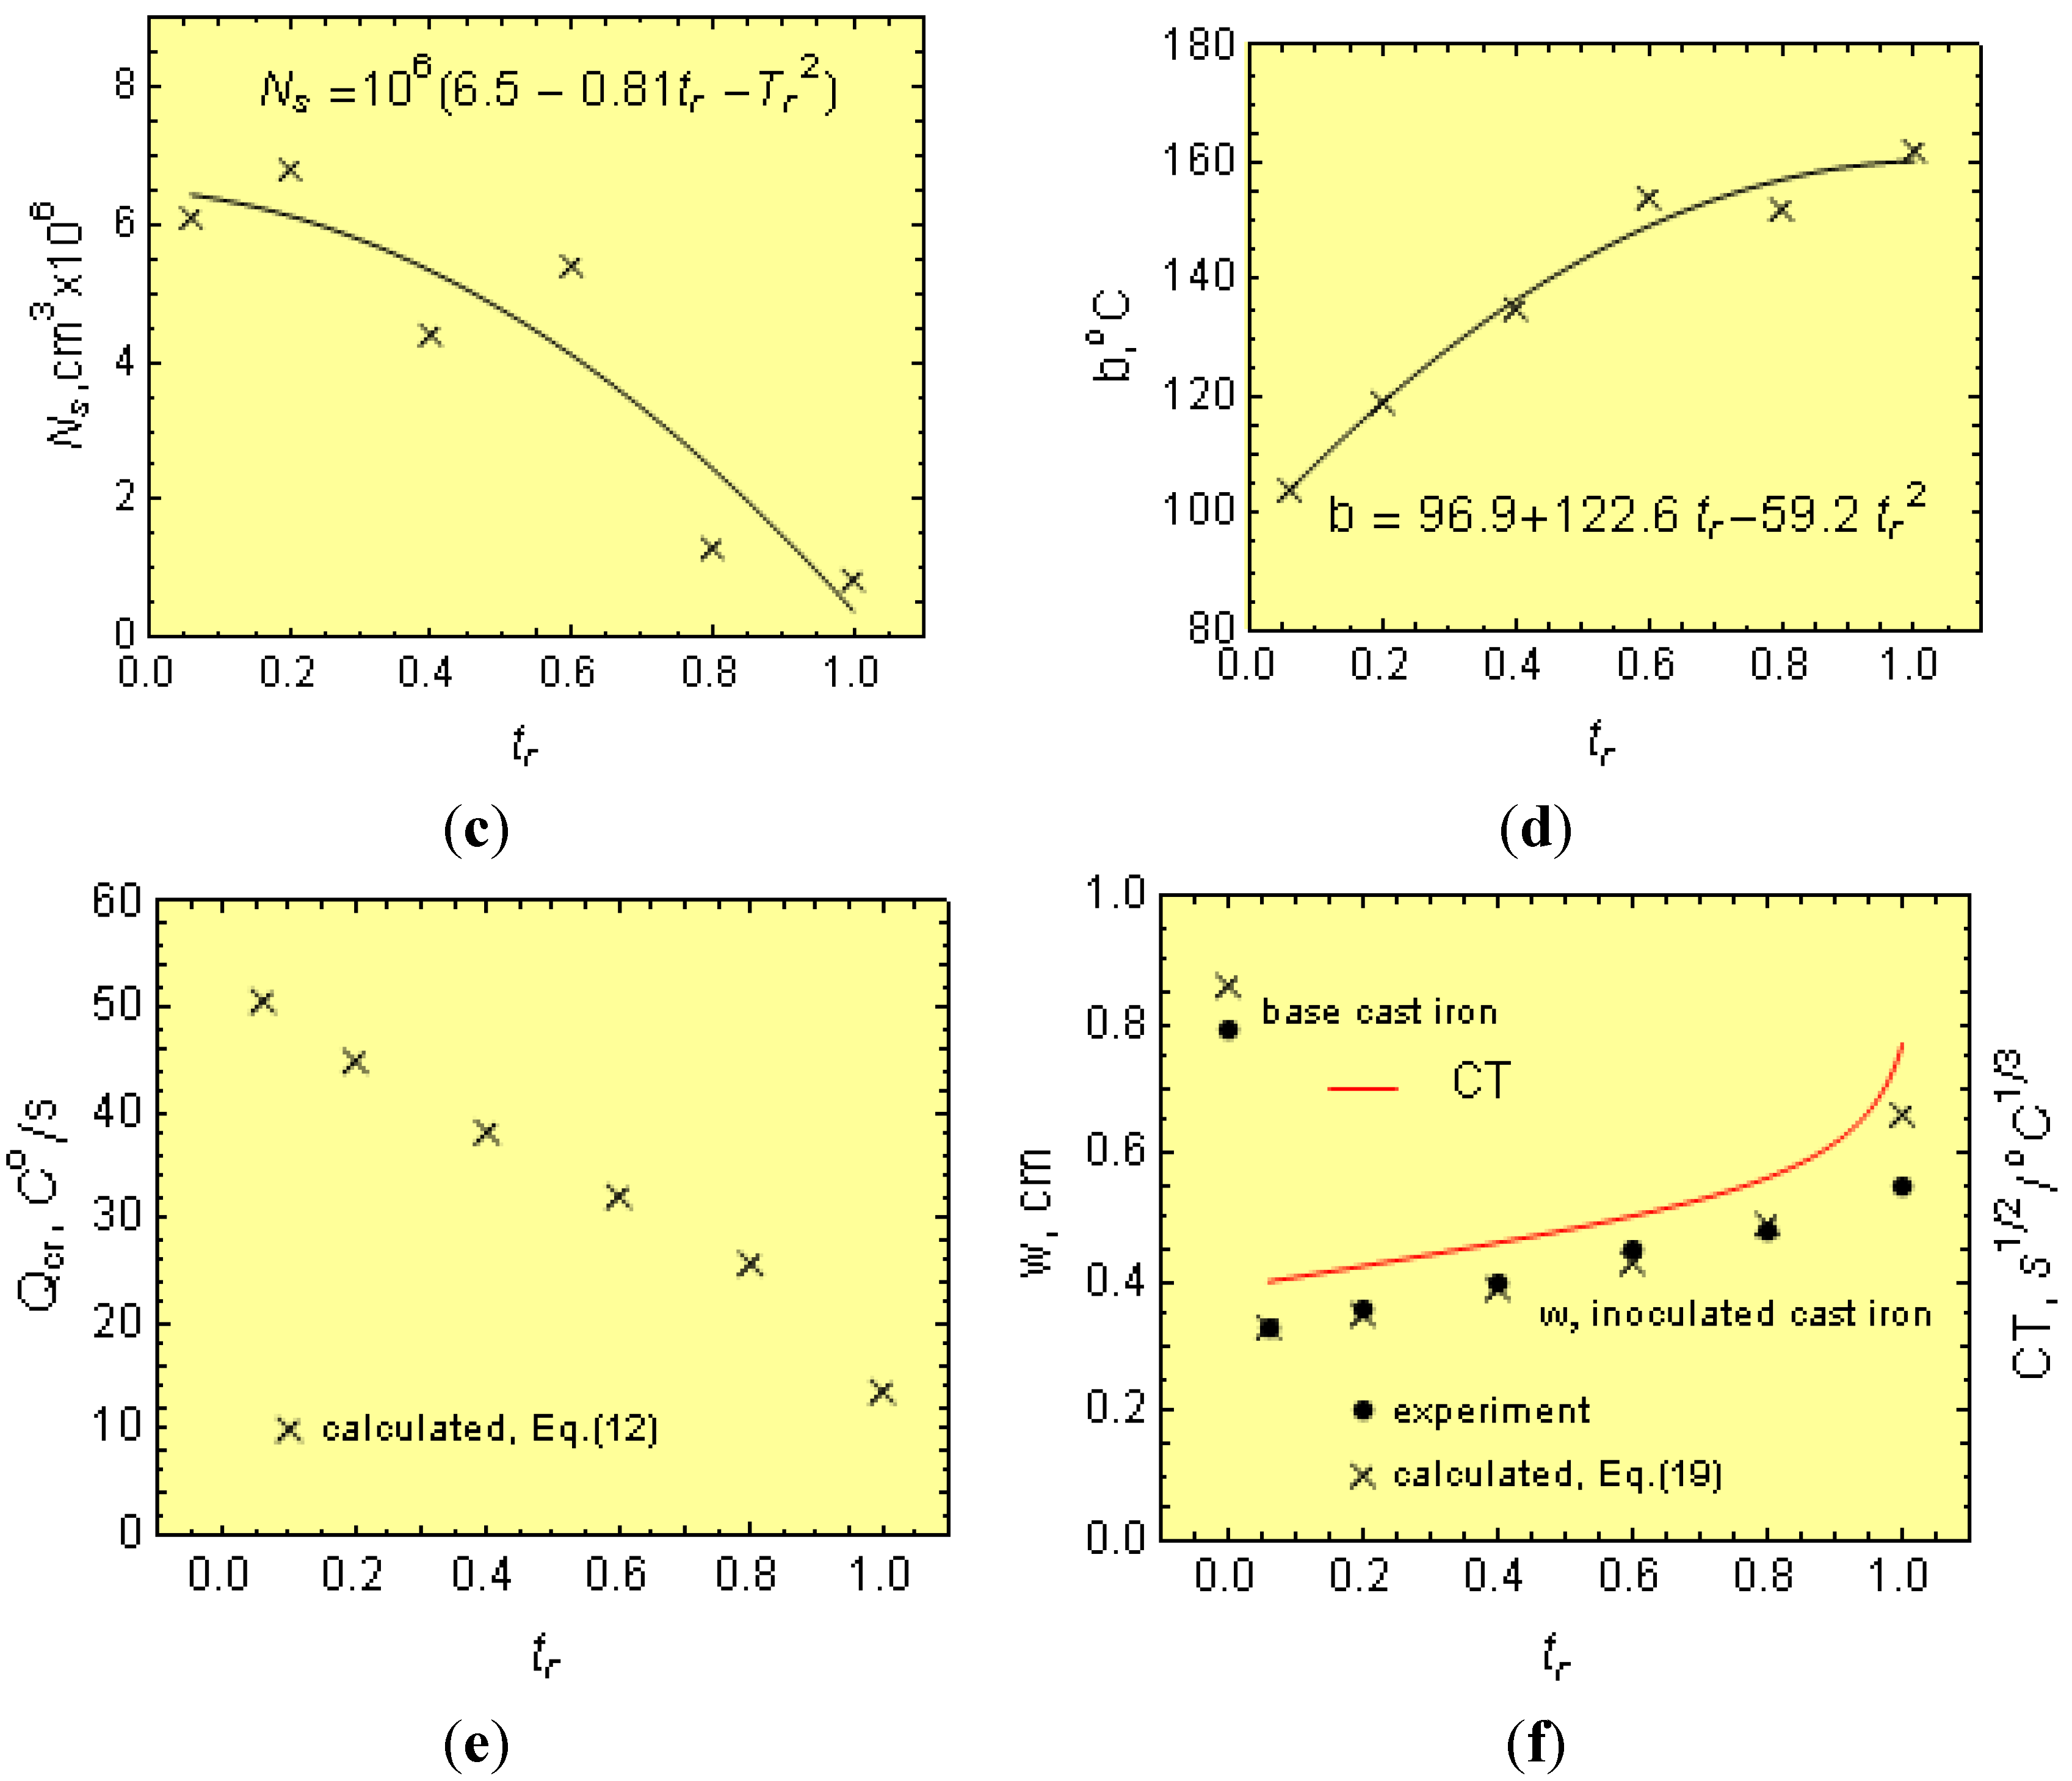
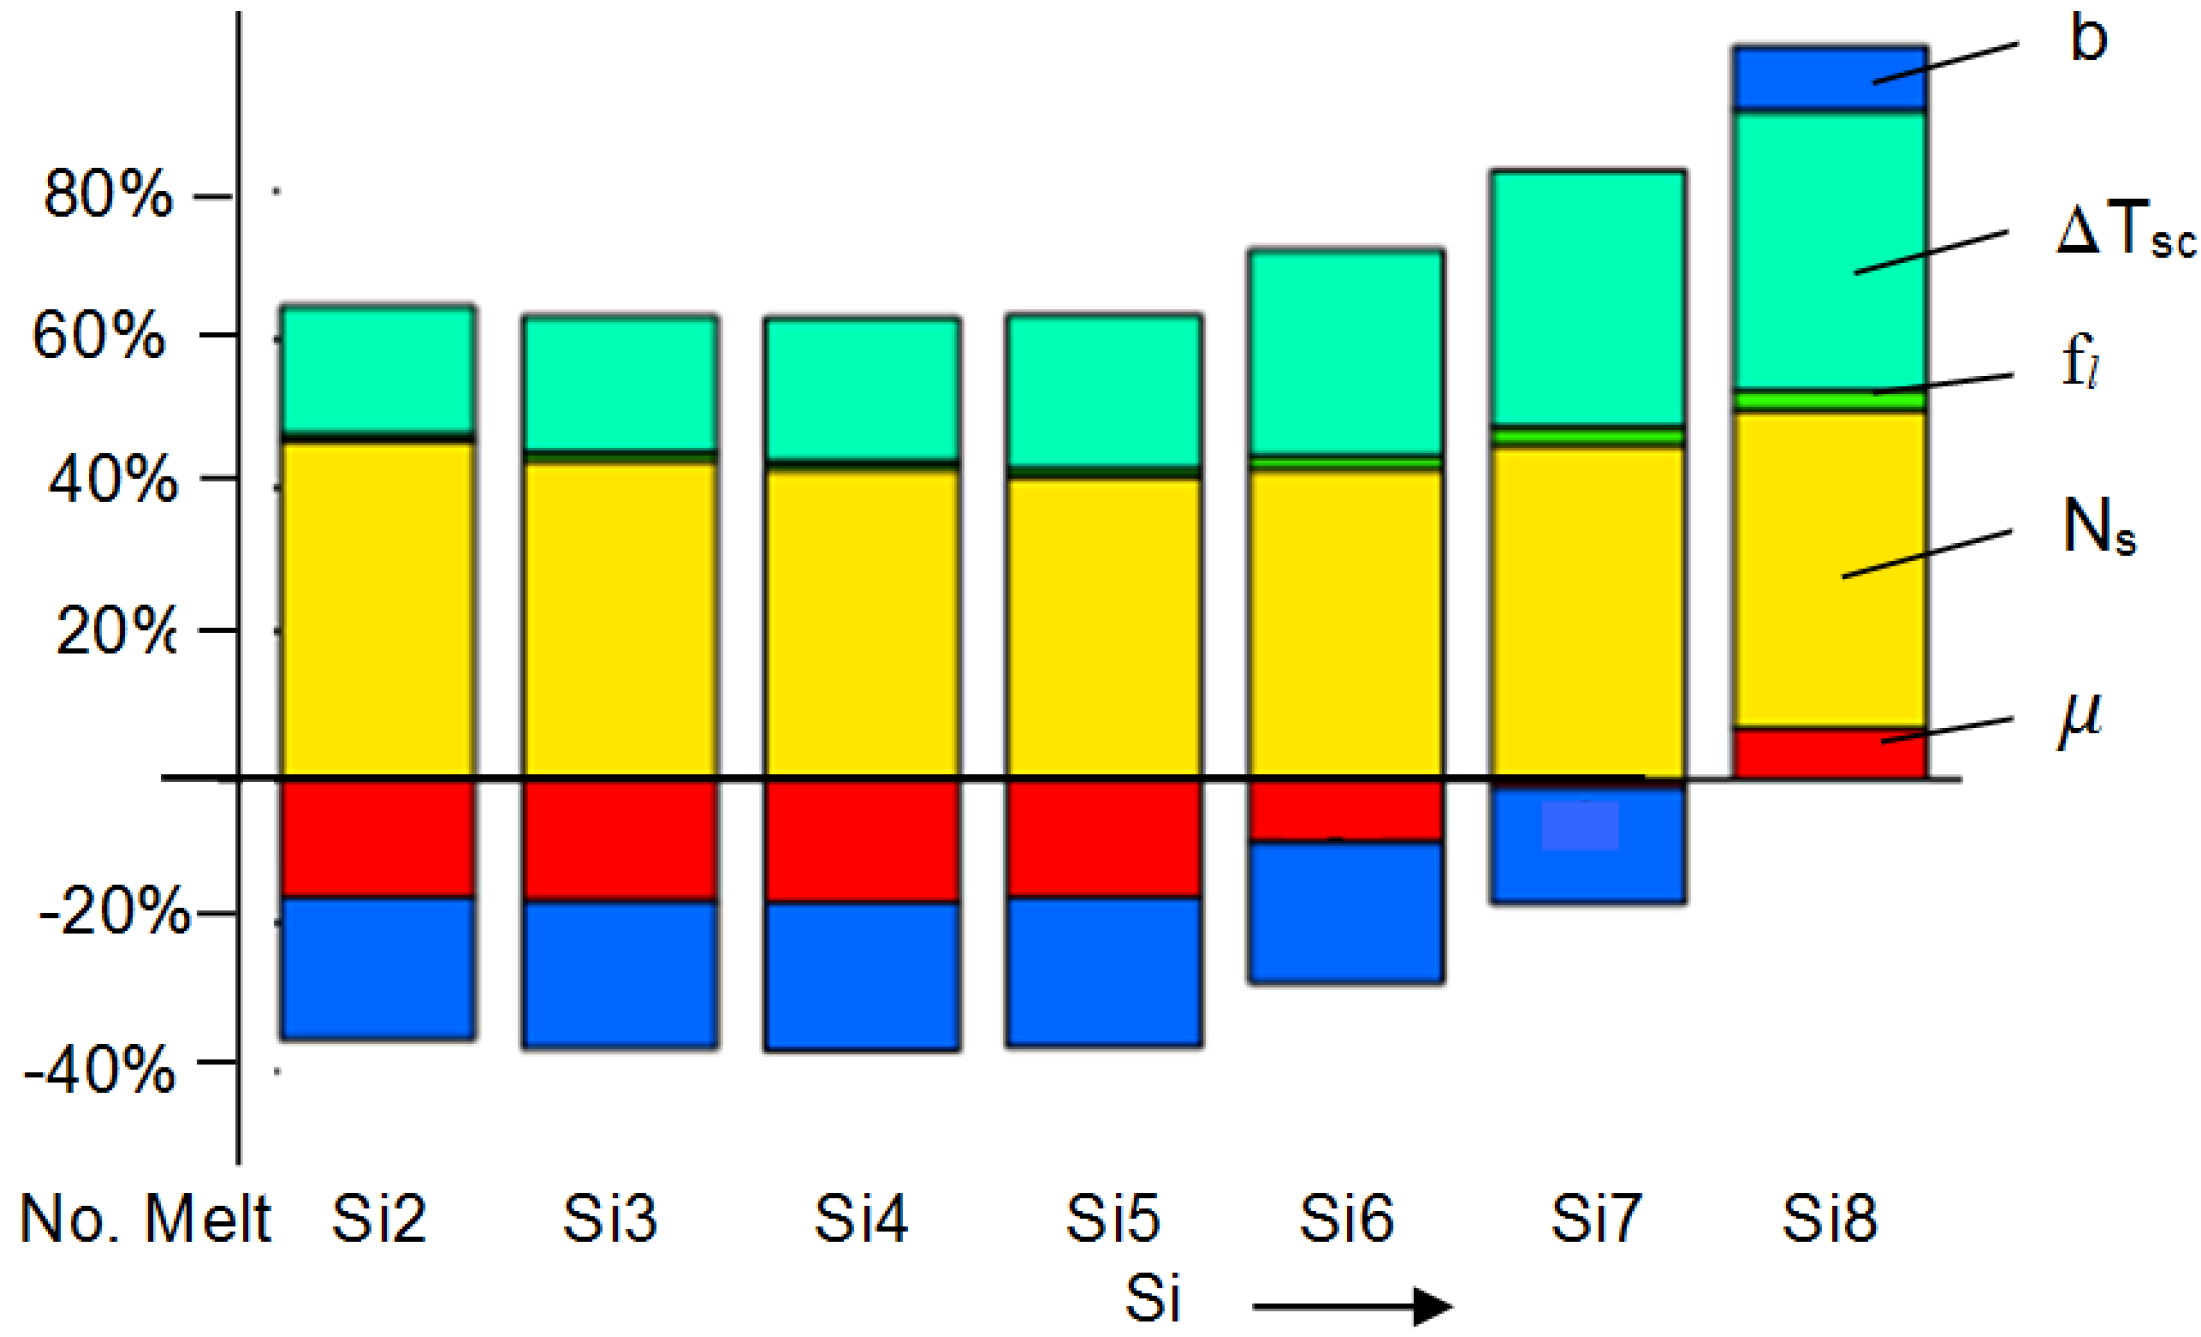
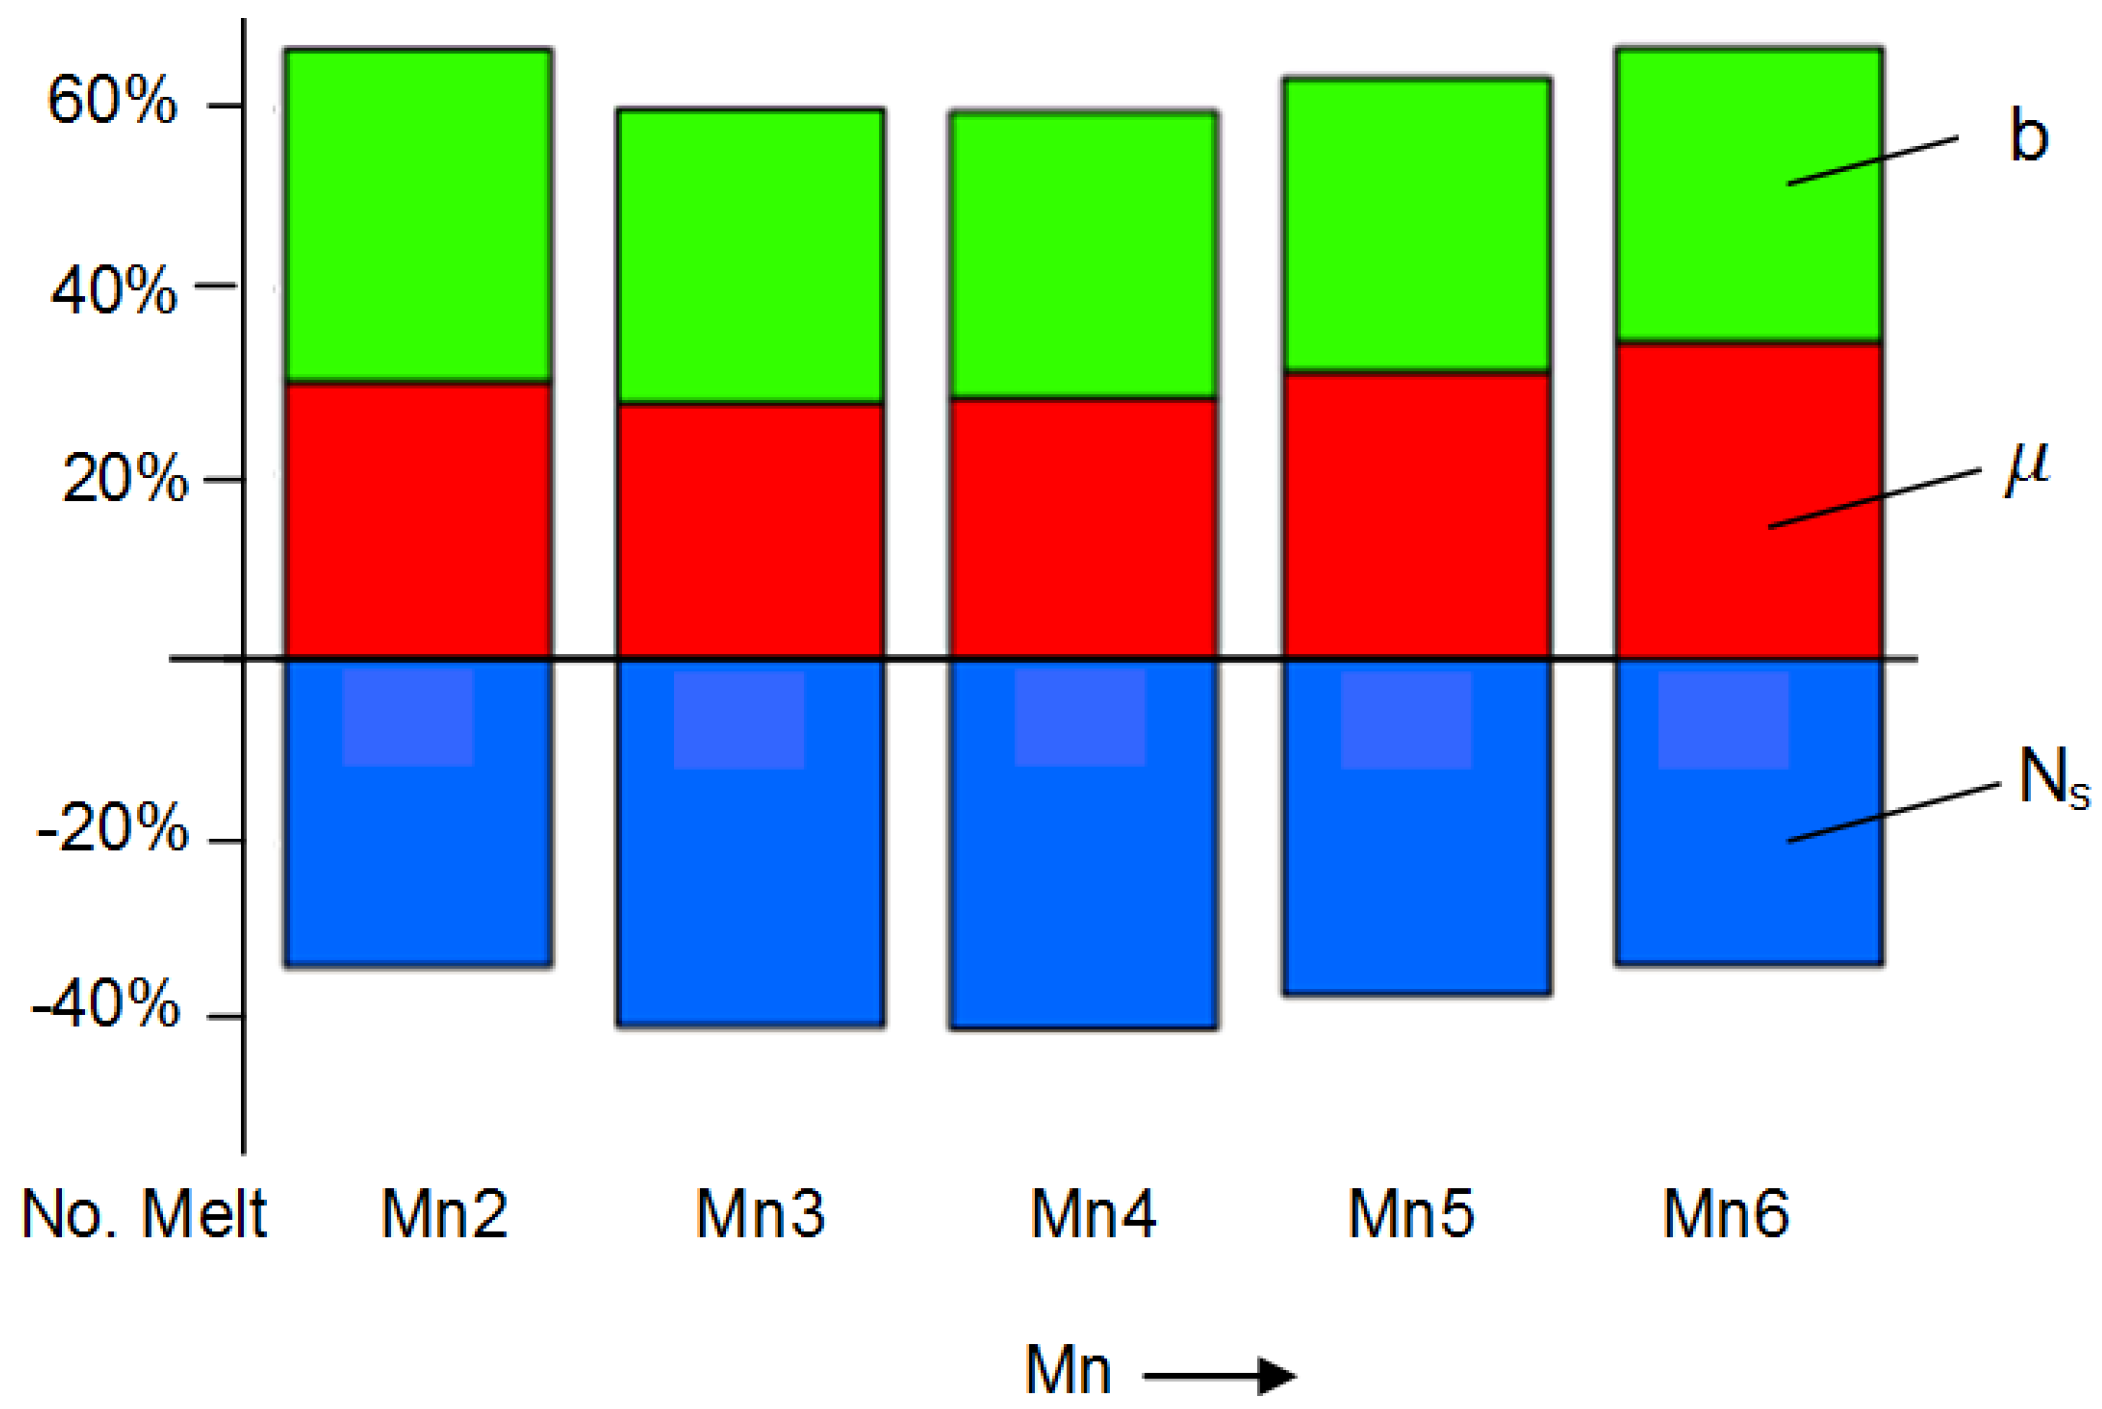
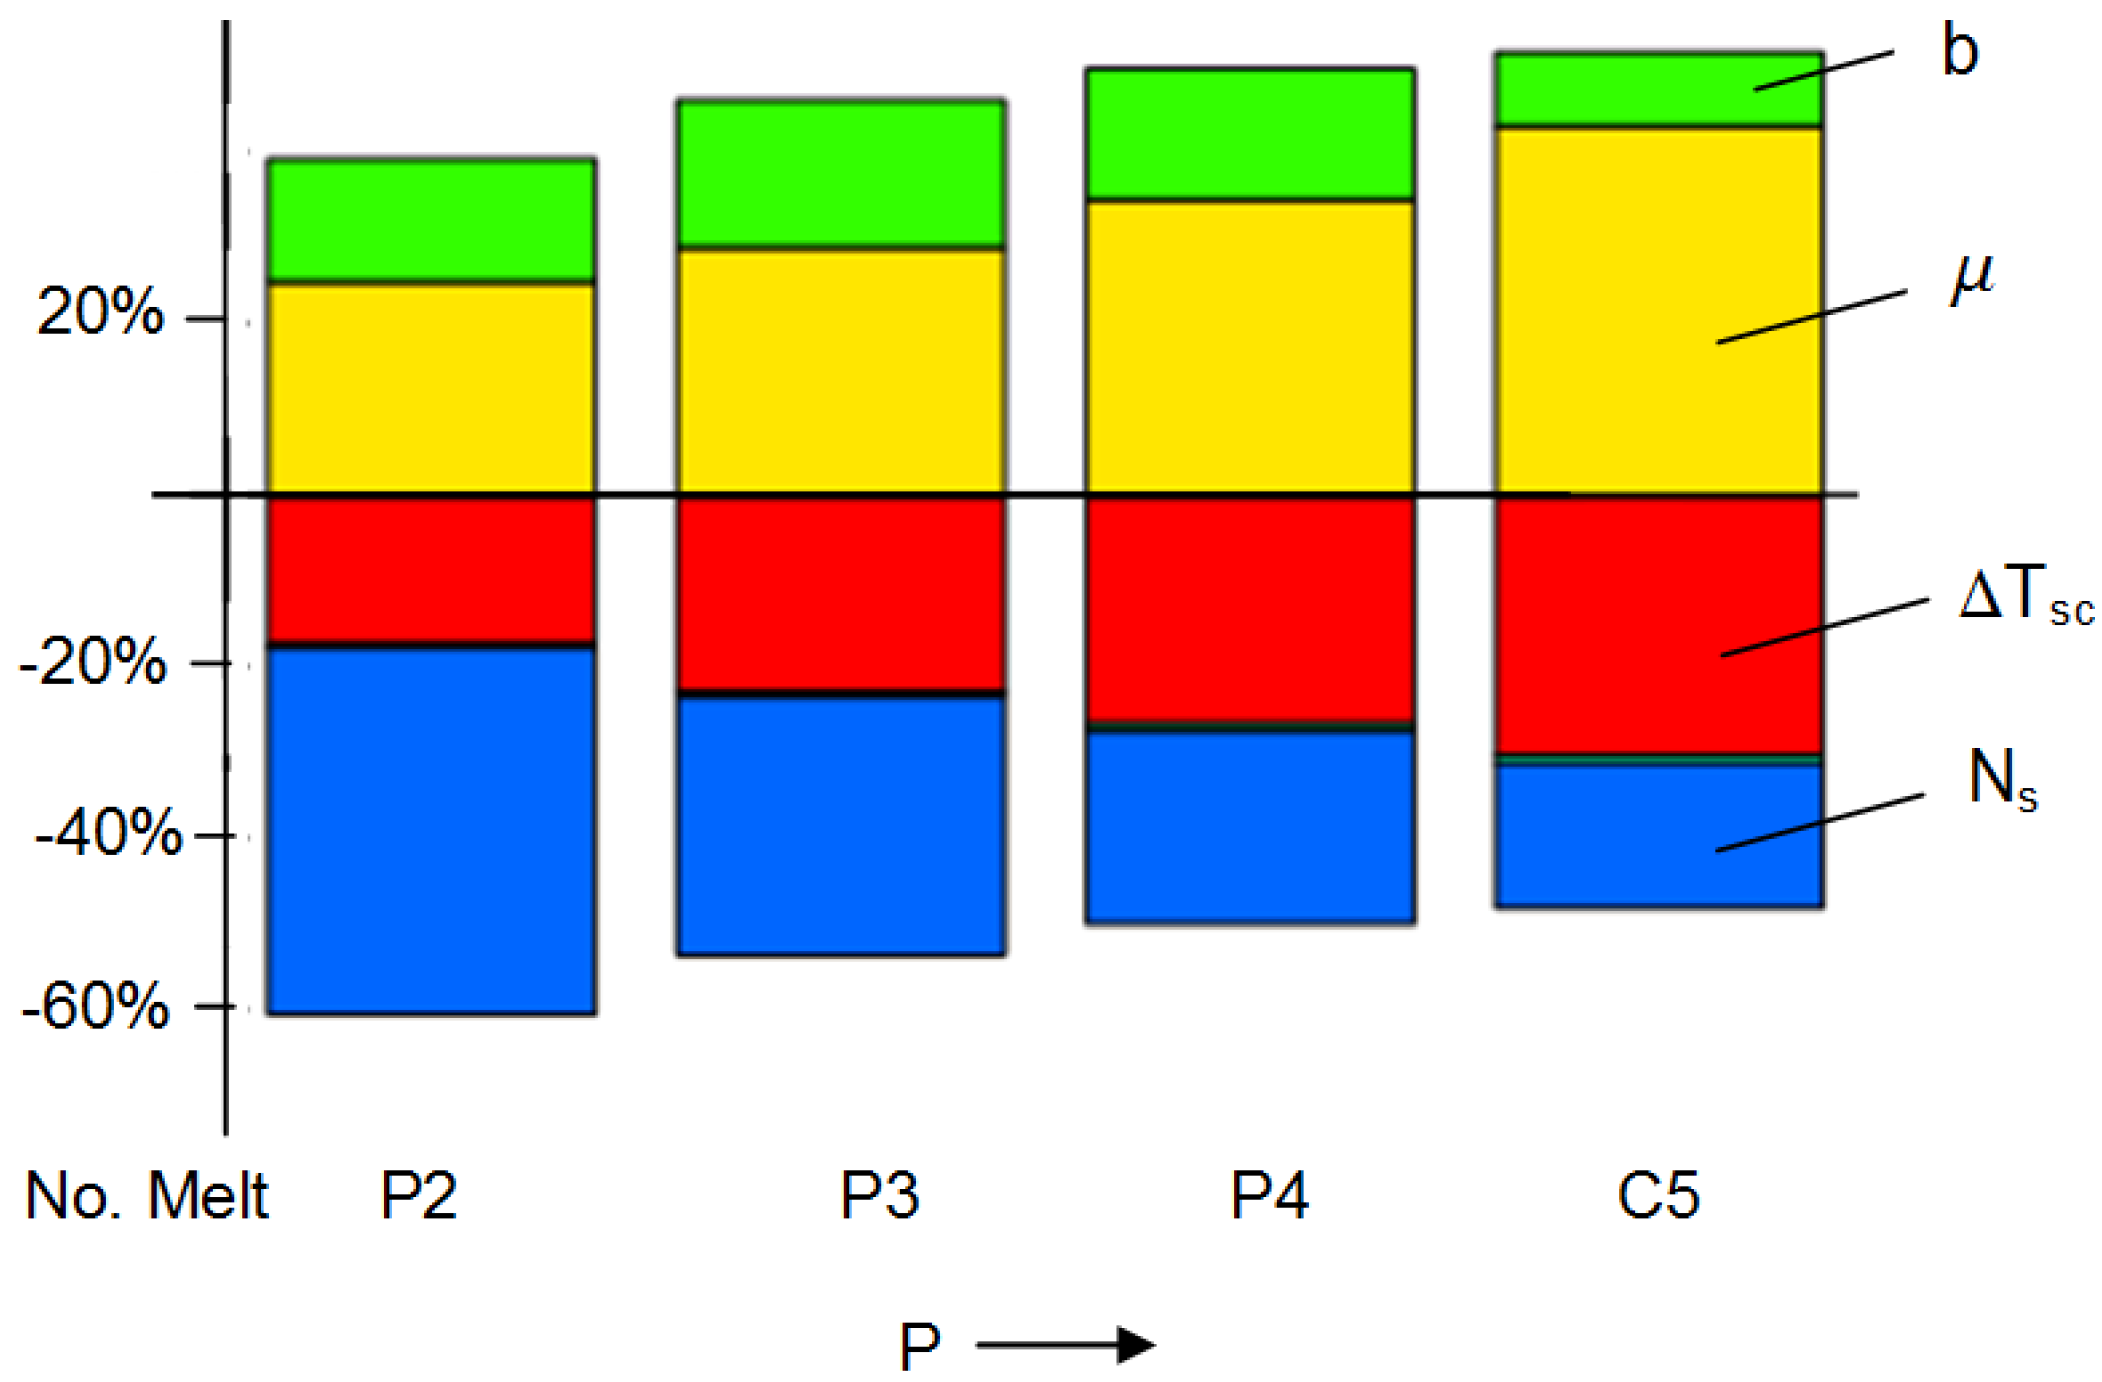
Notice from Equation (15) that μ, f, Ns and ∆Tsc all decrease CT, while b has the opposite effect.
Figure 3.
(a) Cooling curves and (b) effect of the cooling rate, Q, along the wedge axis on minimum solidification temperature, Tm, eutectic graphite and eutectic cell count, N, for two cast irons with different physical-chemical properties. (c) Scheme of a wedge section containing a chill.
1.4. Chill
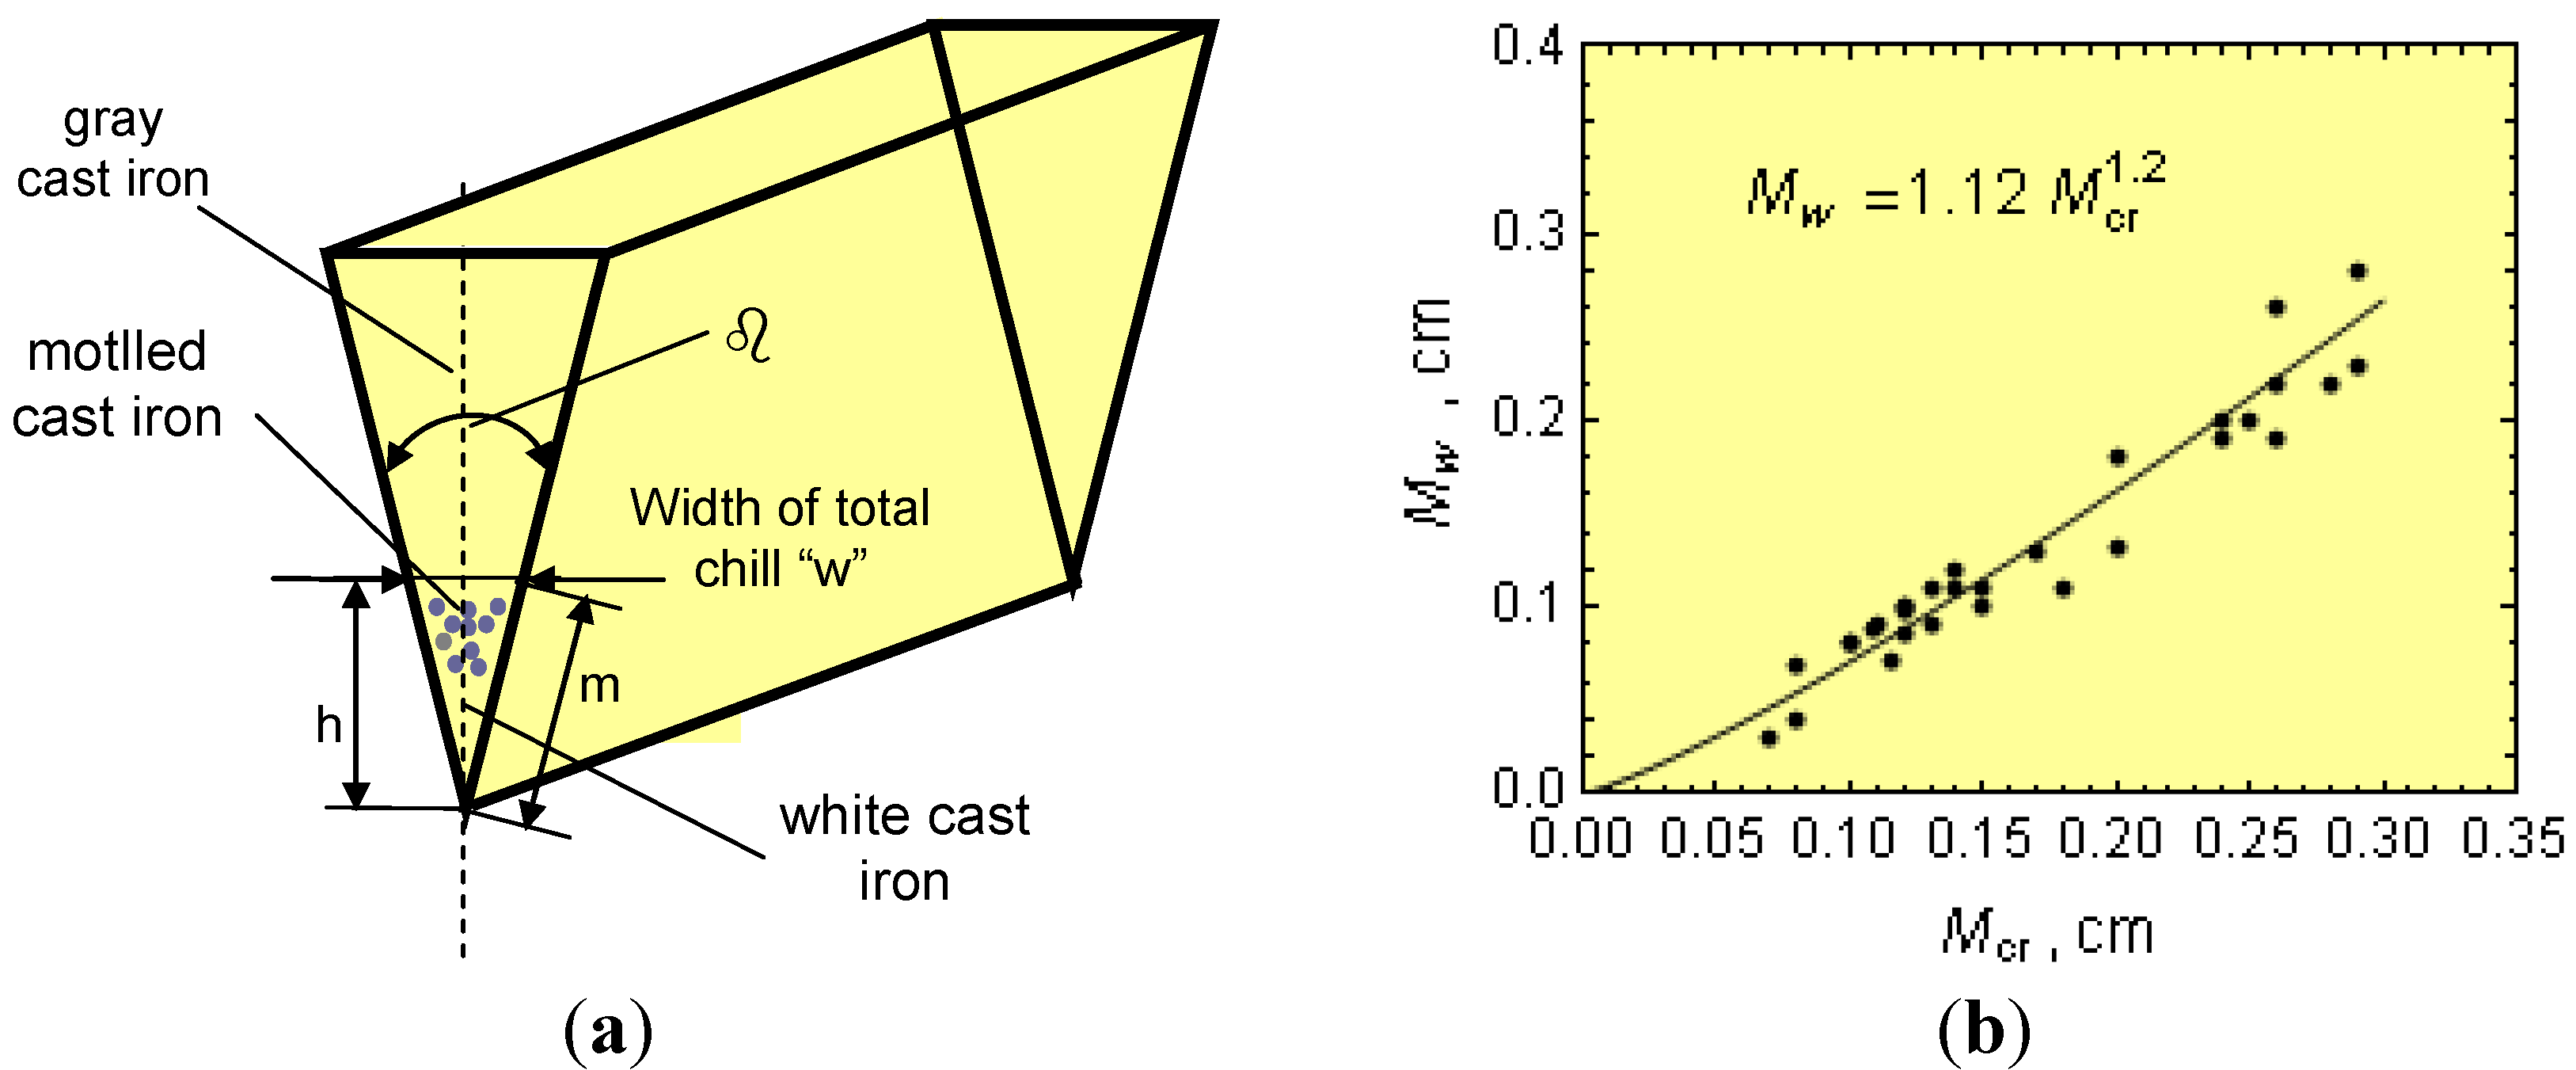
In foundry practice, an assessment of the chilling tendency of cast iron is based on the chill test methods established by the ASTM A367-55T standard. In this case, wedge geometries are employed (
Figure 4a). As a first approximation, it is assumed that the geometrical casting modulus,
Mw, of a wedge can be estimated by:
In the above expression, β is the wedge angle, F
ch is the half surface area chill triangle and h
cr and m are the critical chill height and length (
Figure 4a). Taking into account Equations (14) and (17), an expression is found that relates M
cr to M
w.
Figure 4.
(a) Wedge geometry and (b) relationship between the casting modulus of the wedge with the critical casting modulus.
Nevertheless, the wedge cannot be considered as a simple body. The wedge thin sections are heated up from the thicker sections, and this is not taken into account in Equation (16). Accordingly, Equation (17) is corrected to reflect this effect. Considering the experimental w and β values and plugging them into Equation (16), the modulus
Mw can be estimated.
Figure 4b shows the relationship between the modulus
Mw and
Mcr. Notice from this figure that
Mw ≠
Mcr and that the function
Mw =
f(
Mcr) can be described by:
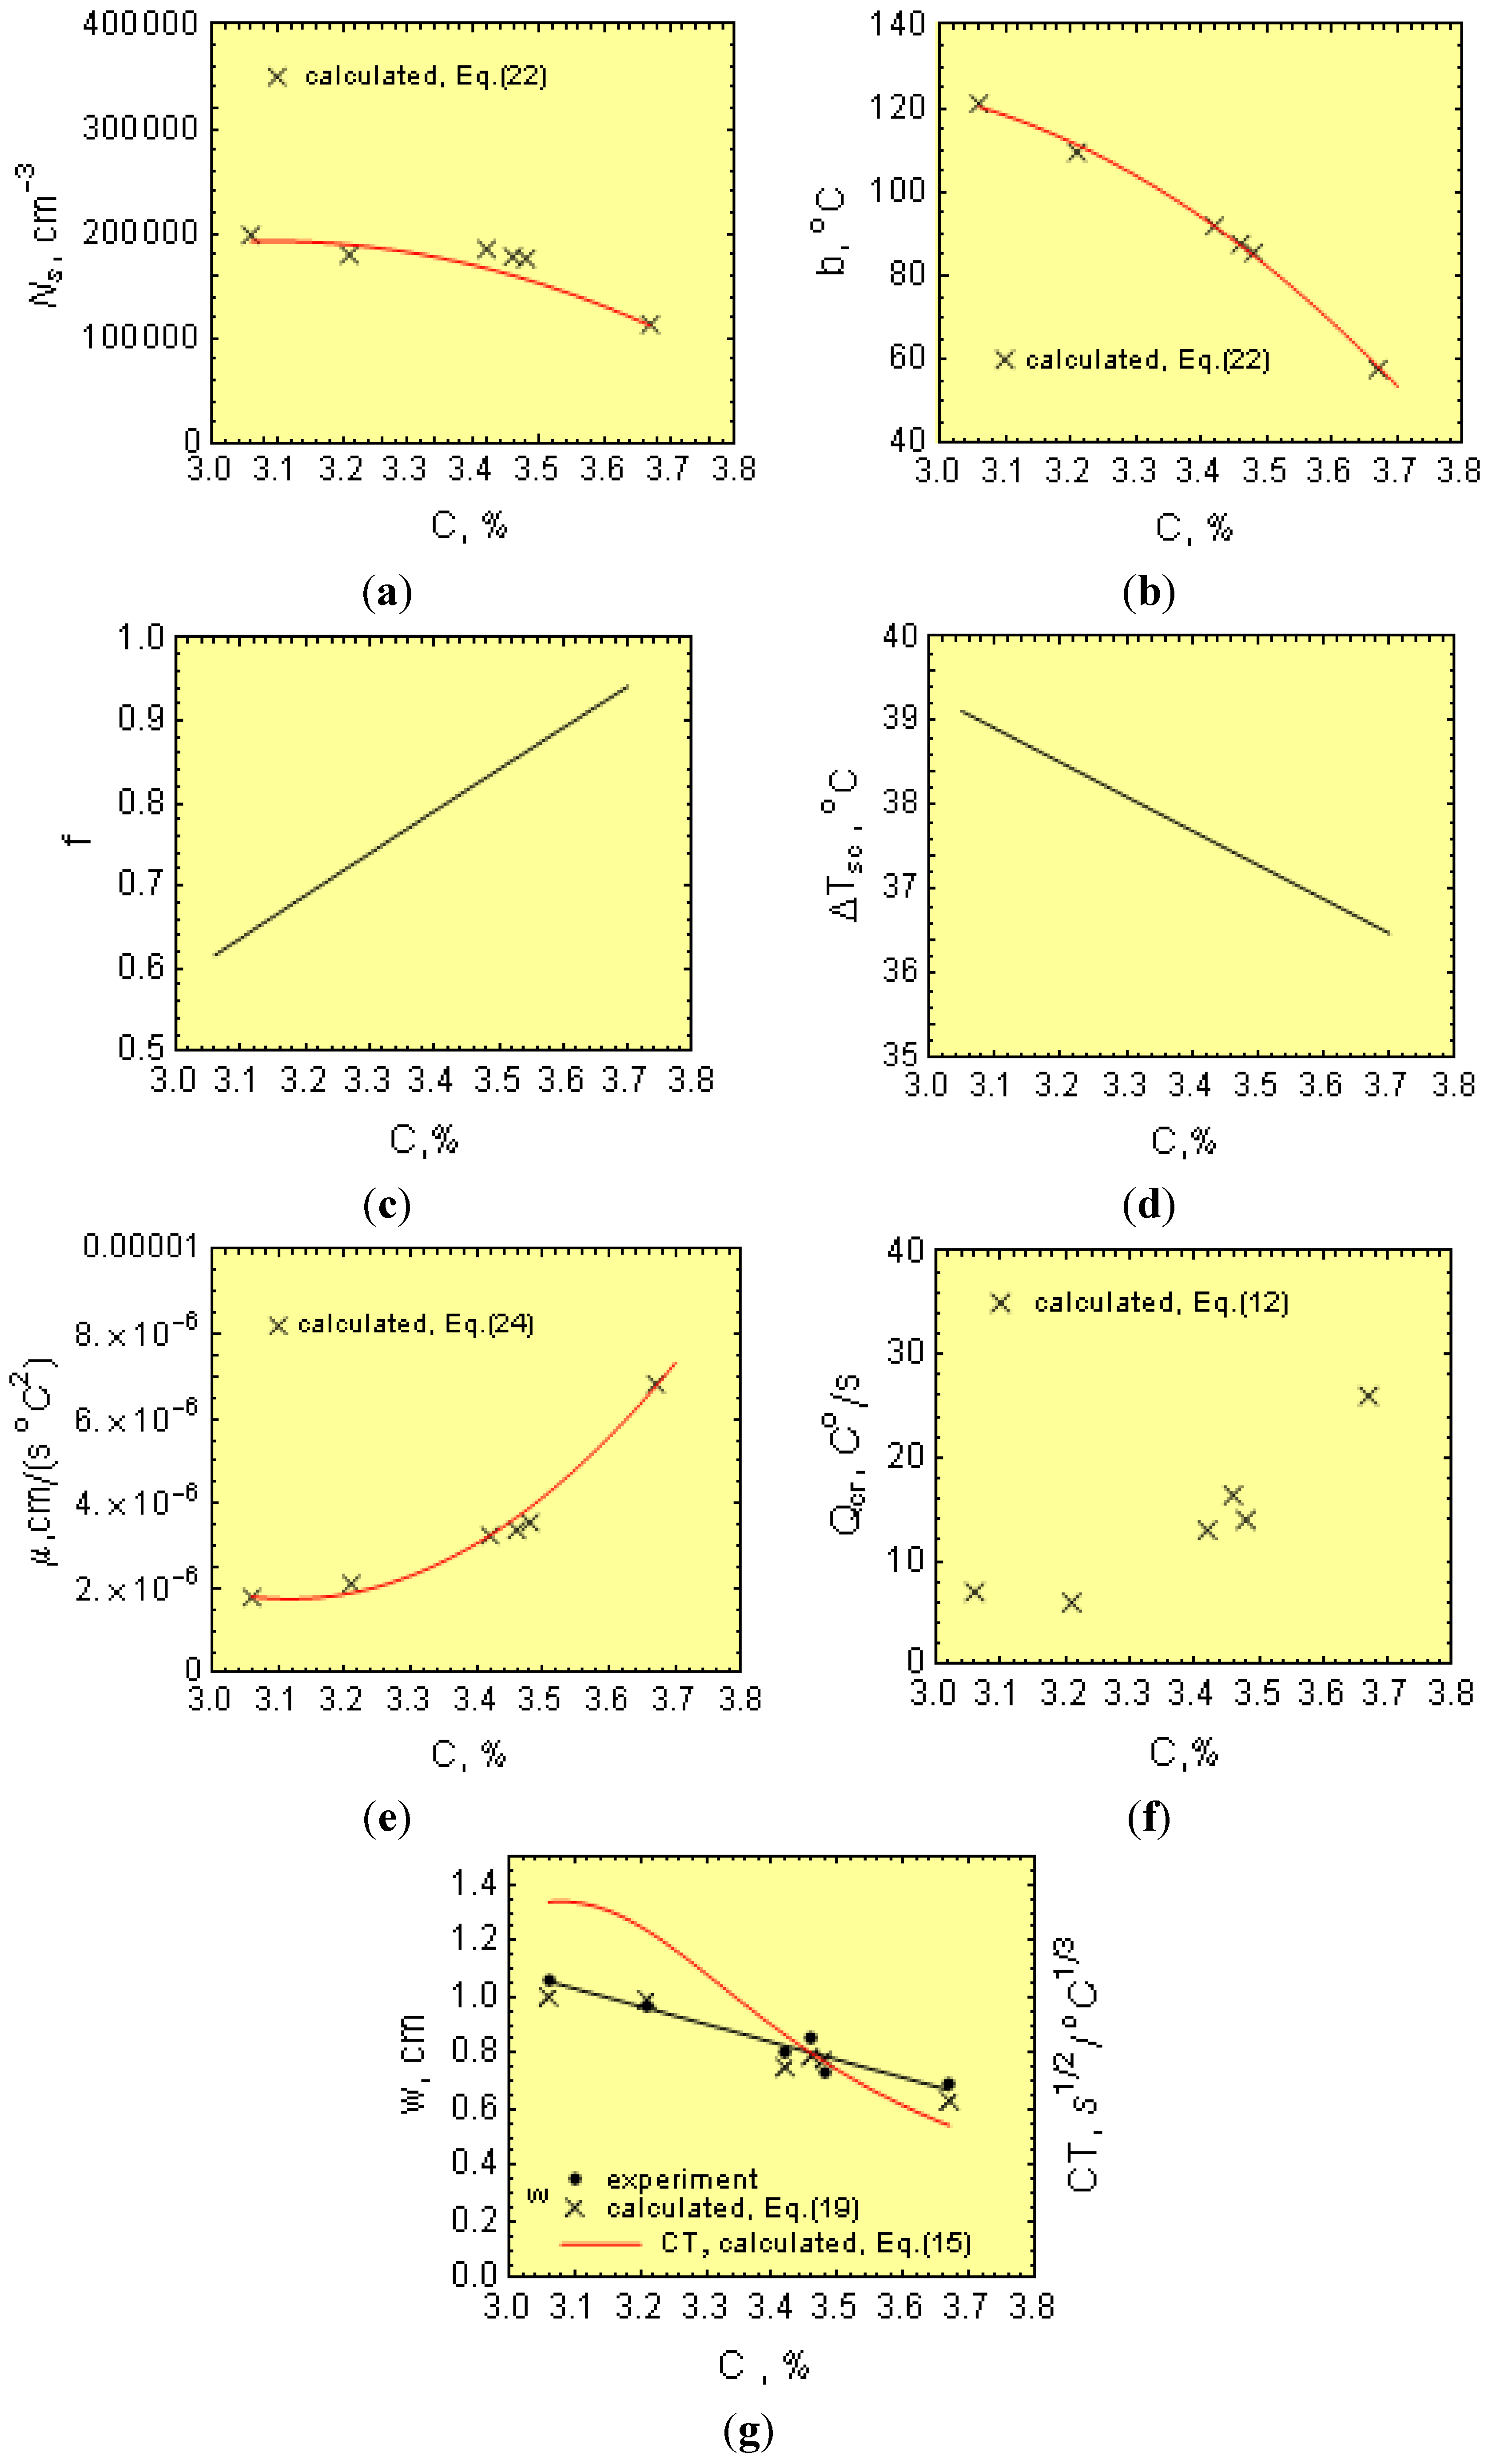
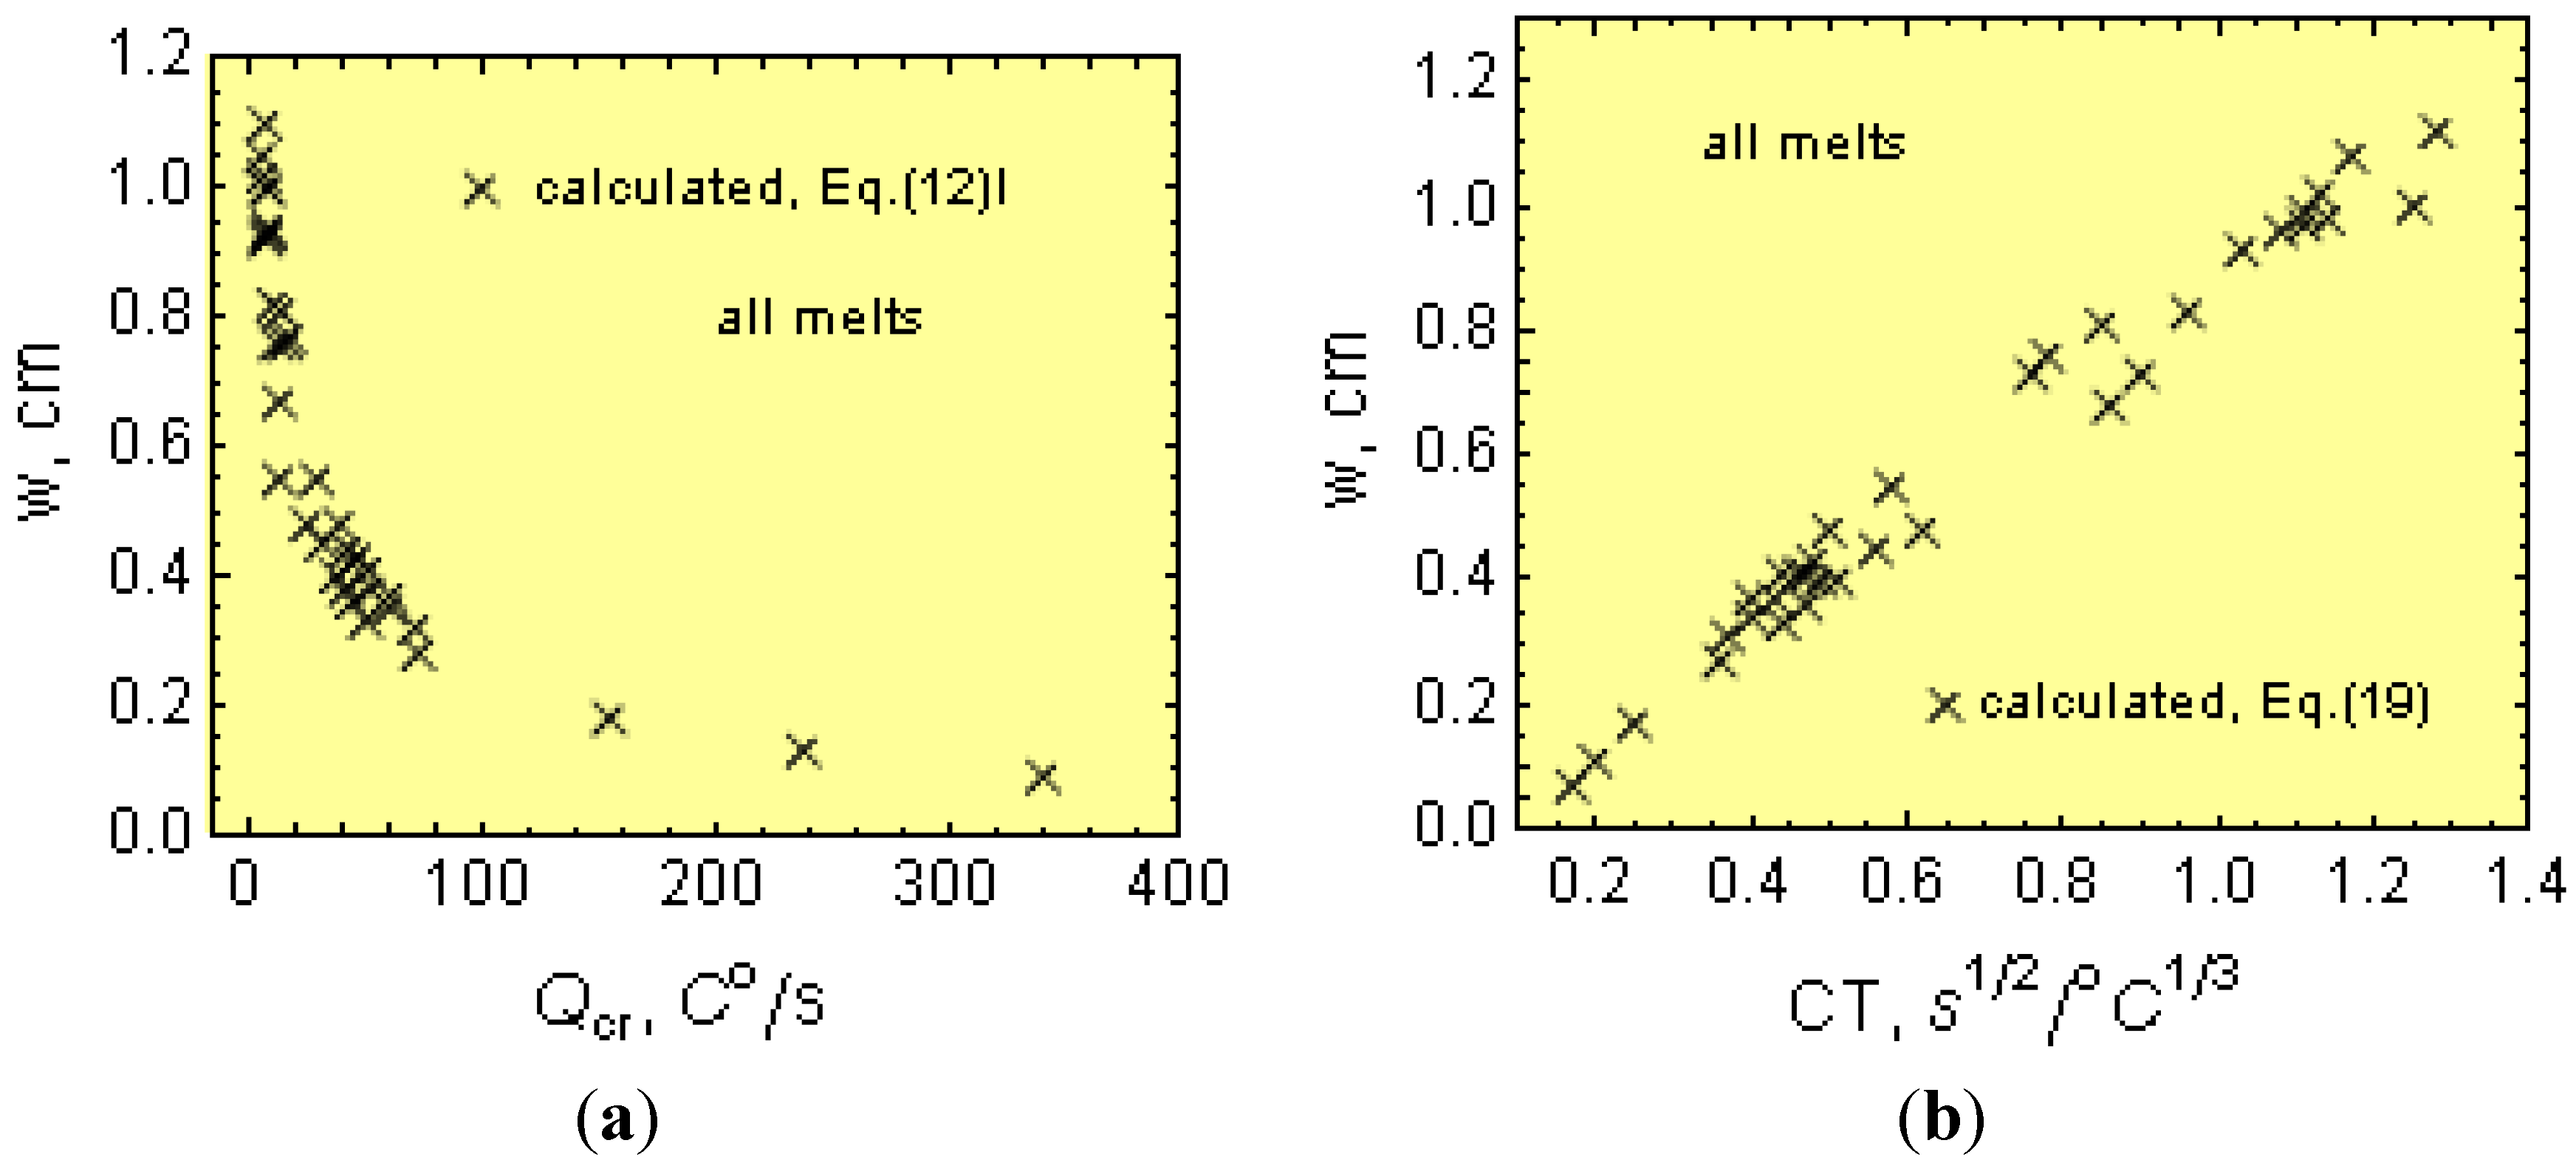
Thus, by combining Equations (16) to (18), the “w” can be expressed as a function of the CT.
Notice that w depends additionally on the p coefficient, which includes parameters related to the cooling rate (Equation (4)), that is:
The ability for the mold to absorb heat, a;
The ϕ parameter, Equation (7), which depends on the B and B1 values (Equation (8)), that is on the initial temperature, Ti, of the cast iron just after pouring the wedges.
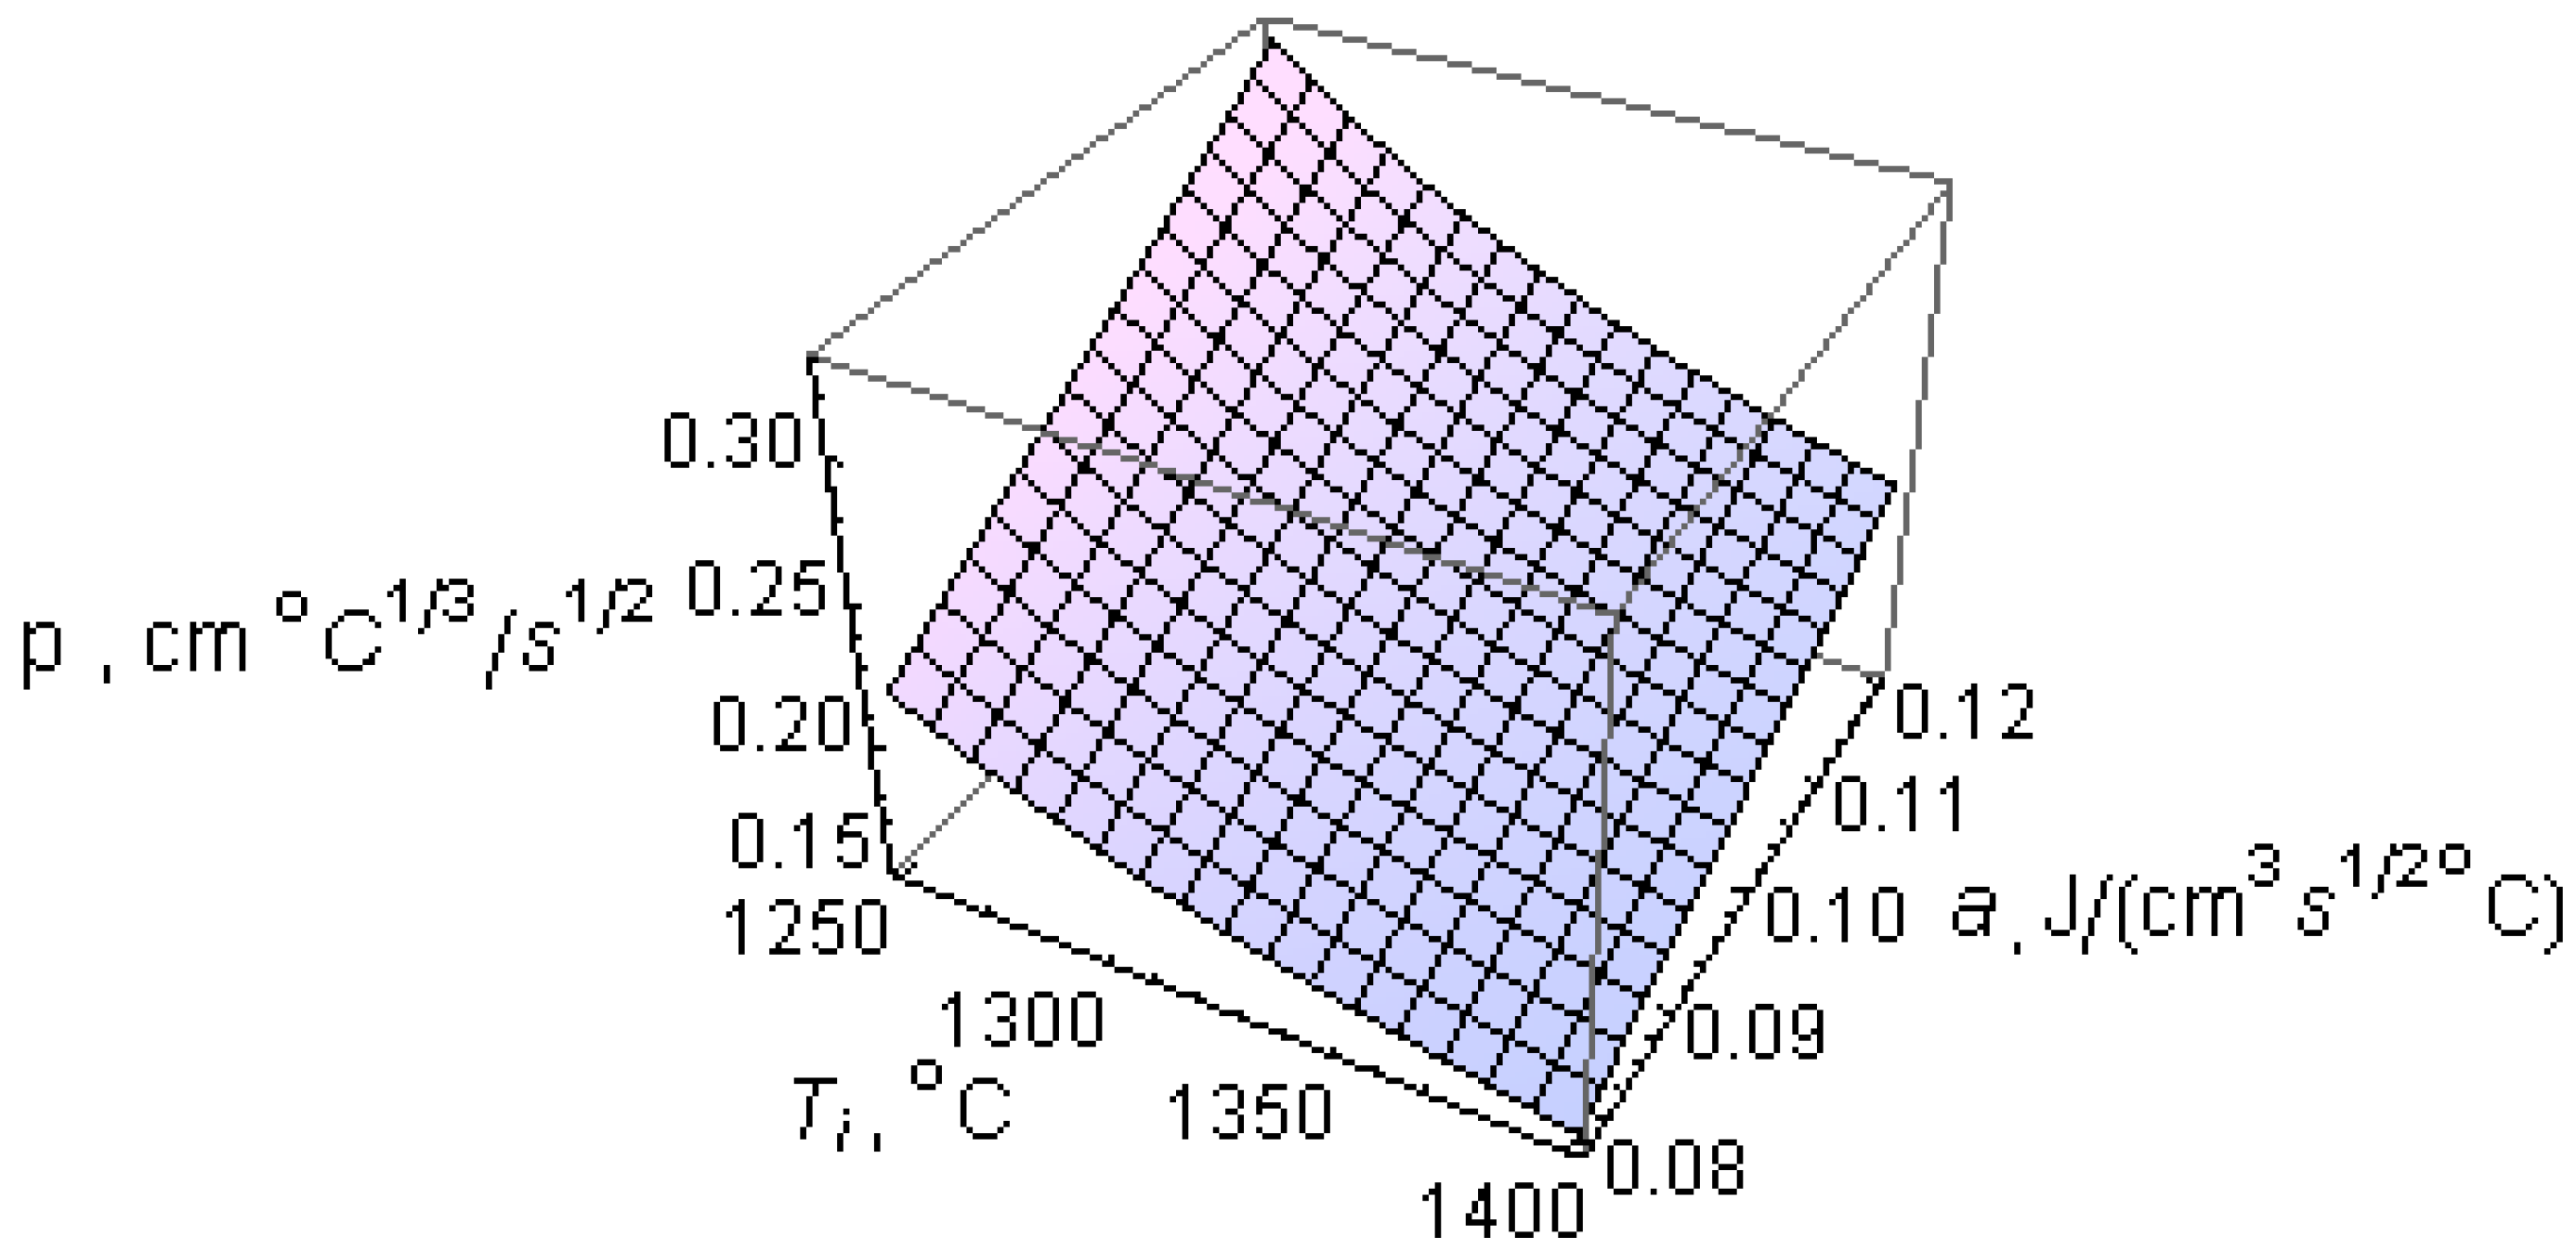
The effect of
Ti and the ability of the wedge mold to absorb heat, a, on the p parameter is shown in
Figure 5. Notice that the p parameter increases as the pouring temperature
Tp (and, hence,
Ti) decreases, and the ability of the wedge mold to absorb heat increases. As a result, wedge removal at lower temperatures from molds with mold materials having an increasing ability to absorb heat, a (
Table 2), leads to increasing chills in order to keep CT constant.
Figure 5.
Effect of initial liquid metal temperature just after pouring into the mold, Ti, and the ability of the mold to absorb heat, a, on the p parameter.
Table 2.
Reported a values for mold materials [11,16,17].
| Mold Material | Material Mold Ability to Absorb Heat, a, J/(cm2·°C·s1/2) |
|---|
| Chromite | 0.15 |
| Zircon | 0.13−0.15 |
| Quartz sand | 0.08–0.12 |
| Olivine | 0.10 |
| Chemically-bonded urethane molding sand | 0.10–0.12 |
| Chemically-bonded furan molding sand | 0.08–0.10 |
| Chemically-bonded shell molding sand | 0.10–0.11 |
| LDASC | 0.018–0.03 |
2. Experimental Section
Experimental melts were made in two stages. In the first stage, 40-mm diameter bars containing pig iron and scrap steel were prepared. The scrap composition consisted of Sorelmetal (4.27% C, 0.132% Si, 0.13% Mn, 0.026% P, 0.005% S) and steel scrap (0.2% C, 0.02% Si). In the second stage, the bars, together with various additives, such as carbon, Si, Fe-P and Fe-S, were charged into an induction furnace with a capacity of 1.5 kg. Melting was carried out at low temperatures (
i.e., below the equilibrium temperature for the 2C + SiO
2 = Si + 2CO reaction in order to avoid C losses as CO to the atmosphere [
18]). In addition, low S and Mn contents were employed in order to minimize the formation of MnS compounds [
19,
20]. In this case, a manganese to sulfur ratio (Mn/S) of 1.7 was assumed to be “balanced” [
20]. The aim of using these Mn/S ratios was to investigate the effect of the excess Mn and S on the CT and chill.
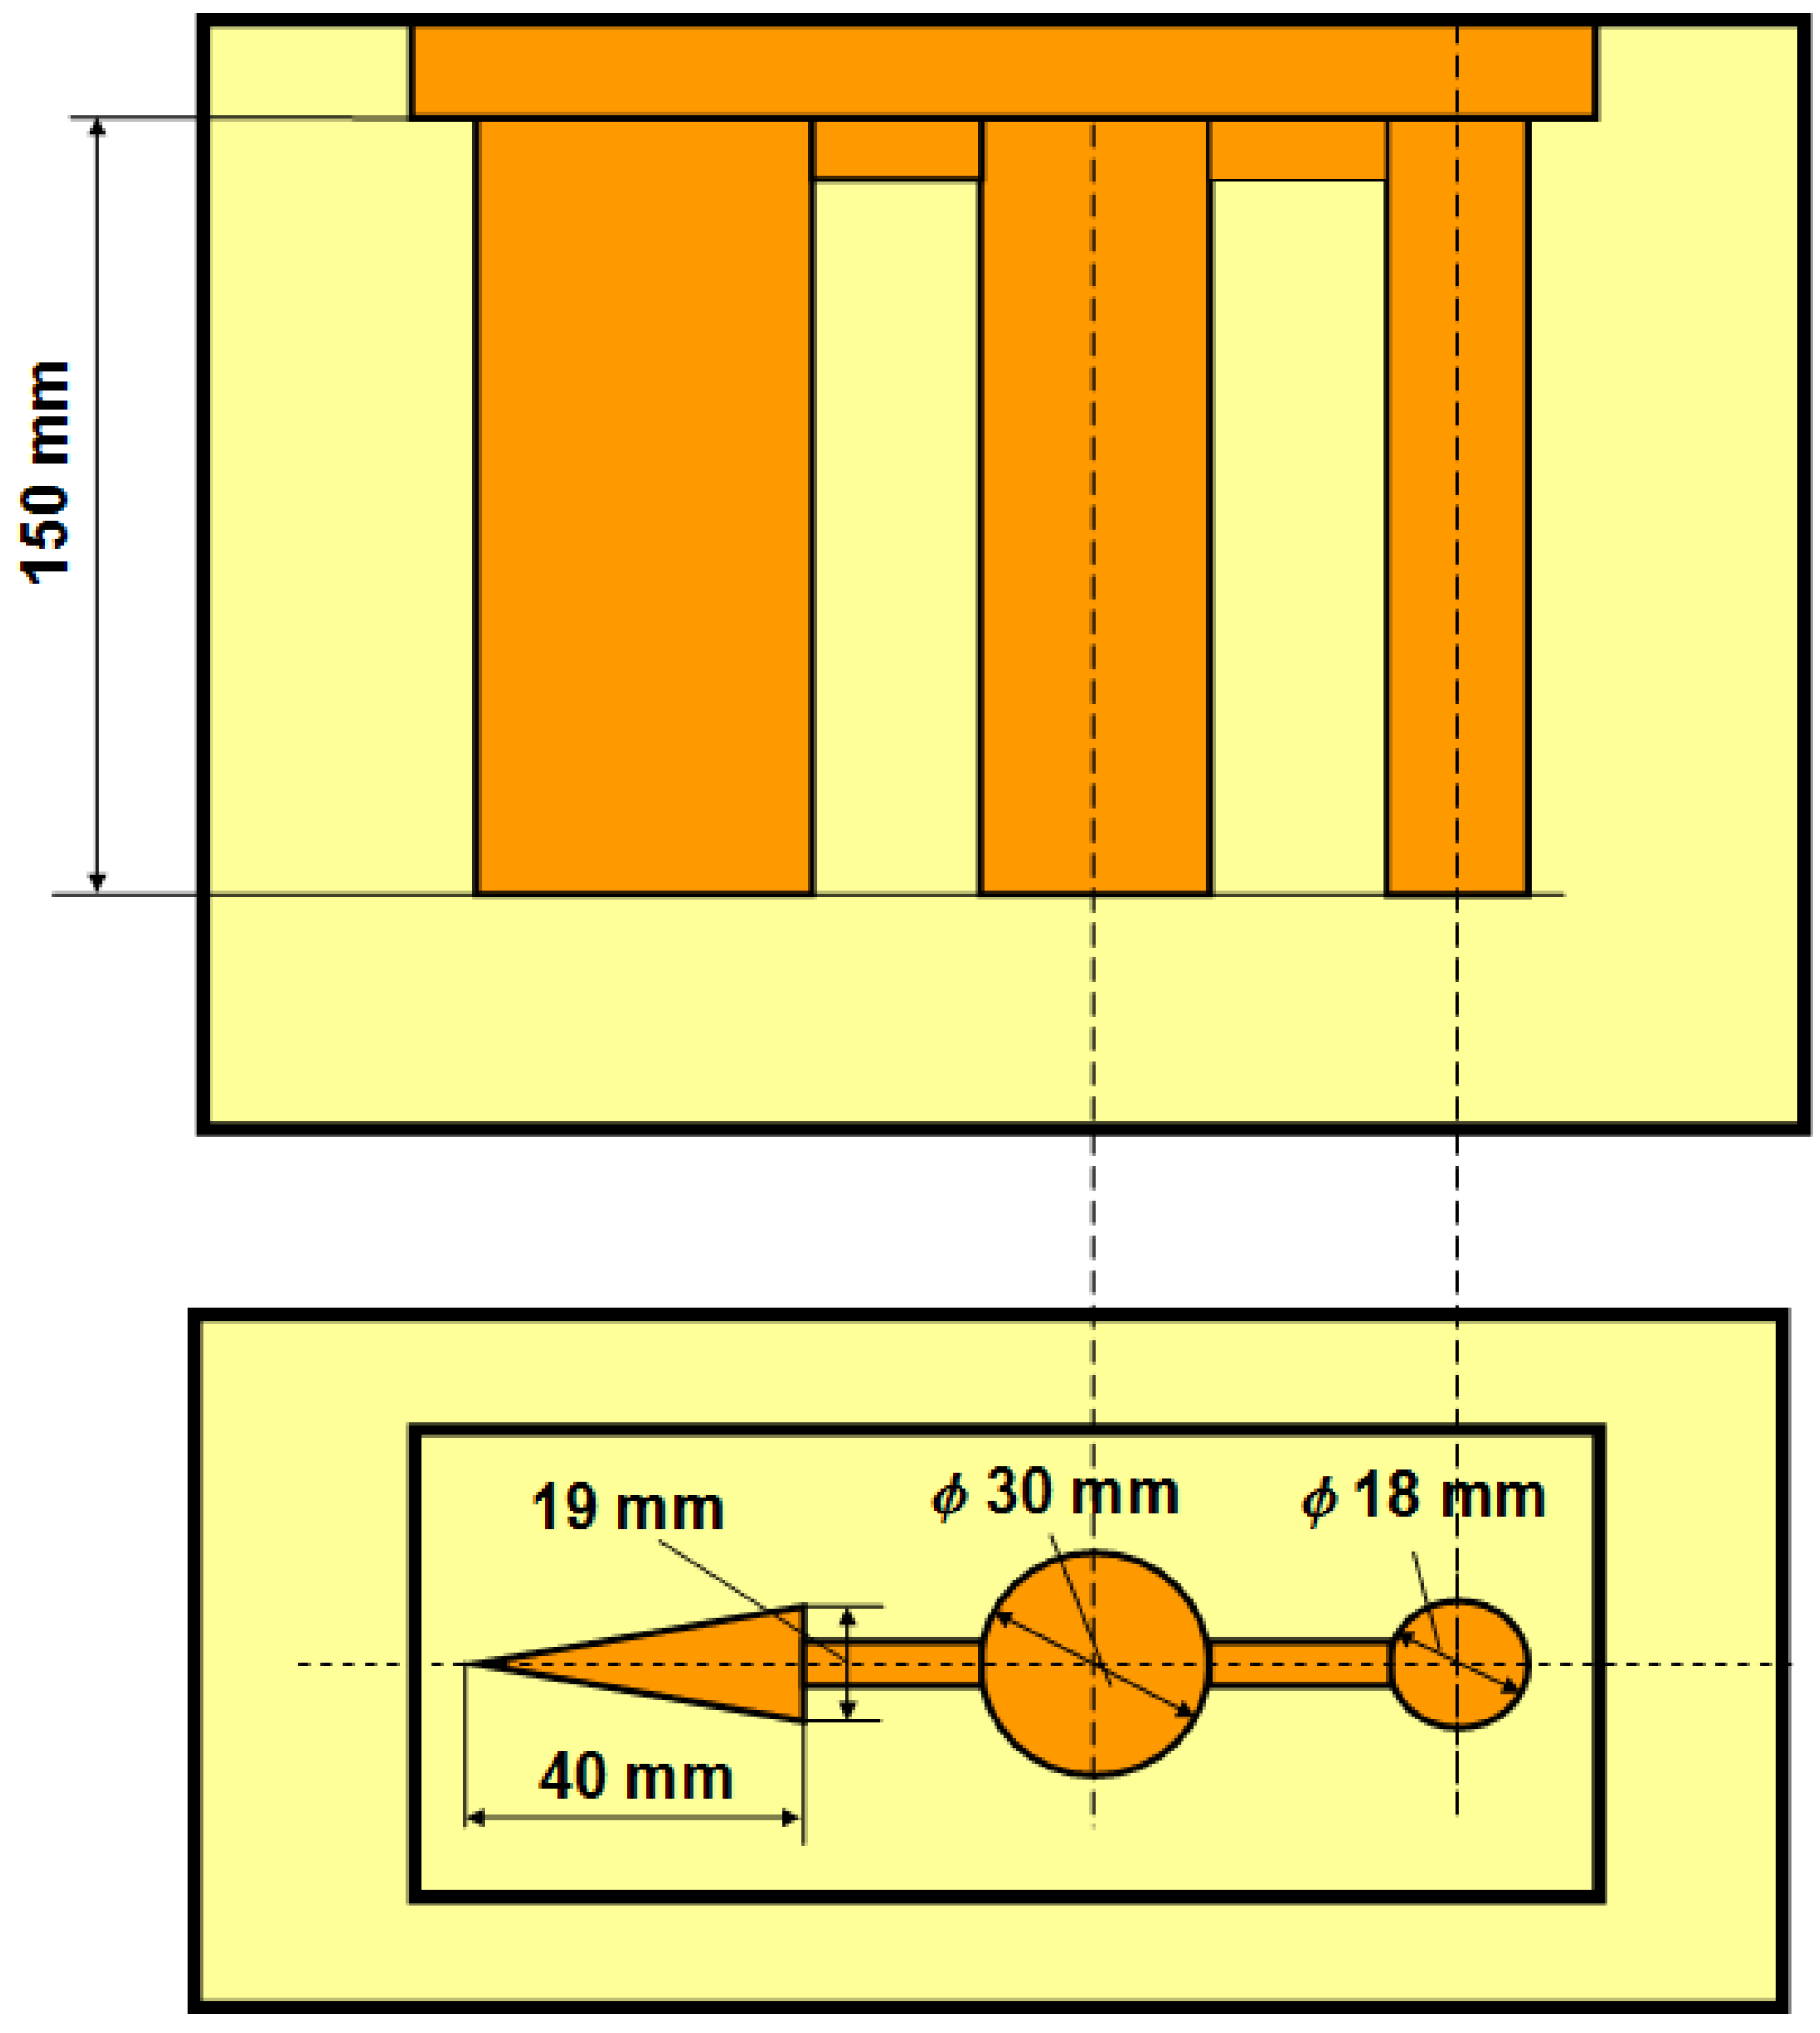
After melting and overheating to 1653 K (1380 °C), molten iron was cast into resin-bound foundry molds with bar shapes of 18 and 28 mm in diameter, as well as wedges (see
Figure 6). From each melt, a sample was taken for chemical analysis.
Figure 6.
Mold for casting bars and wedges.
Pt-PtRh10 thermocouples were inserted in the center of the wedge and bar cavities of the sand molds. An Agilent 34970A electronic module was employed for numerical temperature recording.
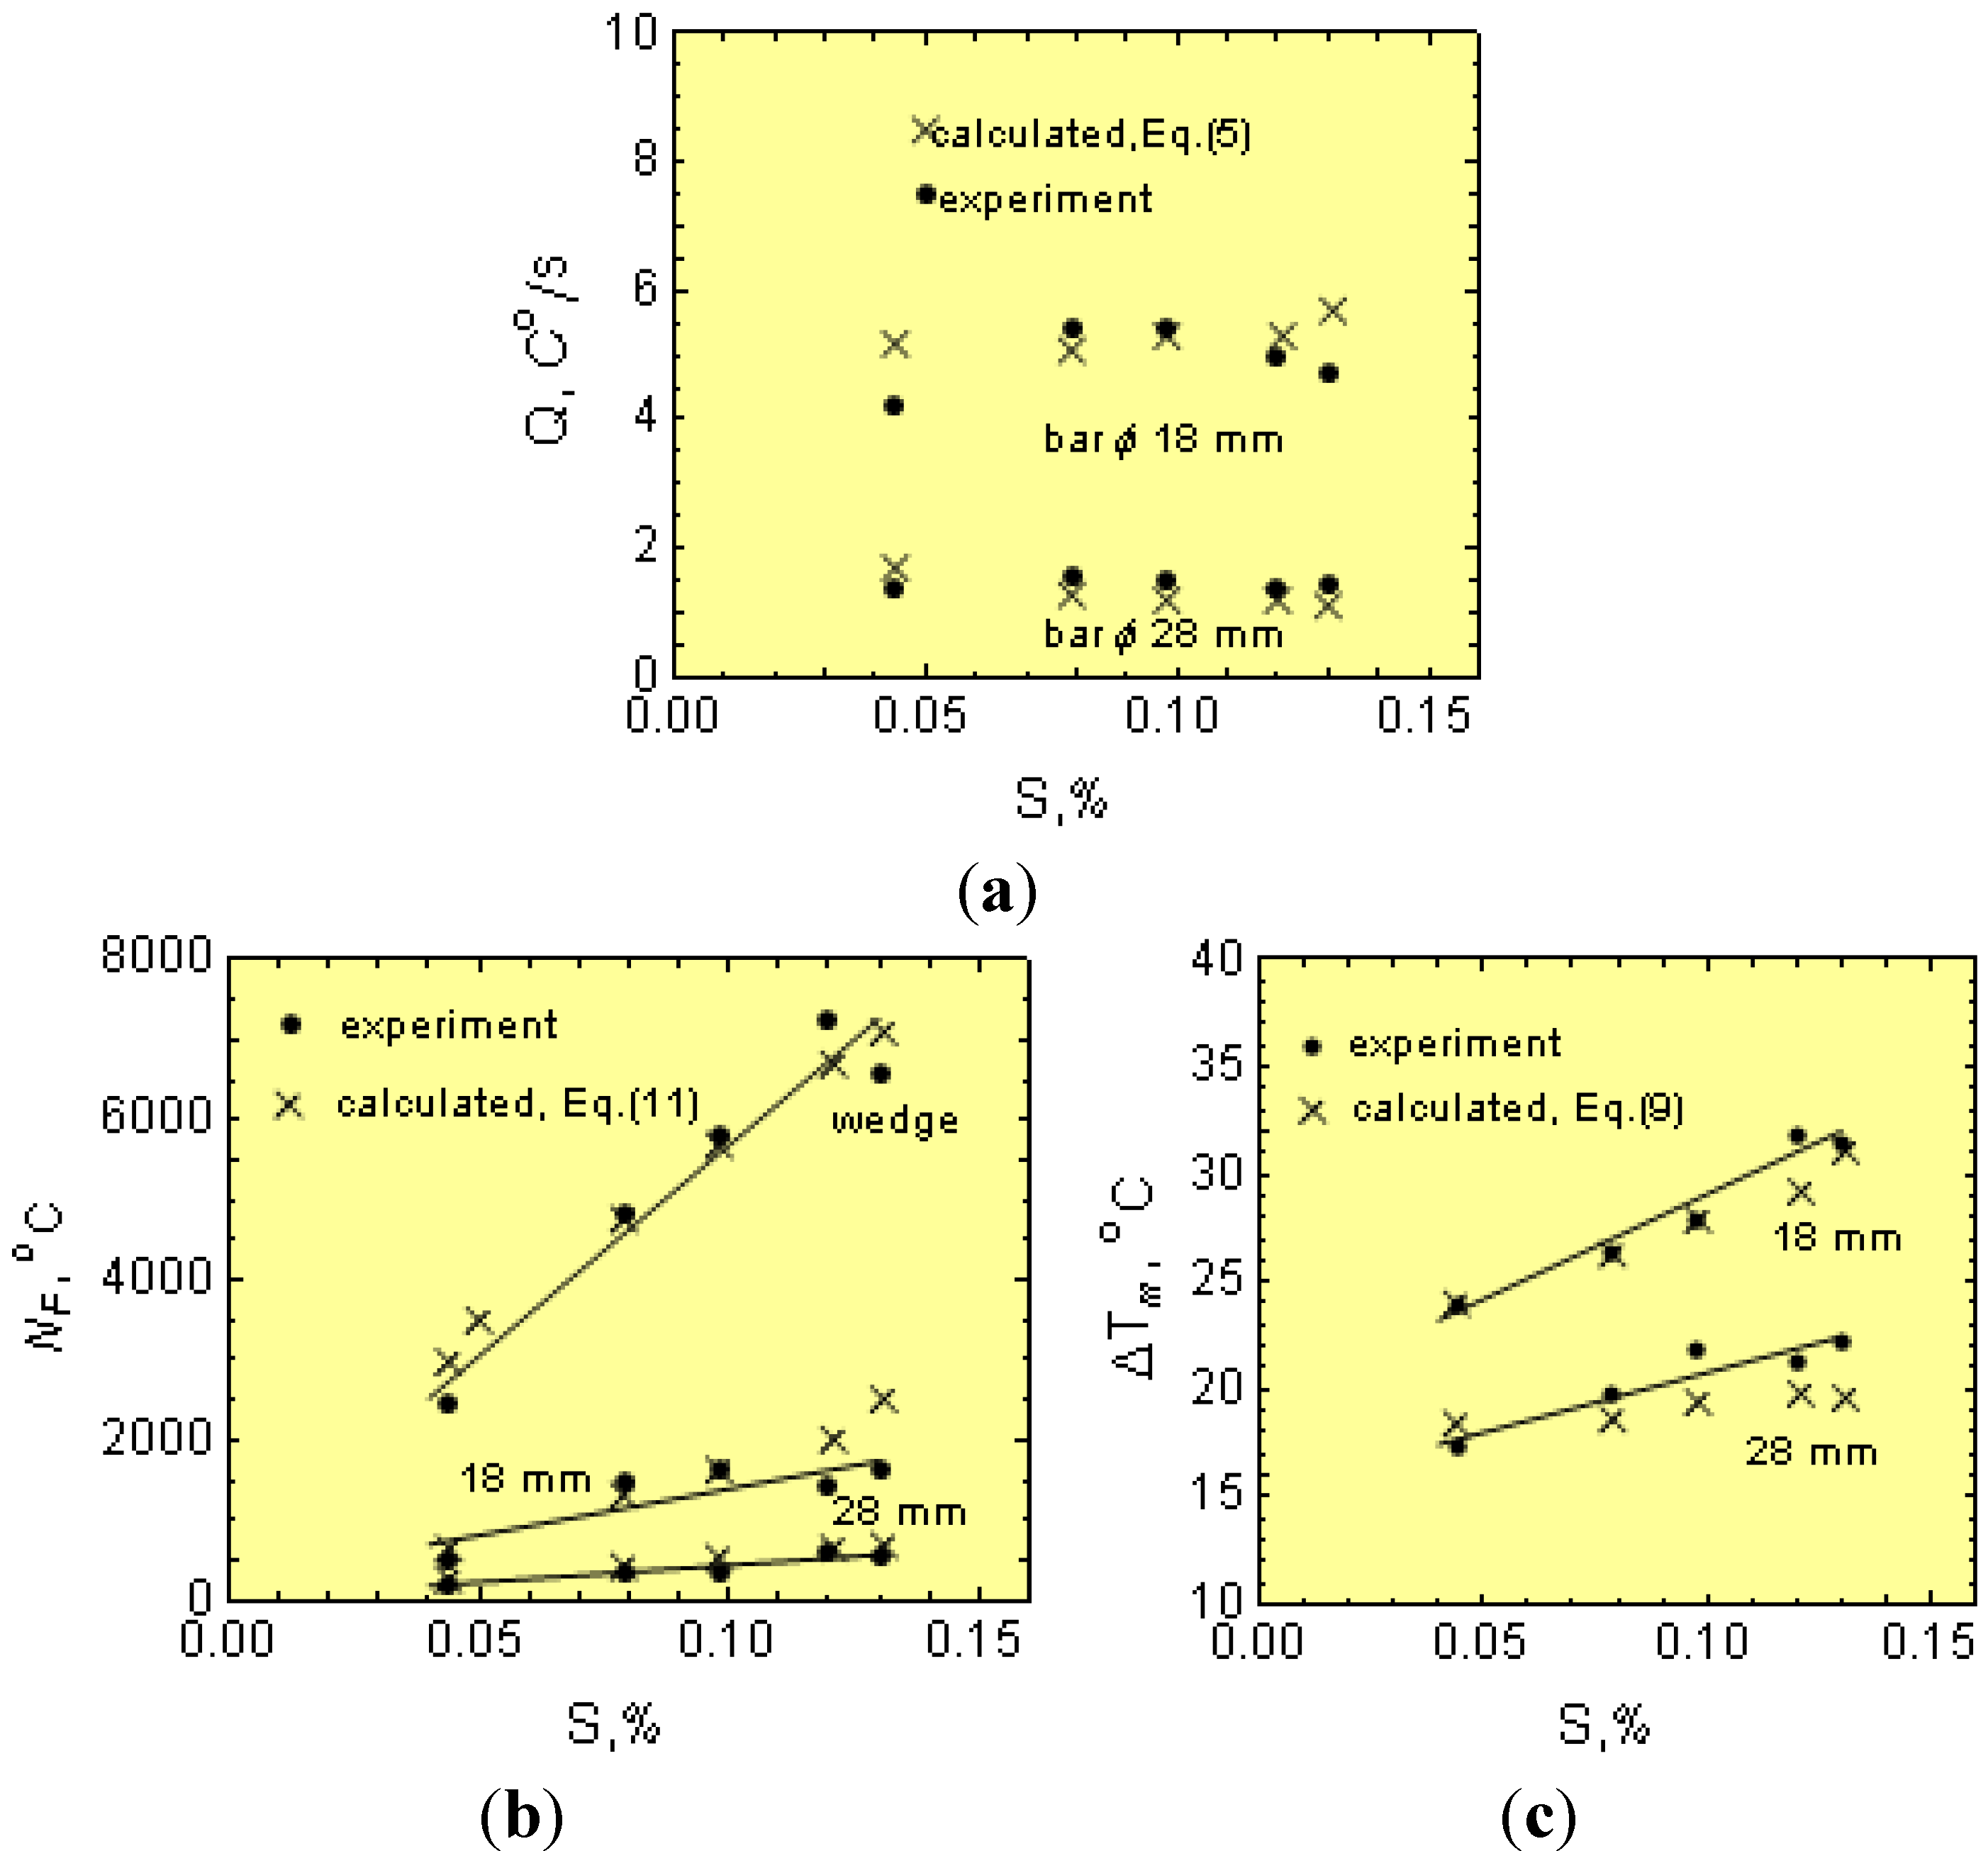
Figure 1 shows a typical cooling curve. The cooling curves were used for determinations of
Ti just after filling the molds,
Tm, ∆
Tm =
Ts −
Tm and Q at the graphite eutectic equilibrium temperature,
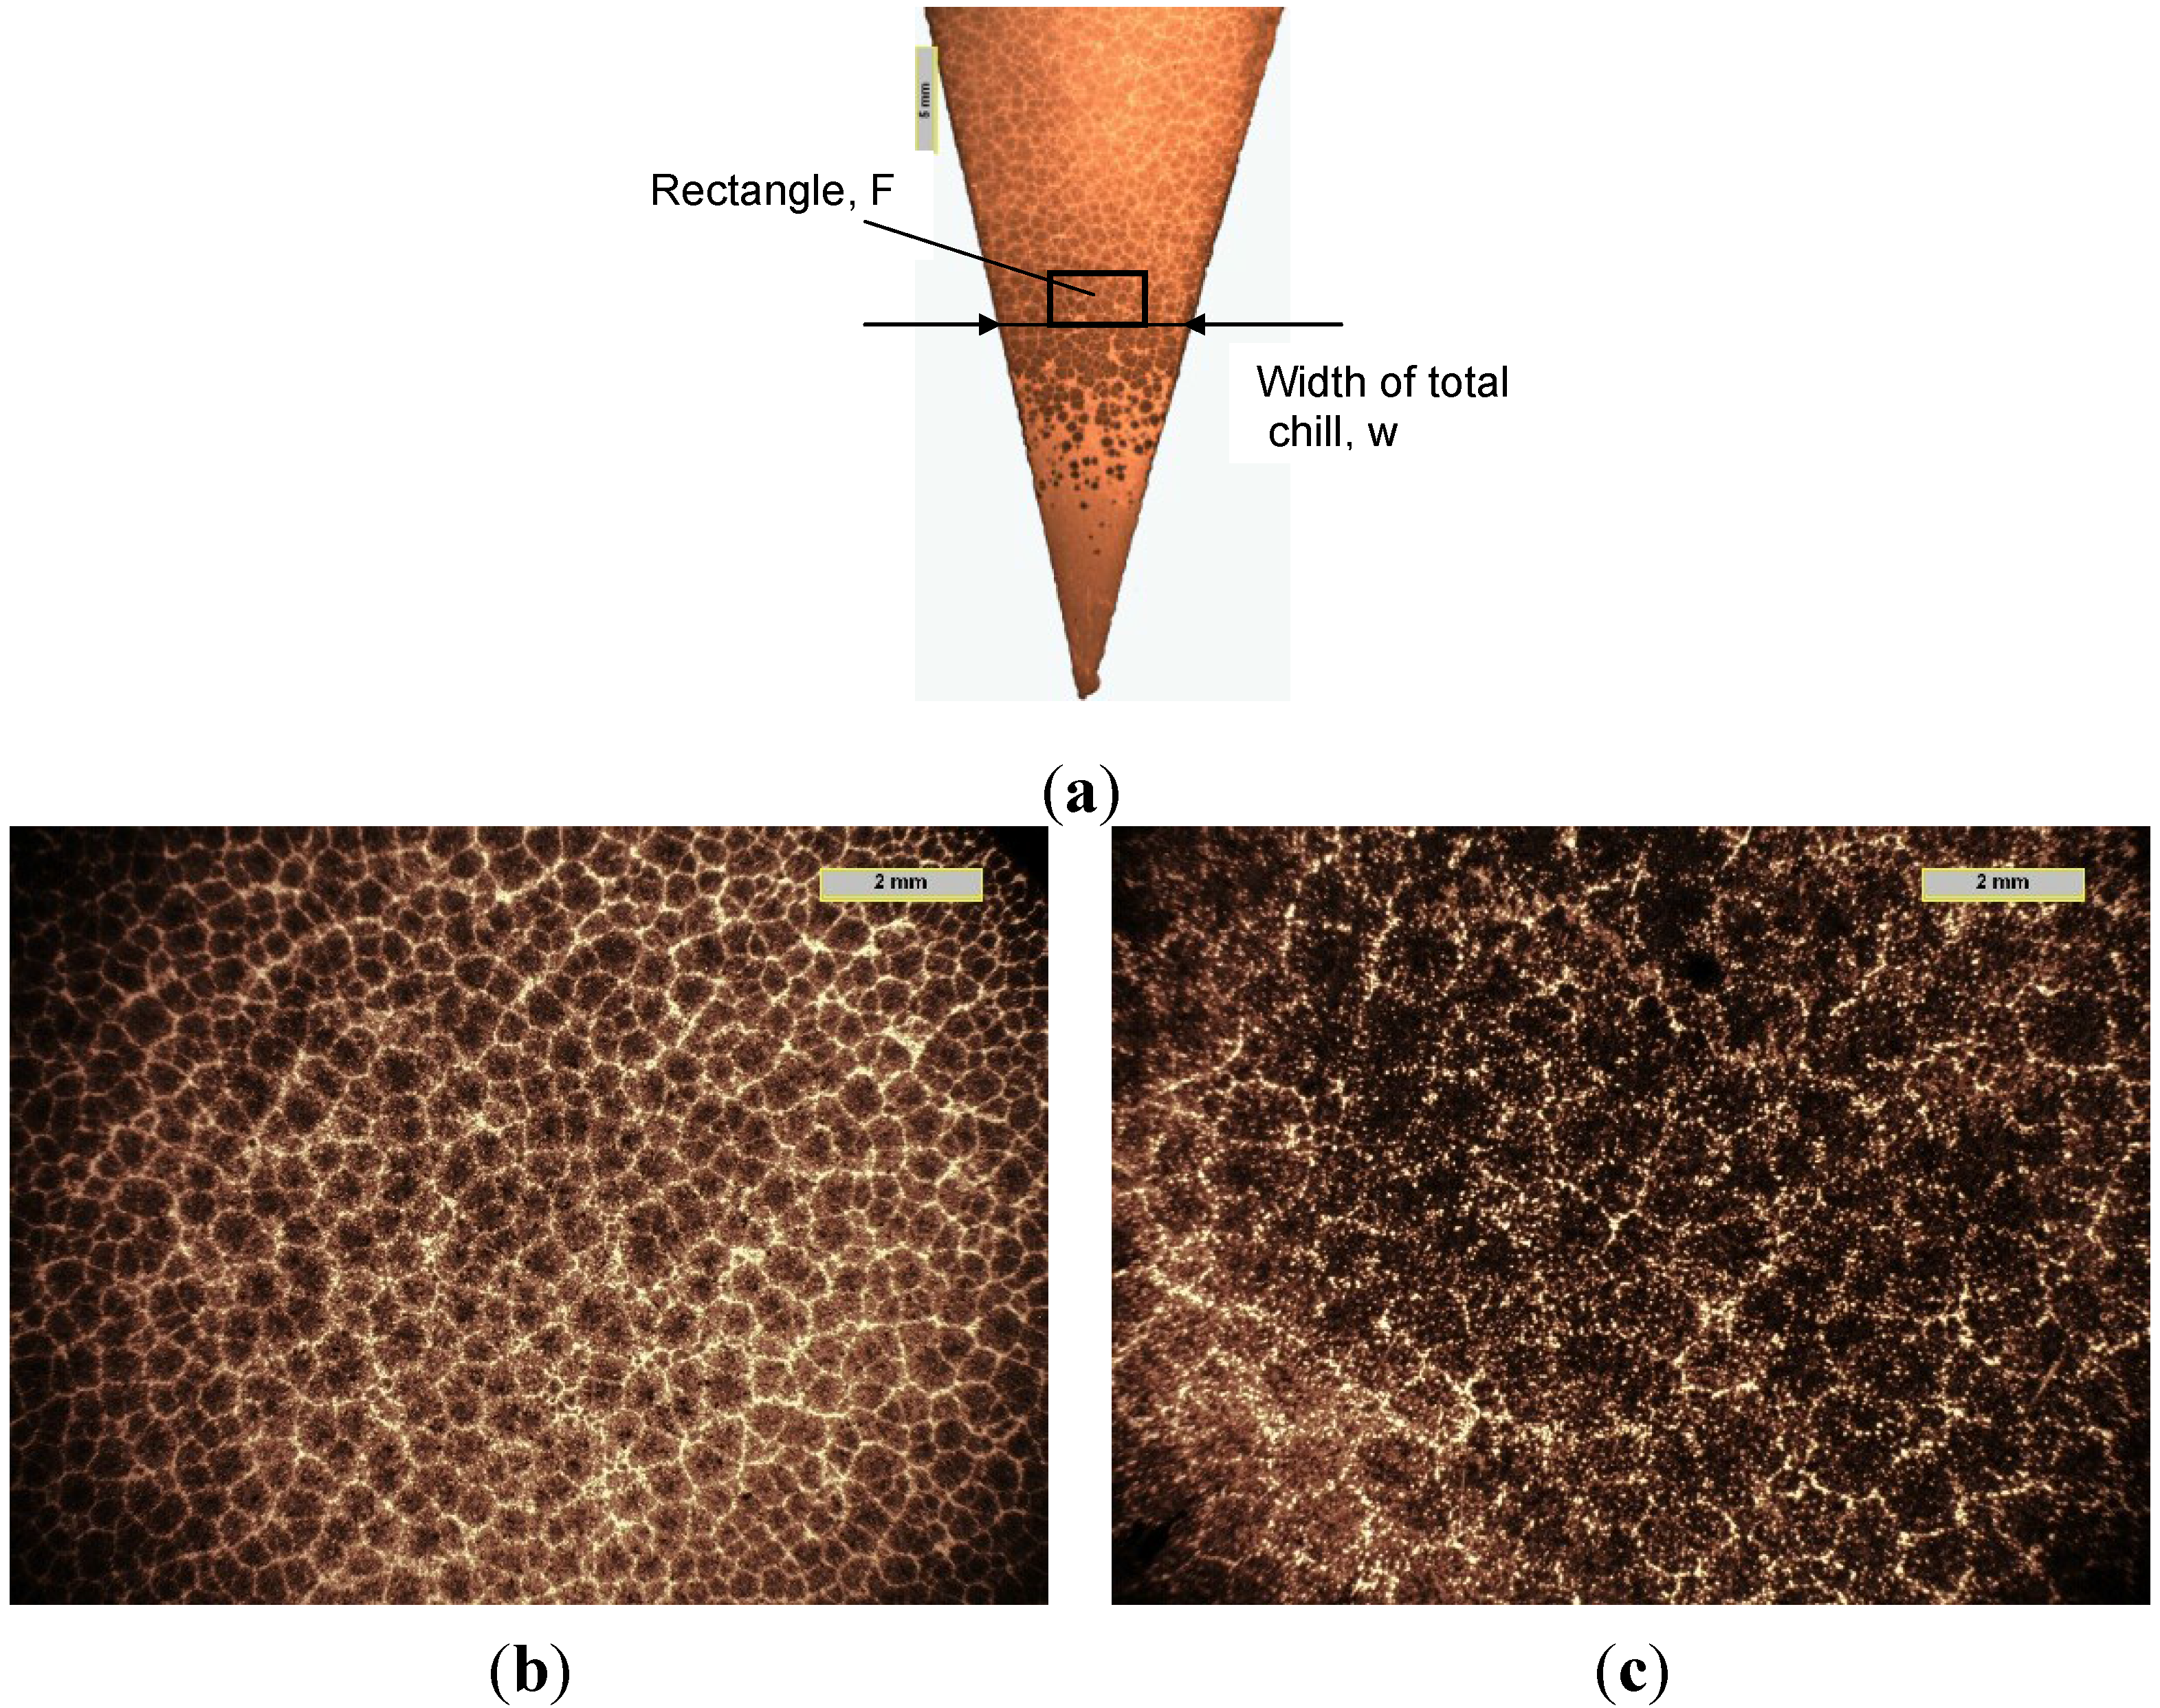
Ts. After solidification, specimens for metallographic examination were taken from the wedges and bars. Metallographic examinations were made on specimen cross-sections. After etching the wedges (using nital), the width (w) of the total chill was measured at the gray cast iron-chilled iron intersections (see
Figure 7). The wedges and bars were polished and etched using Stead reagent to reveal the graphite eutectic cell boundaries (
Figure 7). Determinations of planar cell counts, N
F, were made according to the so-called Variant II of the Jeffries method and by applying the Saltykov formula as an unbiased estimator for the rectangle of observation [
21]:
where
Ni is the number of eutectic cells inside the measuring rectangle,
Nr is the eutectic cell count that intersects the sides of the rectangle, but not its corners, and
F is the surface area of the rectangle. The graphite eutectic cells have a granular morphology; hence, it can be assumed that the spatial grain configurations follow the so-called Poisson–Voronoi model [
22]. A stereological formula can then be used for determinations of the volumetric cell count N, which yields the average number of eutectic cells per volume [
22].
The cell count,
NF,cr, measured in wedges from the rectangular surface
F (
Figure 7a) at the gray cast iron-chilled iron intersections is considered as the critical cell count,
NF,cr, and it is converted into a volumetric cell count,
Ncr (Equation (19)). An average of 10 readings was used per data point.
Figure 7.
(a) Eutectic cells in a wedge-shaped casting; (b) bar ϕ 18 mm and (c) bar ϕ 28 mm.
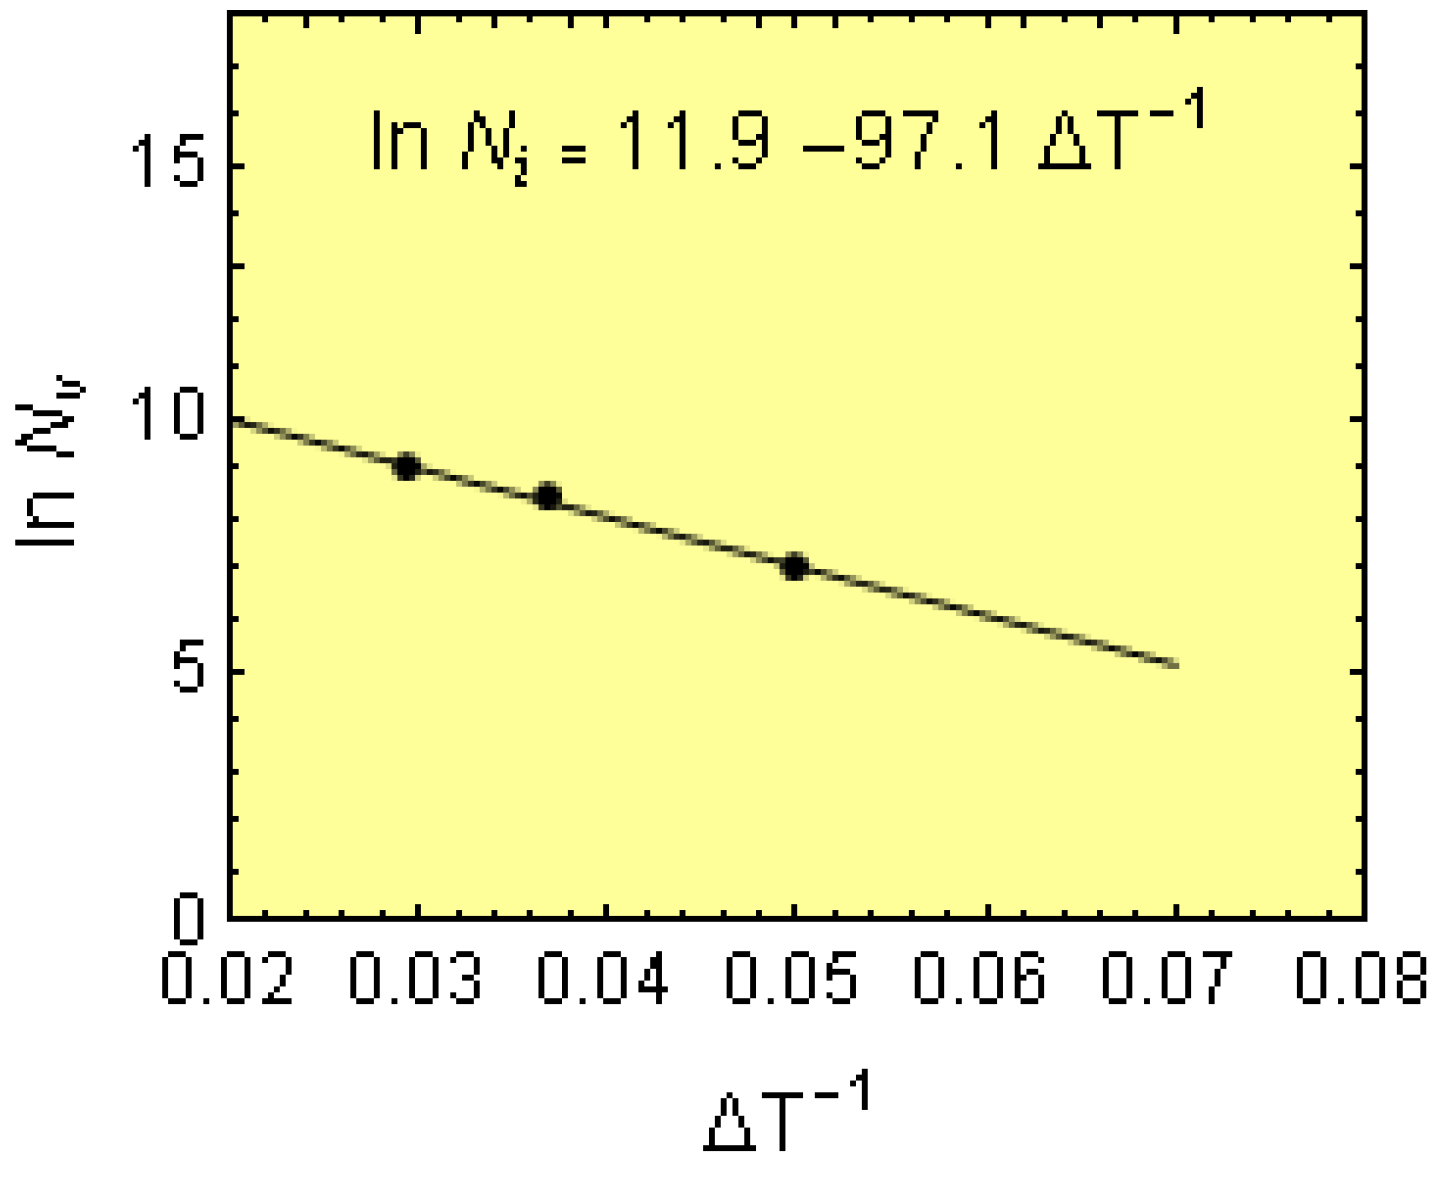
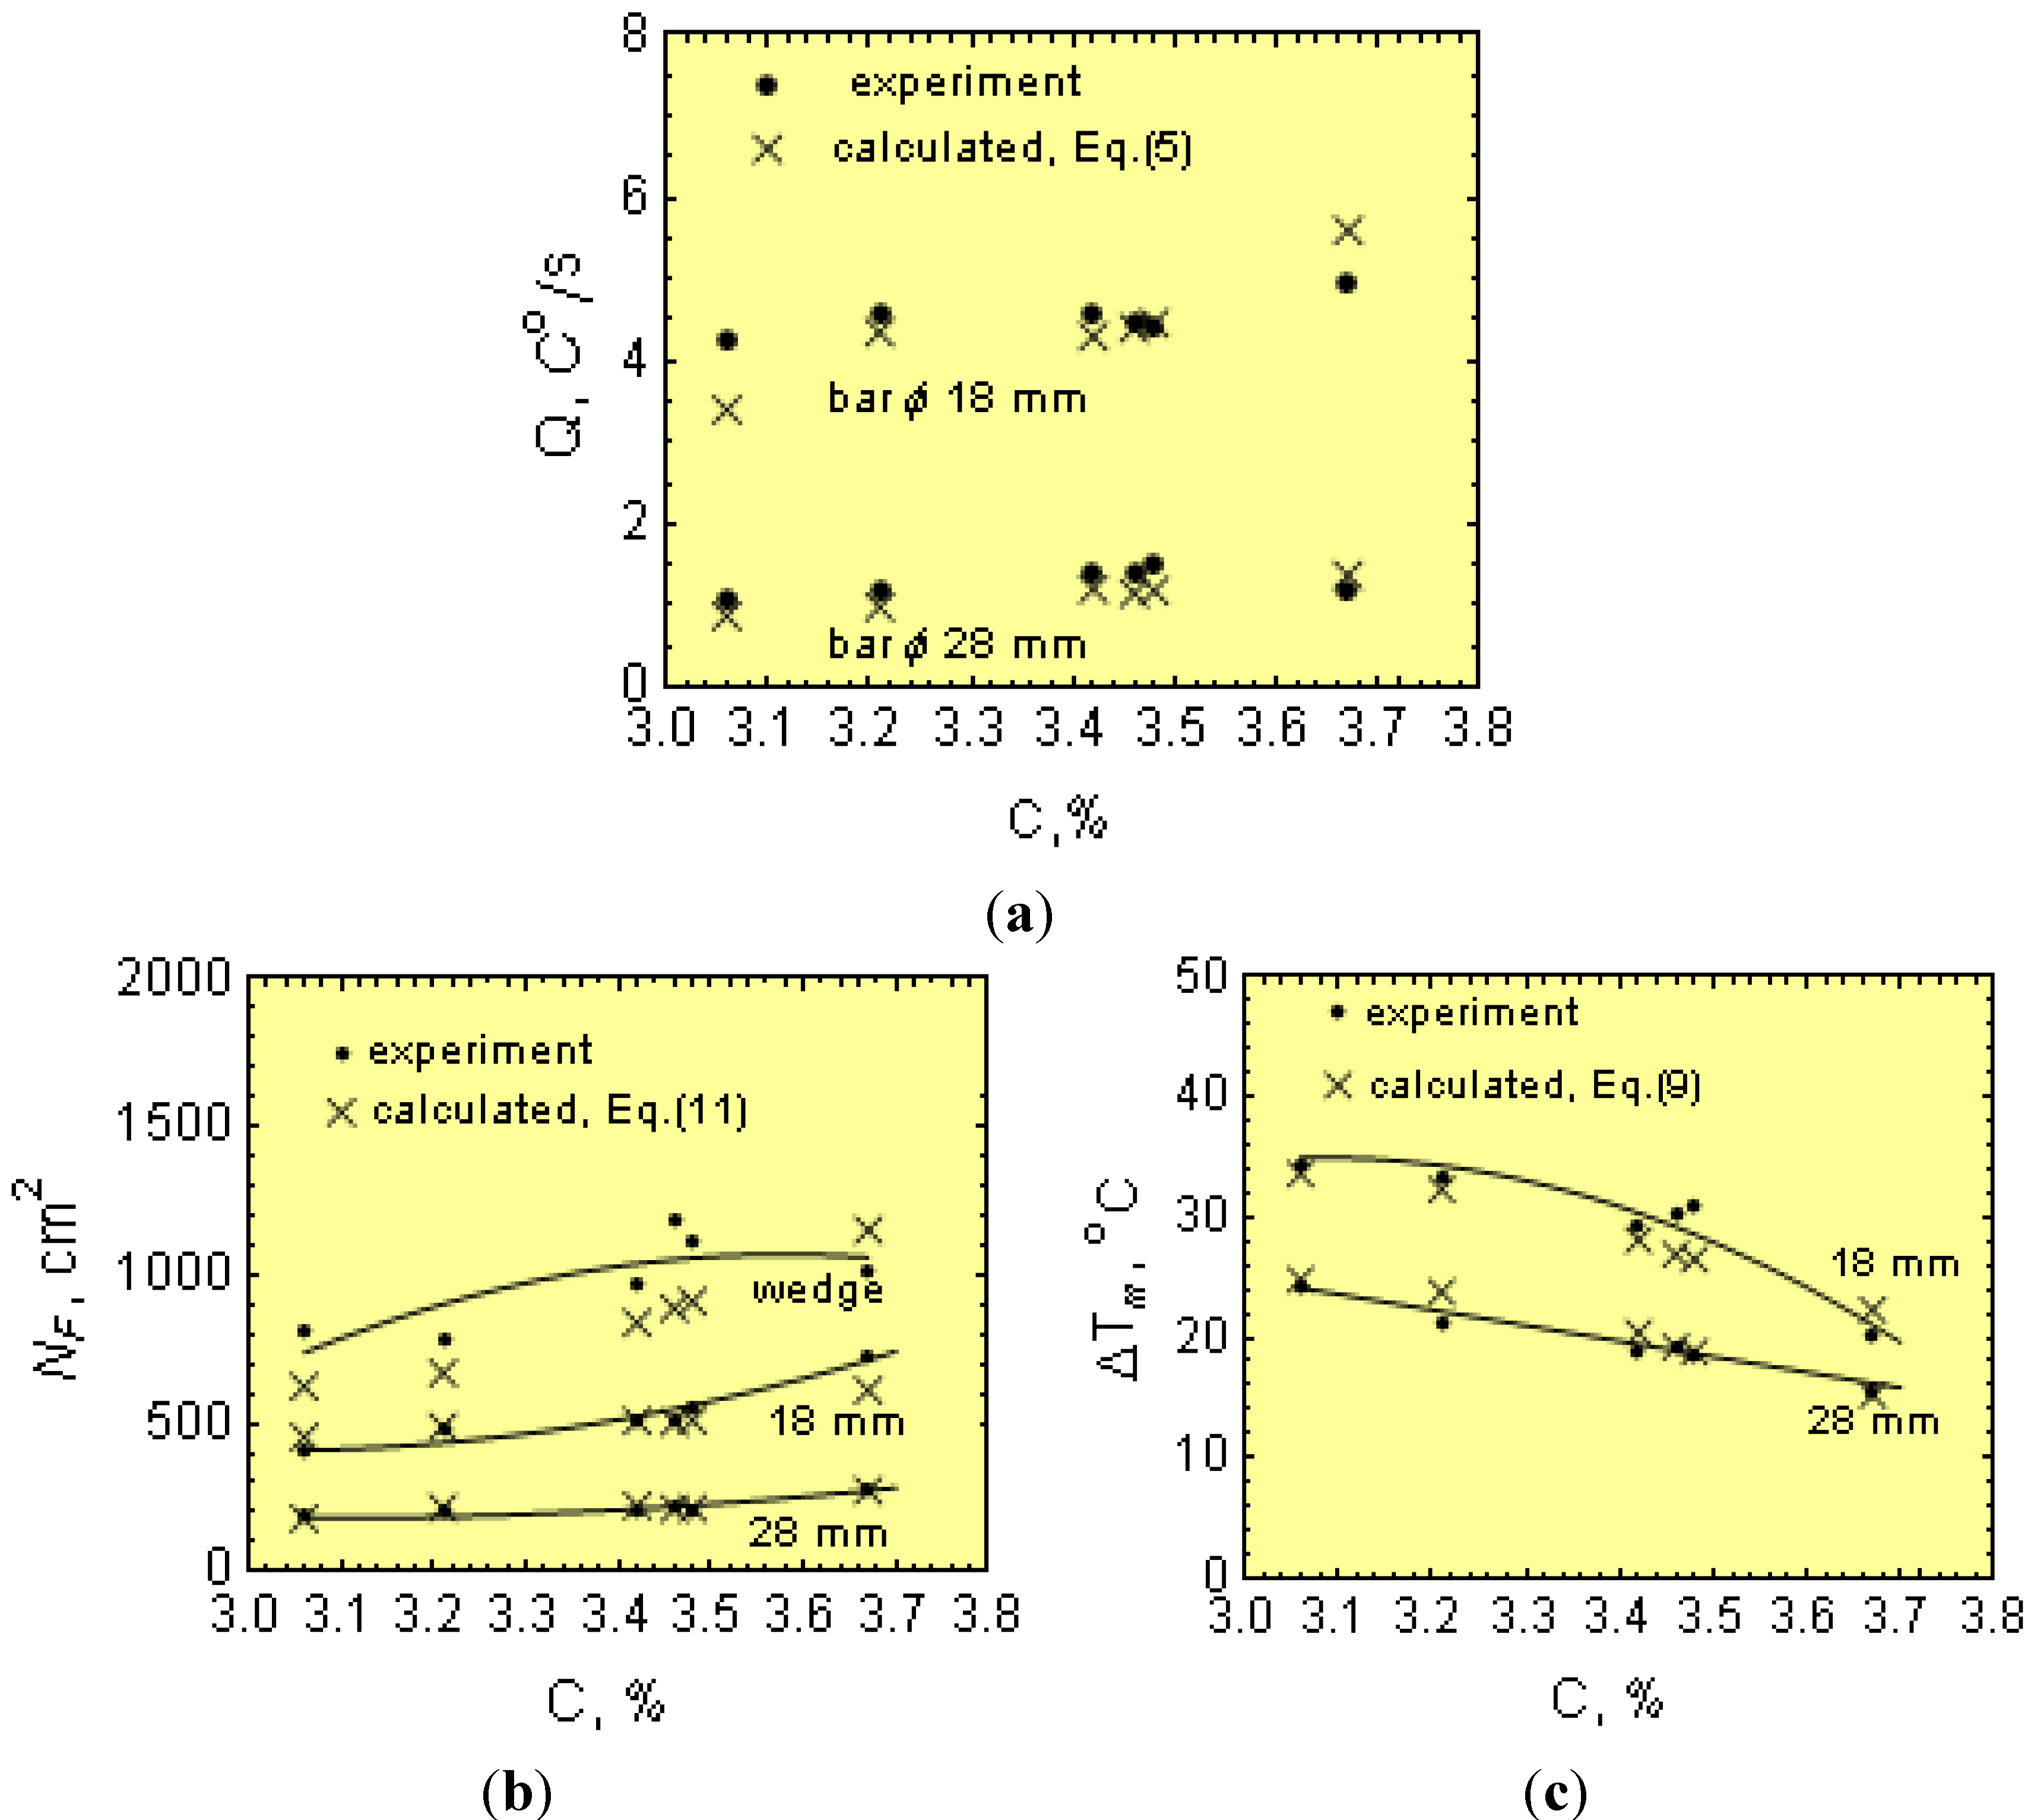
The experimental data and using Equation (1) in the logarithmic form yields:
where the experimental points (∆
Tm,1,
N1), (∆
Tm,2,
N2) and (∆
Tsc,
Ncr) were determined for bars of 30 and 18 mm in diameter and wedges, respectively. The data are graphically plotted as a ln
N − ∆
Ti−1 plot (where
i = 1, 2, cr), and the data points fit a straight line (
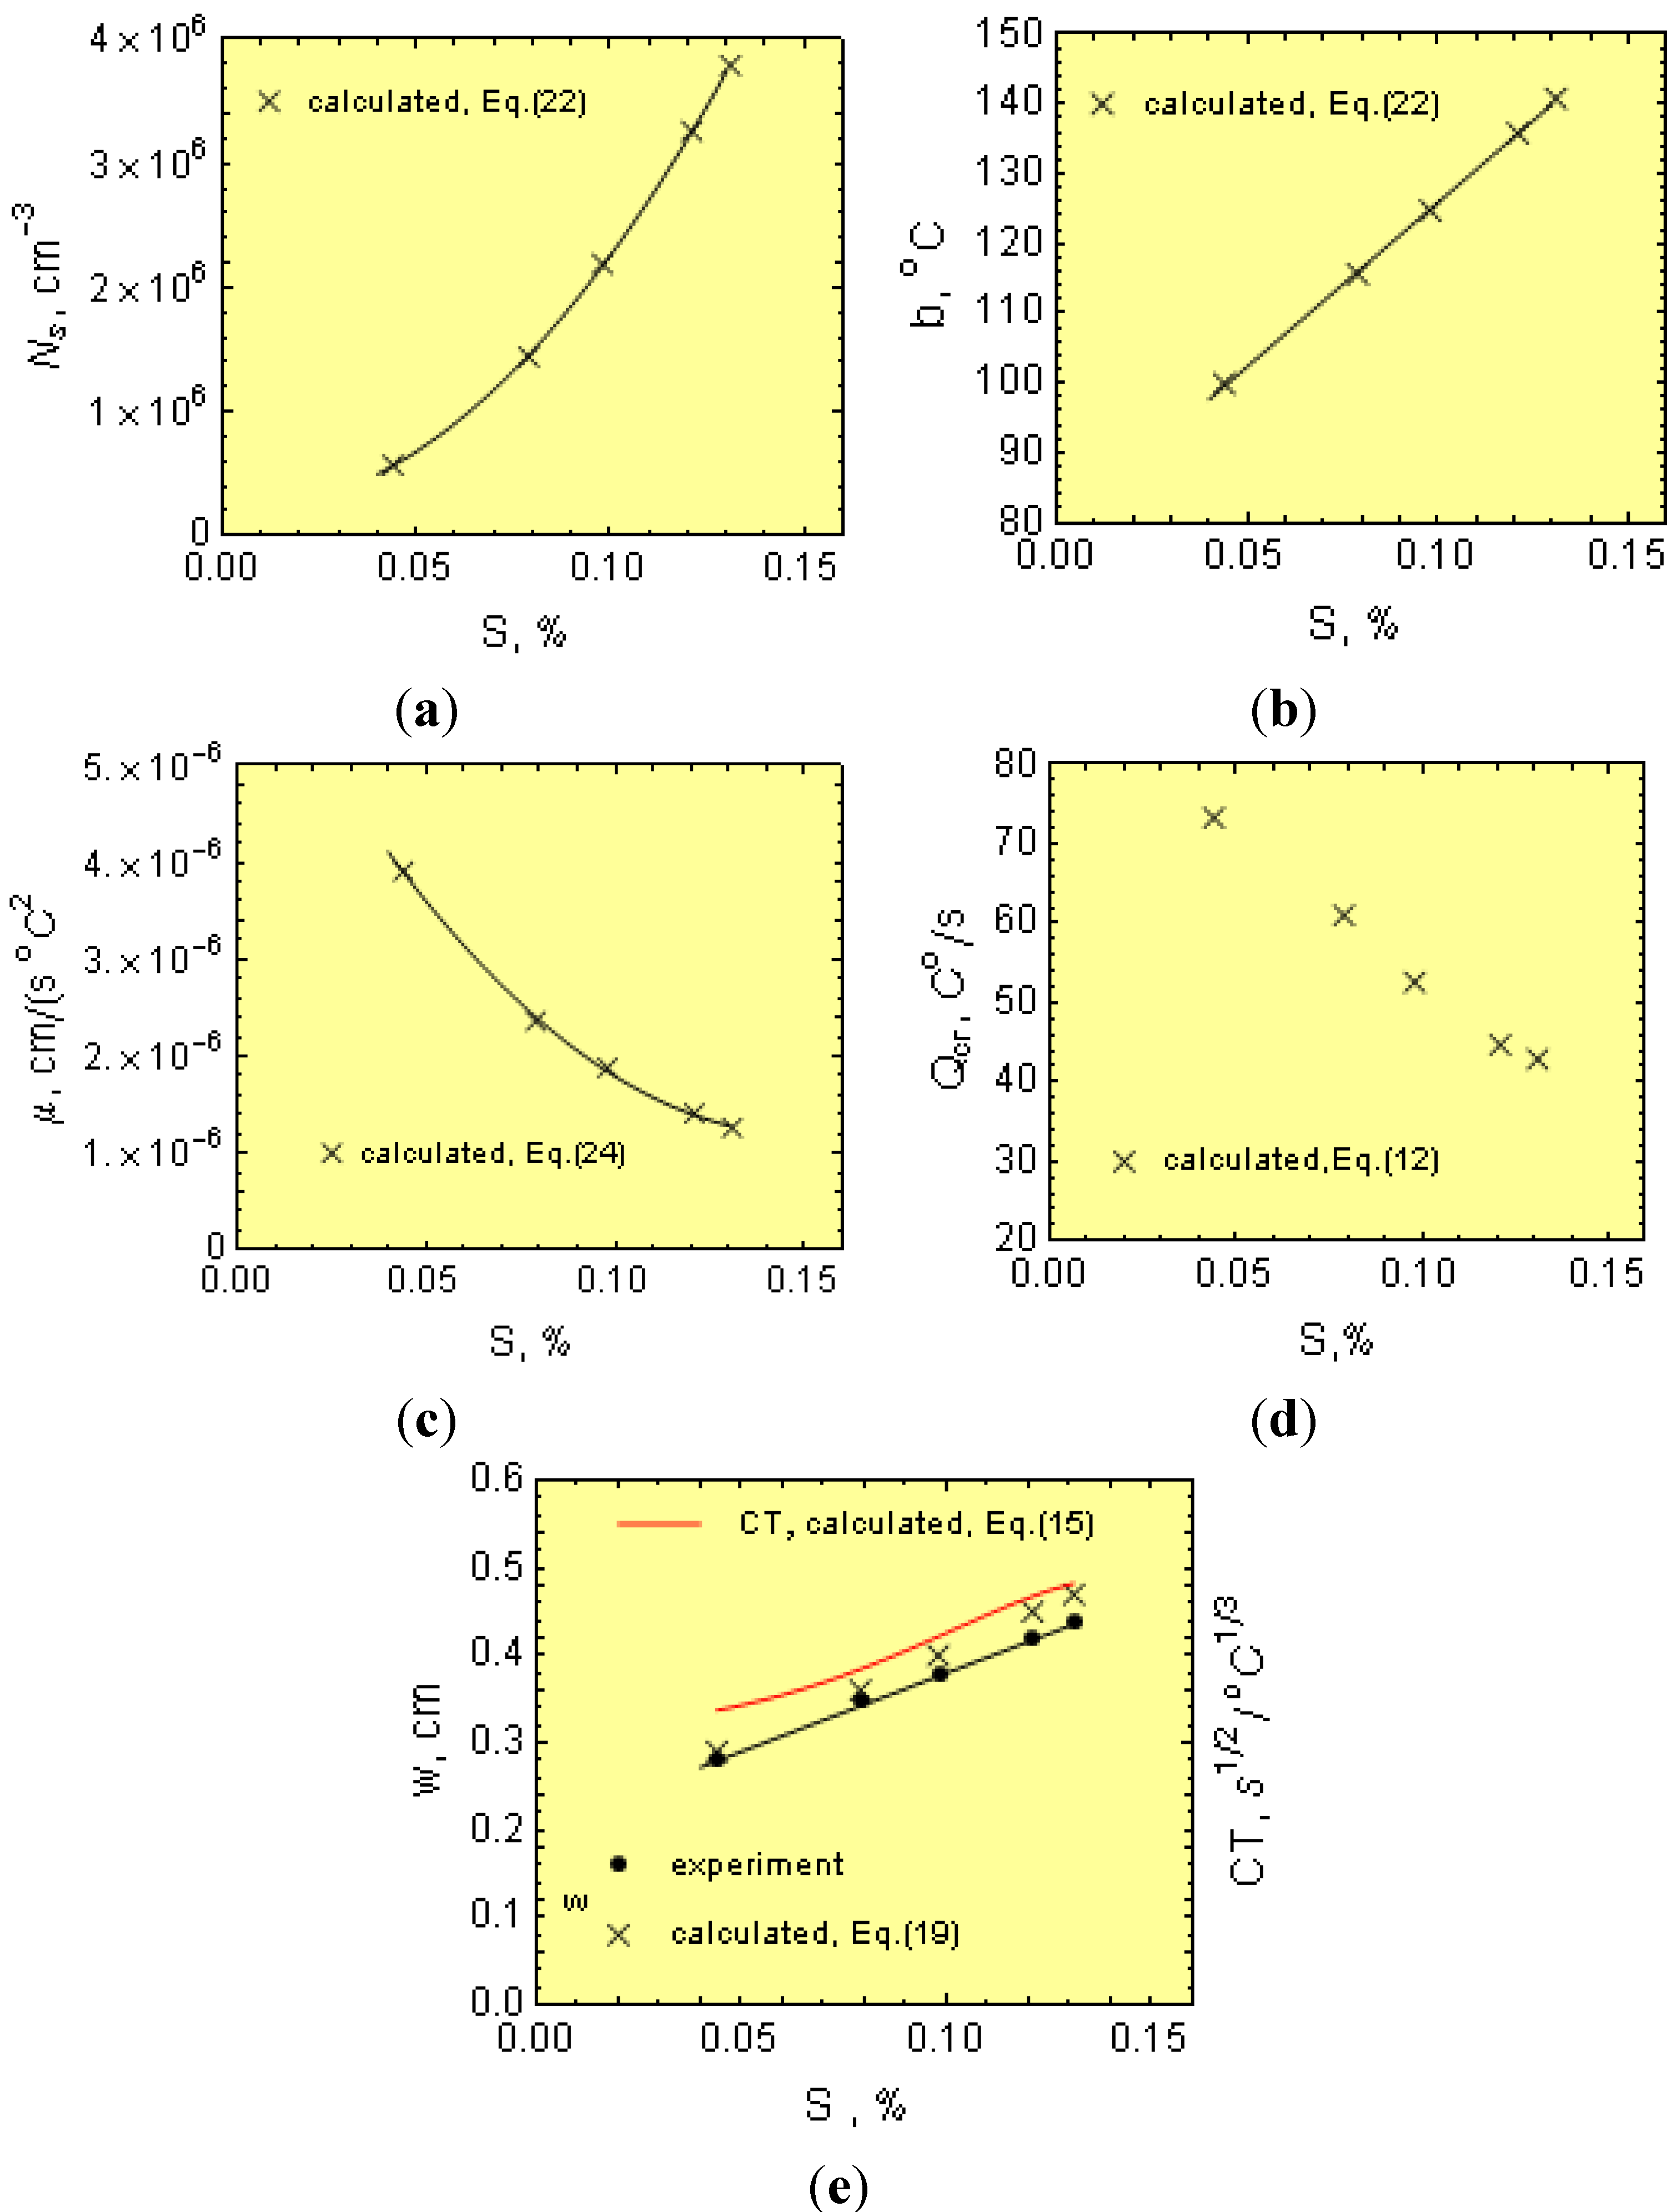
Figure 8). From this plot, experimental values of
Ns = e
11.9 = 147,267 cm
−3 and
b = 97.1 °C were obtained.
The growth coefficient for the experimental melts can be estimated as follows: for bars of diameter “d” and the length “h”, the casting modulus can be given as:
Thus, for 1.8- and 3.0-cm diameter bars, the casting modulus is 0.42 and 0.65 cm, respectively. In addition, considering Equations (3)–(5), μ can be determined from:
Furthermore, knowing M, Ti, N and ∆Tm, as well as the melt thermophysical data, the effect of C, Mn, P and S on μ can be estimated from Equation (24). In this work, the initial calculations were made separately for 18 and 30 mm bars and then averaged out.
Figure 8.
Relationship between undercooling, ∆Ti−1, and volumetric cell count, lnNi, for melt P1.
The temperature range, ∆
Tsc, was estimated as follows: There have been numerous experimental investigations that have involved the determinations of
Tc temperatures with variable results [
23,
24], depending on the chemistry of the experimental iron melts. In fact,
Ts is the equilibrium temperature when
Q → 0, making it difficult to determine. In this work, determination of the
Ts temperature was possible by using selected thermodynamic data [
25], as well as the work by Heine [
26].
Furthermore, the T
c temperature can be described by [
27]:
Hence:
It is worth mentioning that in a binary eutectic Fe-C alloy containing 4.26% C, Equations (25) and (16) yield Ts, Tc and ∆Tsc values of 1,427 K (1,154 °C), 1,420 K (1,147 °C) and 7 K (7 °C), respectively, in agreement with the Fe-C diagram.


