Article

Investigation of Material Performance Degradation for High-Strength Aluminum Alloy Using Acoustic Emission Method

1
National Center for Materials Service Safety, University of Science and Technology Beijing, Beijing 100083, China
2
Qishuyan Institute Co., Ltd., China South Locomotive & Rolling Stock Corporation Limited, Changzhou 213011, China
*
Author to whom correspondence should be addressed.
These authors contributed equally to this work.
Metals 2015, 5(1), 228-238; https://doi.org/10.3390/met5010228
Submission received: 10 December 2014 / Accepted: 28 January 2015 / Published: 13 February 2015

Abstract

:
Structural materials damages are always in the form of micro-defects or cracks. Traditional or conventional methods such as micro and macro examination, tensile, bend, impact and hardness tests can be used to detect the micro damage or defects. However, these tests are destructive in nature and not in real-time, thus a non-destructive and real-time monitoring and characterization of the material damage is needed. This study is focused on the application of a non-destructive and real-time acoustic emission (AE) method to study material performance degradation of a high-strength aluminum alloy of high-speed train gearbox shell. By applying data relative analysis and interpretation of AE signals, the characteristic parameters of materials performance were achieved and the failure criteria of the characteristic parameters for the material tensile damage process were established. The results show that the AE method and signal analysis can be used to accomplish the non-destructive and real-time detection of the material performance degradation process of the high-strength aluminum alloy. This technique can be extended to other engineering materials.

1. Introduction

With the continuous increase in speed of high-speed train, the material widely used is high-aluminum alloy because of its lightweight and higher strength and good fatigue properties [1,2]. The gearbox of high-speed train is one of the important parts of its drive system, and is of great importance for operation safety of high-speed train. High-strength aluminum alloy A356, a key material of the gearbox, which has excellent properties of rigidity, strength, ductility, fatigue, casting, and shrinkage tendency [3]. At present, the development of this material has almost been completed, but performance analysis of service process has not been done [4,5]. As the operational safety is important for transportation purposes, a method of non-destructive and real-time detection for the material is urgently required.
Traditional method for materials research is microscopic observation, but this method is always accompanied by destructive testing and not in real time. Among the common non-destructive method such as acoustic emission (AE), X-ray and ultrasound, AE is a dynamic non-destructive testing method and not limited by materials [6]. Lugo et al. [7] studied the damage evolution in a 7075 aluminum alloy by using acoustic emissions to quantify the evolution of damage, but their research is based on the destructive experiment. Behrens et al. [8] presented an approach for online crack detection during cold forging of steel components using the acoustic emission technique, but the data was obtained by off-line laboratory experiments. Han et al. [9] investigated the effects of the change in macro-structures due to heat treatment and weld on fatigue and corresponding acoustic emission behaviors of Q345 steels, but they only considered AE counts possibility in their work. Maillet et al. [10] used an energy-based procedure to select AE events generated by damage in composite materials, but it was only appropriate for the composite materials and the AE signal of metal materials is different. Therefore, the technical feasibility and relative analysis method of the AE method used for non-destructive testing should be further studied especially in real-time detection and characterization for materials.
Material performance degradation is an important direction for life prediction and service safety assessment. Since the structural dimension and the whole life degradation data are difficult to be achieved in limited time and cost, the method of performance degradation can be used. In a service process, although the direct degradation data cannot be achieved, the indirect degradation data such as strength, amplitude and event count can be detected and used to characterize the degradation process. Recorded data at different times can be analyzed and used to establish failure threshold and degradation model. By extrapolation, it can also be used to estimate the remaining life of structural material before failure. Roca et al. [11,12] used neural networks and acoustic emission signals to estimate the stability of gas metal arc welding (GMAW) process, and it is a good method to analyze the AE signals, although the characteristics of AE signal of high-speed train gearbox shell is different from that of GMAW. Cholette et al. [13] presented a novel data-driven degradation modeling and monitoring methodology based on hidden Markov models; but the method needs a large data set. Hong et al. [14] put forward a novel performance degradation assessment method based on ensemble empirical mode composition and Gaussian mixture model, however, their data was not in real-time. Savage et al. [15] investigated a methodology to provide the cumulative failure distribution for degrading, uncertain, and dynamic systems, but this uncertainty method was not appropriate for engineering applications. Dobrica et al. [16] developed a hydrodynamic model to simulate the operation of scratched journal bearings, but the parametric study presented in their paper corresponds to a particular journal bearing configuration. Presently, there is still no life prediction data and the traditional testing method, which is expensive and time-consuming for high-speed train gearbox materials.
The aim of this work is to investigate the tensile damage of gearbox shell material of the high-speed train using an AE detection system. The AE system was implemented to obtain the AE signals during the tensile test process, and relative analysis method was then used to determine the performance degradation characteristic parameters and failure criteria.

2. Materials and Methods

2.1. Materials Tensile Damage

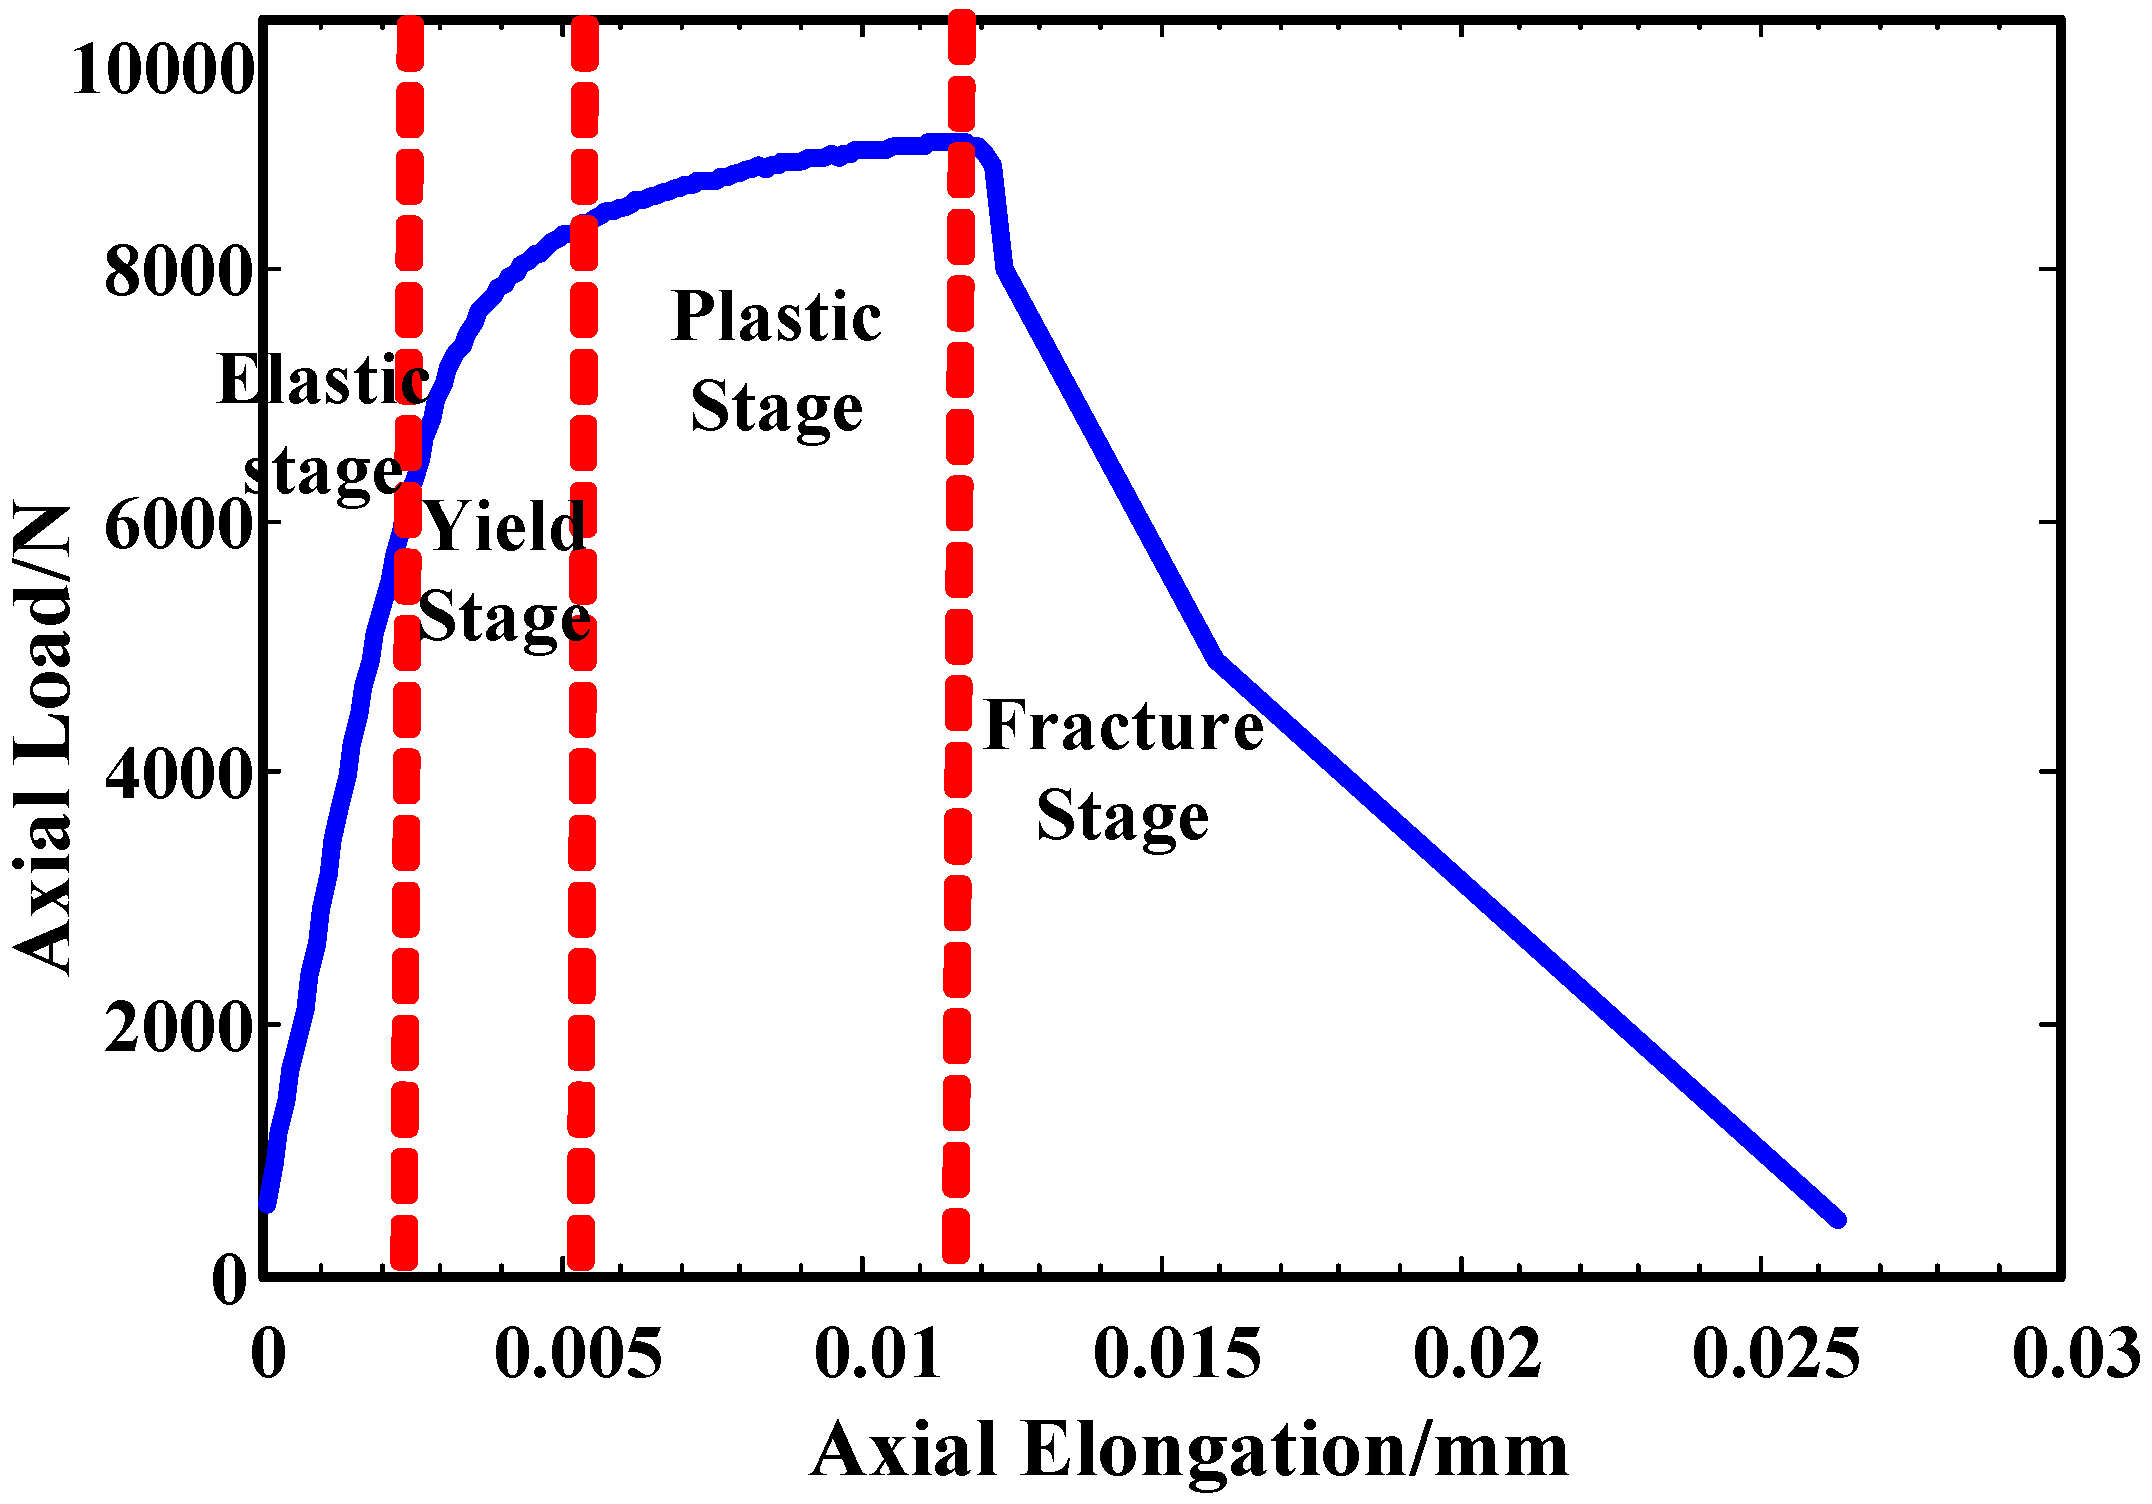
The results of the tensile test process of ductile metallic materials can be divided into four stages as elastic, yield, plasticity and fracture [
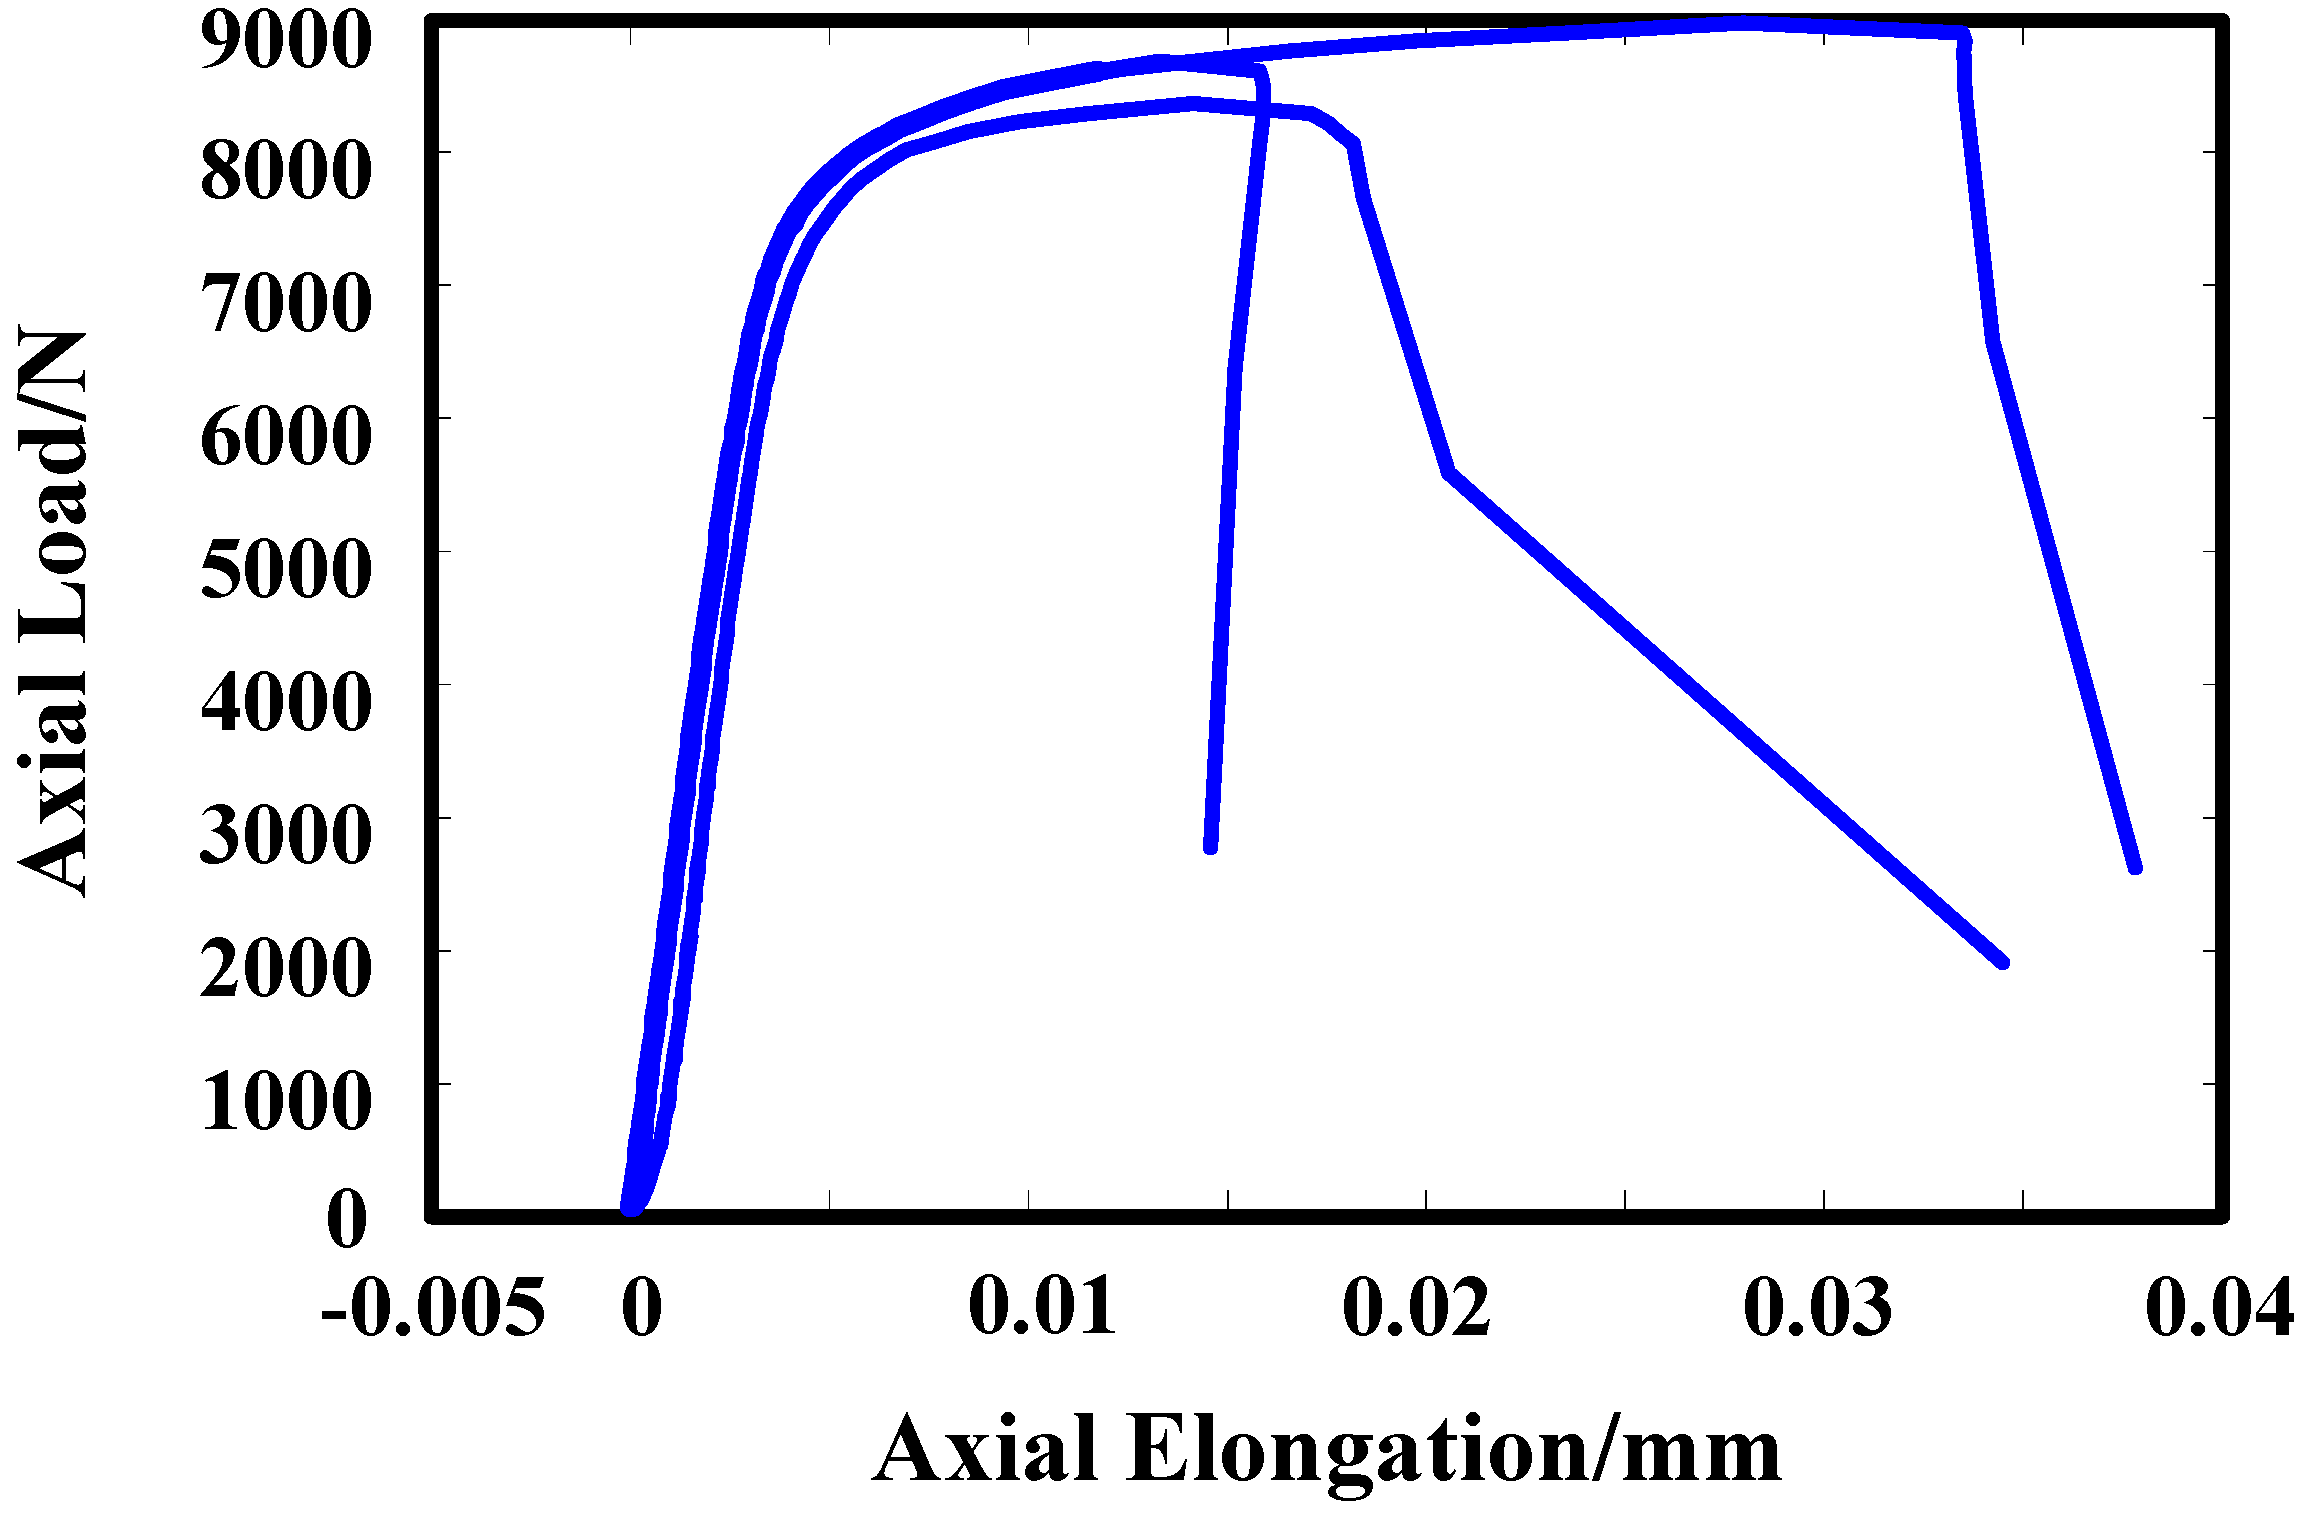
17]. These four stages depend on the different characteristics of the tensile test process as identified on the axial load-axial elongation curve of the materials studied which is shown in Figure 1. Based on the axial load-axial elongation curve, according to different characteristics of the four stages of tensile process, the four stages can be clearly divided.
Figure 1. The axial load-axial elongation curve and four stages of tensile process.
Metals 05 00228 g001
Elastic stage: the material deformation is elastic, and the force and elongation is proportional. If withdraw the force, the elongation disappears, and no residual elongation.
Yield stage: In this stage, a lot of dislocation and metal bond cleavage occurs inside the metal material, the plastic deformation begins, which accompanied by a large number of acoustic emission phenomena [18].
Plastic deformation stage: the material is deformed under the action of external forces, and when the external force is removed, the original material cannot be recovered.
Fracture stages: stress increased while strain decreased, and the material eventually fractured.
For the material service, when the material is in the elastic stage, it is considered safe. When the material enters the yield stage, final fracture will be attained quickly. In this paper, the transition point from elastic stage to yield stage is the failure point of the tensile process.

2.2. Acoustic Emission Technology

Material deformation and crack propagation under stress are an important mechanism of structural failure. Acoustic Emission (AE) is a phenomenon of rapid release of energy and generation of transient elastic wave from a localized source of the material. This elastic wave is also known as the stress wave emission [18]. The elastic wave emitted from the sound emission source can reach the surface of the material, and can cause the displacement which can be detected by acoustic emission sensors. The mechanical vibration of the material which is caught by the detectors is converted to an electrical signal, is then amplified, processed and recorded.
AE instrument with high sensitivity can detect micro crack propagation with the change of micrometer. AE diagnostic methods are used to diagnose the crack generation and propagation due to plastic deformation, fatigue and wear. Acoustic emission parameter analysis method is used to analyze and interpret AE signal based on waveform characteristics of the acoustic emission signal. Commonly used parameters of AE are energy, ring-down count, duration, amplitude, effective voltage and so on. For the same acoustic emission source, these parameters are correlated.

2.3. System of Tensile Test with Acoustic Emission Instrument

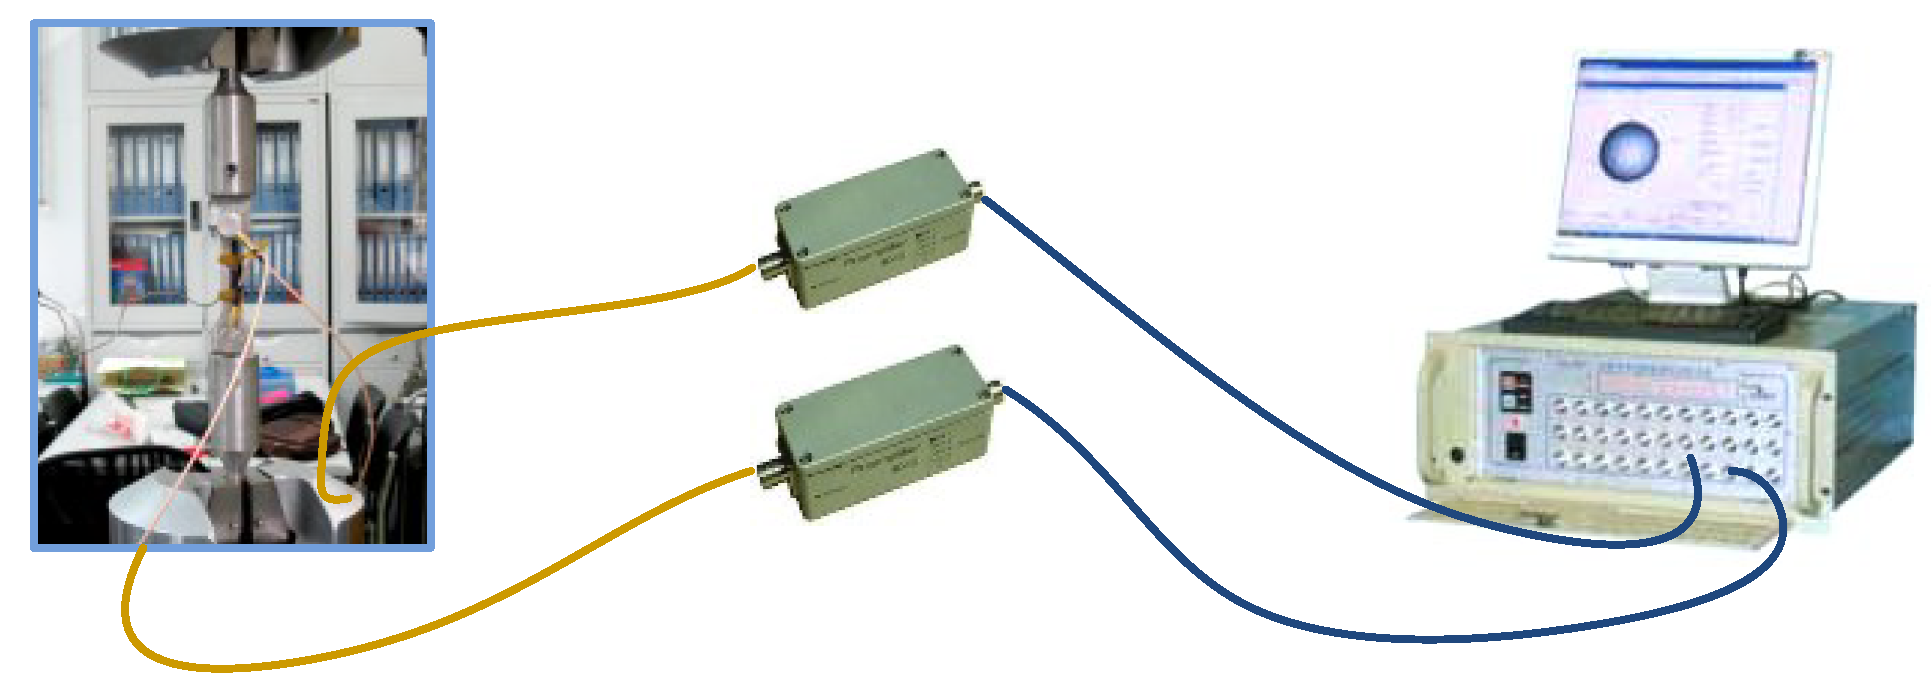
The system of tensile test with acoustic emission testing includes tensile testing machine, acoustic emission instrument and workstation. The acoustic emission probes are fixed on the test samples. When tensile testing machine is working, acoustic emission instrument is synchronously triggered. The acoustic emission instrument parameters can be adjusted through the workstation, and the acoustic emission signals are stored. Figure 2 shows the tensile test system with acoustic emission instrument.
Figure 2. The system of tensile test with acoustic emission instrument.
Metals 05 00228 g002
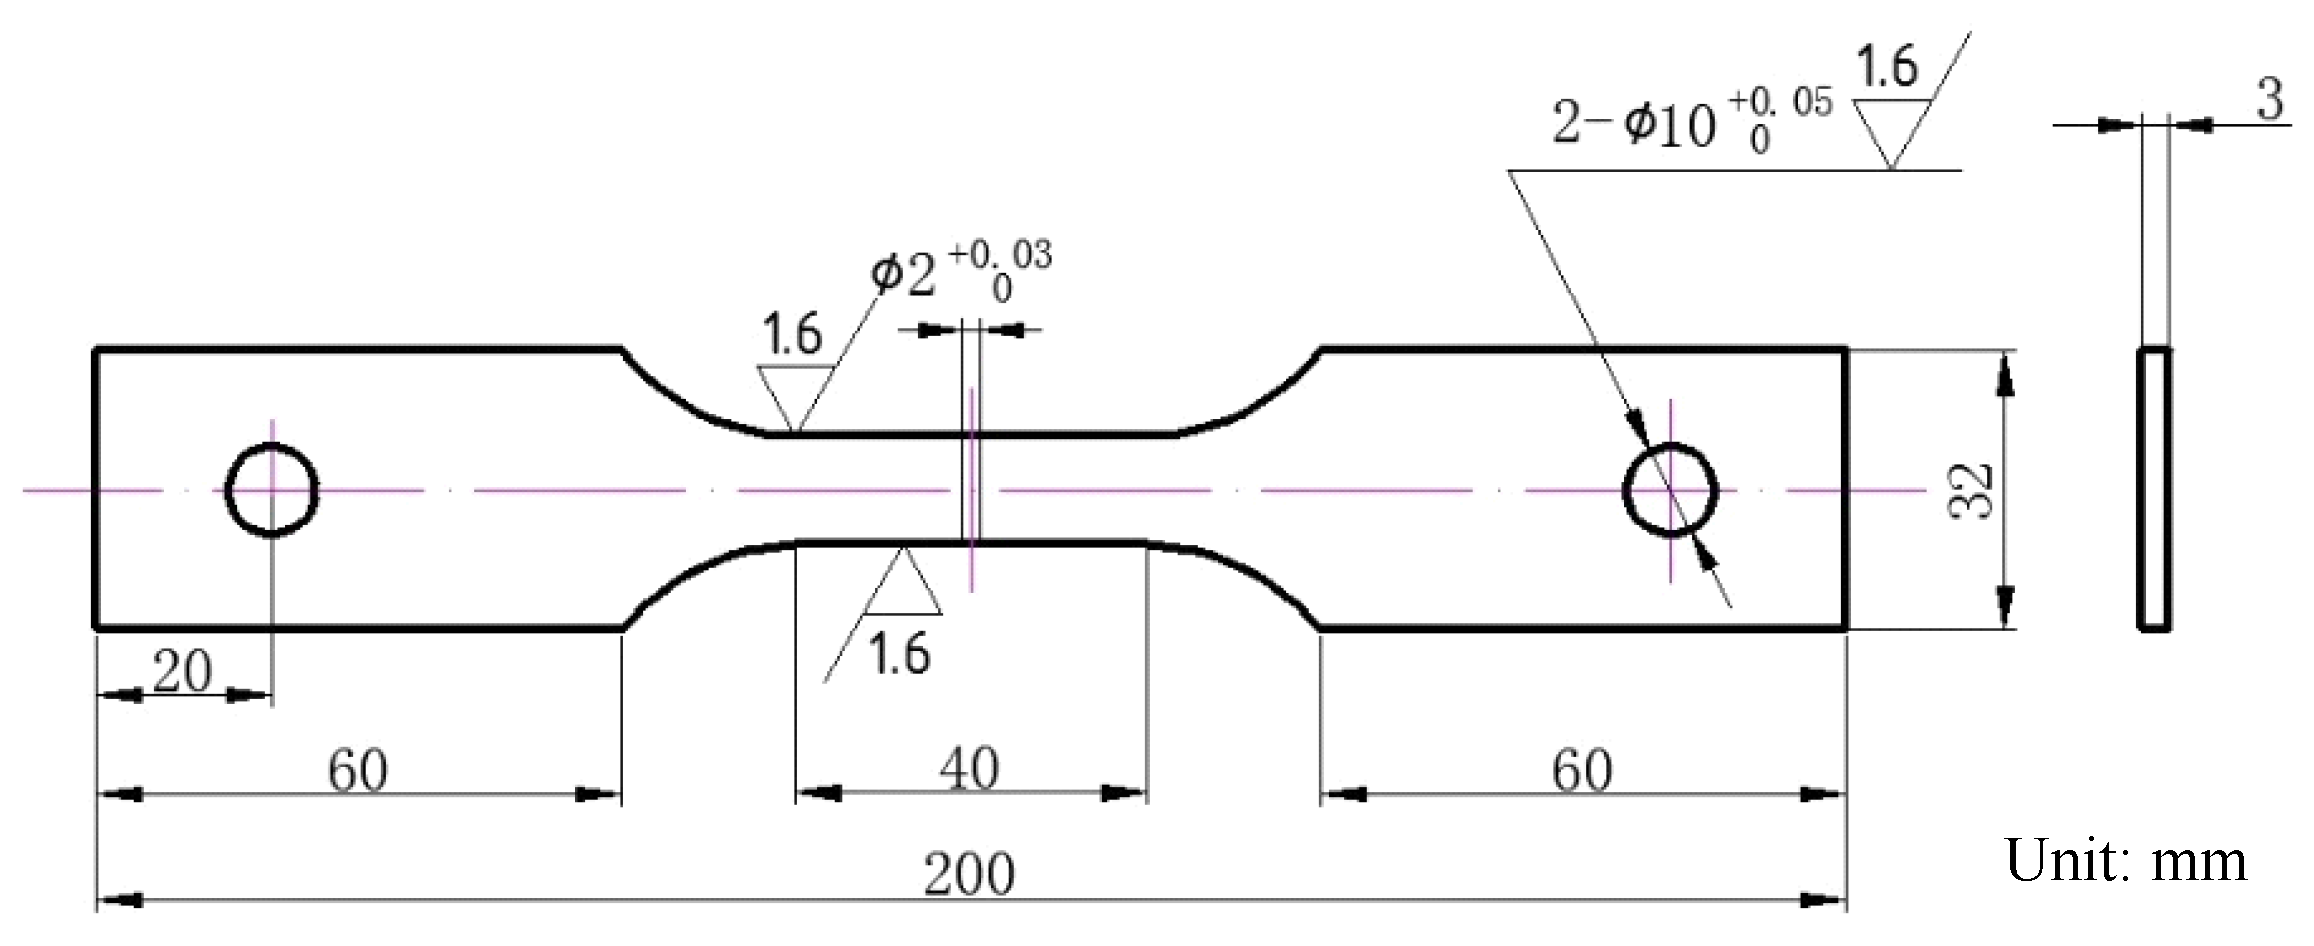
Material tensile is performed on MTS810 material testing machine, MTS632.12C-20. The strain rate was 10−4/s and test environment was 27 °C and 40% RH. Three test samples were cut from the gearbox shell, and the parameters of sample size are shown in Figure 3.
Figure 3. The sample size of aluminum alloy.
Metals 05 00228 g003
Acoustic emission instrument used in the test was SAMOS acoustic emission system of PAC Company. The sensors type was R15A; resonant frequency was 150 kHz; pre-gain amplifier was 40 dB; threshold was 45 dB; peak identification time (PDT) was 300 µs; impact identification time (HDT) was 600 µs; hit lockout time (HLT) was 1000 µs; sampling frequency was 1 MHz; and the crash file length was 2 kB.

3. Results and Discussion

3.1. Characteristic of AE Signal for the Tensile Test Process

Form Figure 4, the axial load-axial elongation curves of multiple samples are drawn in a graph. It can be seen that although there are some differences in the axial load-axial elongation curves, the transition point from elasticity to yield is more concentrated. It indicated that this process is of high reproducibility and consistent rules, so it is available to use statistical analysis method to develop the research.
Figure 4. The axial load-axial elongation curve of multiple samples.
Metals 05 00228 g004
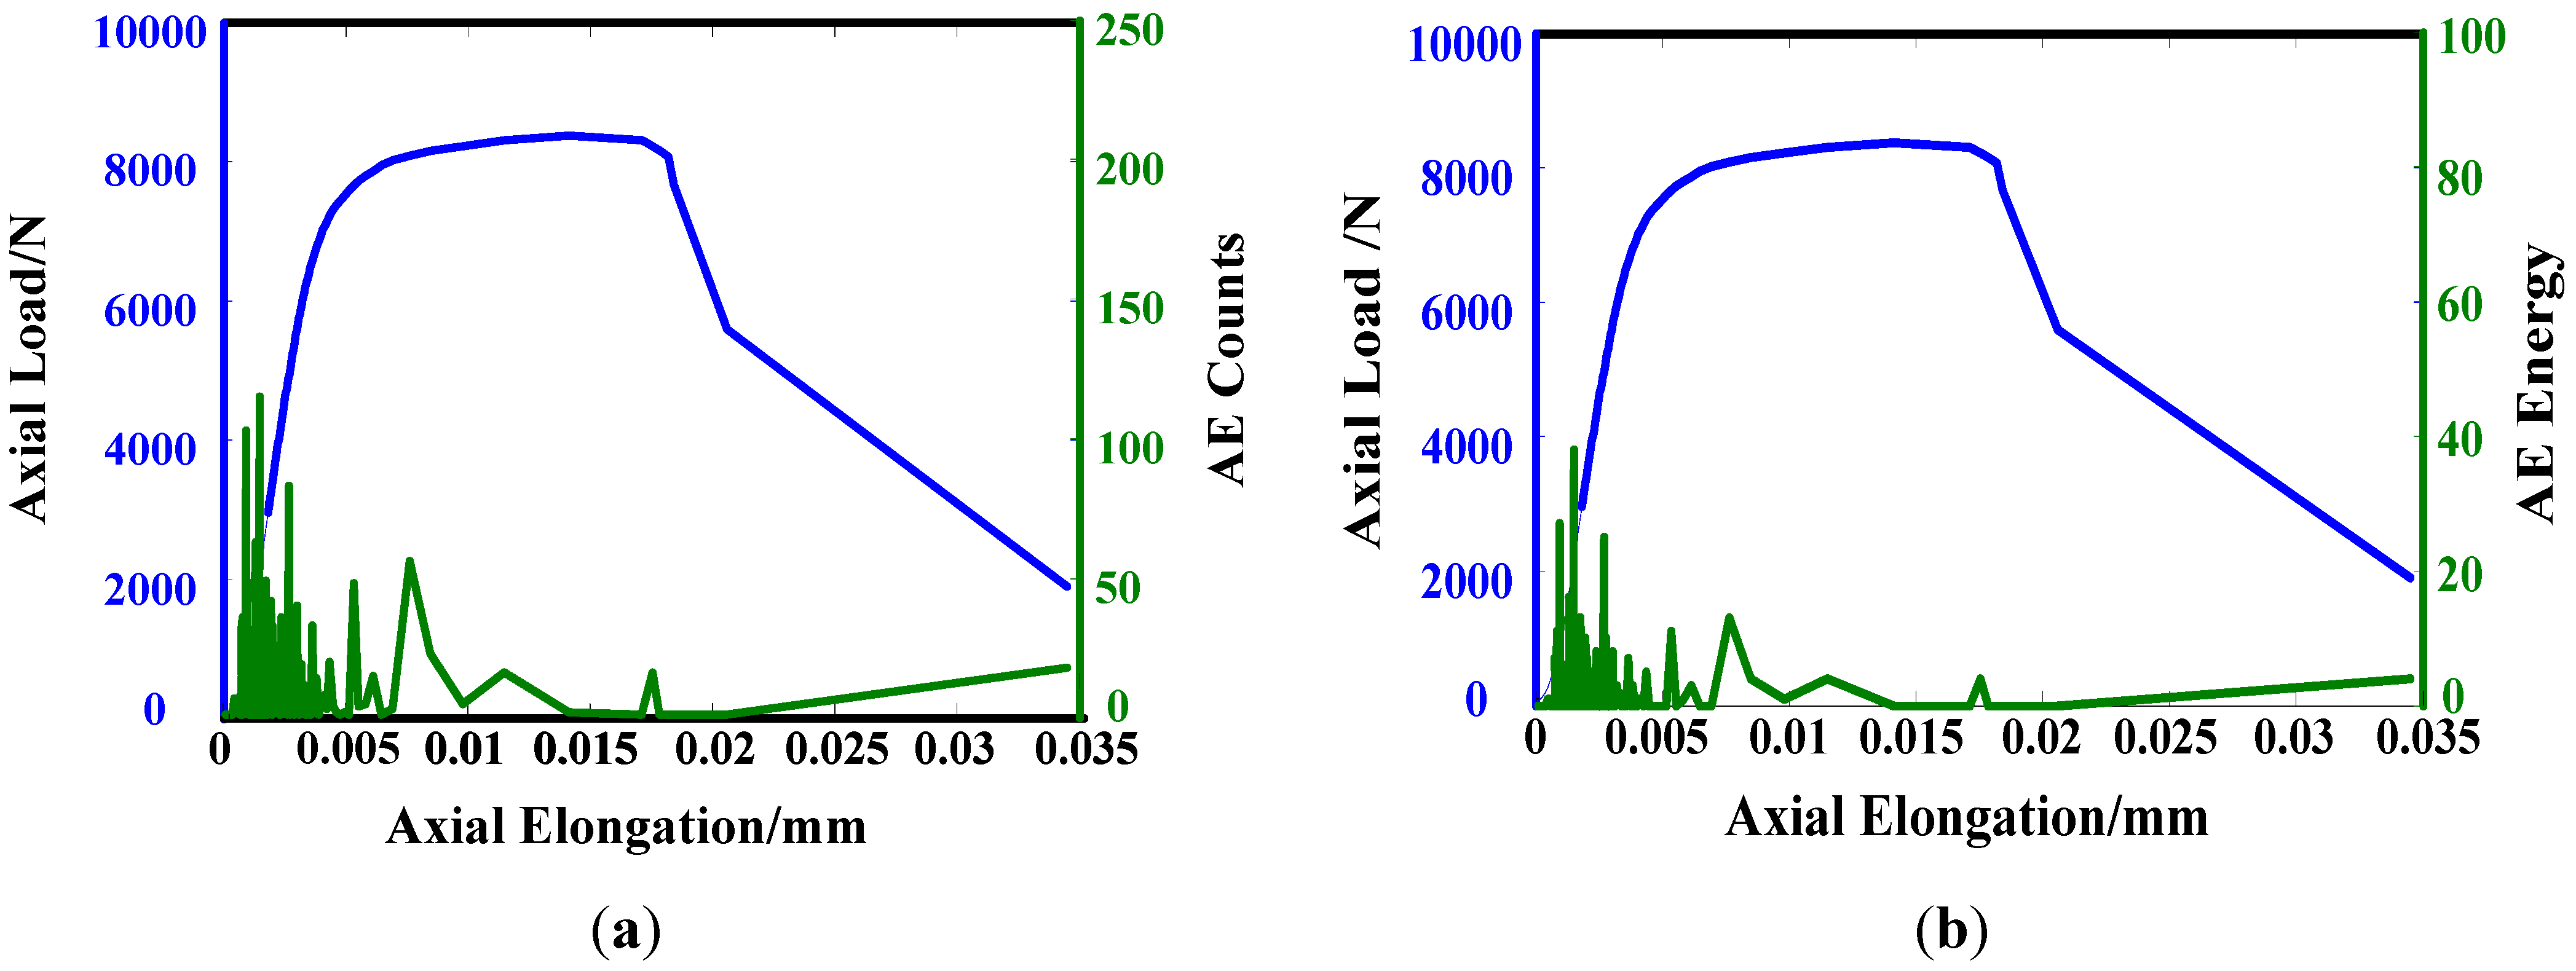
In the same tensile process, the AE signal and axial elongation were shown in Figure 5. It can be seen that the AE signals increased significantly at the point from the elastic stage to the yield stage, so the AE signals can characterize the process from the elastic stage to the yield stage of the material tensile damage. But the AE signal boundary between elastic stage and yield stage is not clear, and the AE signals of different samples have the same tendency but different values. The point from the elastic stage to the yield stage cannot be determined by using actual measured AE signals. But the characteristic of the AE signals of different samples at the point are having statistical regularity, and it is considered appropriate to use statistical analysis method to find the characteristic parameters of the material performance degradation.
Figure 5. Acoustic emission (AE) signal and axial elongation curve. (a) Ring-down count and axial elongation curve; (b) Energy and axial elongation curve.
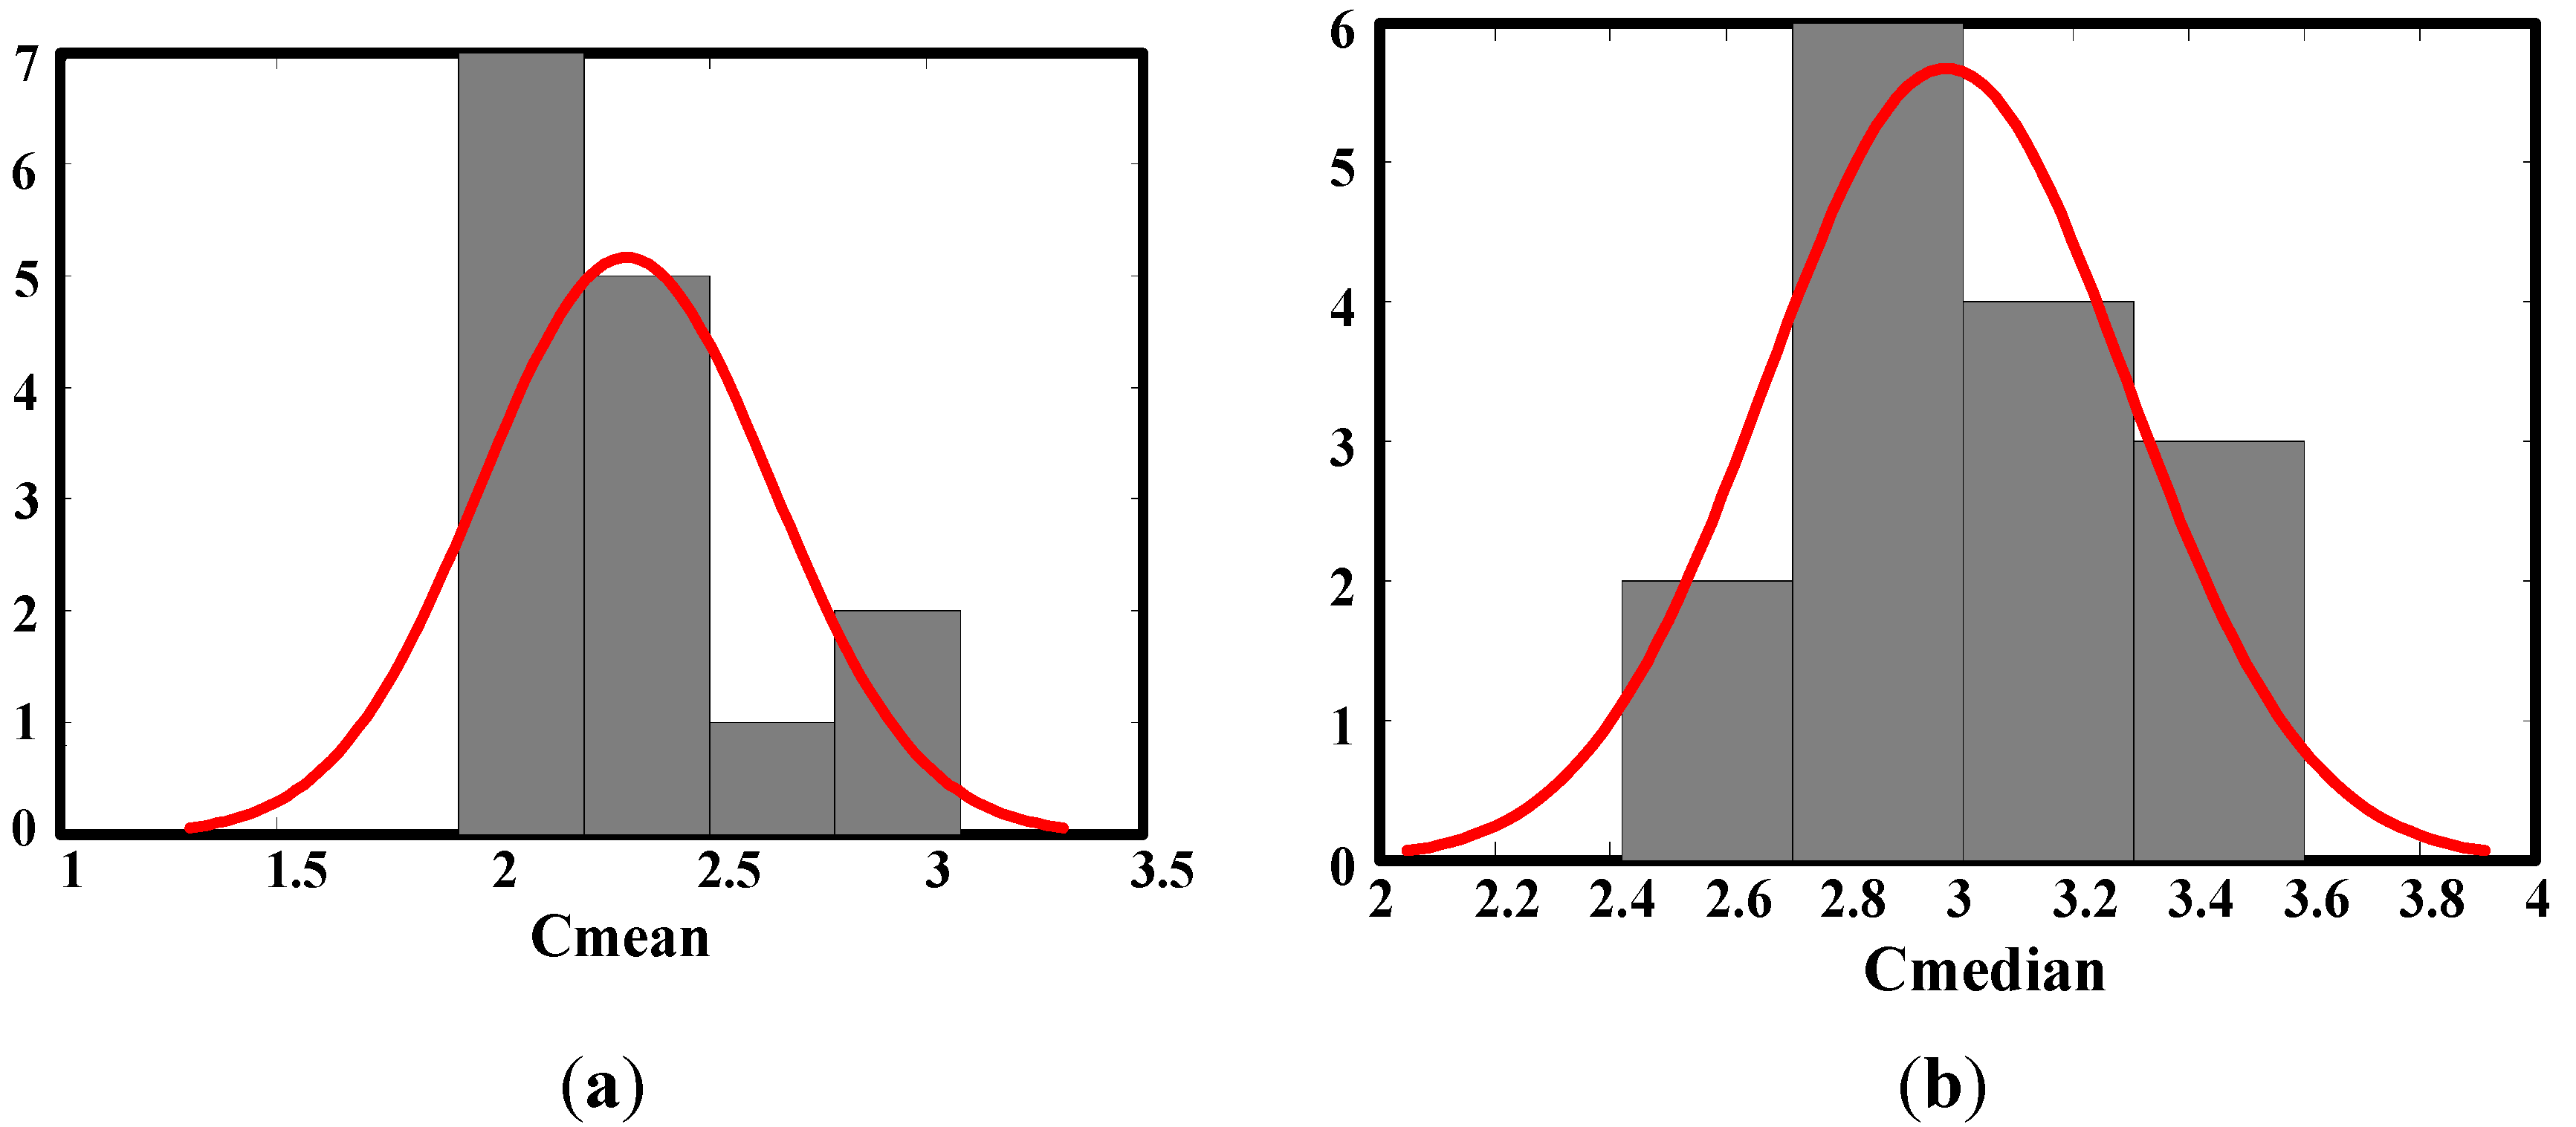
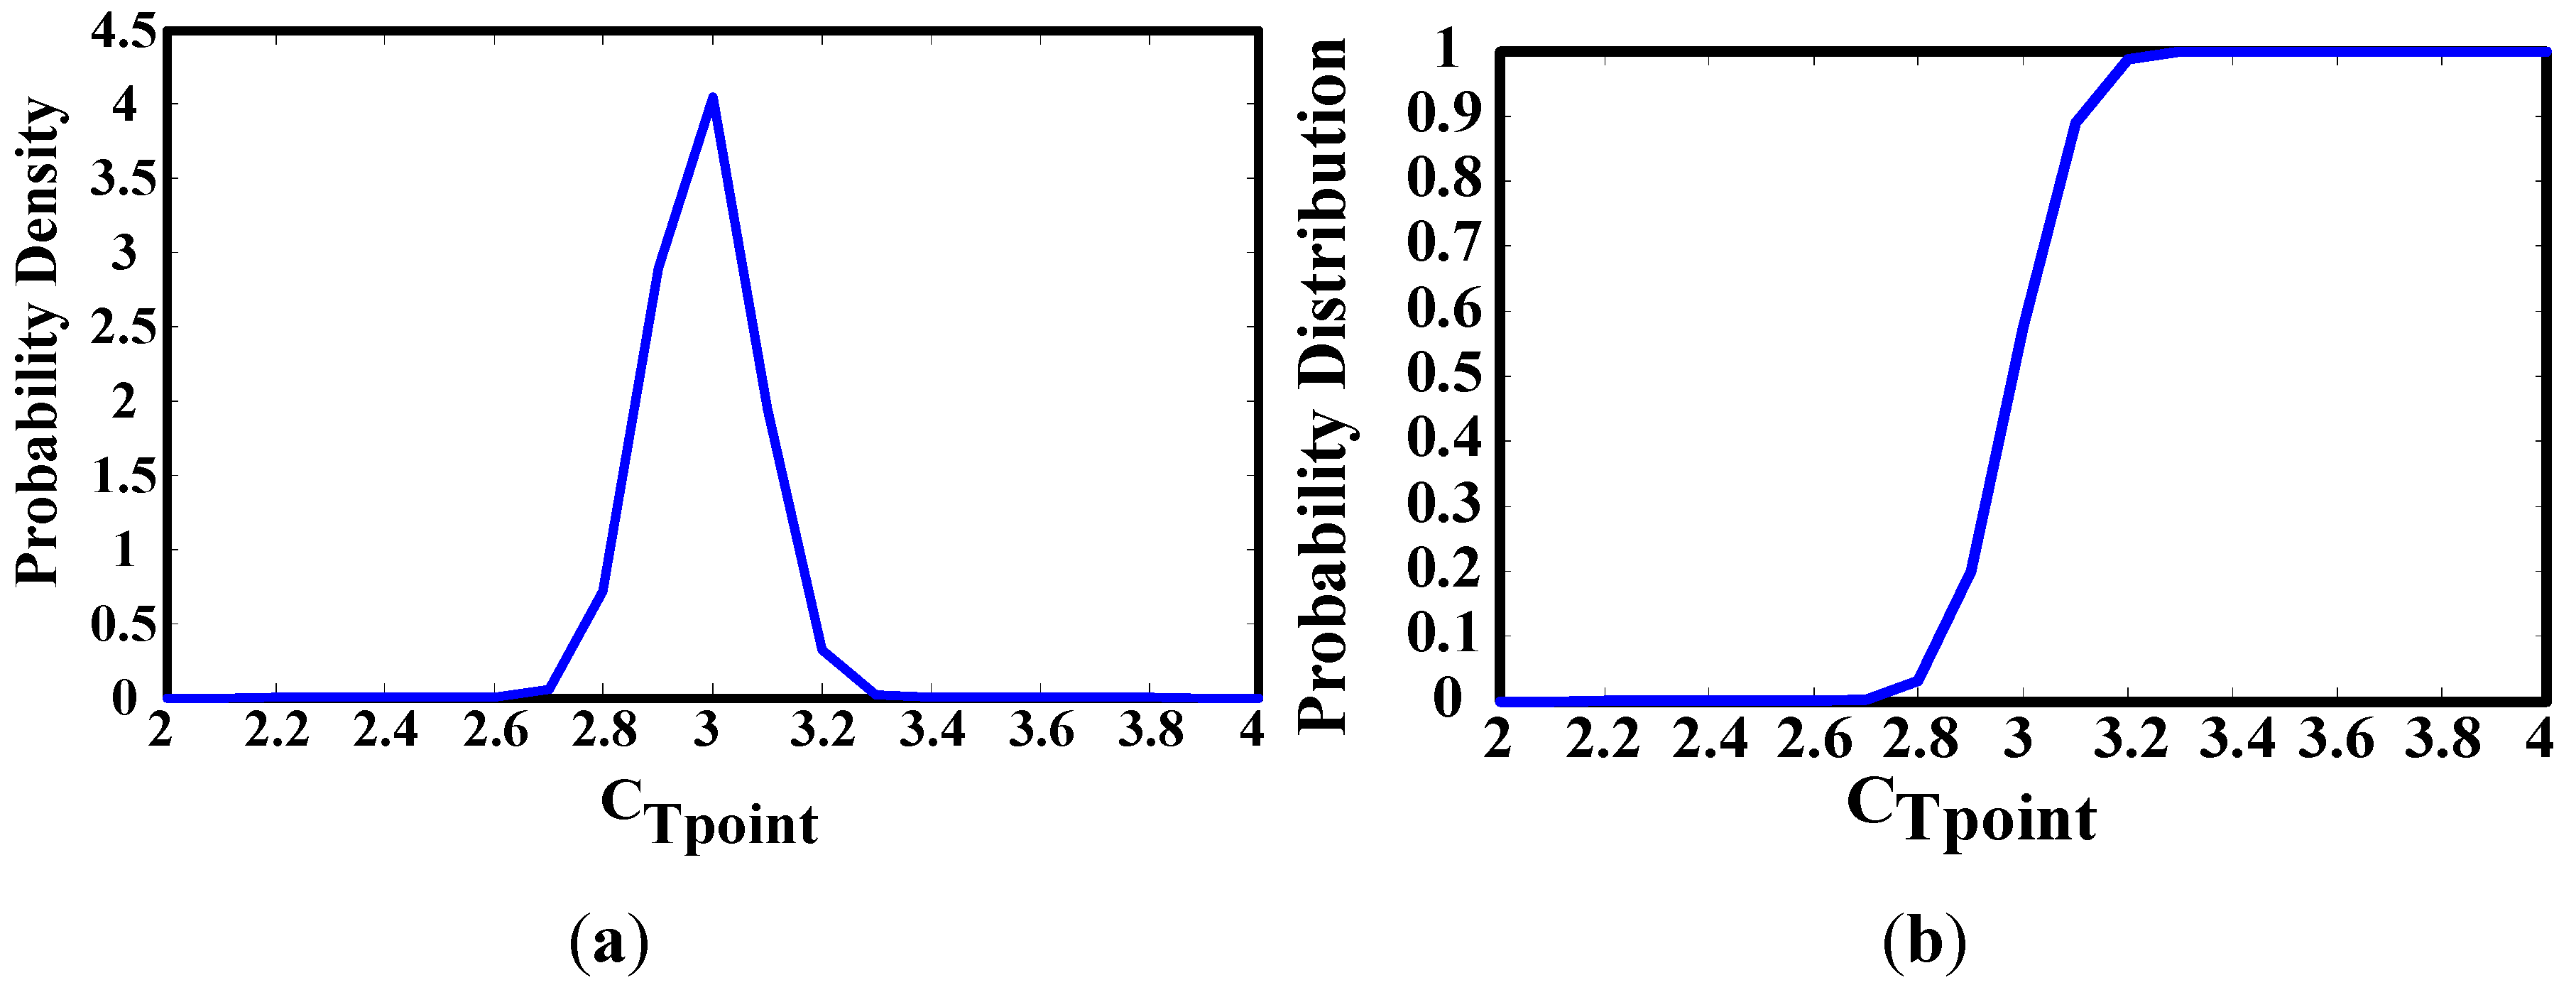
Metals 05 00228 g005

3.2. Characteristic Parameters of the Material Performance Degradation

The AE signals were collected from the tensile tests, and the data was built into a series, which is named C as characteristic parameter set.
C ( 1 ) ,   C ( 2 ) , C ( 3 ) , ,   C ( t )
C ( t ) = [ c 1 ( t )   c 2 ( t )   c 3 ( t )   c 4 ( t )   c 5 ( t )   c 6 ( t ) ]
c 1 ( t ) ~ c 6 ( t ) were the AE signals at t time as ring-down count, energy, amplitude, rise-time, duration, and peak-frequency. For a test process, the characteristic parameter set is as follows:
C = [ C ( 1 )  C ( 2 )  C ( 3 )    C ( t )   ] T = [   c 1 ( 1 ) c 2 ( 1 ) c 3 ( 1 )   c 1 ( 2 ) c 2 ( 2 ) c 3 ( 2 )   c 4 ( 1 ) c 5 ( 1 ) c 6 ( 1 ) c 4 ( 2 ) c 5 ( 2 ) c 6 ( 2 )   c 1 ( t ) c 2 ( t ) c 3 ( t )   c 4 ( t ) c 5 ( t ) c 6 ( t ) ] = [ c 1   c 2   c 3   c 4   c 5   c 6 ]
c i = [ c i ( 1 )   c i ( 2 )     c i ( t )   ] T ,   i   =   1 , 2 , 3 , 4 , 5 , 6
In theory, the correlation coefficient series for the same sample should be larger at beginning, and with the arrival of a bundle of data the correlation coefficient has a tendency to adjust, and then with the advent of large amounts of data the correlation coefficient would be gradually stabilized.
For the six parameters of AE signal, the correlation coefficients between two AE signals has the tendency from vibration to decline to smooth, but these result cannot be correlated with the tensile process. So the correlation coefficient series of acoustic emission signals need to be integrated to reduce the volatility of the correlation coefficient series trends. The mean and median correlation coefficient series Cmean and Cmedian were calculated as follows:
C mean = [ C m e a n ( 1 )  C m e a n ( 2 )  C m e a n ( 3 )    C m e a n ( t )   ] T
C m e a n ( t ) = i = 1 6 ( c c o r r i ( t ) ) 6
c c o r r i ( t ) = j C R ρ ( c i ( t ) , c j ( t ) ) ,   i   =   1 , 2 , 3 , 4 , 5 , 6 ,   j C R = { 1 , 2 , 3 , 4 , 5 , 6 , and  j i }
ρ ( c i ( t ) , c j ( t ) ) = E [ ( c i t E ( c i t ) ) ( c j t E ( c j t ) ) ] D ( c i ) D ( c j ) , c i t = [ c i ( 1 )   c i ( 2 )     c i ( t )   ] T , c j t = [ c j ( 1 )   c j ( 2 )     c j ( t )   ] T
C median = [ C median ( 1 )  C median ( 2 )  C median ( 3 )    C median ( t )   ] T
C median ( t ) = median ( c c o r r i ( t ) ) ,   i   =   1 , 2 , 3 , 4 , 5 , 6
Then the Cmean and Cmedian curve are in the Figure 6:
Figure 6. Cmean and Cmedian curve for AE signal of the tensile samples. (a) Sample a; (b) Sample b.
Metals 05 00228 g006
It can be seen that the Cmean and Cmedian curves have the same tendency, and the value at the transition point from elastic stage to yield stage are closer. For the 15 samples, these tendencies are same and the transition point values are closer. Therefore, the mean and median correlation coefficient series Cmean and Cmedian can characterize the process of the material tensile damage just as the characteristic parameter of material performance degradation, while the closely values can be used to conceive the failure criteria of the material performance degradation.

3.3. Failure Criteria of the Material Performance Degradation

To determine the failure criteria, 15 tensile tests with AE instrument have been done. Some of the statistical results of AE signal were shown in Table 1.
Table 1. The statistical results of AE signal.
SampleCmean at Transition PointCmedian at Transition Point
Sample 12.342.82
Sample 22.283.03
Sample 32.473.06
Sample 42.703.45
Sample 52.142.75
Sample 62.823.12
It can be seen that Cmean and Cmedian are at different value levels, but the each value of Cmean and Cmedian at the point from elastic stage to yield stage is relatively concentrated seperately. The difference value of each row of Cmean and Cmedian is related to the number of samples and the material dispersion of different position of casting structure. For normal distribution is a common method in the research for stress strength, the normal distribution analysis has been done for Cmean and Cmedian at transition point. The normal probability density functions were shown in Figure 7.
Figure 7. Histogram and normal distribution analysis of Cmean and Cmedian at the transition point. (a) Histogram and normal distribution analysis of Cmean; (b) Histogram and normal distribution analysis of Cmedian.
Metals 05 00228 g007
μ mean = 2.3087 , σ mean 2 = 0.113 , μ median = 2.9813 , σ median 2 = 0.0968
It can be seen that the value of Cmedian is more concentrated than the value of Cmean, so the value of Cmedian at the point from elastic stage to yield stage was chosen to be the failure criteria, which named as CTpoint. fTpoint(CTpoint) is the normal probability density function, and FTpoint(CTpoint) is the normal distribution function. fTpoint(CTpoint) and FTpoint(CTpoint) were shown in Figure 8.
f T point ( C T point ) = 1 σ median 2 π exp [ 1 2 ( C T point μ median σ median ) 2 ]
F T point ( C T point ) = 1 σ median 2 π C T point exp [ 1 2 ( x μ median σ median ) 2 ] d x
Figure 8. The normal probability density function and the normal distribution function of CTpoint. (a) The normal probability density function of CTpoint; (b) The normal distribution function of CTpoint.
Metals 05 00228 g008
For the Cmedian series are declining with vibration at the point from elastic stage to yield stage, the probability distribution of tensile damage, named FT(CTpoint), is as follows:
F T ( C T point ) = 1 F T point ( C T point ) = 1 1 σ median 2 π C T point exp [ 1 2 ( x μ median σ median ) 2 ] d x
Based on the above analysis, in the research of performance degradation for tensile damage, the median value of correlation coefficient series, named Cmedian, would be choose as characteristic parameters of the material performance degradation. The result of the failure criteria of the material performance degradation obeyed the normal distribution N (μmedian, σ median 2 ).

4. Conclusions

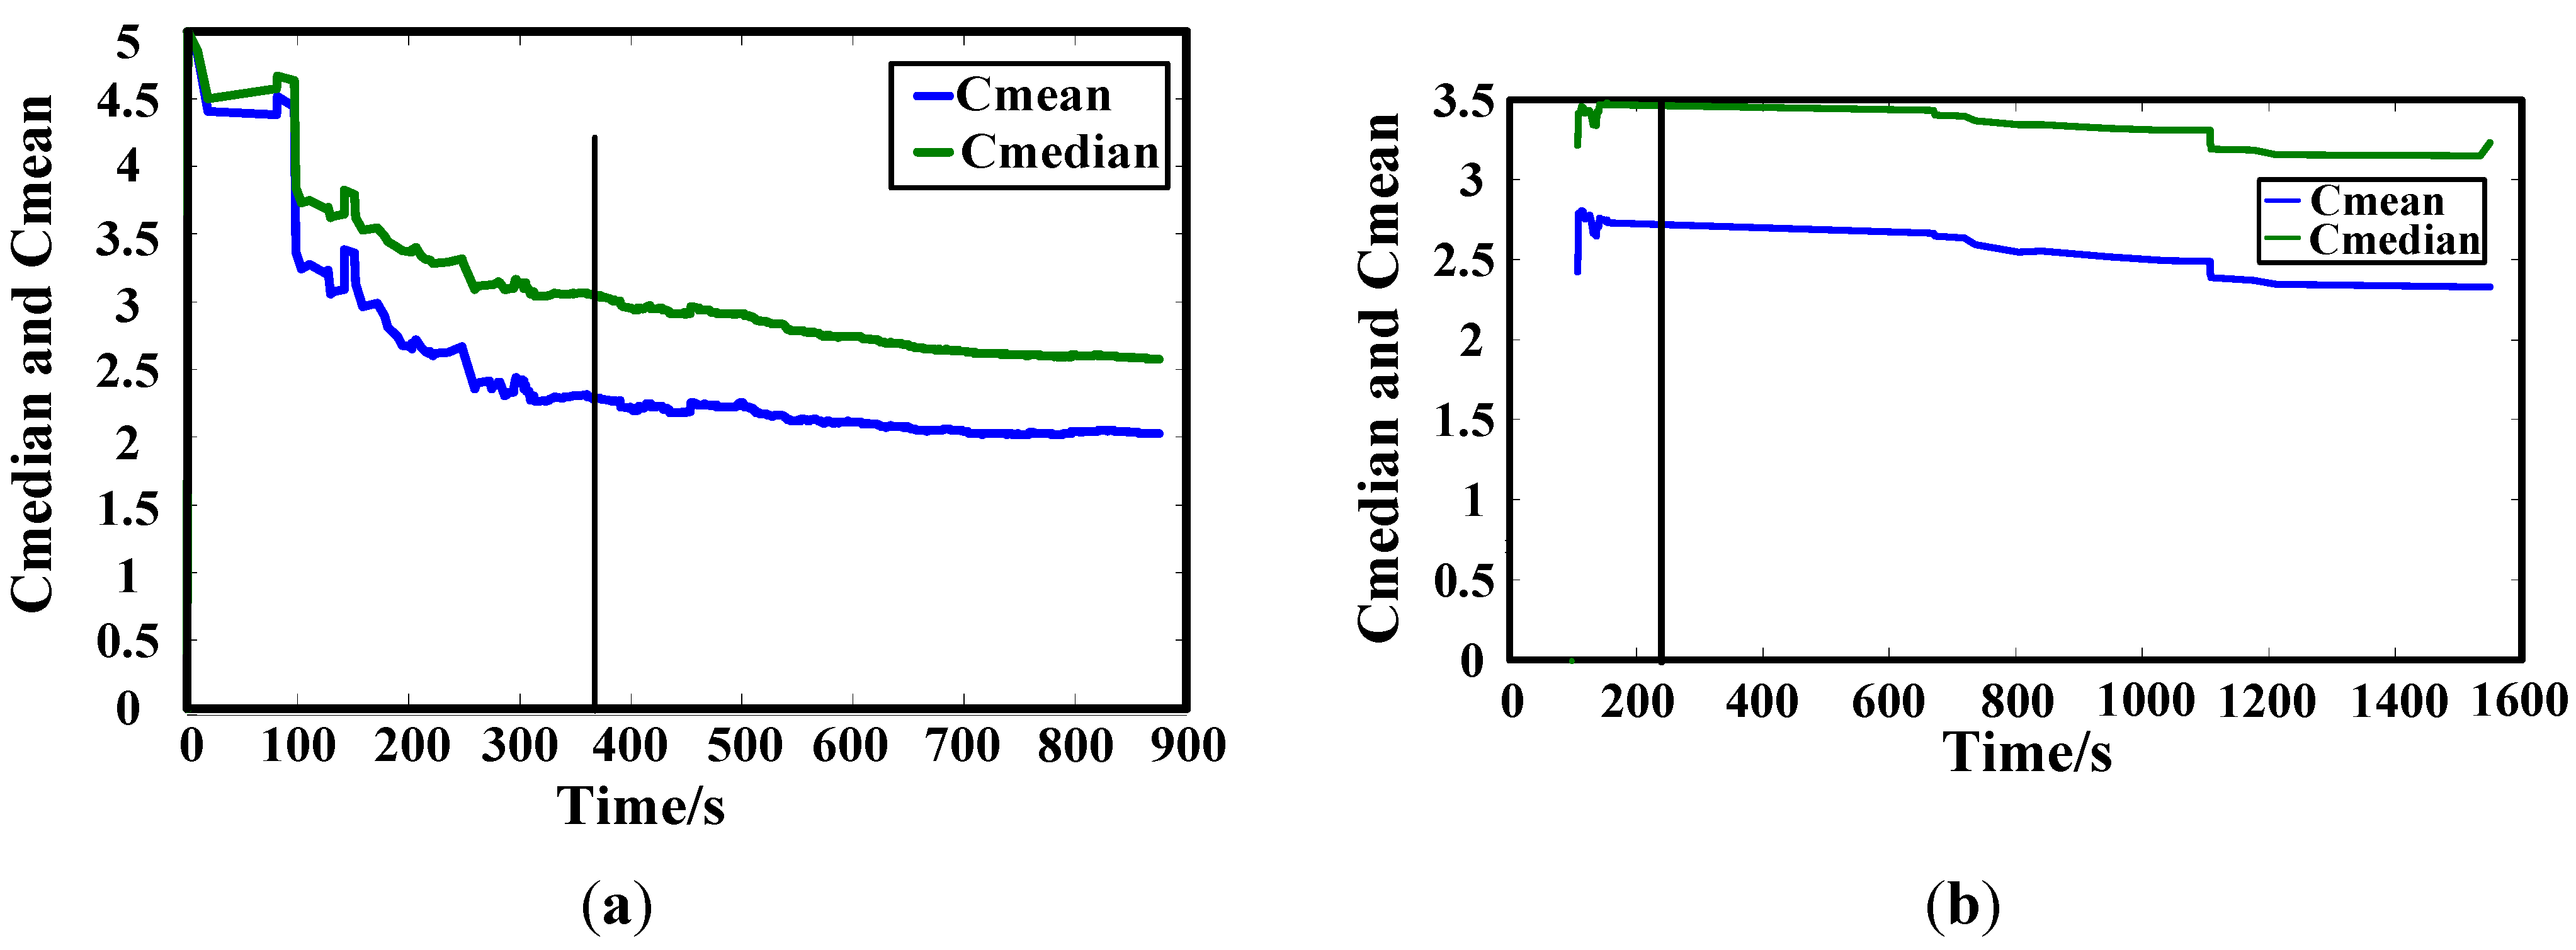
In this paper, the acoustic emission instrument was used for the performance degradation research of tensile damage of a high-strength aluminum alloy. Through data analysis and transformation of AE signals, the characteristics parameter of the material performance degradation Cmedian has been determined, the failure criteria of the material performance degradation has been developed and obeyed normal distribution N (μmedian, σ median 2 ). This result will provide basic research for further life prediction research.
The material researched in this paper is used for the gearbox shell of high-speed train. This research will provide non-destructive and real-time performance degradation analysis as a new method and approach, and also provide a new application background of the acoustic emission instrument. The result of this work expected to be widely used in other material performance degradation.

Acknowledgments

The authors would like to acknowledge the financial support provided by the National Natural Science Foundation of China (Grant No. 61273205), the Fundamental Research Funds for the Central Universities of China (Grant No. FRF-SD-12-028A), the 111 Project (Grant No. B12012).

Author Contributions

Yibo Ai and Weidong Zhang conceived and designed the study. Yibo Ai and Chang Sun performed the experiments. Hongbo Que provided the basic performance analysis of the material. Yibo Ai made the data analysis. Yibo Ai and Chang Sun wrote the paper. All authors read and approved the manuscript.

Conflicts of Interest

The authors declare no conflict of interest.

References

  1. Chen, C.Y. Innovation Strategy Research for Locomotive and Rolling Stock Industry of China. Master’s Thesis, Beijing Jiaotong University, Beijing, China, 2007. [Google Scholar]
  2. Li, Y. Cooperation Agreement of independent innovation Joint Action Plan for China high-speed train. Technol. Ind. China 2008, 3, 90. [Google Scholar]
  3. Zhang, W.D.; Zhang, X.W.; Yang, B.; Ai, Y.B. Damage characterization and recognition of aluminum alloys based on acoustic emission signal. J. Univ. Sci. Technol. Beijing 2013, 35, 626–633. [Google Scholar]
  4. Wang, B.M. Overall System and Bogie of High-Speed Motor Train Units; Southwest Jiaotong University Press: Chengdu, China, 2008. [Google Scholar]
  5. Li, X.J. CRH bullet trains overview. Railw. Tech. Superv. 2007, 9, 26–28. [Google Scholar]
  6. Ding, S.B.; Liu, F.J. New Non-Destructive Testing Technology and Application; Higher Education Press: Beijing, China, 2012. [Google Scholar]
  7. Lugo, M.; Jordon, J.B.; Horstemeyer, M.F.; Tschopp, M.A.; Harris, J.; Gokhale, A.M. Quantification of damage evolution in a 7075 aluminum alloy using an acoustic emission technique. Mater. Sci. Eng. A 2011, 528, 6708–6714. [Google Scholar] [CrossRef]
  8. Behrens, B.A.; Santangelo, A.; Buse, C. Acousic emission technique for online monitoring during cold forging of steel components: A promising approach for online crack detection in metal forging processes. Prod. Eng. Res. Dev. 2013, 7, 423–432. [Google Scholar] [CrossRef]
  9. Han, Z.Y.; Luo, H.Y.; Zhang, Y.B.; Cao, J.W. Effects of micro-structure on fatigue crack propagation and acoustic emission behaviors in a micro-alloyed steel. Mater. Sci. Eng. A 2013, 559, 534–542. [Google Scholar] [CrossRef]
  10. Maillet, E.; Morscher, G.S. Waveform-based selection of acoustic emission events generated by damage in composite materials. Mech. Syst. Signal Process. 2015, 52, 217–227. [Google Scholar] [CrossRef]
  11. Roca, A.S.; Fals, H.C.; Fernández, J.B.; Macías, E.J.; Adán, F.S. New stability index for short circuit transfer mode in GMAW process using acoustic emission signals. Sci. Technol. Weld. Join. 2007, 12, 460–466. [Google Scholar] [CrossRef]
  12. Roca, A.S.; Fals, H.C.; Fernández, J.B.; Macías, E.J.; Parte, M.P. Artificial neural networks and acoustic emission applied to stability analysis in gas metal arc welding. Sci. Technol. Weld. Join. 2009, 14, 117–124. [Google Scholar] [CrossRef]
  13. Cholette, M.E.; Djurdjavonic, D. Degradation modeling and monitoring of machines using operation-specific hidden Markov models. IIE Trans. 2014, 46, 1107–1123. [Google Scholar] [CrossRef]
  14. Hong, S.; Wang, B.Q.; Li, G.Q.; Hong, Q. Performance degradation assessment for bearing based on ensemble empirical mode composition and Gaussian mixture model. J. Vibr. Acoust. 2014, 136, 1006–1014. [Google Scholar] [CrossRef]
  15. Savage, J.J.; Seecharan, T.S.; Son, Y.K. Probability-based prediction of degrading dynamic systems. J. Mech. Des. 2013, 135, 2–15. [Google Scholar] [CrossRef]
  16. Dobrica, M.B.; Fillon, M. Performance degradation in scratched journal bearings. Tribol. Int. 2012, 51, 1–10. [Google Scholar] [CrossRef]
  17. China Standardization Committee. GB228–2002 Tensile Test for Metals Specimens; China Standard Press: Beijing, China, 2002. [Google Scholar]
  18. Yang, M.W. Acoustic Emission Testing; Machinery Industry Press: Beijing, China, 2005. [Google Scholar]

