Article

Optimization of Squeeze Casting Parameters for 2017 A Wrought Al Alloy Using Taguchi Method

1
National Engineering School of Sfax, (ENIS) B.P 599-3038, University of Sfax, Sokra 3000, Tunisia
2
SPCTS, University of Limoges, UMR CNRS 7315, F-87068 Limoges, France
*
Author to whom correspondence should be addressed.
Metals 2014, 4(2), 141-154; https://doi.org/10.3390/met4020141
Submission received: 11 February 2014 / Revised: 2 April 2014 / Accepted: 14 April 2014 / Published: 25 April 2014
(This article belongs to the Special Issue Advances in Solidification Processing)

Abstract

:
This study applies the Taguchi method to investigate the relationship between the ultimate tensile strength, hardness and process variables in a squeeze casting 2017 A wrought aluminium alloy. The effects of various casting parameters including squeeze pressure, melt temperature and die temperature were studied. Therefore, the objectives of the Taguchi method for the squeeze casting process are to establish the optimal combination of process parameters and to reduce the variation in quality between only a few experiments. The experimental results show that the squeeze pressure significantly affects the microstructure and the mechanical properties of 2017 A Al alloy.

Graphical Abstract

1. Introduction

Recently, great attention has been focused on aluminium and its alloys due to their high technological value and wide range of industrial applications, thanks to their various advantages such as lower density, good formability, high thermal conductivity, high specific rigidity, excellent corrosion resistance, high castability and attractive tensile strength [1,2]. For this reason, aluminium alloys are widespread, used especially in the most important industrial material of foundry. On the other hand, they offer important opportunities for applications in a diversity of areas particularly in mechanical automotive and aerospace industry [3].
In recent years, a new casting technology called squeeze casting has been developed to make better use of aluminium alloys [4]. Squeeze casting (as liquid metal forging) is a casting process which solidifies the molten metal under pressure on the closed die positioned between the plates of hydraulic press [5,6,7,8]. Compared with conventional casting methods, squeeze casting possesses many pronounced advantages, such as free shrinkage and gas porosity, to provide components with high integrity with improved mechanical properties. Yue et al. [9] found that the squeeze casting process was an ideal process to produce high quality light metal components with near net shape. Kim et al. [10] stated that squeeze casting accounted for a 15%–40% improvement in mechanical properties from the gravity die casting process. Vijian et al. [7] reported that squeeze casting exhibited remarkable grain refinement and substantial improvement in mechanical properties.
Many research works on squeeze casting parameters of aluminium alloys [11,12,13] and magnesium alloys [14,15] as well as their composites [16,17,18] have been reported in the literature. The intensity of applied pressure, the melt temperature and the die temperature have been shown to be among the most important parameters affecting the quality of squeeze cast components [7,19]. An understanding of the effects of process parameters is particularly important since the mechanical properties of components are related to the microstructure and the casting variables to a large extent [20]. In this regard, Malki et al. [11,12] have investigated effects of squeeze casting parameters on the macrostructure, microstructure, density and hardness of LM13 aluminium alloy. The results indicated that an increase in applied pressure decreased the grain size and SDAS (Secondary Dendrite Arm Spacing) of the primary α-phase (Al), as well as modifying the eutectic silicon particles and improving hardness. A decrease in the die or melt temperature rendered similar effects on the microstructure, macrostructure and hardness of the as-cast samples [11,12]. Optimizing these parameters is particularly important. However, Taguchi statistical design is a powerful method to understand the effect of these processing factors by running only a few experiments.
The present investigation aims, essentially, to determine a good combination of applied pressure, melt temperature and the die temperature for squeeze casting 2017 A wrought Al alloy. Ultimate tensile strength (UTS) and hardness tests of the liquid forged samples at different squeeze casting parameters were characterized and the optimal condition is found by the Taguchi method.

2. Statistical Analysis and Discussion

The squeeze casting process parameters namely squeeze pressure (A), melt temperature (B) and die temperature (C) at three levels are listed in Table 1. To ensure the accuracy of the results, three samples were fabricated for each of the parameter combinations. The averages were computed for ultimate tensile strength (UTS) and hardness in each of the nine experimental conditions. In the latter, main effect, variance analysis (ANOVA) and signal-to-noise (S/N) ratio are analyzed to find ranking and optimum levels of the process parameters.
Table 1. Results of L9 orthogonal array experiments.
NoABCUTS (MPa)Hardness (HV)
Y1Y2Y3AverageY1Y2Y3Average
130700200176178170174.66765696466.000
230750250159162167162.66756625959.000
330800300154157148153.66754585656.000
460700250178198189188.33377657973.666
560750300178172175175.00074656869.000
660800200175180185180.00076657873.000
790700300208213216212.33382808682.666
890750200202204209205.00080778480.333
990800250198203196199.00078707474.000

2.1. Main Effects

The average value of UTS and hardness for each parameter A, B and C at level 1, 2 and 3 are grouped in Table 2. The response graphs of the main effects and their variation between levels of the parameters on the UTS and hardness are shown in Figure 1 and Figure 2, respectively. The average values of the response at each parameter level are obtained by adding the results of all trails conditions at the level considered, and then dividing by the number of data points added. The main purpose of this work is to find the “larger is better” which is the experiment goal obtained by setting the process parameters. It is clear from Table 2 and from Figure 1 and Figure 2 that the UTS and hardness have maximum values at the third level of parameter A (90 MPa) and at the first level of parameters B (700 °C) and C (200 °C). Hence, it can be concluded that the optimum levels were A3 B1 C1. The increase in the UTS, and hardness with increasing squeeze pressure could be attributed essentially to the refinement of the microstructure. In general, the applied pressure has the advantage of increasing the density and suppressing the shrinkage during the solidification of metals [12,21,22]. In addition, decreasing both melting and die temperatures can cause the increase of UTS and hardness. This has been attributed to the sudden increase of cooling rate which leads to the decrease of the alloy grain size. It can also be seen from Table 3 that the above combination of factor levels (3, 1, 1) are not among the nine combinations tested for the experiment. The reason for this difference could be the multifactor nature of the experimental design employed (nine from 27 possible combinations).
Table 2. Levels average for main effects.
Level (L)Average UTS (MPa)Average Hardness (HV)
ABCABC
L1163.7191.8186.660.3374.1173.11
L2181.1180.9183.371.8969.4468.89
L3205.4177.6180.37967.6769.22
Max-Min41.814.26.218.676.444.22
Rank123123
Table 3. Experimental layout using L9 standard orthogonal array.
Test numberABC
1111
2122
3133
4212
5223
6231
7313
8321
9332
Figure 1. Main effects graph for ultimate tensile strength (UTS).
Metals 04 00141 g001
Figure 2. Main effects graph for hardness.
Metals 04 00141 g002

2.2. Analysis of Variance (ANOVA)

The analysis of variance (ANOVA) was used to investigate which parameters significantly affected the quality characteristic and to determine the percentage contribution of the parameters at 95% confidence level. The F ratio value named Fisher test was used to see which process parameters have a significant effect. Usually, when the F-values of experimental trials are higher than 5.32 (from the F table), it means that the change in the process parameter has significant effect on the quality characteristic. In addition, the percentage contribution expresses the importance of the process parameters for the response.
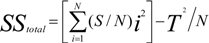
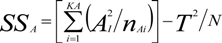
ANOVA analysis for UTS and hardness was carried out using Equations (2)–(6) and the resulting data is given in Table 4 and Table 5, respectively. The significance and importance of the parameters were determined by the F-value and percentage contribution, respectively. The F-value in Table 4 and 
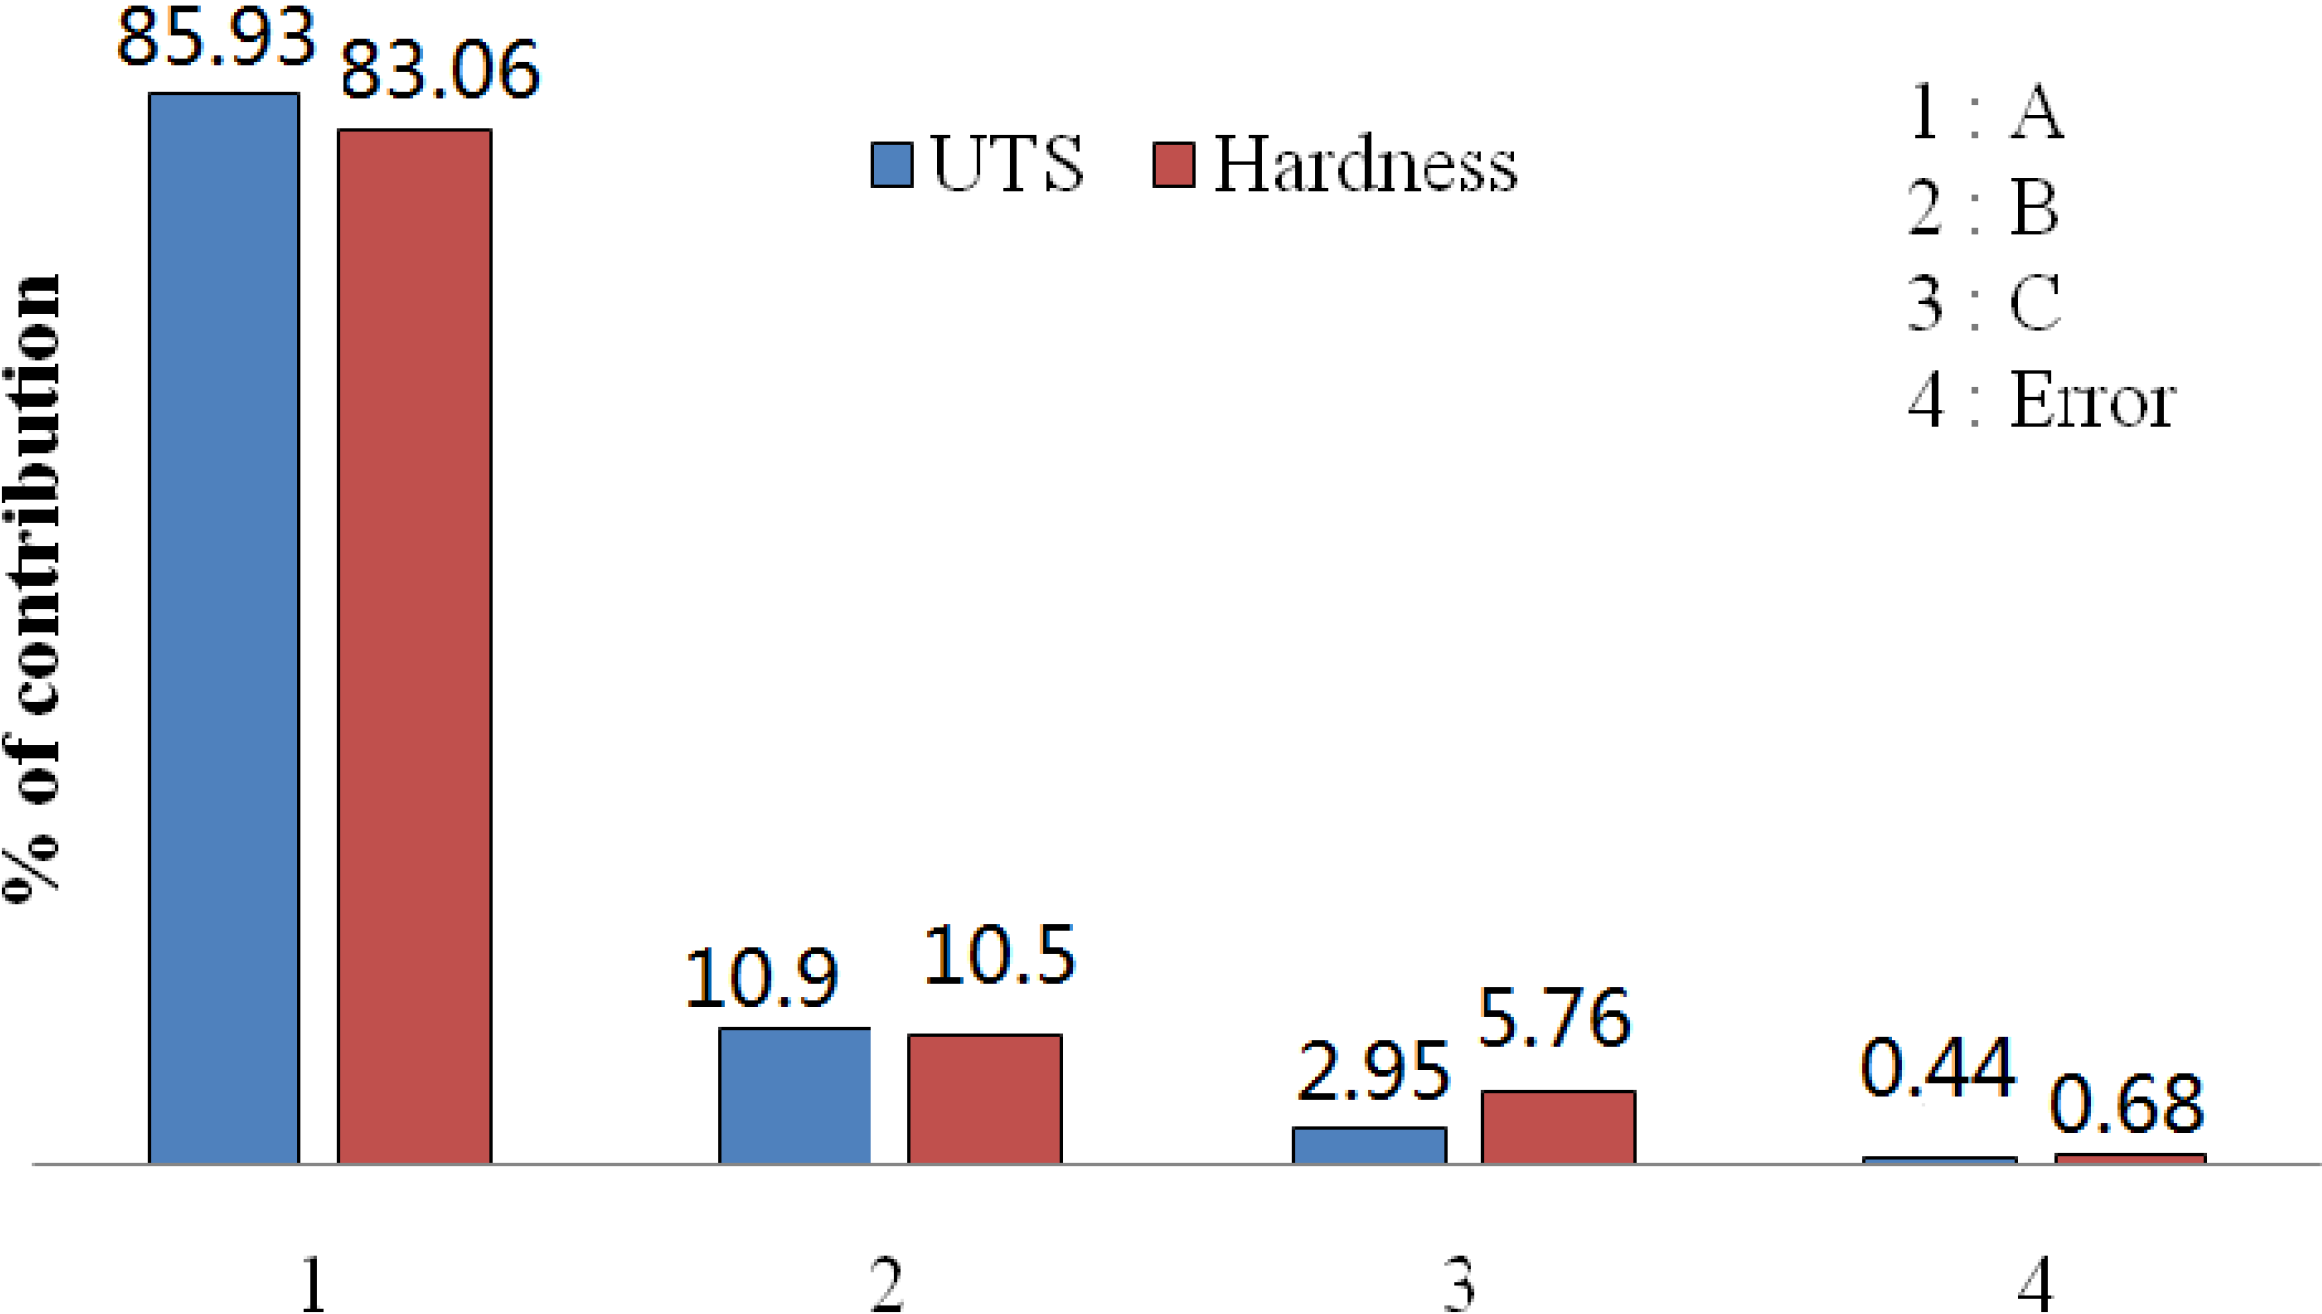
Table 5 shows that the considered process parameters are highly significant factors affecting the mechanical properties of 2017A Al alloy in the order of squeeze pressure (parameter A), melt temperature (parameter B) and die temperature (parameter C). However, squeeze pressure has the most significant effect on UTS and hardness as shown by much higher F-value (i.e., 197.74 and 122.33) and also percent contribution (i.e., 85.93 and 83.06). The percentage contribution of significant factors on the quality characteristic is shown in Figure 3.
Table 4. Variance (ANOVA) Table for ultimate tensile strength (UTS).
SourceDegrees of freedom (DOF)Sum of squares (SS)Variance (V)F ratioPercent contribution (P)
A25.93912.9695197.7485.93
B20.75910.379525.2810.98
C20.18310.09156.102.65
Error20.03000.0150 0.44
Total86.9114 100.00
Table 5. Variance (ANOVA) Table for hardness.
SourceDegrees of freedom (DOF)Sum of squares (SS)Variance (V)F ratioPercent contribution (P)
A28.47304.2364122.3383.06
B21.07120.535615.4710.50
C20.58750.29378.485.76
Error20.06930.0346 0.68
Total810.2009 100.00
Figure 3. Percentage contribution of significant control factors.
Metals 04 00141 g003

2.3. Signal to Noise Ratio (S/N)

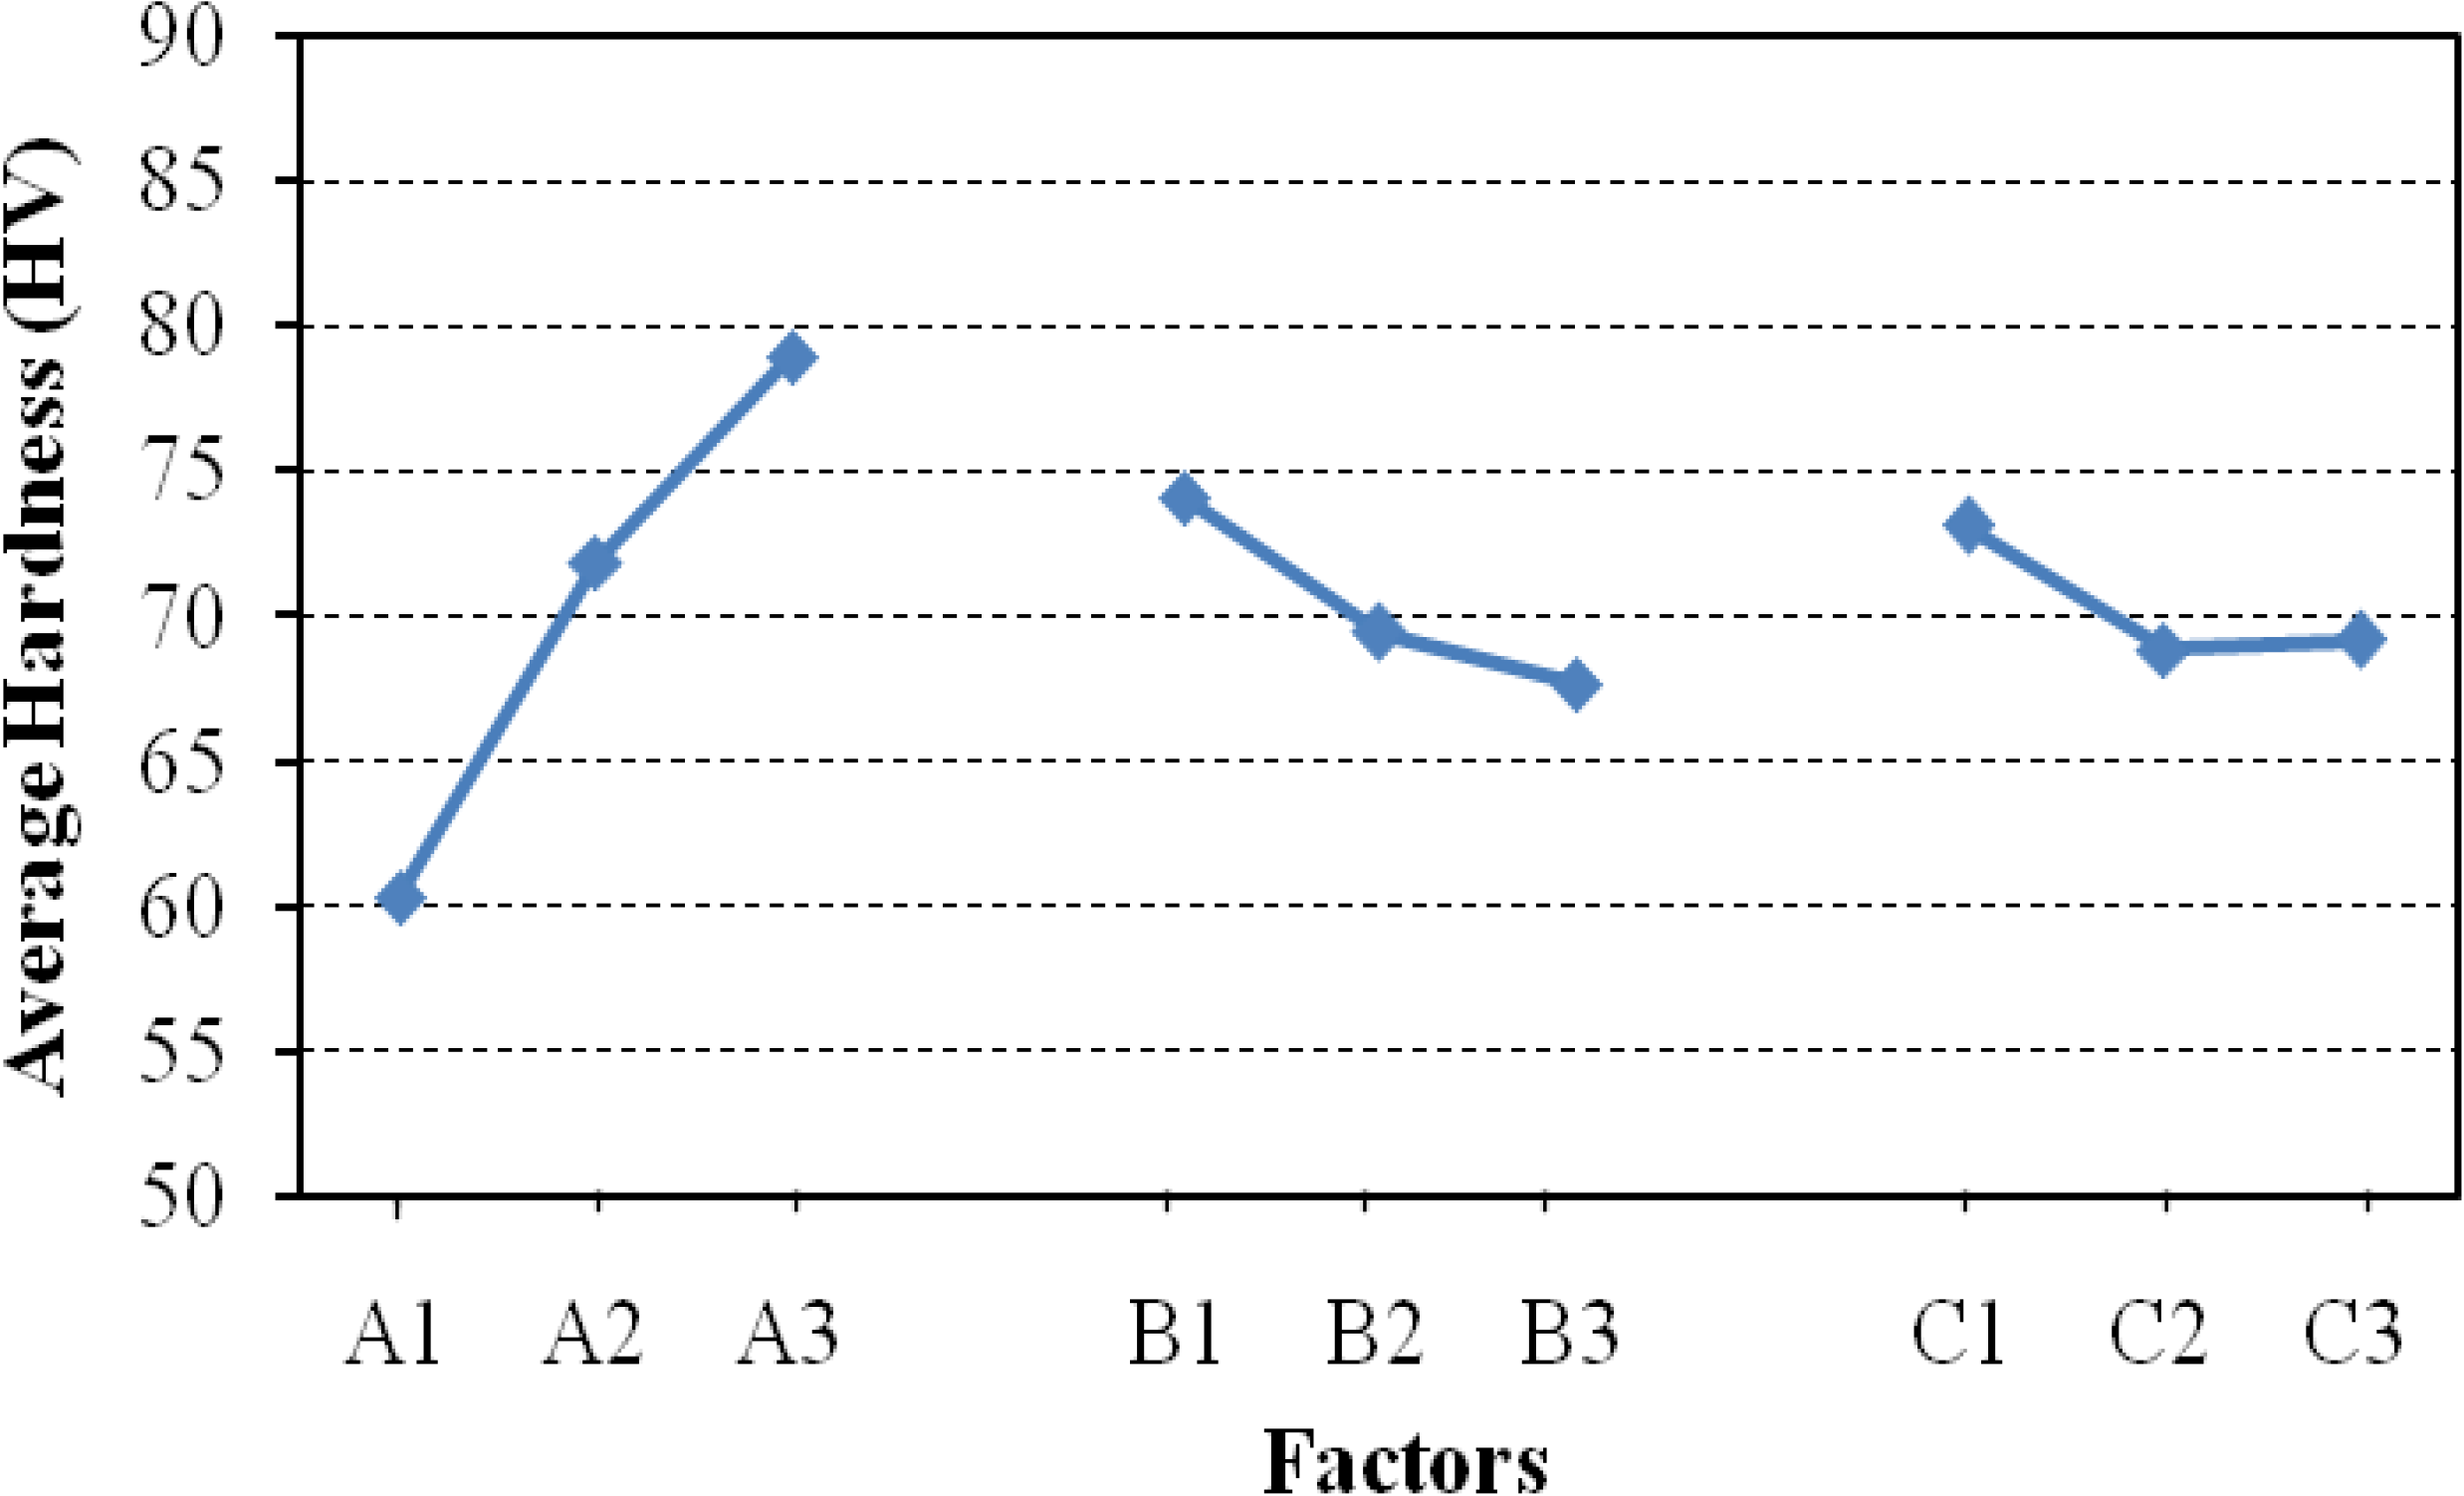
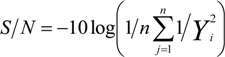
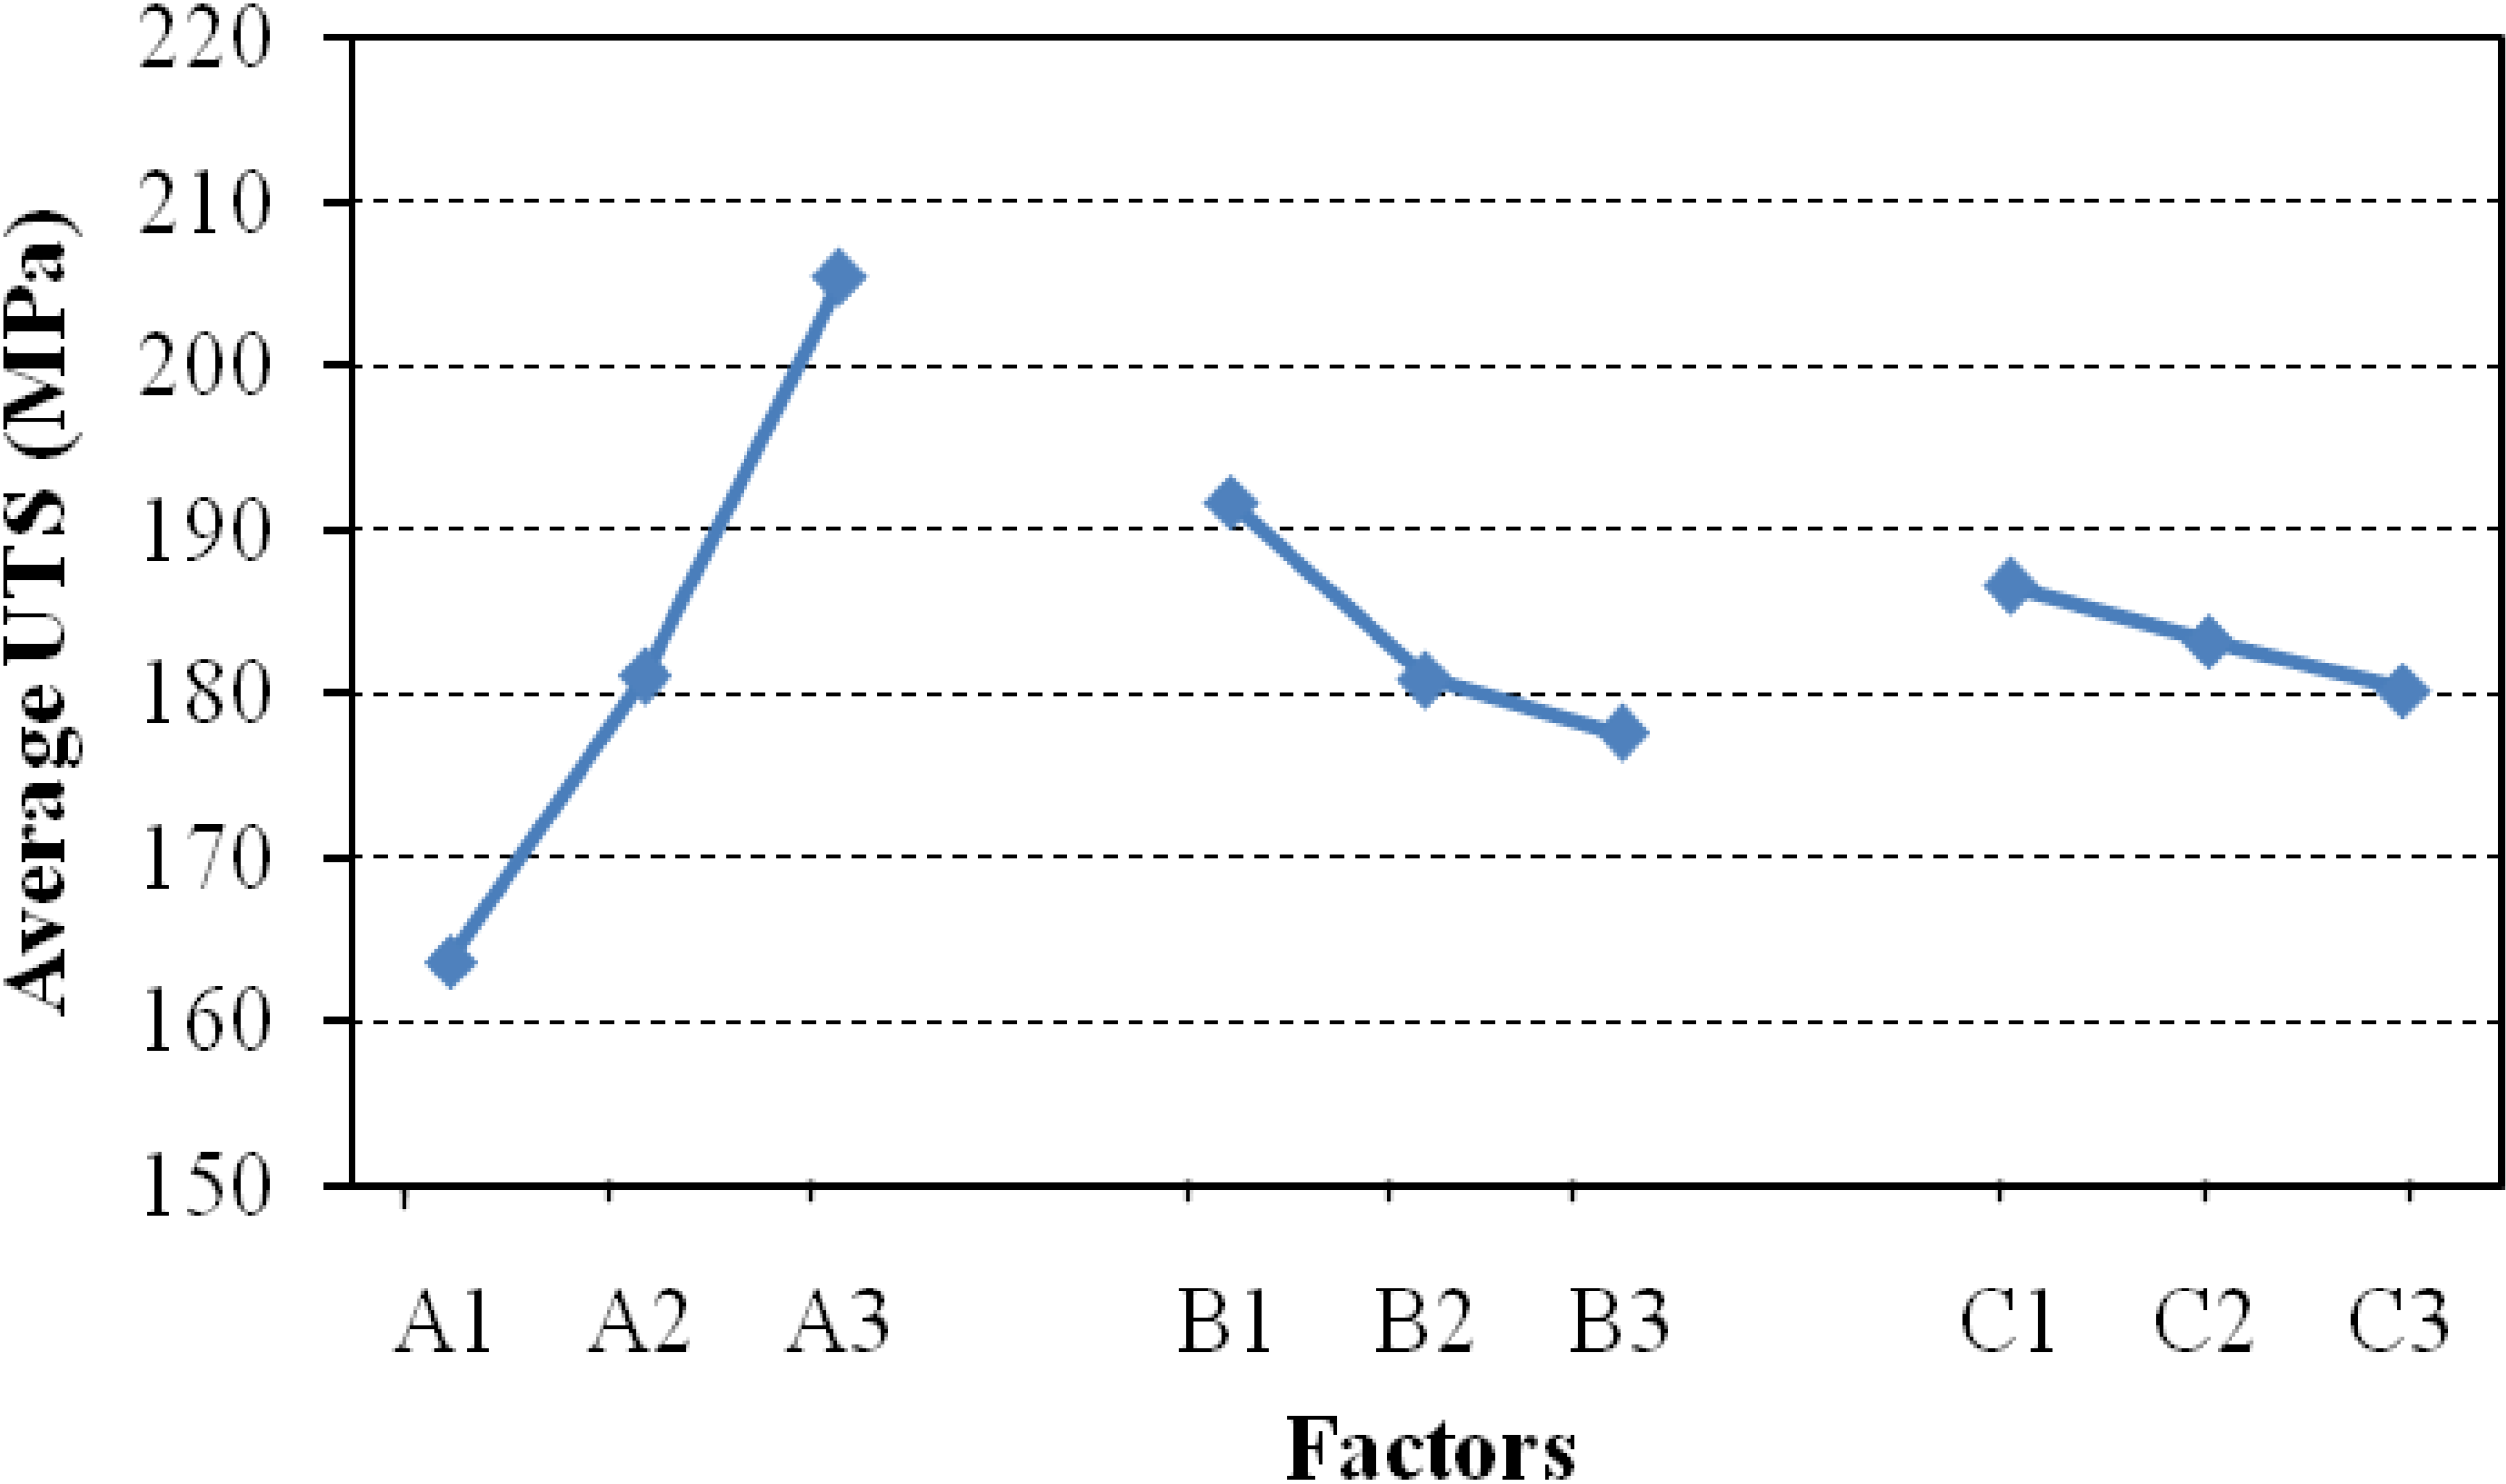
The next analysis was investigated by using analysis of signal-to-noise ratio (S/N). According to the data presented in Table 1 and Equation (6), the average response and S/N ratio of UTS and hardness for the nine experiments were calculated on the basis of the following procedure. Typically, the average effect for level 1 of the squeeze pressure is computed using data from experiments 1–3 of Table 6. Similarly, the average effects for levels 2 and 3 of squeeze pressure were computed using data from experiments 4–6 and 7–9, respectively. The level 3 for squeeze pressure (90 MPa, see No.7–9) has the highest S/N ratio value, which indicates that the casting performance at such level produces the minimum variation of the UTS and hardness due to uncontrollable factors. However, a maximum of S/N ratio corresponds to better quality characteristics [23]. It can also be seen from Table 6 that experiment number 7 possesses the largest S/N ratio when squeeze pressure at 90 MPa, melt temperature at 700 °C and die temperature at 300 °C; therefore, the combination of parameters and their levels is A3 B1 C3 as shown in Table 3.
Table 6. Computation of S/N ratio for ultimate tensile strength (UTS) and hardness.
NoAverage UTSAverage hardnessS/N ratio of UTSS/N ratio of hardness
1174.66766.00044.83936.377
2162.66759.00044.22035.394
3153.66756.00043.72734.952
4188.33373.66645.47337.246
5175.00069.00044.85836.739
6180.00073.00045.09837.180
7212.33382.66646.53738.334
8205.00080.33346.23238.081
9199.00074.00045.97437.359
MeanY1=183.407Y2=70.407
The combination shown above differs from the previously mentioned one in main effects. It sheds light on the optimum combination of parameters and their levels. However, it shows that, in the present case study, the combination of parameters and their levels A3 B1 C3 yield optimum mechanical properties with minimum variance from the target value.

2.4. Estimation of Predicted Mean and Confirmation Test

The purpose of estimation of predicted means is to validate the squeeze casting condition at the optimal levels of parameters, which is A3 B1 C1 for mechanical properties. The predicted mean (μ) for UTS and hardness was estimated using the following two equations [24]:
μUTS = Y1 + (A3Y1) + (B1Y1) + (C3Y1)
μhardness = Y2 + (A3Y2) + (B2Y2) + (C3Y2)
where, A3 is the average UTS and hardness at third level of squeeze pressure (Table 2), B1 is the average UTS and hardness at first level of melt temperature (Table 2), C1 is the average UTS and hardness at first level of die temperature (Table 2), Y1 and Y2 are the means of UTS and hardness (Table 6). Substituting the values of various terms in Equations (1) and (2), then
µUTS = 183.407 + (205.4 − 183.407) + (191.8 − 183.407) + (186.6 − 183.407) = 216.986 MPa
µhardness = 70.407 + (79 − 70.407) + (74.11 − 70.407) + (73.11 − 70.407) = 85.406 HV
Three confirmation tests are conducted at the optimum settings of squeeze casting parameters recommended by the investigation. The average values of UTS and hardness obtained at the optimum settings of the process parameters are 219.333 MPa and 86.666 HV, respectively. We notice that the difference between the estimated results and the experimental results is negligible. Therefore, the experimental values are within the confidence interval of the predicted optimal of mechanical properties.

2.5.Effect of the Squeeze Pressure on Microstructure and Mechanical Properties

The influence of squeeze pressure (the most significant factor) on the microstructure and the mechanical properties has been analyzed on the basis of the statistical analysis developed in Section 2.1 (at pouring and die temperatures of 700 °C and 200 °C, respectively).
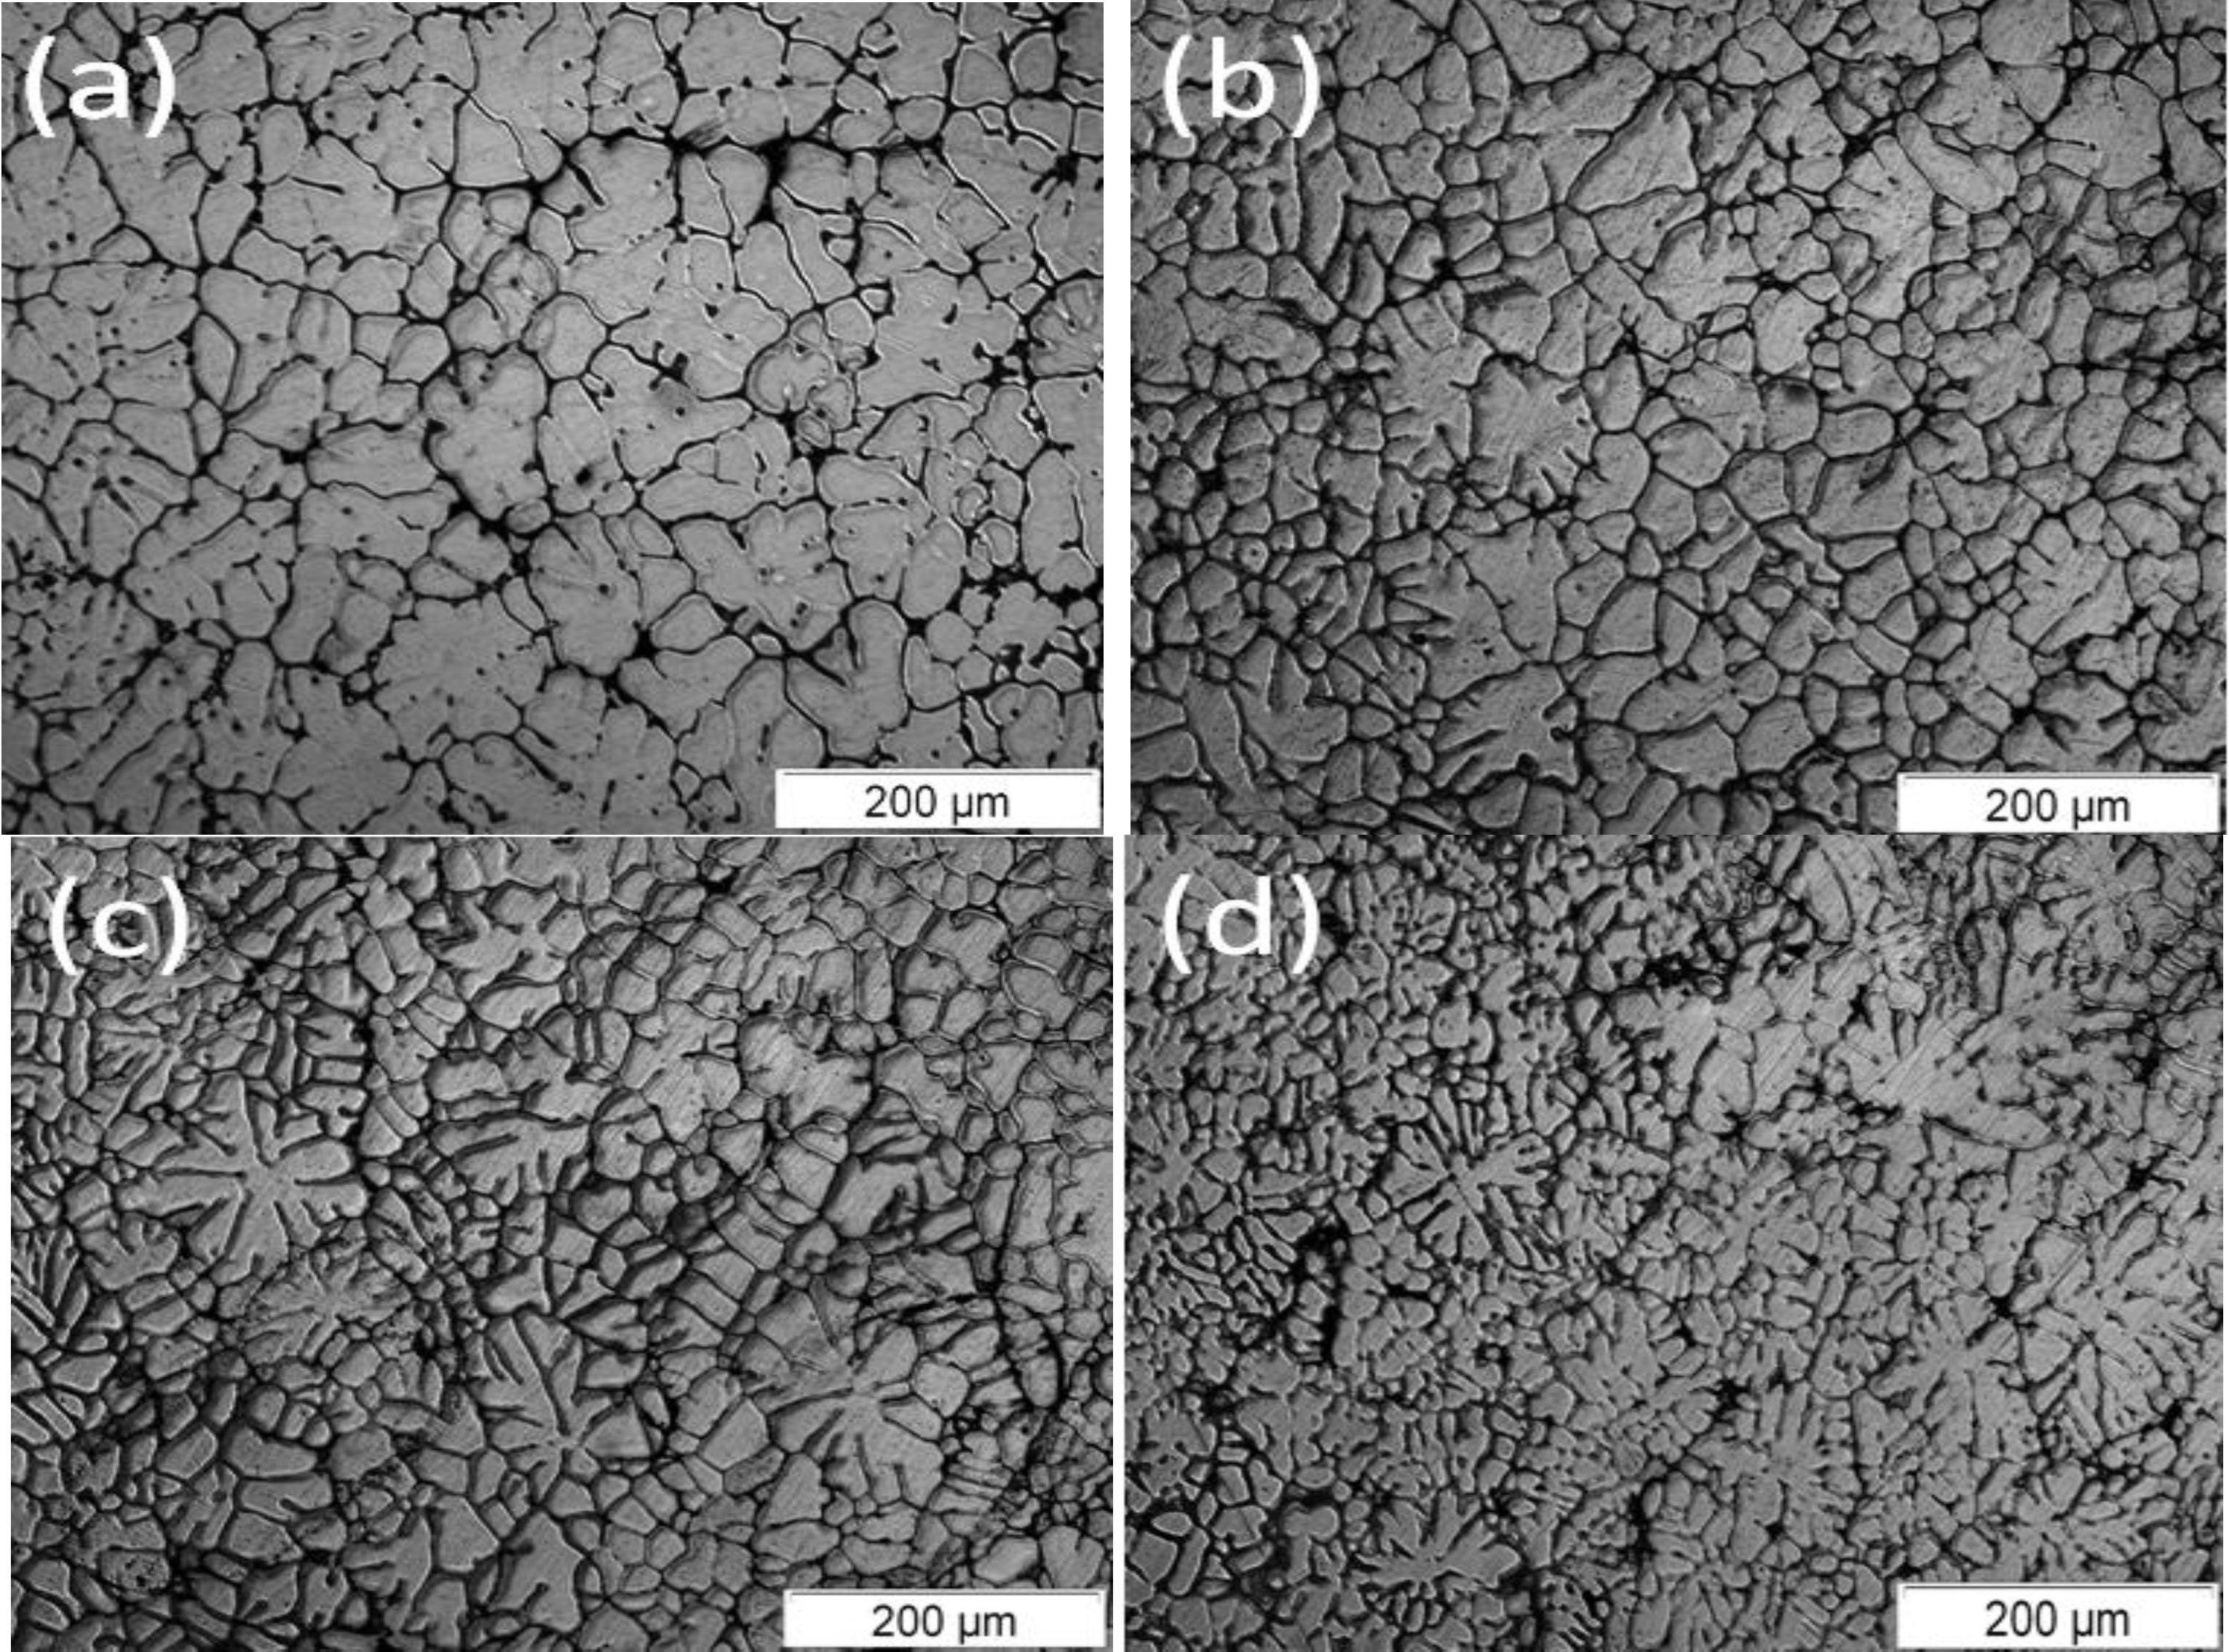
Figure 4a–d illustrates the microstructure of the 2017 A Al alloy squeeze cast under various pressure levels.
Figure 4. Optical micrographs of the squeeze cast sample (a) 15 MPa; (b) 30 MPa; (c) 60 MPa; and (d) 90 MPa applied pressure.
Metals 04 00141 g004
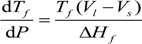
These micrographs show that the microstructures prepared under higher applied pressures are much finer and smaller α-primary dendrites. It is clear that the squeezing pressure has significant influence on the microstructure of the alloy [7]. Furthermore, the inter-metallic phases in the alloy with no applied pressure are coarser than those under high squeezing pressure. This effect is a result of the change in phase diagram according to the Clausius-Clapeyron Equation [6]:
Metals 04 00141 i001
where Tf is the equilibrium freezing temperature, P is the applied pressure, Vl and Vs are the specific volumes of the liquid and solid, respectively, and ΔHf is the latent heat of fusion. During the solidification process, both ΔHf and (Vl − Vs) are normally negative due to the heat release and shrinkage of metals, respectively. Thus, dTf/dP is positive, which indicates that the applied pressure will increase the melting point of a metal having a volume decrease tendency during solidification. Increasing the freezing point causes undercooling in the alloy that is already superheated. However, such change in freezing temperature with the increasing pressure is expected due to the reduction in interatomic distance and thus the restriction of atomic movement [6]. The higher freezing point brings about the larger undercooling in the initially superheated alloy and thus elevates the nucleation frequency, resulting in a more fine-grained structure. Apart from the changes in undercooling of the molten alloy caused by applied pressure, greater cooling rates for the solidifying alloy can be realized due to reduction in the air gap between the alloy and the die wall and thus larger effective contact area. Obviously, the increase of cooling rate and heat-transfer coefficient will result in the refinement of the grain size of squeeze casting alloy.
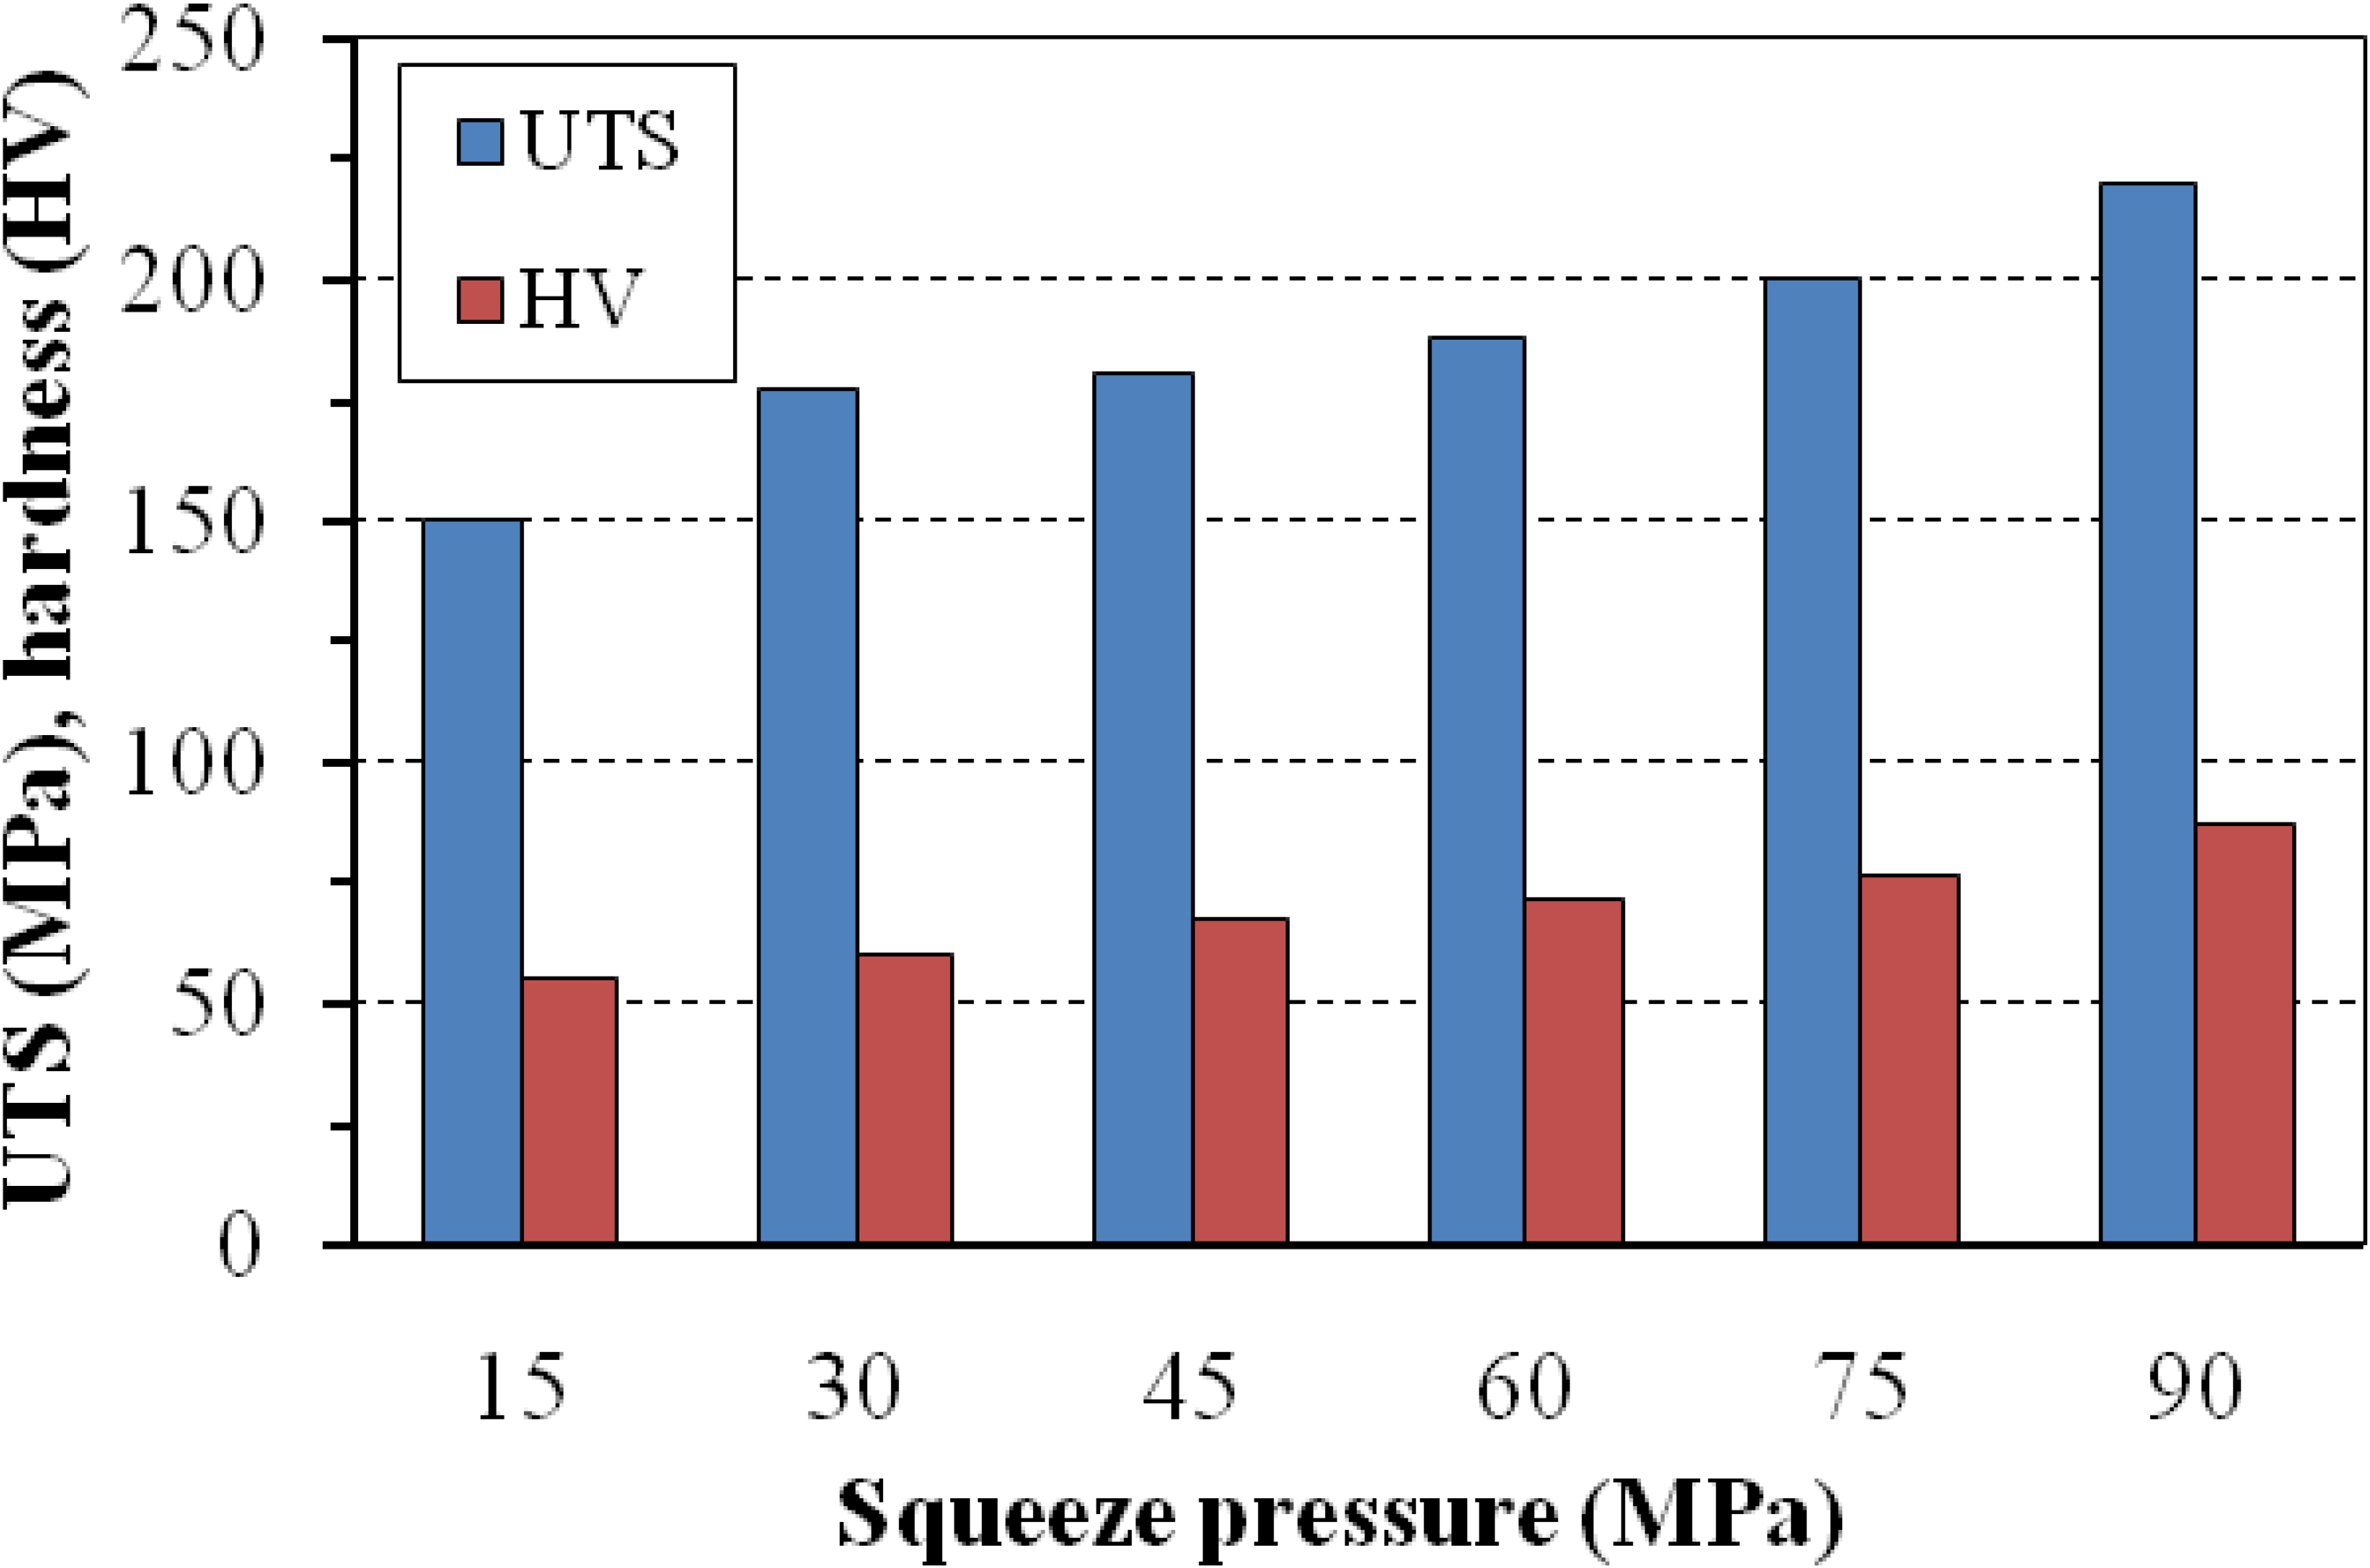
The mechanical properties of squeeze cast specimens such as ultimate tensile strength (UTS) and hardness (HV) are compiled in Figure 5. It shows that an increase in squeeze pressure from 15–90 MPa enhances the UTS with 46% increment from 150 MPa (15 MPa) to 219.66 MPa (90 MPa). Also, there is a 58% increase in hardness over the 15 MPa squeeze pressure.
Evidently the improvement of mechanical properties by increasing the pressure up to 90 MPa seems to be attributed, in part, to the refinement of the α-primary dendrites and, in part, to material densification.
Figure 5. Ultimate tensile strength (UTS) and hardness of 2017 A Al alloy manufactured in various conditions.
Metals 04 00141 g005

3. Experimental Procedure

3.1. Design of Experiments

The traditional experimental techniques, i.e., varying one parameter at a time while keeping others constant is complex and further suffers from the major drawback of a large number of experiments which in turn increases the cost of experiments to achieve superior-quality products. The Taguchi method is one of the solution tools that helps decrease the number of experiments [25] and to achieve a high quality system without increasing costs [26]. This technique that combines the quality loss function concept and experimental design theory has been applied for solving several complex problems in manufacturing industries.
In this study, the Taguchi method has been adopted to observe the influencing process parameters in the squeeze casting process. Taguchi statistical design is adopted to understand the effect of these processing parameters by running only a few experiments while achieving strong mechanical properties. The casting parameters each at three levels considered in this study and the details are presented in Table 7.
Table 7. Squeeze casting parameters and their levels.
NotationParametersLevel 1Level 2Level 3
ASqueeze pressure (Mpa)306090
BMelt temperature (°C)700750800
CDie temperature (°C)200250300
The Taguchi technique employs a generic signal-to-noise (S/N) ratio to quantify the present variation. Broadly speaking, the (S/N) ratio is the ratio of the mean (signal) to the standard deviation (noise). Depending on the particular type of characteristics involved, three types of S/N ratios are applicable, including “higher is better” (HB), “lower is better” (LB) and “nominal is best” (NB). Because the target of this work is to maximize the mechanical properties (UTS and hardness), the S/N ratio with HB characteristics is required, which is given by:
Metals 04 00141 i002
where n is the number of measurements in a trial under the same design conditions, (here n = 3), Y represents the results of measuring and subscript i indicates the number of simulation design parameters in the orthogonal array (OA) table.
A statistical analysis of variance (ANOVA) can be performed in order to see which process parameter (factor) is statistically significant for each quality characteristic (see Equations (7)–(11) [27,28]).
Metals 04 00141 i003
Metals 04 00141 i004
DOF = N − 1
Vfactor = SSfactor/DOF
Ffactor = Vfactor/Verror
where SStotal is the total sum of squares, N is the total number of experiments, SSA the factorial sum of squares due to factor A, KA represents the number of levels for factor A, Ai stands for the sum of the total ith level of the factor A, nAi the number of samples for ith level of factor A, T the sum of total (S/N) ratio of the experiments, DOF the number of degrees of freedom, Vfactor the variance of the factor, SSfactor represents the sum of squares of the factor and Ffactor is the F ratio of the factor.

3.2. Material

The experiments were carried out using a 2017 A wrought aluminium alloy. The material provides average tensile strength but good machinability. It is widely used in mechanical applications [29,30]. The alloy is received as extruded bar of diameter 80 mm. Its chemical compositions are Cu 4.47, Mg 0.45, Si 0.86, Fe 0.49, Mn 0.36, Ni 0.1, Pd 0.03, Zn 0.25, Cr 0.1 (mass fraction, %) and Al balance. The material was melted in an electric resistance furnace using a steel crucible.

3.3. Squeeze Casting Method

The squeeze casting experiments were performed on a hydraulic press (see Figure 6 and Figure 7) consisting of steel mould. The device allows the molding of vertical specimens under a pressure of up to 90 MPa applied by the punch until material solidification. The device is also equipped with a thermocouple which provides temperature regulation of the mold. The punch-and-die set were made of hot-die steel and the cast billet is a rod shaped with a circular cross-section of 23 mm diameter and a length of 110 mm. The die was coated with a graphite suspension before each experiment.
Figure 6. Experimental setup of squeeze casting process.
Metals 04 00141 g006
Figure 7. Schematic representation of squeeze casting process.
Metals 04 00141 g007

3.4. Tensile and Hardness Testing

The tensile specimens were machined to evaluate the ultimate tensile strength (UTS). For each experimental condition, three specimen samples were prepared. INSTRON (ENSIL, Limoges, France) universal testing machine was used for performing tensile tests on the specimens. The tests were performed under displacement control with a strain rate start at 1 mm·min−1. An extensometer (gage length of 14.3 mm) is attached with two rubber bands to the central part of the specimen.
Hardness analysis HV was performed on a transverse section of the specimen. Measurements were performed employing a MEKTON Vickers Hardness Tester with a diamond pyramidal indenter. Three measurements were taken at randomly selected points with a load of 300 g applied for 30 s.

3.5. Selection of Orthogonal Array (OA)

In Taguchi technique, experimental analysis is based on orthogonal array (OA). It is the shortest possible matrix of combinations in which all the parameters vary at the same time and their effect and performance interactions are studied simultaneously. The selection of an appropriate orthogonal array depends on the total degrees of freedom (DOF) required [31]. In this study, an L9 (33) standard orthogonal array is considered in determining the effect of three process parameters. Thus, the array has three columns and nine rows of three levels. The number of experiments required can be reduced to nine, which in classical combination method using full factorial experimentation would require 33 = 27 experiments to capture the influencing parameters. An L9 standard OA is shown in Table 3 was employed for present investigation.

4. Conclusions

In this study, the optimal squeeze casting parameters of 2017 A wrought aluminium alloy have been specified through the Taguchi method, and the obtained results are acceptable for the ranges of squeeze parameters that have been selected in the present investigation. According to the results, the following conclusions can be drawn:
  • The combination A3 B1 C1 that means squeeze pressure 90 MPa, melt temperature 700 °C and die temperature 200 °C are recommended to obtain higher mechanical properties in squeeze casting of 2017 A Al alloy.
  • Squeeze pressure, melt temperature and die temperature were identified as significant process parameters from ANOVA. It is noted that the contribution of squeeze pressure is a larger for the UTS and hardness.
  • From the S/N ratio, it was evident that the combination of parameters and their levels A3 B1 C3 yield the optimum mechanical properties with minimum distinction about the target value.
  • The refinement of microstructure was the main reason for increasing the mechanical properties of the squeeze cast specimens.

Acknowledgments

The authors would like to acknowledge Jean-Pierre Lecompte for carrying out the experimental work at “Higher Engineering School of Limoges” (ENSIL), France. One of the authors, Najib Souissi would like to acknowledge very much, the Tunisian Ministry of Higher Education and Scientific Research for its financial support.

Conflicts of Interest

The authors declare no conflict of interest.

References

  1. Cole, G.S.; Sherman, A.M. Light weight materials for automotive applications. Mater. Charact. 1995, 35, 3–9. [Google Scholar] [CrossRef]
  2. Miller, W.S.; Zhuang, L.; Bottema, J.; Wittebrood, A.J.; de Smet, P.; Haszler, A.; Vieregge, V. Recent development in aluminum alloys for the automotive industry. Mater. Sci. Eng. A 2000, 280, 37–49. [Google Scholar] [CrossRef]
  3. Guo, H.; Yang, X. Preparation of semi-solid slurry containing fine and globular particles for wrought aluminium alloy 2024. Trans. Nonferr. Metal Soc. 2007, 17, 799–804. [Google Scholar] [CrossRef]
  4. Zhong, Y.; Su, G.; Yang, K. Microsegregation and improved methods of squeeze casting 2024 Aluminum alloy. J. Mater. Sci. Technol. 2003, 19, 413–416. [Google Scholar]
  5. Murali, S.; Yong, M.S. Liquid forging of thin Al-Si structures. J. Mater. Process. Technol. 2010, 210, 1276–1281. [Google Scholar] [CrossRef]
  6. Ghomashchi, M.R.; Vikhrov, A. Squeeze casting: An overview. J. Mater. Process. Technol. 2000, 101, 1–9. [Google Scholar] [CrossRef]
  7. Vijian, P.; Arunachalam, V.P. Experimental study of squeeze casting of gunmetal. J. Mater. Process. Technol. 2005, 170, 32–36. [Google Scholar]
  8. Brito, C.C.D.; Magalhaes, F.D.; de Morais Costa, A.L.; Siqueira, C.A. Microstructural analysis and tensile properties of squeeze cast Al-7%Mg alloy. Mater. Sci. Forum. 2010, 643, 119–123. [Google Scholar] [CrossRef]
  9. Yue, T.M.; Chadwick, G.A. Squeeze casting of light alloys and their composites. J. Mater. Process. Technol. 1996, 58, 302–307. [Google Scholar] [CrossRef]
  10. Kim, S.W.; Durrant, G.; Lee, J.-H.; Cantor, B. The microstructure of direct squeeze cast and gravity die cast 7050 (Al-6.2Zn-2.3Cu-2.3Mg) wrought Al alloy. J. Mater. Synth. Process. 1998, 6, 75–87. [Google Scholar] [CrossRef]
  11. Maleki, A.; Shafyei, A.; Niroumand, B. Effects of squeeze casting parameters on the microstructure of LM13 alloy. J. Mater. Process. Technol. 2009, 209, 3790–3797. [Google Scholar] [CrossRef]
  12. Maleki, A.; Niroumand, B.; Shafyei, A. Effects of squeeze casting parameters on density, macrostructure and hardness of LM13 alloy. Mater. Sci. Eng. A 2006, 428, 135–140. [Google Scholar] [CrossRef]
  13. Amin, K.M.; Mufti, A.N. Investigating cooling curve profile and microstructure of a squeeze cast Al-4%Cu alloy. J. Mater. Process. Technol. 2012, 212, 1631–1639. [Google Scholar] [CrossRef]
  14. Yong, M.S.; Clegg, A.J. Process optimization for a squeeze cast magnesium alloy. J. Mater. Process. Technol. 2004, 145, 134–141. [Google Scholar] [CrossRef]
  15. Goh, C.S.; Soh, K.S.; Oon, P.H.; Chua, B.W. Effect of squeeze casting parameters on the mechanical properties of AZ91–Ca Mg alloys. Mater. Des. 2010, 31, S50–S53. [Google Scholar] [CrossRef]
  16. Maleki, A.; Meratian, M.; Niroumand, B.; Gupta, M. Synthesis of In situ aluminum matrix composite using a new activated powder injection method. Metall. Mater. Trans. A 2008, 39, 3034–3039. [Google Scholar] [CrossRef]
  17. Zhang, X.N.; Geng, L.; Wang, G.S. Fabrication of Al-based hybrid composites reinforced with SiC whiskers and SiC nano particles by squeeze casting. J. Mater. Process. Technol. 2006, 176, 146–151. [Google Scholar] [CrossRef]
  18. Yong, M.S.; Clegg, A.J. Process optimization for a squeeze cast magnesium alloy metal matrix. J. Mater. Process. Technol. 2005, 168, 262–269. [Google Scholar]
  19. Vijian, P.; Arunachalam, V.P. Modelling and multi objective optimization of LM24 aluminum alloy squeeze cast process parameters using genetic algorithm. J. Mater. Process. Technol. 2007, 186, 82–86. [Google Scholar] [CrossRef]
  20. Dai, W.; Wu, S.; Lü, S.; Lin, C. Effects of rheo-squeeze casting parameters on microstructure and mechanical properties of AlCuMnTi Alloy. Mater. Sci. Eng. A 2012, 538, 320–327. [Google Scholar] [CrossRef]
  21. Laukli, H.I.; Gourlay, C.M. Effects of Si content on defect band formation in hypoeutectic Al–Si die castings. Mater. Sci. Eng. A 2005, 413–414, 92–97. [Google Scholar] [CrossRef]
  22. Sevik, H.; Kurnaz, S.C. Properties of alumina particulate reinforced aluminum alloy produced by pressure die casting. Mater. Des. 2006, 27, 676–683. [Google Scholar] [CrossRef]
  23. Sharma, P.; Verma, A.; Sidhu, R.K.; Panday, O.P. Process parameter selection for strontium ferrite sintered magnets using Taguchi L9 orthogonal design. J. Mater. Process. Technol. 2005, 168, 147–151. [Google Scholar] [CrossRef]
  24. Te-Sheng, L.; Szu-Hung, C.; Hsuen, C. Thermal-flow techniques for sub-35 nm contact-hole fabrication using Taguchi method in electron-beam lithography. Microelectron. Eng. 2009, 86, 2170–2175. [Google Scholar] [CrossRef]
  25. Asiltürk, I.; Akkus, H. Determining the effect of cutting parameters on surface roughness in hard turning using the Taguchi method. Measurement 2011, 44, 1697–1704. [Google Scholar]
  26. Mariajayaprakash, A.; Senthilvelan, T. Failure detection and optimization of sugar mill boiler using FMEA and Taguchi method. Eng. Fail. Anal. 2013, 30, 17–26. [Google Scholar] [CrossRef]
  27. Savas, O.; Kayikci, R. Application of Taguchi’s methods to investigate some factors affecting microporosity formation in A360 aluminum alloy casting. Mater. Des. 2007, 28, 2224–2228. [Google Scholar] [CrossRef]
  28. Wu, D.H.; Chang, M.S. Use of Taguchi method to develop a robust design for the magnesium alloy die casting process. Mater. Sci. Eng. A 2004, 379, 366–371. [Google Scholar] [CrossRef]
  29. Metallic Materials and Elements for Aerospace Vehicle Structures. In US Department of Defense, MIL-HDBK-5H; U.S. Dept. of Defense: Washington, DC, USA, 1998; pp. 3–64.
  30. Vargel, C. The Most Common Wrought Aluminum Alloys. In Corrosion of Aluminium; Elsevier: Amsterdam, The Netherlands, 2004; pp. 65–66. [Google Scholar]
  31. Tsai, C.S. Evaluation and optimization of integrated manufacturing system operations using Taguchi’s experiment design in computer simulation. Comput. Ind. Eng. 2002, 43, 591–604. [Google Scholar] [CrossRef]

