2.1. Material Characterization
All kinds of Al-foams (F1 and F2) fabricated by the melt processing Alporas route exhibit typical closed-cells of spherical shape, although another outcome was true for Al-foams (F3 and F4) performed by the powder metallurgical (PM) route using powder compact precursor. Cells created from powder compacts displayed an elliptic-like shape with the major axis arranged along the extrusion direction. Anisotropy of the cell shape for PM Al-foams was found to be dependent on extrusion conditions and, especially, on the reduced coefficient,
ke [
12,
18]. In the present study, PM Al-foams (F3 and F4) composed of cells with aspect ratios 1.1 (F3) and 1.4 (F4) were produced and chosen for further experimentation. An additional difference concerns the fact that the mean cell size of carbonate foams (F2 and F4) was found to be smaller at least by a factor of 2 compared to that of hydride foams (F1 and F3). All kinds of Al-foams demonstrate non-homogeneous cell wall material microstructure, as shown in
Figure 1.
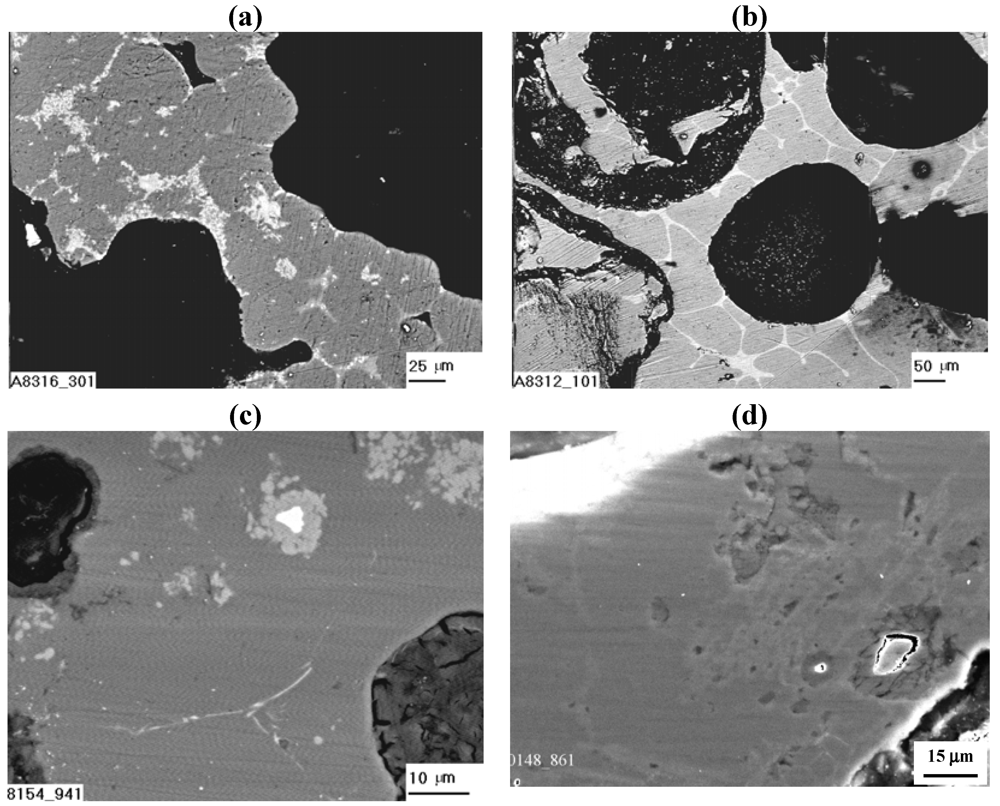
Figure 1.
SEM images of the cell walls for Al-foams produced with pure Al by (a,b) Alporas melt process and (c,d) powder metallurgical technique, all performed either with (a,c) TiH2 foaming agent or (b,d) CaCO3 foaming agent.
Nevertheless, cell wall constituents revealed in hydride and carbonate kinds of Al-foams are rather different and dependent on the processing technique and processing additives, as listed in
Table 1. As originally reported in [
12,
14,
18,
19], the cell wall material of Al-foams (F1 and F2) processed via the Alporas route comprises coarse Al dendrites rounded by a network of eutectic domains with composition dependent on the kind of foaming agent, TiH
2 or CaCO
3. As can be seen in
Figure 1(a,b), the hydride kind of Al-foam (F1) contains Al + Al
4Ca + Al
3Ti eutectic domains (light grey), whereas Al + Al
4Ca eutectic domains (light grey) are indicative of a carbonate kind of Al-foam (F2). In addition, incorporated Al-Ca-Ti particles (white) are found in the cell wall material of the hydride kind of Al-foam (F1), making the fraction volume of foreign constituents greater compared to that of CaCO
3-foam. Moreover, increased content (roughly about 0.26 at.%) of dissolved Ti is detected by energy dispersive spectroscopy in the Al matrix of the hydride kind of Al-foam (F1).
As can be seen in
Figure 1(c,d), huge numbers of foreign particles of partly converted foaming agents and/or their reaction products are randomly scattered in the cell walls of the Al-foams (F3 and F4) performed by the PM route. Small Al
3Ti particles (light grey) and Ti-rich particles (white) rounded by Al
3Ti layers (light grey) are indicative of a hydride kind of Al-foam (F3), as shown in
Figure 1c. In addition, trace amount of Al + Al
3Ti eutectic domains (light grey) are revealed within the cell walls of this kind of Al-foam. Network of Al
2O
3 (light grey) being a side product of a broken oxide layer, which always covers the Al powder particles, is also contained by the cell wall material, as can be seen in
Figure 1d. Compared to the hydride kind of Al-foam (F3), CaO particles (white) entrapped by Al
2O
3 network are found in the cell wall material of the carbonate kind of Al-foam (F4), as shown in
Figure 1d. Actually, few partly decomposed CaCO
3 particles (dark grey) are also expected within the cell wall material. These particles can survive in the cell wall material because of the slow kinetics of CaCO
3 decomposition [
7,
10]. As a general conclusion, it could be assumed that pronounced differences in the cell wall microstructure results from the difference in processing route and processing additives, as evidenced from
Table 1.
Table 1.
Characteristic features of the cell wall material created in Al-foams.
| Code | Process | Cell wall constituents |
|---|
| F1 | Alporas route | Al + (Al + Al3Ti + Al4Ca) domains + Al-Ca-Ti particles |
| F2 | Alporas route | Al + (Al + Al4Ca) domains |
| F3 | PM technique | Al + particles: Al3Ti, TiH2/Al3Ti, Al2O3 |
| F4 | PM technique | Al + particles: CaO, CaCO3, Al2O3 |
2.2. Mechanical Properties and Damage Behavior of Cell Wall Constituents
The set of mechanical characteristics determined for the materials studied compositionally corresponded to the cell wall constituents that have been revealed in the hydride and carbonate kinds of Al-foams, and are listed in
Table 2.
Several aspects should be mentioned here by comparison with the data listed in
Table 2. First of all it could be concluded that the presence of solute Ti in the Al matrix of the cell walls for hydride kinds of Al-foams (F1 and F3) causes Young’s modulus,
E, and nanohardness,
Hh, to rise. Titanium hydride, TiH
1.92, and Al
4Ca intermetallic compound give the values of Young’s modulus,
E, and yield strength, σ
ys, smaller than those for Al matrix, despite the fact that hardness numbers,
Hh and
HV, are much higher. Another fact is true for the other cell wall constituents and solid materials,
i.e., all of them exhibit much higher values of strength parameters such as
E,
Hh,
HV, and σ
ys, compared to those indicative of Al matrix alloy. The second aspect concerns the difference in plasticity behavior of the cell wall constituents and other solid materials being formed in the cell walls under the influence of different processing additives. Only Al + Al
4Ca eutectic domains demonstrate quite high plasticity close to the Al matrix (
δH ≥ 0.9), suggesting ductile behavior of material under conventional tests under tensile and bending forces [
28]. The opposite is true for Al + Al
4Ca + Al
3Ti domains and other solid materials, for which plasticity characteristics are smaller than the critical value,
i.e.,
δА/
δH < 0.9, suggesting their low ductility and tendency to failure by ductile and/or brittle fracture.
Figure 2 shows representative SEM images of the brittle microcracks within and around the microindentations placed on Al
3Ti and Al
4Ca.
Table 2.
Mechanical characteristics of the cell wall constituents and solid materials.
| Material/Foam Code | E
, | Нh
, | HV , | δА/δH | σys , | K1c, |
|---|
| GPa | GPa | GPa | GPa | MPa × m1/2 |
|---|
| α-AlTi/F1, F3 | 97.0 ± 10 | 1.05 ± 0.18 | 0.40 | 0.94/0.96 | – | – |
| α-Al/F2, F4 | 74.0 ± 3 | 0.54 ± 0.0 | 0.25 ± 0.01 | 0.96/0.97 | 0.40 * | – |
| (Al + Al4Ca + Al3Ti)/F2, F3 | 116 ± 17 | 5.51 ± 1.27 | – | 0.72/– | – | – |
| (Al + Al4Ca)/F1 | 79 ± 7 | 1.32 ± 0.15 | – | 0.90/– | – | – |
| Al3Ti/F1, F3 | 220.0 ± 7 | 8.9 ± 0.9 | 5.3 ± 0.3 | 0.72/0.78 | 0.90 | 1.71 ± 0.18 |
| Al4Ca/ F2 | 39.4 ± 1.4 | 2.2 ± 0.1 | 1.7 ± 0.06 | 0.64/0.63 | 0.28 | 0.78 ± 0.09 |
| TiH1.92 /F1, F3 | 40.5 ± 0.2 | 1.82 ± 0.16 | 1.32 ± 0.05 | 0.72/0.78 | 0.21 | 0.71 ± 0.01 |
| CaCO3/F4 | 79.0 ± 1 | 2.2 ± 0.1 | 1.60 ± 0.05 | 0.77/0.79 | 0.79 | 0.52 ± 0.20 |
| CaО/F4 | 181 ** | – | 6.05 ** | –/0.67 | – | – |
| Al2O3/F3, F4 | 403.9 ** | – | 25 | –/0.47 | – | 4.0 ± 0.15 |
| Technical Glass | 61 | – | 5.25 ± 0.03 | –/0.29 | – | 1.17 ± 0.09 |
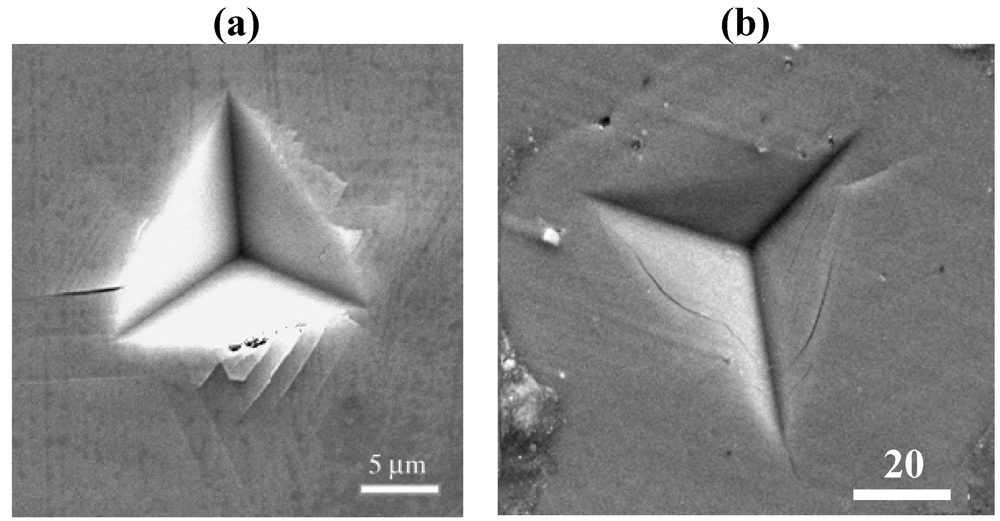
Figure 2.
SEM images of indentations placed on (a) Al4Ca and (b) Al3Ti under indentation loads such as (a) F = 1.0 N and (b) F = 1.5 N by using trihedral indenter with the angle at the tip 55°.
In addition, several systems for dislocation gliding inclined one towards the other are revealed around microindentations placed on the Al3Ti intermetallic compound. Slight slip bands indicative of dislocation activity are also visible around microindentations placed on the Al4Ca intermetallic compound.
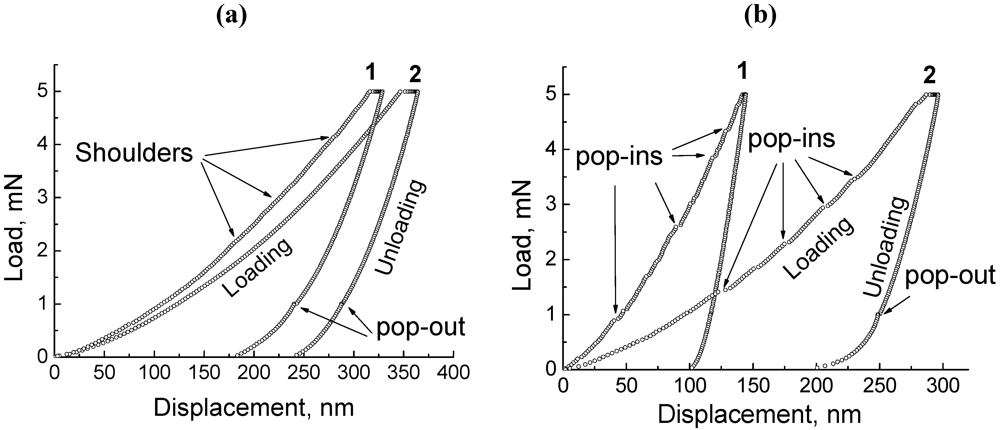
Nanoindentation data give additional information on the damage behavior of low ductile solid materials. Unlike titanium hydride TiH
1.92, for which nanoindentation diagrams are mostly typical of regular elastoplastic materials, a huge number of displacement discontinuities (pop-ins), indicative of localized deformation in share bands, are revealed in the load-displacement curves for Al
3Ti intermetallic compound and marble, CaCO
3, as shown in
Figure 3.
It is commonly considered that strong localized deformation is accompanied by extrusion and intrusion processes, finally resulting in crack nucleation. The result of these processes is clearly visible in
Figure 2a.
Figure 3.
Load displacement curves recorded in nanoindentation experiments for (a) Al4Ca (1) and TiH1.92 (2); as well as for (b) Al3Ti (1) and CaCO3 (2).
Compared to Al
3Ti compound, the loading part of the load-displacement curve for Al
4Ca intermetallic compound given in
Figure 3a is fairly featureless. Nonetheless, shoulders, which are very small to be readily seen, could be recognized in the load-displacement curve for Al
4Ca intermetallic compound. The same as pop-ins, these small shoulders are usually ascribed either to microcracking within indentation or to dislocation activity [
30]. The latter is indicative of Al
4Ca intermetallic compound, as can be seen in
Figure 2b.
Thus, both kinds of intermetallic compounds (Al4Ca, Al3Ti), which are of tremendous importance in foaming processes, show a significant tendency to failure due to mechanical damage. The difference is that the mechanical damage of Al3Ti intermetallic compound is dominated by ductile cleavage, superimposed by brittle fracture, while mechanical damage of Al4Ca intermetallic compound is primarily caused by brittle fracture that is accompanied by confined plastic flow in order to partially accommodate high strains in the surrounding material.
In addition, nanoindentation data for marble, CaCO3, titanium hydride TiH1.92, and Al4Ca intermetallic compound display a small discontinuity (“pop-out”) on pressure release by 80%, which is commonly interpreted as an event of crack nucleation within an indentation of brittle material in response to the accommodation of acting indentation residual stress.
The results obtained in indentation experiments specify that crack nucleation is found to be common for all of solid materials for which plasticity characteristics are smaller than the critical value
δA/
δA << 0.9. In addition, under the condition above, these solid materials usually demonstrate low resistance to crack propagation. Actually, the results listed in
Table 2 show that fracture toughness
KIc of the solid materials is too small and indicative for ceramics, particularly, Al
2O
3. Moreover, the
KIc criterion for solid materials such as Al
4Ca, CaCO
3, and titanium hydride, TiH
1.92 is even less than that for technical glass. This suggests that the presence of low ductile and/or brittle cell constituents can lead to impairing damage resistance of the cell walls, facilitating their premature failure under load.
2.3. Compressive Response of Al-Foams
Figure 4 shows representative results of compression tests for different kinds of Al-foams. All of the foams exhibit deformation patterns typical for those reported for closed-cell foams [
3,
11,
13,
22].
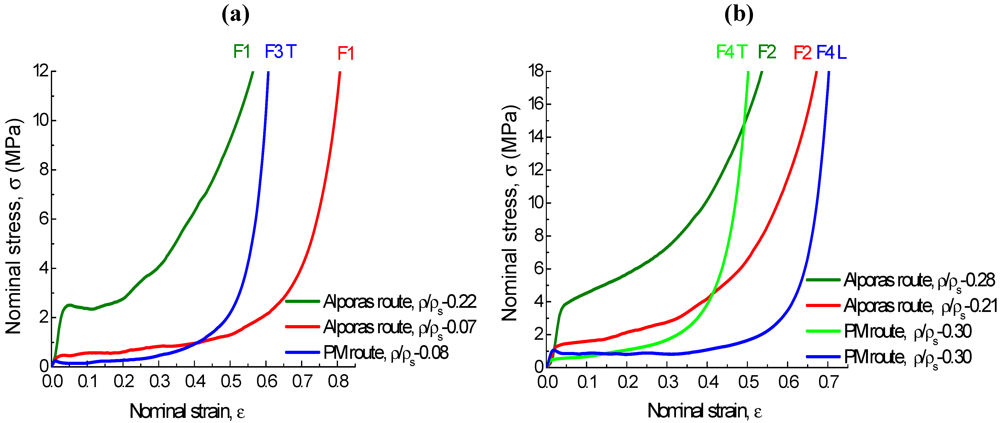
Figure 4.
Compressive stress-strain curves for (a) hydride (F1 and F3) and (b) carbonate (F2 and F4) kinds of Al-foams. Symbols L and T correspond to longitudinal and transverse tests, respectively.
Generally, all kinds of Al-foams display an initial linear elasticity regime before general yielding (yield stress,
σy), followed by a relatively long and well-defined “plateau” regime, which is typically associated with cell collapse, accompanied by densification of the cell wall material. The “plateau” regime continuous up to large strains (densification strain,
εD) beyond which cellular structure commences to condense completely and the stress rises steeply. Typically for closed-cell foams, tensile membrane stress causes nominal stress to rise up gradually within the “plateau” regime. Additional to geometrical hardening by collapse of cells, a microscopic hardening of cell wall material by plastic deformation promotes an increase of “plateau” stress. Moreover, compressive stress decreases as relative density decreases, as depicted in
Figure 4.
As a characteristic feature related to the effect of the cell shape imperfection, anisotropy of compression response is displayed by foam F4 under longitudinal/transverse tests that is typical for Al-foams created from powder compacts [
4], as can be seen in
Figure 4b. A stress-strain pattern characterized by a fast hardening rate within the “plateau” regime is shown under transverse compression of foam F4 in contrast to its response under longitudinal compression at which stress-strain curve demonstrates peak stress corresponding to the onset of global collapse and followed by a load softening region to the long and almost flat “plateau”.
Although all kinds of foams display a macroscopic response rather similar to elastic/plastic behavior, attention is concentrated on the differences in microscopic deformation events, as can be seen in
Figure 4. A carbonate kind of Al-foam F2 with ductile eutectic domains in the cell wall material deforms smoothly throughout the entire strain range that is usually associated with plastic buckling [
22]. In contrast, slight oscillations are superimposed upon an increasing “plateau” stress level in deformation patterns of all the other kinds of Al-foams (F1, F3, and F4), which cell walls contain low ductile and/or brittle constituents. These stress oscillations commonly interpreted as hardening/softening sequences are typically associated with local brittle failure of the cell walls [
22]. Thus, comparative analysis of compressive response for different kinds of Al-foams elucidate the fact that microstructure and mechanical damage of cell wall constituents have a dramatic effect on the microscopic mechanism of local deformation and failure, which in turn is thought to have an influence on the macroscopic mechanical response of Al-foams.
2.4. Comparison of Al-foam Compressive Strength with Theoretical Models
There are several models based on the idealized representation of a defect-free cellular structure. Among them, the most famous scaling laws applied for describing mechanical properties are summarized in [
11]. For open-cell foams made of elastic-plastic materials, dimensional arguments give the plastic collapse stress,
σpl, relative to the yield strength of the solid cell edge material,
σys, as:
where the constant C3 is related to the cell geometry. For a wide range of foams the constant above, C3, is roughly about 3.
For closed-cell foams, yielding of the stretched cell faces contribute to their strength so that the additional term on right hand side appears in the relation for the plastic collapse stress:
Finite element analysis of a tetrakaidecahedral unit with flat faces gives a slightly different relation [
23].
Generally, compressive strength is usually defined in slightly different ways in different studies,
i.e., it is either “plateau” stress, relative to the yield strength, or compressive strength at 20% strain [
11]. Yield stress,
σy, at the general yielding, and plateau stress up, to densification,
σpl, at which cellular structure commences to condense completely and the stress rises steeply [
12], are used in the present study to define collapse stress and therefore estimate the role of cell wall microstructure in terms of its effect on compressive response of Al-foams.
The values of compressive strength,
σy and
σpl, for the kinds of Al-foams (F1, F2, F3, and F4) studied have been normalized by the values of yield strength,
σys, for the solid alloys, the compositions for which correspond approximately to the cell wall materials. Approximate values of yield strength,
σys, for solid materials determined by conventional mechanical tests in tensile are listed in
Table 3.
Table 3.
Composition and yield strength, σys, of solid materials.
| Kind of Al-foam | Composition of solid material | Yield strength,
σys (MPa) |
|---|
| F1 | Al + (Al + Al3Ti + Al4Ca) domains | 42.80 ± 4.89 |
| F2 | Al + (Al + Al4Ca) domains | 43.50 ± 7.1 |
| F3 | Al + (Al + Al3Ti) domain traces | 41.00 ± 5.4 |
| F4 | Al + CaCO3/CaO particles | 43.30 ± 3.35 |
Data for the relative compressive strength,
σy/
σys and
σpl/
σys, for different kinds of Al-foams (F1, F2, F3, and F4) are plotted in
Figure 5 along the lines, which represent Equations (1) and (2) for open- and closed-cell foams, respectively.
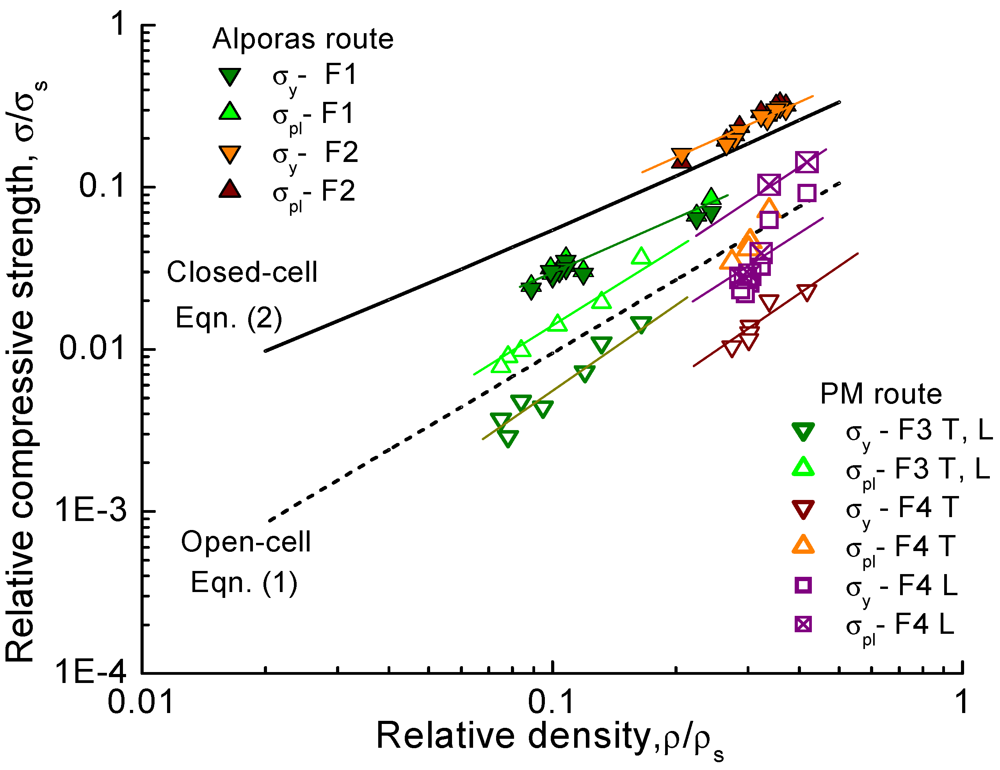
Figure 5.
Relative compressive strength plotted against relative density for different kinds of Al-foams. Symbols L and T correspond respectively to longitudinal and transverse tests.
Data for the carbonate kind of Al-foam F2 performed by the Alporas route lie close to Equation (2), as prescribed by the theory for closed-cell foams. However, behavior of the hydride kind of Al-foam F1 produced by the same manner is rather different. Data for Al-foam F1 lie below Equation 2 and shift to Equation 3, suggesting the decreased contribution of plastic bending to the failure.
Considerable deflection of the experimental results from theoretical predictions is revealed for Al-foams produced via the PM route. Data for the hydride kind of Al-foam F3 lie well below Equation (2) and much close to Equation (1). In addition, data for plateau stress lie just above the line representing strength for open-cell foam whereas those for the yield stress lie below Equation (1). The discrepancy between Equation (2) and the data for Al-foam F4 composed of elongated cells is the mostly pronounced and dependent on loading conditions,
i.e., transverse or longitudinal compression. Data for yield stress under transverse compression are found well below Equation (1), as can be seen in
Figure 5. The presence of highly elliptical cells induces bending in the neighboring cell walls, initiating premature collapse of the deformation band [
11,
31]. However, the data for plateau stress shift essentially above the data for yield stress and lie along the line representing open-cell foam. This is because the hardening rate within the “plateau” regime under transverse compression of Al-foam F4 with highly elliptical cells is much faster compared to that under longitudinal compression, resulting in a pronounced difference between the values of compressive strength, σ
y and σ
pl, as evidenced from
Figure 4b. Again, data for yield and plateau stresses recorded under longitudinal tests are found below Equation (1). It is noticeable that the data for compressive strength derived under the longitudinal test shift upwards when relative density increases up to
ρ > 0.35, which in turn is associated with a greater thickness of the cell walls.
Generally, one or another scaling low could be adjusted to approximate compressive strength of the each kind of Al foams (F1, F2, F3, and F4). The results of approximations are listed in
Table 4.
Table 4.
Scaling lows for approximation of the compressive strength for Al-foams.
| Foam Code | Approximation | ![Metals 02 00095 i004]() | ![Metals 02 00095 i005]() |
|---|
| F1 (σy/σys andσpl/σys) | Equation (2)/Equation (3) | 0.35
/0.33 | 0.15
/0.25 |
| F2 (σy/σys andσpl/σys) | Equation (2)/Equation (3) | 0.25/0.33 | 0.65
/0.65 |
| F3 (σy /σys) | Equation (3) | 0.33 | 0.02 |
| F3 (σpl/σys) | Equation (3) | 0.33 | 0.1 |
| F4 (σy /σys) (1) | Equation (2) | 0.15 | 0 |
| F4 (σpl/σys) (1) | Equation (2) | 0.30 | 0 |
| F4 (σy /σys and σpl/σys) (2) | Equation (2) | 0.15 | 0 |
| F4 (σy/σys) (3) | Equation (2) | 0.30 | 0.10 |
| F4 (σpl/σys) (3) | Equation (2) | 0.33 | 0.10 |
The compressive strength of two kinds of Al-foams (F1, F2), performed by the Alporas route, complies with relations prescribed by Equations (2) and (3) for closed-cell structures. It is noticeable that the value of the numerical coefficient
![Metals 02 00095 i005]()
for the hydride kind of Al-foam F1 is reduced to 23% (Equation (2)) or 38% (Equation (3)) of the value
![Metals 02 00095 i005]()
for the carbonate kind of Al-foam F2, which in turn is associated with a contribution of fracture mode in the collapse of deformation bands. The latter suggestion is thought to be true for other kinds of Al‑foams (F3, F4) fabricated via the PM route. For these kinds of Al-foams, strength degradation caused by reducing the numerical coefficient
![Metals 02 00095 i005]()
down to absolute disappearance is found, as can be seen in
Table 4.
Thus, a different micromechanism for the collapse of deformation bands could be assumed by considering the characteristic features of microstructure and, especially, mechanical damage of the cell wall constituents contained by the cell walls of different kinds of Al-foams (F1, F2, F3, and F4), which have been given in the previous subsection 2.2.
2.5. Correlation of Al-foam Compressive Response and Damage Behavior of Cell Wall Constituents
Plastic collapse of deformation bands indicative of carbonate kind of Al-foam F2 is reasonably expected because Al + Al
4Ca eutectic domains contained by the cell walls give the value of plasticity characteristic,
δA = 0.90, quite sufficient for material plastic behavior, the same as for the ductile Al-matrix, for which δ
A = 0.96, as can be seen in
Table 2. The contribution of fracture mode in the collapse of deformation bands is indicative of a hydride kind of Al-foam F2, in which cell walls contain brittle Al + Al
4Ca + Al
3Ti eutectic domains for which parameter
δA is about 0.72 (see
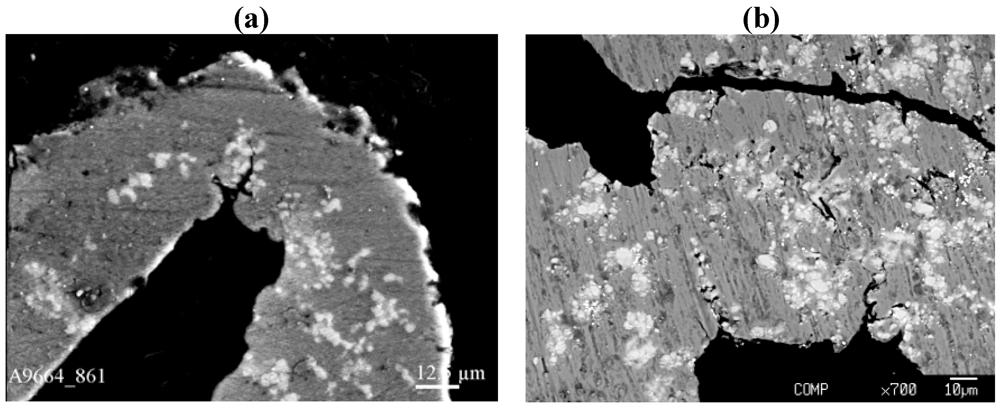
Table 2). Small deflections in the cell walls lead to formation of cracks which propagate through the Al + Al
4Ca + Al
3Ti eutectic domains, finally cause the crushing of the cells under compression, as shown in
Figure 6a. Slight oscillations superimposed upon “plateau” stress reflect local fracture of the deformation bands, as shown in
Figure 4.
In Al-foams (F3 and F4) fabricated via the PM route, brittle cell wall constituents such as either Ti-rich particles rounded by a Al
3Ti layer and smaller Al
3Ti particles, or CaCO
3/CaO particles, act as likely sites for the initiation of cracks, the propagation of which generates stress concentration in adjacent areas, intervening the Al-matrix. the final failure of the cell walls apparently occurs by crushing the brittle cell constituents and their bridging across intact ligaments, as can be seen in
Figure 6b. Again, local fracture of the deformation bands causes oscillations of “plateau” stress, as shown in
Figure 4.
Figure 6.
SEM images of cracks in the cell walls of Al-foams (a) F1 and (b) F3.
It could be assumed that the presence of brittle constituents in the cell wall of closed-cell Al-foams (F3 and F4) induces the collapse of deformation bands by crushing, thus reducing their strength properties to values close or even below those of open-cell foams of the same relative density, as shown in
Figure 5. The dramatic degradation of the mechanical behavior of Al-foams fabricated via the PM route results from the increased fraction volume of brittle particles in the cell wall material, e.g., for the hydride kind of Al-foam F3 yield strength,
σy, is 20% and plateau stress,
σpl, is 43% of those for the hydride kind of Al-foam F1 of the same relative density. about
ρ/
ρs ≈ 0.9.
Differences in micro-mechanisms of deformation discussed above hold the key to a greater understanding of the role of cell wall constituents in terms of their effect on the macroscopic response of Al-foams. Collapse stress, which Al-foams can undergo up to densification, is proved to be actually very sensitive to small defects induced by crushed brittle constituents in the cell wall microstructure. That is why the experimental data reported in literature for strength properties of closed-cell foams, whose cell walls contain brittle constituents, are found to be systematically lower than those predicted by theoretical models [
11]. Attention should be drawn to the fact that the effect of brittle constituents in the cell wall material on degradation of strength properties is much stronger and comparable with that implemented by decreasing the relative density of intact Al-foam that is free of defects, as can be seen in
Figure 5.
As applied for engineering practice, the carbonate kind of Al-foam F2 fabricated via the Alporas route shows indisputable advantages in virtually all aspects of its application. Besides economical advantages provided by using inexpensive CaCO3 as an alternative foaming agent, the design of structural elements comprising this kind of Al-foam becomes easier because of reliable calculations of strength. In addition, uniform collapse of this Al-foam over the entire range of loading conditions is preferable in practical applications where an effective utilization of impact energy combined with damage tolerance is required.


 [30,38]. Fracture toughness KIc of the solid materials was determined by using radial indentation cracks [38,39].