2. Results and Discussion
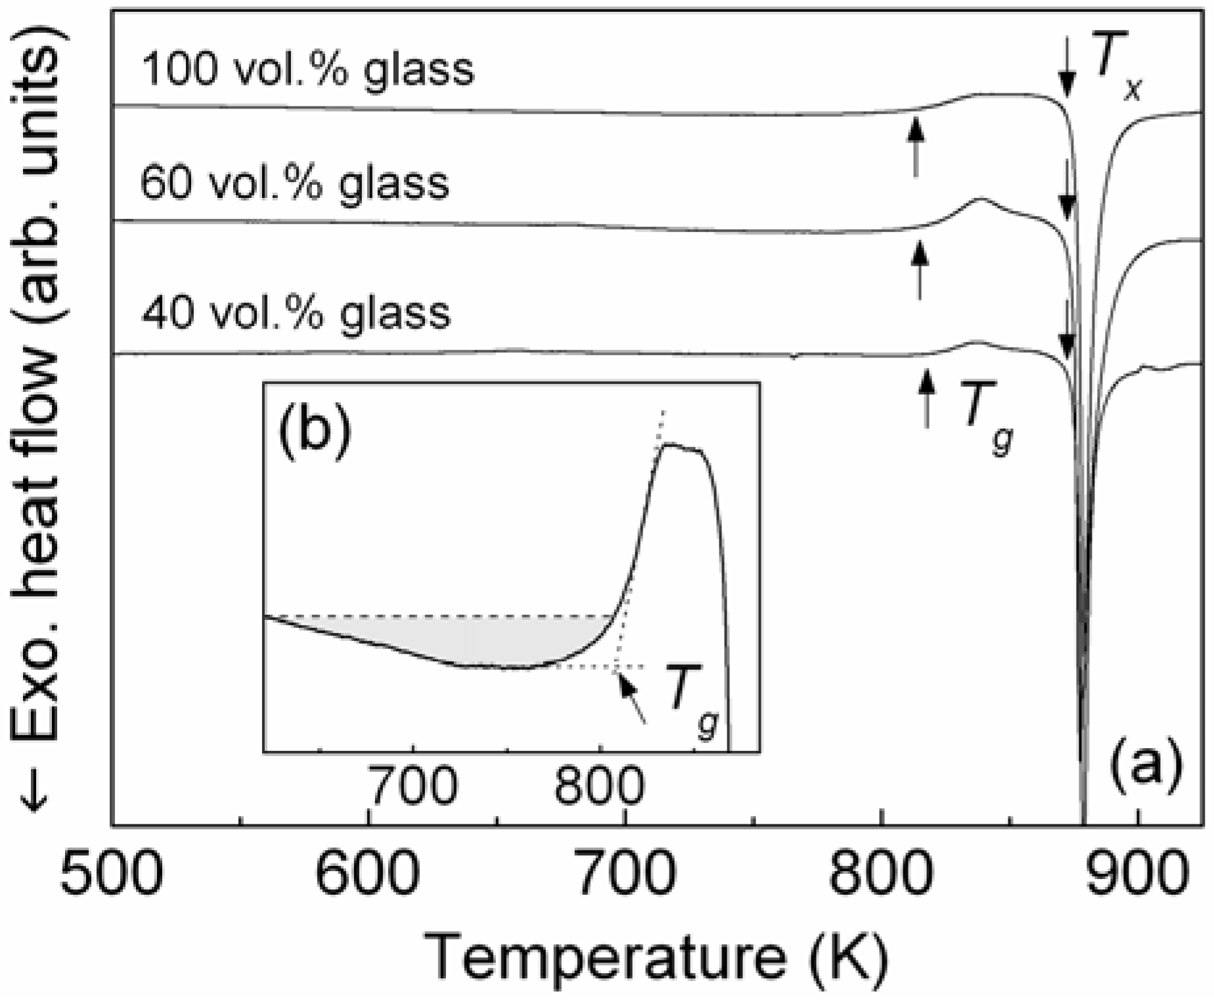
Figure 1(a) shows the isochronal DSC (30 K/min) scan of the Ni
59Zr
20Ti
16Si
2Sn
3 gas-atomized powder (100 vol.% glass). The DSC curve exhibits the typical features characteristic of glassy materials, namely, a distinct glass transition (
Tg), followed by the supercooled liquid (SCL) region before a single exothermic event due to crystallization occurs at higher temperature (
Tx). The glass transition temperature is 810 K, whereas the crystallization temperature
Tx, which gives the upper limit for the sintering temperature, is 875 K. The SCL region,
ΔTx =
Tx −
Tg, is 65 K and the enthalpy of crystallization related to the exothermic DSC peak is
ΔH = 104 J/g.
Figure 1.
(a) DSC scans (heating rate 30 K/min) of the as-atomized Ni59Zr20Ti16Si2Sn3 powder (100 vol.% glass) and brass-matrix composites with 60 and 40 vol.% of glass reinforcement; (b) broad exothermic event below Tg (shadowed area) related to structural relaxation.
Glassy powders can be consolidated into bulk samples by taking advantage of their reduced viscosity at temperatures within the SCL region [
11,
12,
13,
14]. When metallic glasses are heated at temperatures between the glass transition and the crystallization temperatures, they behave as undercooled liquids exhibiting a deformation regime characterized by a viscous flow behavior [
12]. Above the glass transition temperature, the glass transforms into a SCL, which displays a strong decrease of viscosity [
15]. At higher temperatures, when the crystallization starts, the material loses the liquid-like behavior and the viscosity suddenly increases with increasing temperature toward the typical values of a solid phase [
15]. A similar behavior can also be observed in the Ni
59Zr
20Ti
16Si
2Sn
3 glassy powder (
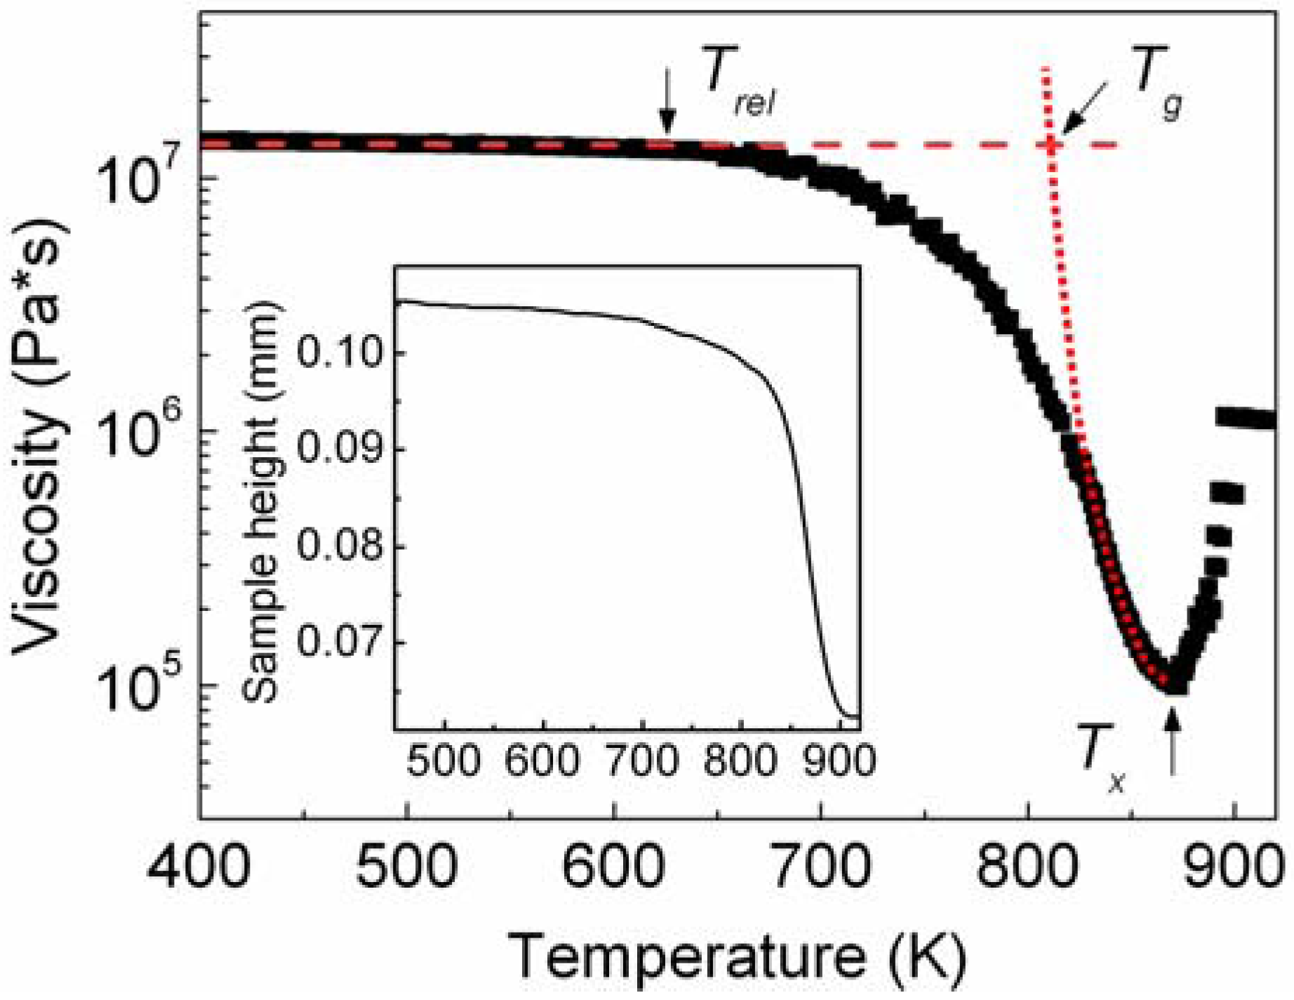
Figure 2). The glassy powder displays a rather constant value of viscosity (2 × 10
7 Pa·s) up to about 625 K (
Trel). At temperatures exceeding 625 K, the viscosity deviates from linearity and it decreases with increasing temperature up to about 875 K (
Tx), where the viscosity abruptly increases due to the crystallization. In the temperature range between 625 and 875 K, the powder shows two distinct softening behaviors. The first occurs in the range 625–820 K, where the viscosity decreases relatively slowly through a concave downwards behavior. Most likely, this is only apparent softening due to the structural relaxation of the amorphous structure and to the resulting annihilation of excess free volume, which occurs at temperatures below
Tg [
16]. The viscosity curve shown in
Figure 2 was derived from the change of the height of the sample (see inset in
Figure 2) through the Stefan’s equation [
15,
17] and, therefore, any reduction of volume/height of the sample might result in an apparent decrease of viscosity. Structural relaxation can generally be observed in an isochronal DSC scan as a broad exothermic event occurring at temperatures below
Tg [
16]. Indeed, the DSC scan of the Ni
59Zr
20Ti
16Si
2Sn
3 glassy powder is characterized by a broad exothermic signal at temperatures in the range 600–800 K (see shadowed area in
Figure 1(b)), corroborating that the decrease of viscosity occurring at temperatures between 625 and 820 K is an apparent softening effect due to structural relaxation. The second softening effect visible in
Figure 2 occurs in the range 820–875 K. Here, the viscosity decreases with a steeper slope compared to the apparent softening between 625 and 820 K and with a concave upwards behavior. By extrapolating the concave upwards curve (dotted curve in
Figure 2) to the viscosity value of the solid glass (2 × 10
7 Pa·s; dashed line in
Figure 2), a glass transition temperature of about 810 K is obtained. This value is remarkably similar to that obtained by DSC measurements (
Figure 1(a)).
Figure 2.
Temperature dependence (heating rate 30 K/min) of the viscosity of the supercooled liquid for the as-atomized Ni59Zr20Ti16Si2Sn3 powder and (inset) characteristic TMA measurement consisting of the change of the height of the sample as a function of temperature.
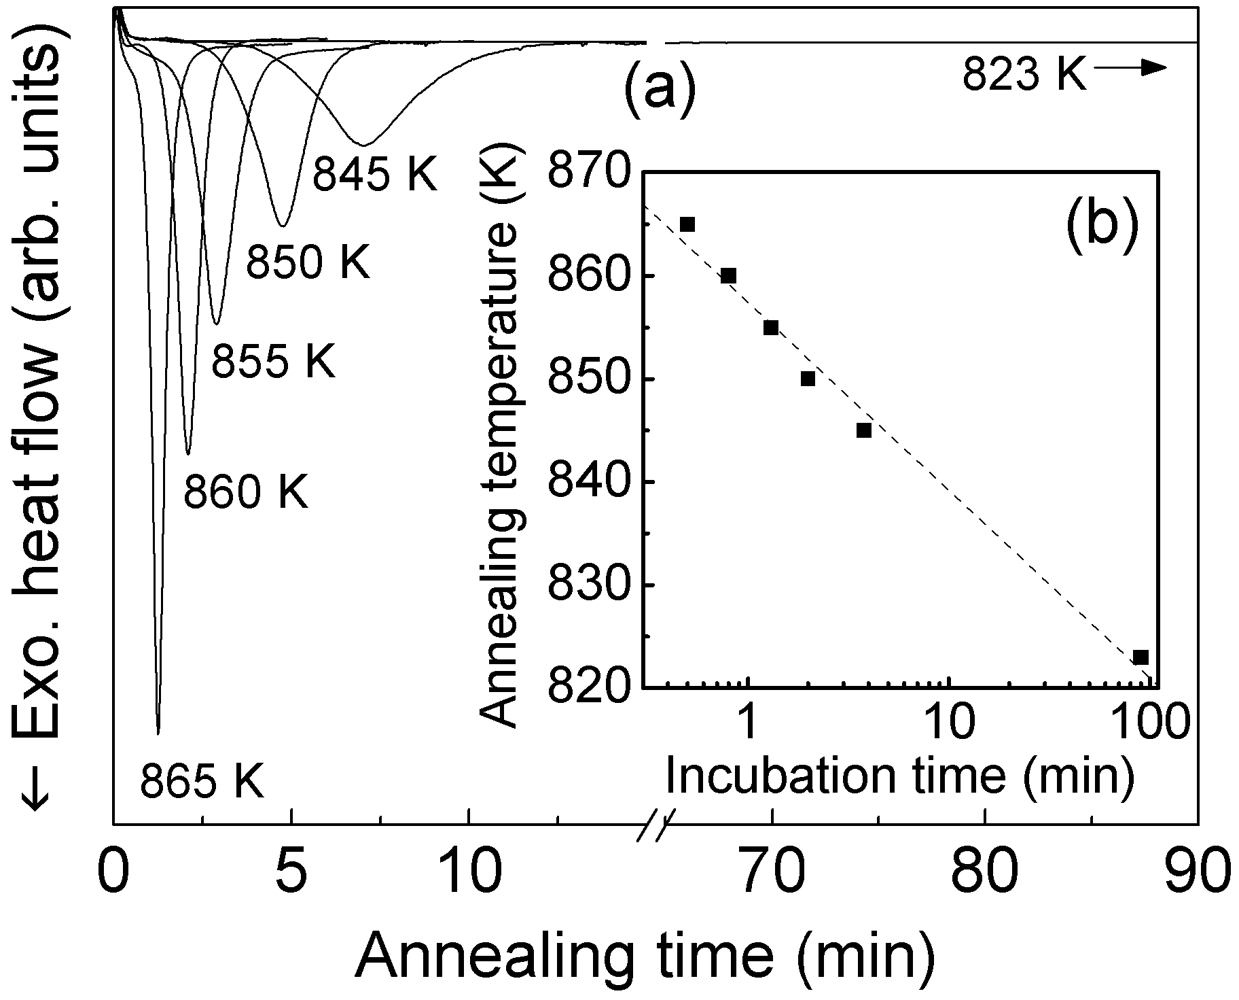
In order to find the proper temperature-time window for consolidation of the glass avoiding crystallization, the crystallization behavior was also investigated in isothermal mode at different annealing temperatures within the SCL region. The isothermal DSC scans (
Figure 3(a)) are symmetric bell-shaped curves with an incubation time (
i.e., the time needed to start the crystallization process) that increases with decreasing the annealing temperature (
Figure 3(b)). For annealing at 865 K crystallization sets in within one minute. The incubation time increases to about four minutes for annealing at 845 K. The extrusion step necessitates a period of about one hour; therefore, such a short incubation time is insufficient for performing the extrusion avoiding crystallization. However, the incubation time can be drastically extended for annealing at 823 K, where crystallization is not observed for holding times exceeding 90 minutes.
The DSC and viscosity investigations were used to find the best compromise between temperature, viscosity and holding time for the consolidation of the composites reinforced with Ni
59Zr
20Ti
16Si
2Sn
3 glassy particles. These glass-reinforced composites were synthesized by hot pressing followed by hot extrusion of brass powder manually blended with different amounts (40 and 60 vol.%) of Ni
59Zr
20Ti
16Si
2Sn
3 gas-atomized powder. Hot pressing (sintering temperature 673 K; sintering pressure 500 MPa; holding time 3 min) was used as a pre-compaction step for the following hot extrusion. Extrusion was carried out at 823 K, in order to take advantage of the material softening within the supercooled liquid regime, using a pressure of about 500 MPa. At this temperature, the viscosity of the glass is reduced to 8 × 10
5 Pa s and the incubation time is longer than 90 min, which permits to carry out the extrusion of the previously hot-pressed pre-compacts avoiding the crystallization of the glass (see
Figure 3). For comparison purposes, a bulk specimen was produced by extrusion of pure brass powder using the same consolidation parameters as used for the glass-reinforced composites.
Figure 3.
(a) Isothermal DSC scans taken at different annealing temperatures for the as-atomized Ni59Zr20Ti16Si2Sn3 powder; (b) corresponding incubation times.
The DSC scans of the extruded composites produced by blending brass with 40 and 60 vol.% of glass powder are shown in
Figure 1(a). Due to the optimized consolidation parameters, the extruded specimens display a very similar crystallization behavior compared to the parent gas-atomized powder.
Tg and
Tx are 813 and 874 K for the composite with 40 vol.% glass and 812 and 873 K for the sample with 60 vol.% glass (
Tg = 810 K and
Tx = 875 K for the parent as-atomized powder). The enthalpies of crystallization are
ΔH = 43 J/g for the sample with 40 vol.% glass and
ΔH = 59 J/g for the composite containing 60 vol.% glass, therefore smaller with respect to the as-atomized powder (
ΔH = 104 J/g). However, after normalization of the crystallization enthalpies to the wt.% of brass, which does not contribute to the crystallization enthalpy, the values of enthalpy for the composites are very similar to that observed for the as-atomized Ni
59Zr
20Ti
16Si
2Sn
3 glassy powder. This clearly indicates that the extrusion process does not induce any significant crystallization of the glassy phase.
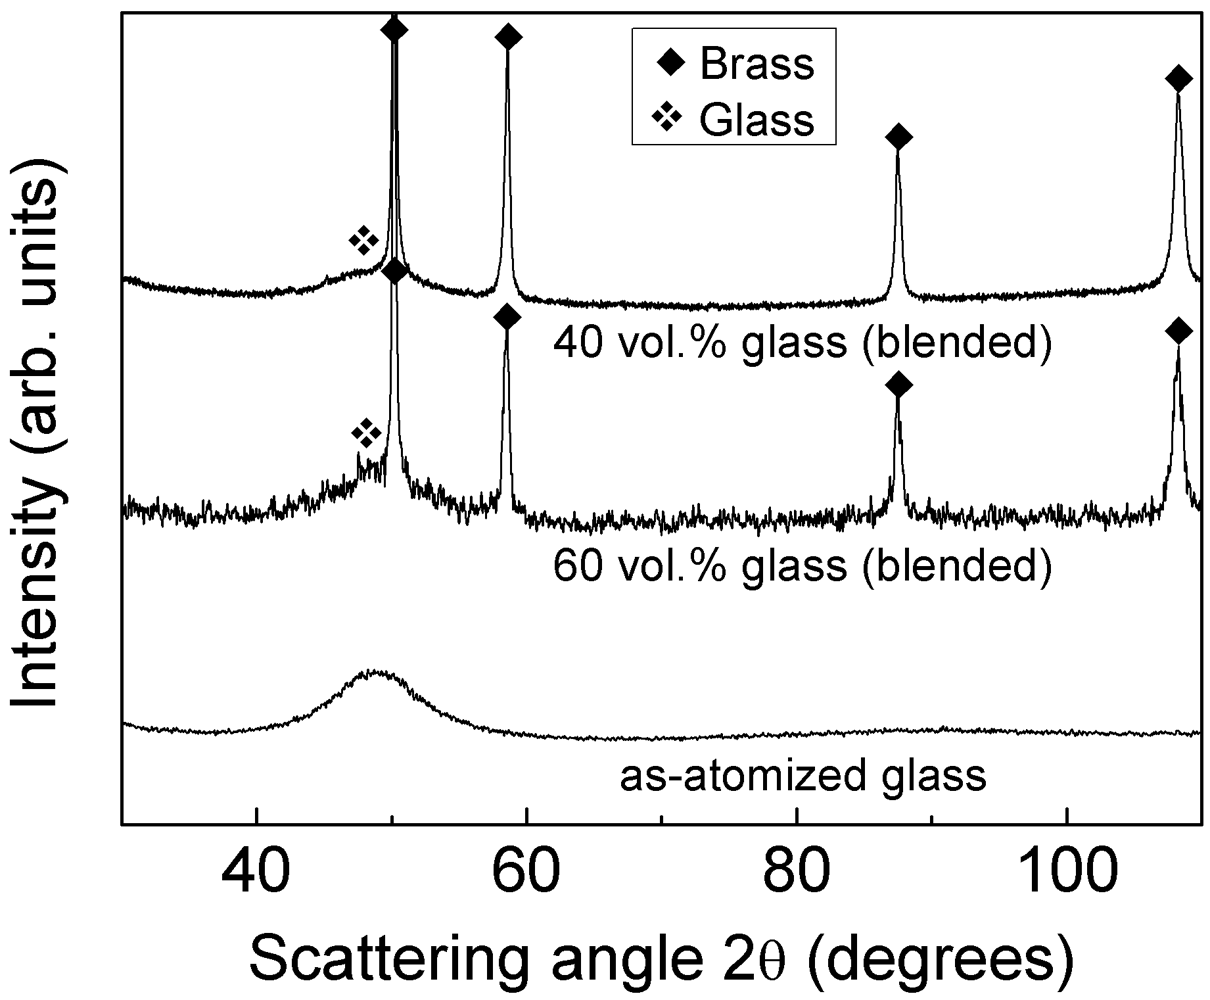
The absence of glass crystallization during compaction is corroborated by the XRD patterns in
Figure 4. The patterns display few narrow diffraction peaks due to brass together with the broad maximum belonging to the glassy phase at about
2θ = 49° (see pattern of the as-atomized glass for reference). No diffraction peaks belonging to additional phases are detected within the sensitivity limits of XRD.
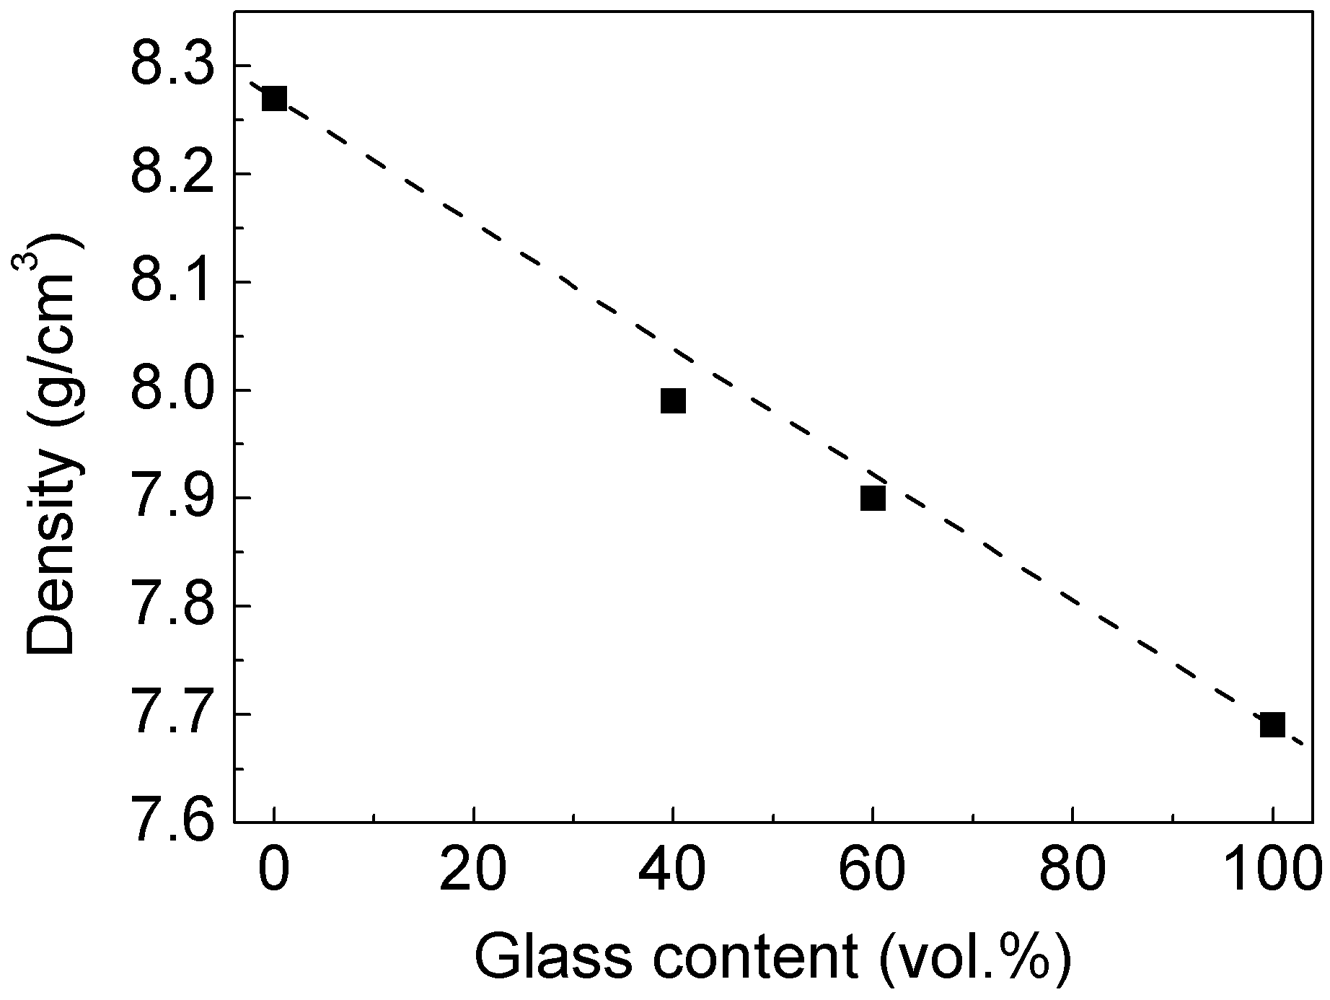
Extrusion at 823 K not only permits the consolidation of the composites avoiding crystallization of the glass reinforcement, but it also leads to bulk samples with relative density exceeding 99%. As expected for highly dense specimens, the density of the composites closely follows the rule of mixture (dashed line in
Figure 5) and decreases linearly with increasing vol.% of glass.
Figure 4.
XRD patterns (Co-Kα radiation) for the as-atomized Ni59Zr20Ti16Si2Sn3 powder and for the consolidated blended composites with 40 and 60 vol.% of glass reinforcement.
Figure 5.
Densities of the consolidated blended composites as a function of the volume fraction of glass reinforcement.
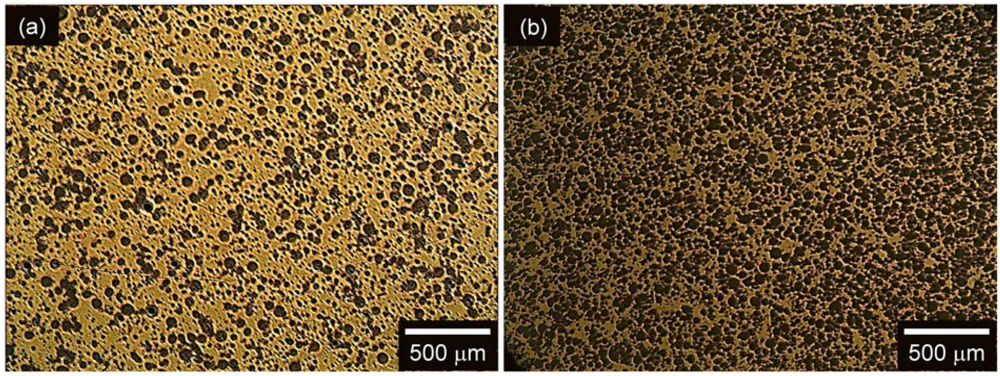
Figure 6(a,b) show the OM micrographs of the composites produced by blending brass with 40 and 60 vol.% of glass reinforcement. The micrographs display a homogeneous distribution of dark particles (the Ni
59Zr
20Ti
16Si
2Sn
3 glass) dispersed in a continuous bright matrix (
i.e., brass). No porosity is visible, further corroborating the high density of the extruded specimens evaluated by density measurements.
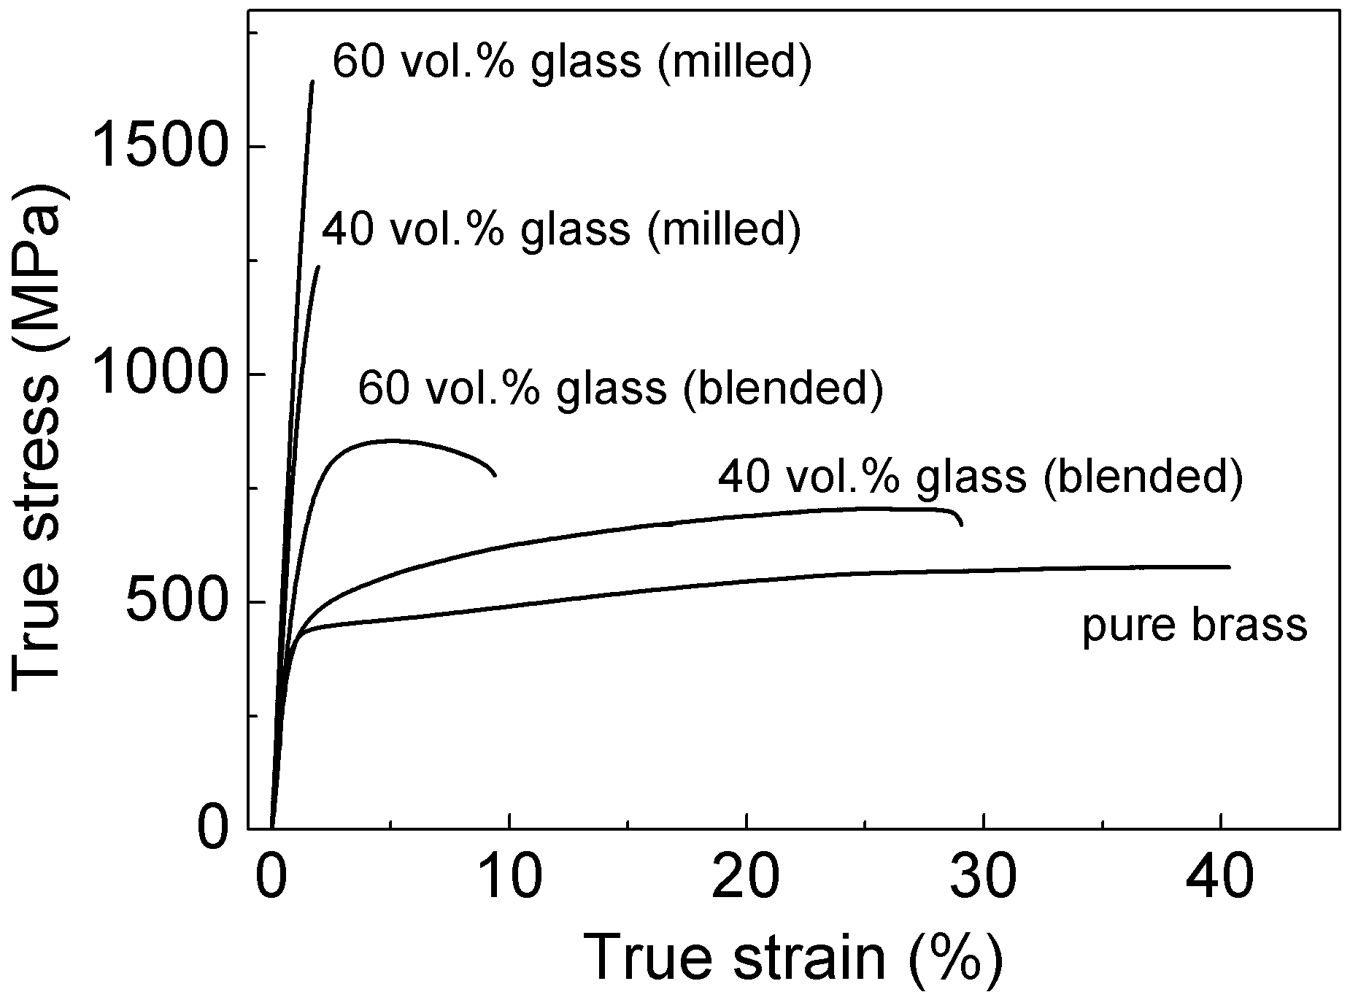
The mechanical properties of the glass-reinforced (blended) composites were investigated by room temperature compression tests and the corresponding stress-strain curves are presented in
Figure 7 along with the curve for pure brass extruded using the same consolidation parameters as used for the glass-reinforced composites. The addition of the glass reinforcement remarkably improves the strength of the material. The compressive strength (the maximum compressive stress which the material is capable of sustaining [
18]) increases from about 500 MPa for pure brass to 740 and 925 MPa for the (blended) composites reinforced with 40 and 60 vol.% of glassy particles, respectively. In contrast, the plastic deformation of the extruded materials decreases from about 40 % for pure brass to 28 and 9 % for the composites containing 40 and 60 vol.% glassy particles.
Figure 6.
OM micrographs for the consolidated blended composites with (a) 40 vol.% and (b) 60 vol.% glass reinforcement.
Beside through the variation of the volume fraction of reinforcement, the strength of a composite can be enhanced through the optimization of microstructural features such as size and morphology of matrix and reinforcement particles or interparticle distance [
19,
20,
21]. For composites consisting of a soft matrix reinforced with hard particles, the distance between the particles, also referred to as the matrix ligament size
λ, is a key parameter. This is particularly important for composites containing large volume fractions of reinforcement, where the matrix is constrained by the hard particles into regions (
i.e., the matrix ligament size) having size that decreases with increasing volume fraction of reinforcement [
21]. In analogy with the strengthening effect resulting from grain refinement, the reduction of
λ can give a considerable contribution to the strength of the composites because the matrix/particle interface can effectively reduce the movement of dislocations [
21,
22].
Figure 7.
Room temperature compression stress-strain curves for the consolidated pure brass and blended and milled composites with 40 and 60 vol.% of Ni59Zr20Ti16Si2Sn3 glass reinforcement.
In this work, the matrix ligament size of the glass-reinforced composites was reduced by ball milling of two different mixtures of powders consisting of brass with 40 and 60 vol.% of Ni
59Zr
20Ti
16Si
2Sn
3 glass. During milling the particles are cold-welded and plastically deformed, leading to a characteristic layered structure consisting of various combinations of the starting constituents with the thickness of the individual layers that decreases with increasing the milling time [
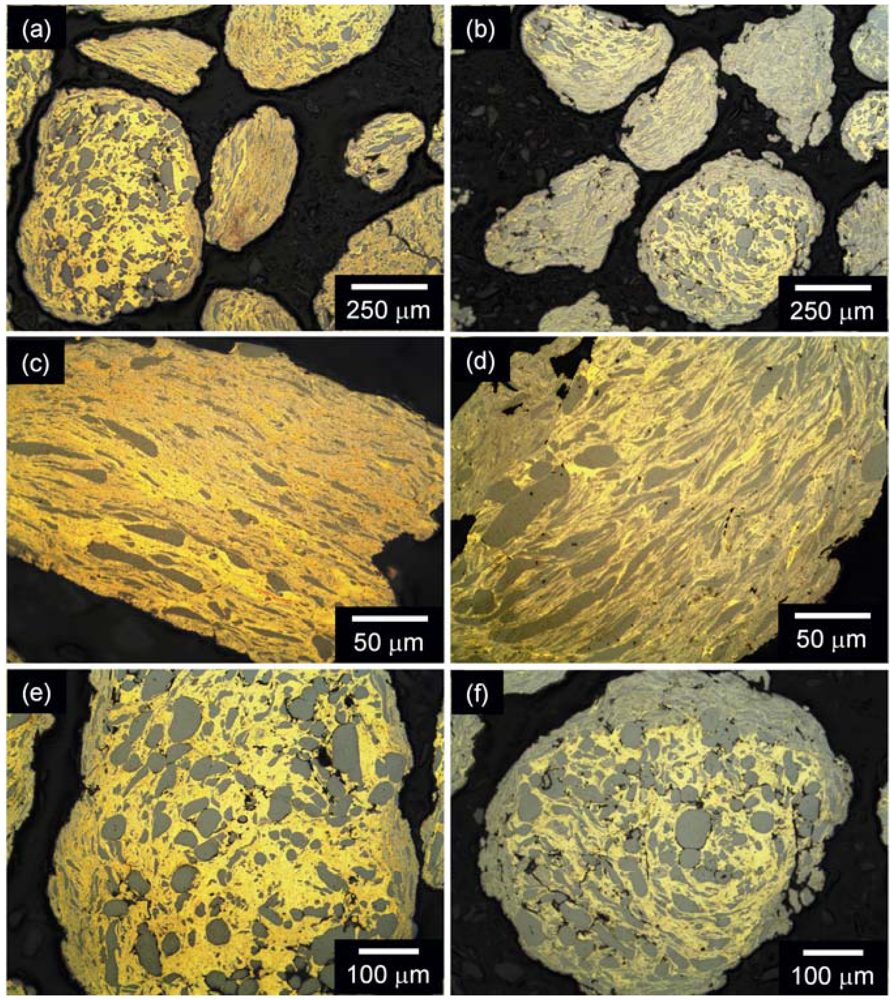
23]. This behavior can be observed in
Figure 8, which shows the OM micrographs of the glass-brass composite powders with 40 and 60 vol.% glass milled for 20 h. The milled powders are characterized by a rather heterogeneous microstructure (
Figure 8(a,b)). Small particles (<200–300 μm) display a microstructure consisting of layers of brass (bright areas) alternating with glass layers (dark areas) (
Figure 8(c,d)). Larger particles display the glass-brass alternating layered structure only on the surface of the composite particles, whereas the core consists of relatively less deformed glass particles embedded into a continuous brass matrix (
Figure 8(e,f)).
Figure 8.
OM micrographs of the glass-brass composite powders milled for 20 h: (a,c,e) composite with 40 vol.% glass and (b,d,f) composite with 60 vol.% glass reinforcement.
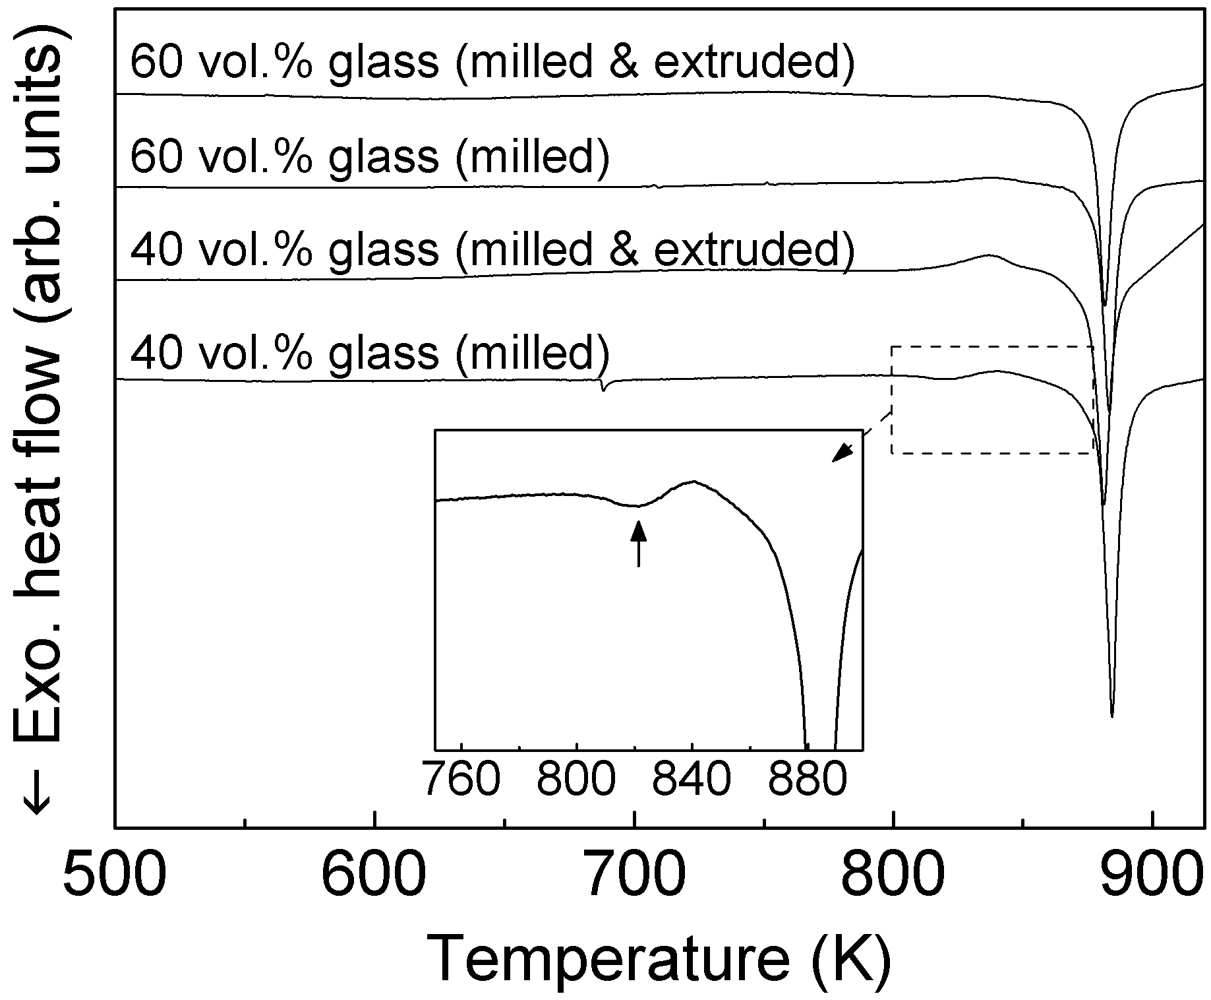
The effect of milling on the thermal stability of the glass-brass composite (milled) powders with 40 and 60 vol.% glass is shown in
Figure 9. The crystallization temperature is not influenced by the mechanical treatment. The values of
Tx for the powders with 40 and 60 vol.% glass are 878 and 877 K, respectively, therefore, only slightly increase compared to the as-atomized glassy powder (875 K). On the other hand, the crystallization enthalpy of the powder with 40 vol.% glass decreases from about 40 J/g for the blended powder to 20 J/g for the material milled for 20 h. A similar decrease can be observed in the powder with 60 vol.% glass, where the enthalpy drastically decreases from about 60 J/g for the blended powder to 31 J/g for the powder milled for 20 h. This would suggest that about 50% of glassy phase crystallizes during milling.
Figure 9.
DSC scans (30 K/min) of the glass-brass composite powders milled for 20 h (milled) and of the corresponding bulk composites consolidated by hot extrusion (milled and extruded).
Besides the decrease of crystallization enthalpy, the DSC curves of the milled powder reveal the presence of a small exothermic peak at about 820 K (indicated by an arrow in the inset in
Figure 9), which might suggest that a reaction between the glassy phase and brass takes place at this temperature. Reaction between the powder components may occur during the DSC measurement due to the combination of the small diffusion distances (
i.e., the interlayer spacing), the high density of lattice defects in the powder, and the heating provided during measurement [
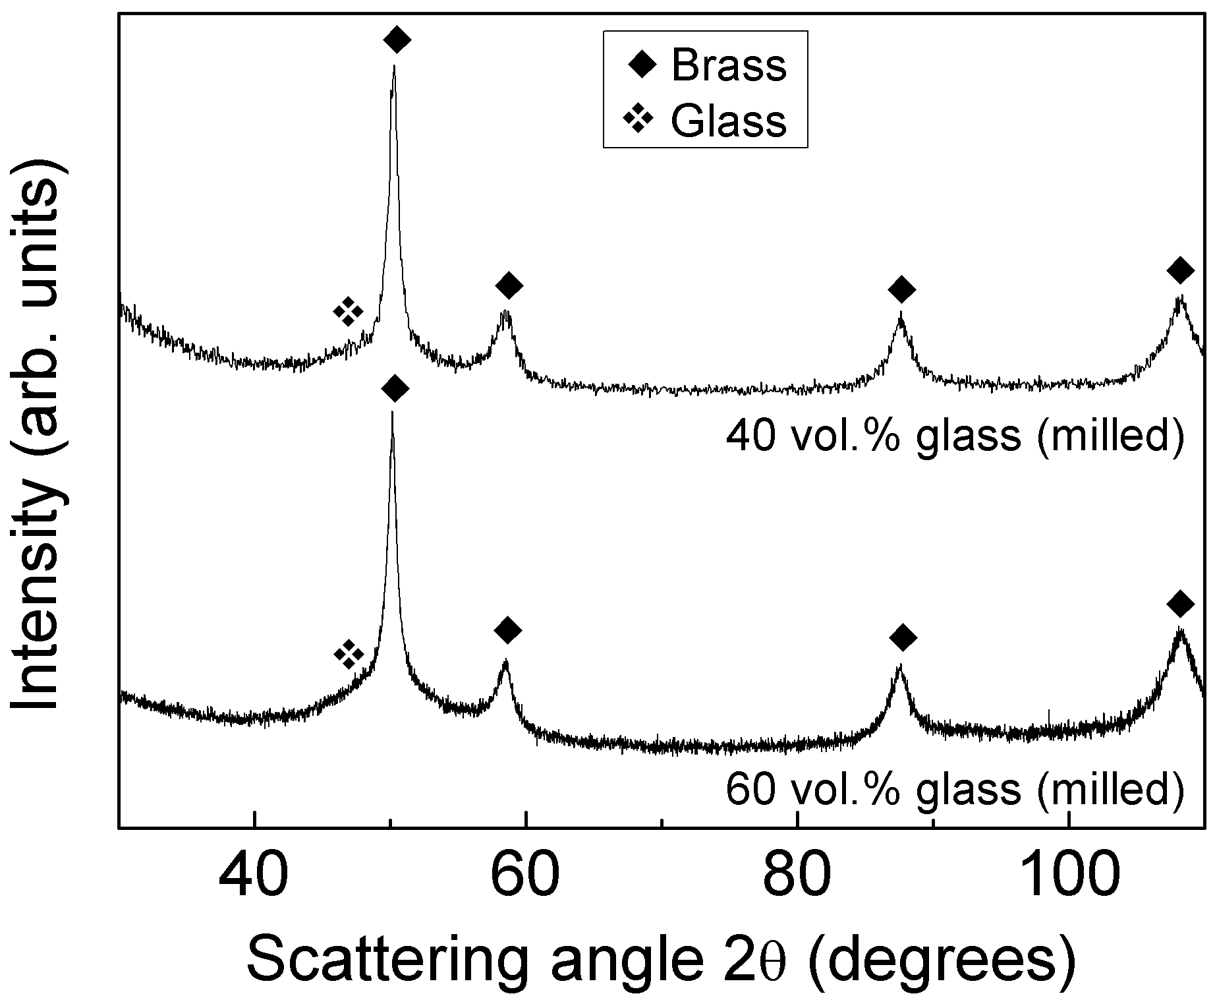
23]. A reaction between the two components would consume some amount of glassy phase, therefore, explaining the reduced crystallization enthalpy observed for the milled material. However, XRD analysis of the milled powder reveals that mechanical deformation does not induce visible crystallization of the glass, as illustrated by the XRD patterns in
Figure 10. The pattern reveals a strong broadening of the diffraction peaks belonging to brass and no further peaks due to additional phases can be detected beside the signals due to brass and the broad maximum due to the glassy structure.
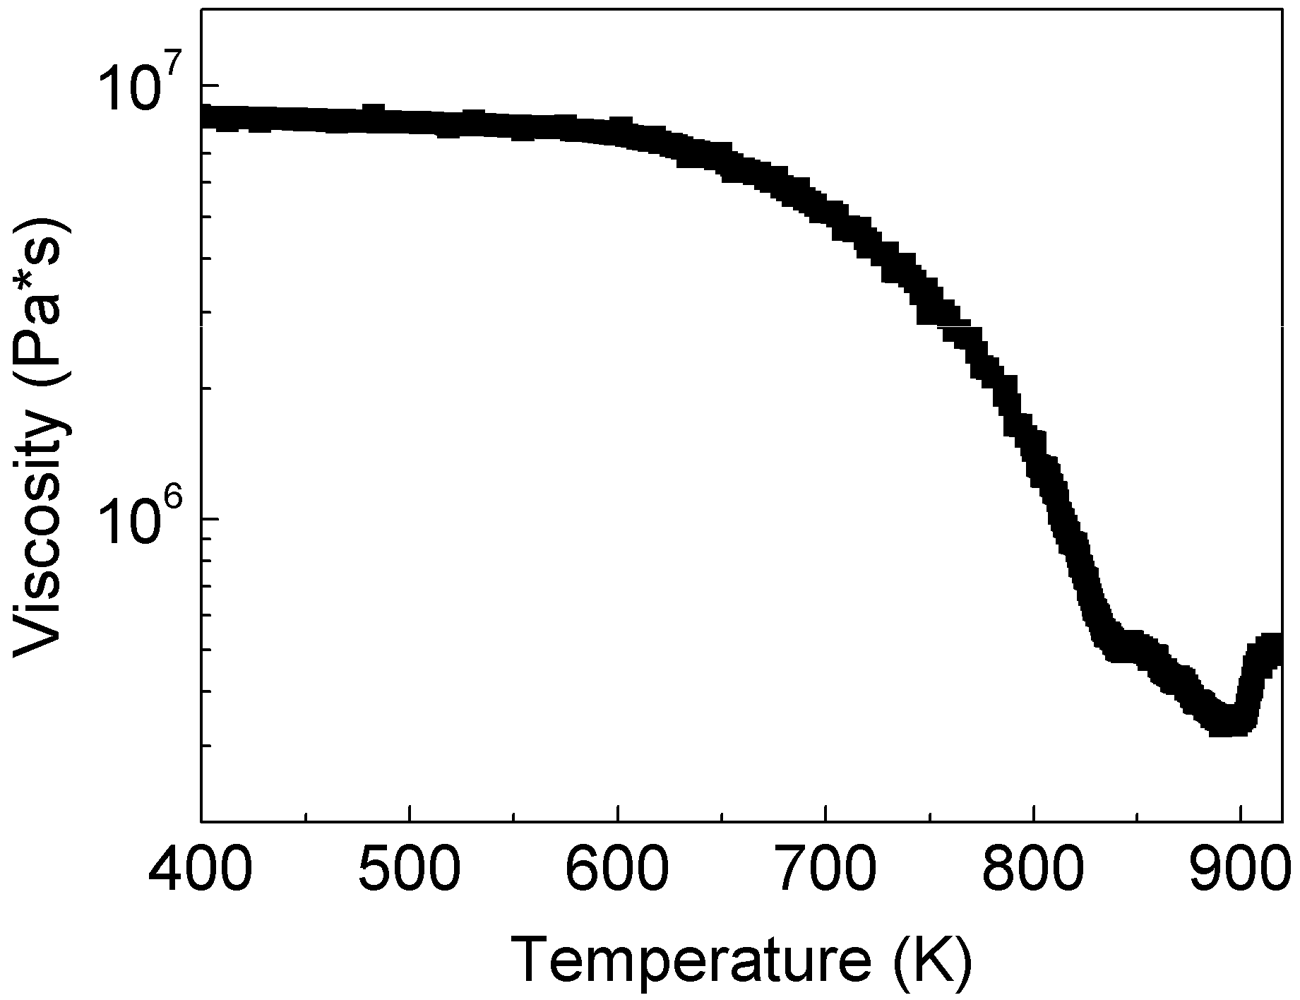
As a typical example of the influence of milling on the viscosity of the milled powders,
Figure 11 shows the viscosity
vs. temperature for the glass-brass composite powders milled for 20 h. Milling remarkably influences the viscosity of the SCL. The single viscosity drop characterizing the viscosity of the as-atomized powder (
Figure 2) splits into two different signals in the milled powder. The viscosity drop at low temperature occurs at about 800 K, which is in the same temperature range of the small exothermic peak observed in the DSC measurements (
Figure 9). The strong decrease of the crystallization enthalpy for the milled powder and the appearance of the exothermic effect at low temperatures along with the occurrence of two distinct viscosity drops suggest that a complex transformation (e.g., reaction between glassy phase and brass along with glass crystallization) rather than simple crystallization occurs in the milled powders. This is most likely assisted by the layered microstructure characterizing the milled powder and, consequently, by the reduction of the diffusion distances between the different phases.
Figure 10.
XRD patterns (Co-Kα radiation) for the glass-brass composite powders milled for 20 h.
Figure 11.
Temperature dependence (heating rate 30 K/min) of the viscosity of the supercooled liquid for the glass-brass composite powder with 60 vol.% glass milled for 20h.
The crystallization behavior of the milled powders was also investigated in isothermal mode. Similarly to the as-atomized glassy powder (
Figure 3), the isothermal DSC scans of the milled powder (not shown here) indicate that the incubation time for annealing at 823 K exceeds 90 minutes. Accordingly, bulk composites were produced by hot pressing and hot extrusion of brass powder milled together with 40 and 60 vol.% of Ni
59Zr
20Ti
16Si
2Sn
3 glass using the same consolidation parameters as used for the blended composites.
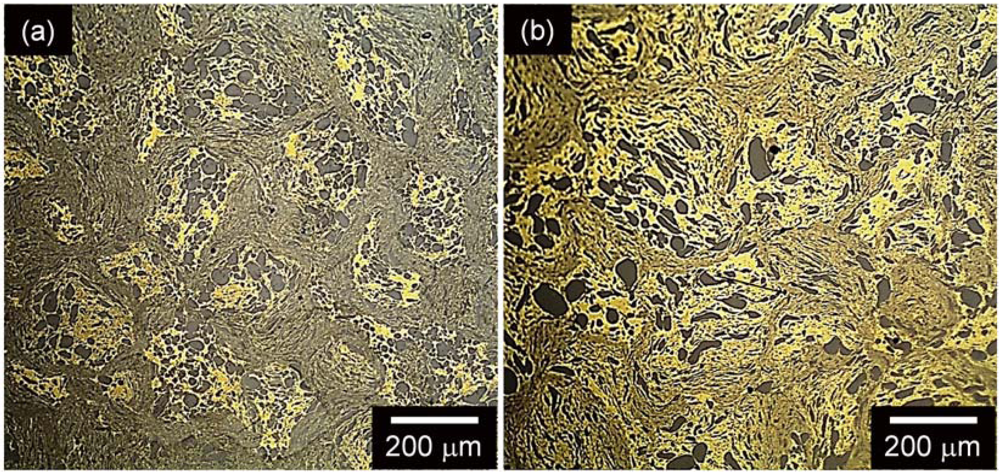
Figure 12 shows the OM micrographs of the consolidated composites produced from the glass-brass milled powders. The microstructure of the sample with 40 (
Figure 12(a)) and 60 (
Figure 12(b)) vol.% of glass reinforcement both displays the same features that resemble those observed for the as-milled powders (
Figure 8): a matrix consisting of alternating layers of glass and brass with interlayer spacing of 2–5 μm and large and isolated agglomerates of relatively less deformed glassy particles embedded into a continuous brass matrix.
Figure 12.
OM micrographs for the consolidated milled composites with (a) 40 vol.% and (b) 60 vol.% glass reinforcement.
The mechanical properties of the glass-reinforced (milled) composites are shown in
Figure 7. The layered microstructure induced a significant improvement of strength with respect to the blended composites. The strengths of the milled composites with 40 and 60 vol.% are 1,240 and 1,640 MPa. Therefore, respectively increased by about 500 and 700 MPa compared to the blended composites with the same composition.
The driving force behind the development of metal matrix composites is the possibility to design their properties to meet specific requirements through the proper combination of the constituents (
i.e., matrix and reinforcement) as well as by the optimization of the microstructure features (e.g., volume fraction, size and morphology of matrix and reinforcement) [
19,
20]. In order to achieve this aim, the prediction of the properties of a composite from the properties of the single constituents is a necessary prerequisite.
The strength of the present glass-reinforced composites was modeled using the rule of mixtures (ROM). The ROM is the simplest and most intuitive method for estimating the mechanical properties of a composite [
9,
20,
24,
25]. It derives the properties of the composite from the volume-weighted averages of the properties of the single constituents and assumes that the composite constituents are non-interacting during deformation [
24].
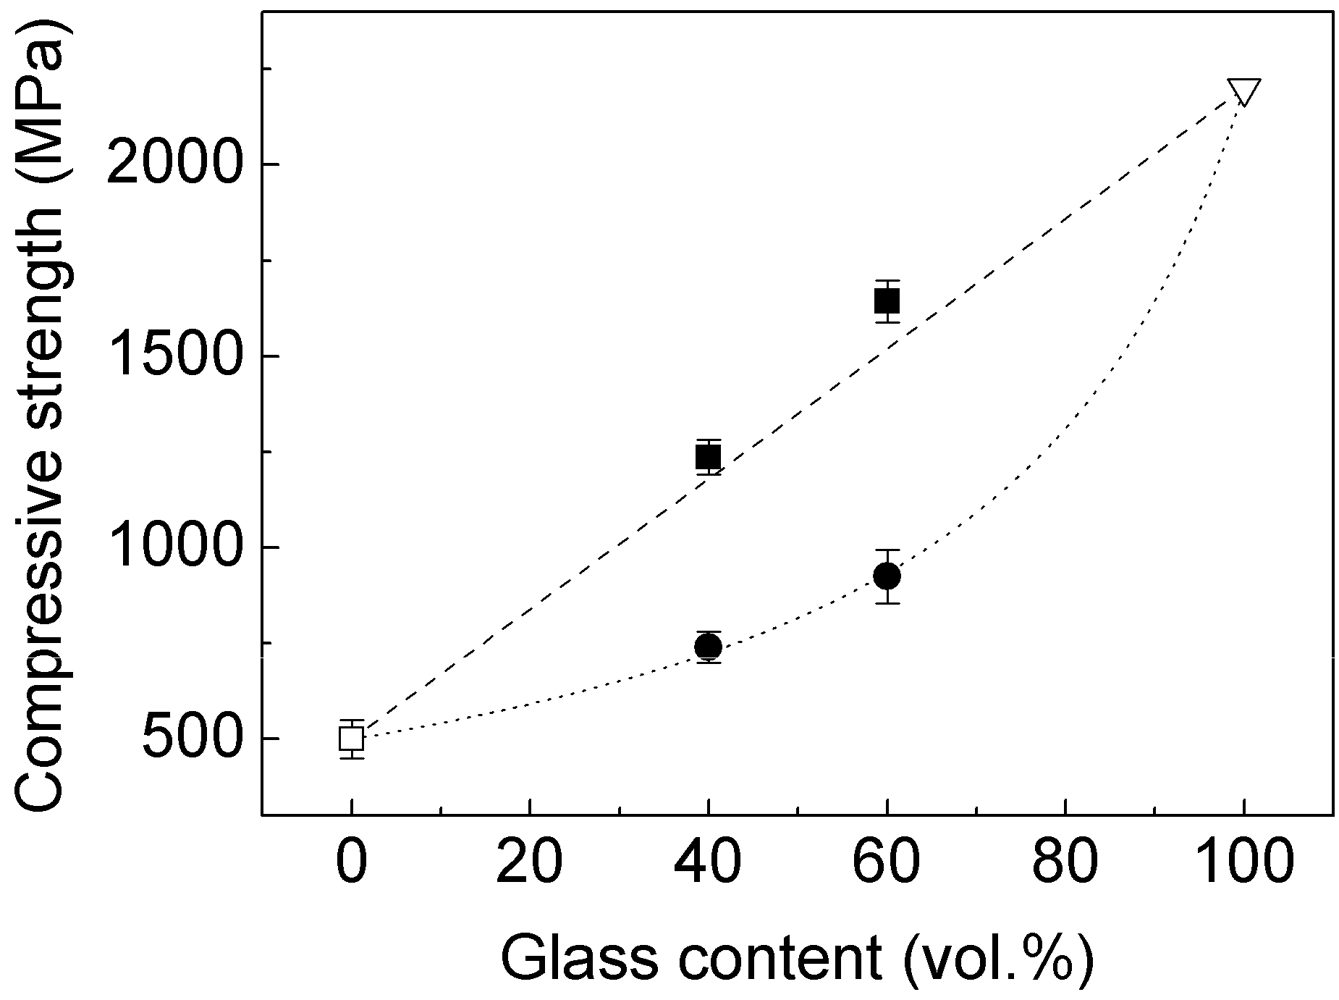
The compressive strength of the blended and milled composites as a function of the volume fraction of the Ni
59Zr
20Ti
16Si
2Sn
3 glass reinforcement is shown in
Figure 13 along with the strength values for pure brass and for the single-phase Ni
59Zr
20Ti
16Si
2Sn
3 metallic glass [
26]. Two ROM methods were used to model the strength of the composites: the
iso-strain and the
iso-stress models. The
iso-strain model assumes that matrix and reinforcement both experience the same strain during deformation [
24]. This represents the upper bound and it is given by [
25]:
where
σ is the strength,
V is the volume fraction and the subscripts
c,
m and
r indicate the composite, the brass matrix and, the glass reinforcement, respectively. On the other hand, the
iso-stress model, which gives the lower bound, is based on the assumption that both matrix and reinforcement exhibit the same stress during deformation [
24]. This can be written as [
25]:
Figure 13.
Compressive strength (evaluated from
Figure 7) as a function of volume fraction
V of glass reinforcement for: (□) pure brass, (●) blended and (■) milled composites, (▽) single-phase Ni
59Zr
20Ti
16Si
2Sn
3 glass and values calculated through the iso-strain (dashed line) and iso-stress (dotted line) models through Equations (1) and (2).
The results shown in
Figure 13 reveal that the compressive strength of the blended composites (full circles) strictly follows the
iso-stress model (dotted line). On the other hand, the strength of the milled composites (full squares) can be properly modeled using the
iso-strain model (dashed line). This indicates that models based exclusively on the volume fraction cannot be used for predicting the mechanical properties of the present glass-brass composites.
A different model, which simultaneously considers the effects of both volume fraction and particle size on the strength of a material (
![Metals 02 00079 i004]()
), has been proposed by Gurland [
27] for WC-Co alloys. This can be rewritten as
to take into account the effect of the matrix ligament size.
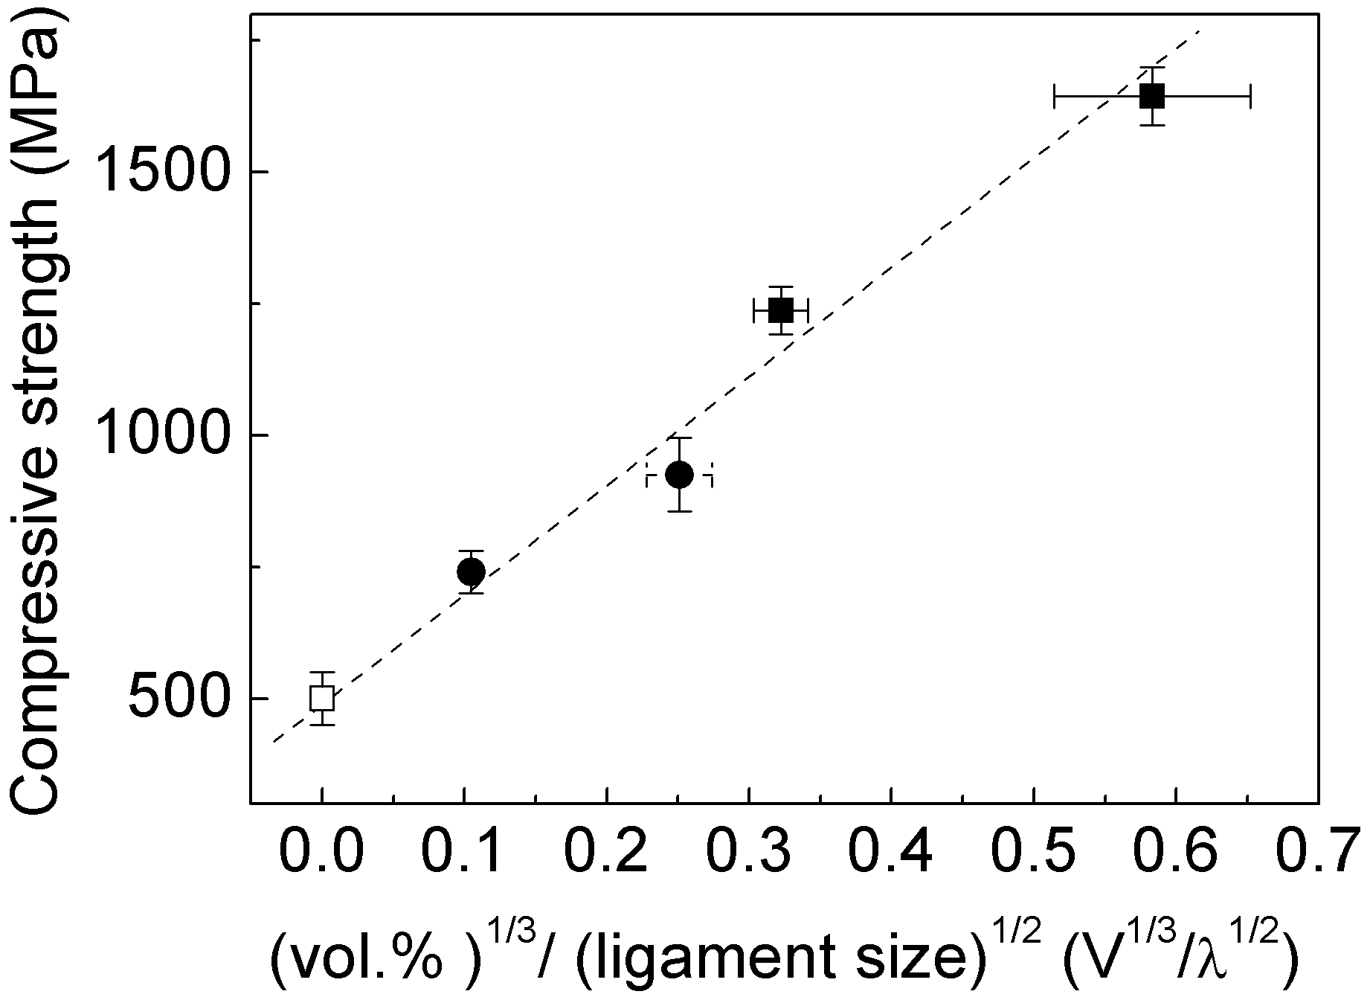
In
Figure 14, the compressive strength of the blended and milled composites are plotted
versus V1/3λ−1/2. The relationship between strength and
V1/3λ−1/2 is approximately linear, which corroborates the validity of Equation (3) and demonstrates that the strength of the present composites can be accurately modeled by taking into account the combined effect of the volume fraction of reinforcement and the matrix ligament size.
Figure 14.
Compressive strength as a function of volume fraction and matrix ligament size (
![Metals 02 00079 i004]()
) for: (□) pure brass, (●) blended and (■) milled composites.


 ), has been proposed by Gurland [27] for WC-Co alloys. This can be rewritten as
