
Acid Treatments of Ti-Based Metallic Glasses for Improving Corrosion Resistance in Implant Applications


1
Leibniz-Institute for Solid State and Materials Research Dresden (Leibniz IFW Dresden), Helmholtzstr. 20, 01069 Dresden, Germany
2
Faculty of Mechanical Science and Engineering, TU Dresden, Helmholtzstr. 10, 01069 Dresden, Germany
3
Educational and Scientific Institute of Chemical Technologies and Engineering, National Technical University “Kharkiv Polytechnic Institute”, Kyrpychova Str. 2, 61002 Kharkiv, Ukraine
*
Author to whom correspondence should be addressed.
Metals 2024, 14(2), 241; https://doi.org/10.3390/met14020241
Submission received: 26 January 2024
/
Revised: 9 February 2024
/
Accepted: 12 February 2024
/
Published: 16 February 2024
(This article belongs to the Special Issue Recent Surface Treatments of Metals and Their Alloys)
Abstract
:Ti-based bulk metallic glasses are promising materials for metallic bone implants, mainly due to their mechanical biofunctionality. A major drawback is their limited corrosion resistance, with high sensitivity to pitting. Thus, effective surface treatments for these alloys must be developed. This work investigates the electrochemical treatment feasibility of nitric acid (HNO3) solution for two bulk glass-forming alloys. The surface states obtained at different anodic potentials are characterized with electron microscopy and Auger electron spectroscopy. The corrosion behavior of the treated glassy alloys is analyzed via comparison to non-treated states in phosphate-buffered saline solution (PBS) at 37 °C. For the glassy Ti47Zr7.5Cu38Fe2.5Sn2Si1Ag2 alloy, the pre-treatment causes pseudo-dealloying, with a transformation from naturally passivated surfaces to Ti- and Zr-oxide nanoporous layers and Cu-species removal from the near-surface regions. This results in effective suppression of chloride-induced pitting in PBS. The glassy Ti40Zr10Cu34Pd14Sn2 alloy shows lower free corrosion activity in HNO3 and PBS due to Pd stabilizing its strong passivity. However, this alloy undergoes pitting under anodic conditions. Surface pre-treatment results in Cu depletion but causes enrichment of Pd species and non-homogeneous surface oxidation. Therefore, for this glassy alloy, pitting cannot be completely inhibited in PBS. Concluding, anodic treatments in HNO3 are more suitable for Pd-free glassy Ti-based alloys.
1. Introduction
For several decades, bulk metallic glasses (BMGs) have been the focus of fundamental research, and numerous glass-forming alloy compositions have been identified. Based on a profound understanding of their unique short- and medium-range ordered structural characteristics and thermal behavior, an impressive portfolio of physical (e.g., magnetic), mechanical, and chemical performance data has been obtained. Recent reports demonstrate promising main applications of glass-forming alloys in soft-magnetic and sensing devices, optoelectronics, biomedical products, catalysis, aerospace, etc. [1,2,3]. The applicability of BMGs has been further enhanced by the utilization of innovative fabrication and processing methods, such as sputter techniques [4], additive manufacturing [5,6] or thermoplastic forming [7,8]. These techniques help to overcome limitations in the dimensions and shape of glassy parts that exist when applying conventional rapid quenching and casting routes.
Especially, Ti-based multi-component BMGs are considered favorable as new materials for biomedical products, e.g., for stents in the cardiovascular systems [9], and as small load-bearing implants or devices for dentistry, orthopedics or trauma surgery [10]. In comparison to bone implant materials in current clinical use, such as Ti (CP2 or CP4: σmax = 390–540/540–740 MPa, E = 102–108 GPa) and Ti-6Al-4V ELI (σmax = 860–950 MPa, E = 110–114 GPa), Ti-based BMGs exhibit a more beneficial combination of a lower Young’s moduli and a much higher strength (E = 80–100 GPa and σmax = 1680–2640 MPa). Thus, implants made from these new alloys can achieve higher stiffness levels, thereby helping to reduce stress-shielding effects and extending their lifespan even under severe loads. These fundamental benefits of their mechanical biofunctionality have provoked a burst of R&D activities in recent years to transfer Ti-based glasses into application [11,12]. However, new implant materials must be also highly biocompatible. Recently, we discussed the challenges of combining the complexity of alloy design strategies to fulfill the criteria for high glass-forming ability (GFA) and the consideration of the cytotoxicity of potential alloy constituents [13]. In fact, bulk GFA in Ti-based alloy systems is only possible when mixing the main constituent(s) with substantial amounts of late transition metals, such as Cu, and additional metal constituents.
Presently, two types of bulk glassy Ti alloy are the focus of studies concerning bone implant applications.
The Ti40Zr10Cu36Pd14 (at.%) alloy exhibits high GFA, as expressed by a maximum critical casting diameter for obtaining a monolithic amorphous state of dmax = 6 mm. In compression testing, this alloy showed a Young’s modulus of E = 82 GPa and compressive strength of σmax = 1950 MPa [12]. A partial substitution of Cu with at.% Sn or Ga was successful in improving the GFA and the thermal properties. The wide supercooled liquid ranges of these glasses, with ΔTx = 45–50 K, are being used for thermoplastic surface patterning [7,8,14].
Far less investigated is Ti47Zr7.5Cu38Fe2.5Sn2Si1Ag2 (at.%), an alloy with a critical casting diameter of dmax = 7 mm and supercooled liquid range of around ΔTx = 52 K. In static compression testing, a Young’s modulus of E = 100 GPa and a very high strength of σmax = 2080 MPa were reported [10,15]. For this glass-forming alloy, our first successful results in additive manufacturing include selective laser melting of bulk and lattice-like parts, resulting in a nearly fully amorphous state, with thermal properties comparable to those of cast samples, as shown in [16].
However, these and other (Ni, Al, Be-free) bulk-glass forming Ti-based alloys comprise high Cu contents, typically exceeding 30 at.% [4,10,11]. This poses challenges concerning their biocompatibility in terms of cytocompatibility and corrosion resistance. Small fractions of Cu in a Ti implant alloy can yield antibacterial effects based on the gradual release of trace amounts of Cu ions from the implant surface into the physiological surroundings [17]. But Cu is cytotoxic, and the high Cu fractions in Ti BMGs cause increased cytotoxicity in in vitro studies compared to clinical reference materials (CP–Ti) [18,19]. Furthermore, Ti (and often Zr, Hf), as the main valve metal component, spontaneously forms a barrier-type passivity in ambient and corrosion-free conditions, even in highly concentrated chloride-containing solutions like synthetic body fluids (0.150 M NaCl). Nevertheless, their high Cu contents cause pitting corrosion with low re-passivation ability [12,14,15,18,20,21]. This is a significant disadvantage compared to clinical Ti materials and competing beta-type Ti alloys, which maintain a strong protective passive state throughout the entire anodic water stability range and beyond [22].
Therefore, implant applications of Ti–Cu-based BMGs are only possible when suitable surface modification strategies are developed to improve the bioactivity and provide effective corrosion protection. Due to the high Cu content, standard surface treatments for implants, such as anodization (PEO/MA) for the generation of thicker oxide layers, are not applicable. Early approaches for surface treatments of Ti glasses involved costly physical methods like magnetron sputtering to generate a TiN-coating, complex multi-step chemical–electrochemical treatments [23], or hydrothermal treatments [24], also with pre-calcification for apatite formation [25]. An effective electro-/chemical release of Cu from the near-surface regions of a Ti-based BMG is only possible when operating either in a strongly alkaline or strongly acidic regime [26]. Electrochemical treatments in an alkaline solution at temperatures up to 70 °C resulted in nano-mesh oxide topographies that appeared promising for stimulating bone cell activity [27].
In the present work, we conduct a comparative analysis of the feasibility of anodic polarization treatments in a hot nitric acid solution, which is introduced as “pseudo-dealloying”, for two of the most relevant bulk glass-forming Ti–Cu-based alloys. The main objective is to generate valve metal-based oxide layers on the glassy alloy surface that can effectively suppress pitting corrosion within the stability range of water. The corrosion behavior of the treated glassy samples will be analyzed in a phosphate-buffered saline solution as a simplified simulated body fluid. A principal discussion on fundamental corrosion and corrosion protection mechanisms will focus on the role of specific alloying elements, such as Ti, Cu and Pd.
2. Materials and Methods
2.1. Metallic Glass Synthesis and Material State Characterization
For the present study, ribbons of the glass-forming Ti47Cu38Fe2.5Zr7.5Sn2Si1Ag2 and Ti40Zr10Cu34Pd14Sn2 (at.%) alloys were prepared via melt spinning. For the ingot preparation, all the constituent metals (purities above 99.99%) were mechanically cleaned and successively melted, in accurate concentrations, via arc melting (Edmund Bühler GmbH, Bodelshausen, Germany) in a Ti-gettered argon atmosphere. The ingots were re-melted at least three times to obtain chemical homogeneity. Ingot pieces (4–5 g) were rapidly quenched in a Cu single-roller melt spinner (Edmund Bühler GmbH) to produce amorphous ribbons of 0.3–0.5 cm width and 0.005 cm thickness.
The amorphous state of the as-spun ribbons was checked via X-ray diffraction (XRD; STOE Stadi P, Darmstadt, Germany), using Mo Kα1 monochromatic radiation (λ = 0.70930 Å), in transmission geometry mode with a 0.5° step size. Furthermore, the glassy nature of the rapidly quenched alloys was analyzed using differential scanning calorimetry (DSC; Perkin-Elmer DSC7, Waltham, MA, USA) at a constant heating rate of 0.33 K/s. Structural relaxation of the ribbons was performed by heating the samples to the glass transition region before recording the representative DSC curve. The undercooled liquid region (ΔTx) was determined from the onset temperatures of Tg and the first crystallization event (Tx1).
2.2. Electrochemical Surface Treatment in Nitric Acid Solution and Surface State Analysis
Electrochemical studies of the surface treatments were conducted using a three-electrode glass cell with a double-wall jacket for temperature regulation (BioLogic, Seyssinet-Pariset, France), which was connected to a Solartron SI 1287 electrochemical interface. Samples of Ti47Cu38Fe2.5Zr7.5Sn2Si1Ag2 and Ti40Zr10Cu34Pd14Sn2 amorphous ribbons were employed as the working electrodes, exposing an area of 0.6–1 cm2 to the electrolyte (considering the length of the ribbons exposed is 1 cm). The samples were exposed to ambient laboratory conditions for several months. Therefore, they were in an air-aged state [28]. A platinum (Pt) sheet was used as a counter electrode. A saturated calomel electrode (SCE; Hg/Hg2Cl2; E(SCE) = 0.241 V vs. SHE) served as the external reference electrode and was connected via a Luggin capillary to the electrochemical cell. All the potentials reported were referred to the SCE. The electrolyte selected for these electrochemical investigations was 5 M HNO3 solution (65% p.a., CHEMSOLUTE®) (TH. Geyer, Renningen, Germany) and the tests were conducted at room temperature (RT) and at 60 °C. The pH value measured at room temperature was pH −0.7. These conditions were chosen considering the Pourbaix diagrams of Cu, as well as of Ti (hydrous and non-hydrous), at 25 °C [26] and the work of Zhu et al., where HNO3 at elevated temperatures to modify the surface of binary Ti–Cu alloys with excess of Cu content was used [29,30]. The alloy samples were cleaned with water and alcohol and then pre-exposed to the test electrolyte for 30 min under open circuit potential (OCP) conditions. Subsequently, linear potentiodynamic polarization measurements were performed in the range of −0.2 V vs. OCP to 2 V vs. SCE at a scan rate of 0.5 mV/s. These investigations were carried out with the aim of helping to understand the electrochemical behavior of the two glassy alloys in the electrolyte, thus facilitating the determination of appropriate conditions (potential and temperature) for the electrochemical treatment. More than three parallel experiments were performed to ensure data reproducibility. The parameters, corrosion potential (Ecorr), corrosion current density (icorr) and anodic current density (ianodic) at 1 V vs. SCE were determined by means of the graphical extrapolation method. The mean parameter values and error limits are provided, considering the reproducibility of the determined values from repeated polarization measurements.
From the dynamic measurements, three anodic potentials were identified for further tests and for examining the influence they have on the surface oxidation and morphology evolution.
For the potentiostatic pseudo-dealloying in 5 M HNO3, the ribbons were exposed for 10 min under OCP conditions, and afterwards, a potential step to a selected anodic potential was performed. This potential was held constant for 60 min while the current transient was recorded. After the treatment, the samples were rinsed at least three times with distilled water. All the electrochemical tests have been carried out at least three times to confirm the consistency of the data and the air side of the ribbon was used for the surface analysis. A Field Emission Scanning Electron Microscope (FE-SEM; Zeiss Ultra Plus, Oberkochen, Germany) with an energy of 20 keV was used to investigate the surface morphology of the non-treated and treated Ti47Cu38Fe2.5Zr7.5Sn2Si1Ag2 and Ti40Zr10Cu34Pd14Sn2 ribbon samples. Secondary electron (SE) and InLens detectors were used.
Chemical depth profiles of the non-treated and treated metallic glass surfaces were obtained using Auger electron spectroscopy (AES) in combination with Argon ion etching. The spectrometer (JEOL JAMP 9500F, Tokyo, Japan) was equipped with a hemispherical analyzer and operated with the electron beam conditions: 10 kV, 10 nA. The Argon ions were accelerated with 1 kV, leading to an estimated sputter rate of 6 nm/min (calibrated to SiO2). The sputter spot size of approximately 1 mm × 1 mm was a few orders of magnitude higher than the analyzing areas. At least two spots per surface sample were analyzed. The surface/bulk interface was set at the point where the oxygen concentration was 50% of its maximum.
2.3. Corrosion Testing of As-Spun and Surface-Treated Glassy Alloys in Phosphate-Buffered Saline
Electrochemical tests were employed to investigate how the surface treatment affects the corrosion properties of the glassy Ti47Cu38Fe2.5Zr7.5Sn2Si1Ag2 and Ti40Zr10Cu34Pd14Sn2 alloys. A phosphate-buffered saline solution (PBS; 140 mM NaCl, 3 mM KCl, 10 mM phosphate buffer, purchased from Merck KGaA, Rahway, NJ, USA) with pH 7.4 was used as the corrosive electrolyte and simplified simulated body fluid. The measurements were conducted in the same three-electrode glass cell (50 mL electrolyte volume) with a double-wall jacket for temperature regulation (BioLogic) used in Section 2.2 for the electrochemical treatment, at 37 °C and without deaeration. The cell was connected to a Solartron analytical ModuLab XM from AMETEK (Berwyn, PA, USA). A Pt sheet served as the counter electrode. The reference electrode was a saturated calomel electrode (SCE; Hg/Hg2Cl2; E(SCE) = 0.241 V vs. SHE). All the potentials reported were referred to SCE. Ribbon specimens of the two glassy alloys in the as-spun (non-treated) state and after surface treatment, as described in Section 2.2, were employed as working electrodes (geometrical surface area 1 cm2). Prior to corrosion testing, potentiostatic pseudo-dealloying was performed by applying a potential of 1 V for 60 min in 5 M HNO3 solution at 60 °C. Furthermore, commercial cp-Ti sheets were used as reference material. The Ti sheets were mechanically ground with 2500 SiC paper and exposed to laboratory ambient conditions for 24 h for air-aging. The samples were cleaned with ethanol, distilled water and dried in air.
Firstly, the OCP was monitored for 30 min to confirm the stabilization of the working electrode/electrolyte interface in the PBS solution. Then, linear potentiodynamic polarization measurements were conducted with a slow sweep rate of 1 mV/s, starting from the cathodic regime (−0.1 V vs. OCP) and sweeping up to 1.2 V vs. SCE. A current density limit of 10 mA/cm2 was set to stop local corrosion processes. The corrosion potential (Ecorr), corrosion current density (icorr), average passive current density (ipass) and pitting potential (Epit) were determined by means of the graphical extrapolation method. More than three parallel experiments were performed to ensure data reproducibility.
After anodic polarization, the sample surfaces were examined by means of FE-SEM to analyze the possible corrosion morphologies.
3. Results and Discussion
3.1. Characterization of Rapidly Quenched Ti-Based Alloy Samples
The structure and the thermal behavior of the melt-spun Ti47Cu38Fe2.5Zr7.5Sn2Si1Ag2 and Ti40Zr10Cu34Pd14Sn2 samples were investigated via XRD and DSC to assess the glassy sample quality. The XRD patterns of the two alloy ribbon types are shown in Figure 1a. Both confirm the presence of broad diffuse peaks, which are characteristic of the amorphous state. No sharp reflections typical of crystalline phases are detectable. The DSC scans in Figure 1b reveal the characteristic behavior of glass-forming alloys upon heating, showing an endothermic event with glass transition to a supercooled region and several exothermic crystallization events. The onset temperatures of the glass transition (Tg), the crystallization events (Tx) and the supercooled liquid region (ΔTx = (Tx − Tg)) are marked in Figure 1b and the values are summarized in Table 1. For both alloys, the thermal data match very well with the literature data for ribbons and cast bulk samples measured under similar conditions [7,8,10,12,14,15]. The high ΔTx values >50 K confirm the very good sample quality and express the high glass-forming ability of the alloys. The Ti47Cu38Fe2.5Zr7.5Sn2Si1Ag2 alloy shows a first sharp crystallization peak (Tx1) while the second is a more complex one, with one large peak accompanied by a characteristic shoulder (Tx2). Similar results were observed in [15]. In the case of Ti40Zr10Cu34Pd14Sn2, the first sharp crystallization event (Tx1) is followed by another pronounced peak Tx2 and a visible peak (Tx3). This agrees with reported results and hints at a complex successive crystallization process of the glassy alloy [31].
3.2. Electrochemical Surface Treatment in Nitric Acid Solution
3.2.1. Potentiodynamic Polarization Studies
The linear potentiodynamic polarization curves of the as-spun and air-aged Ti47Cu38Zr7.5Fe2.5Sn2Si1Ag2, as well as the Ti40Zr10Cu34Pd14Sn2 metallic glass samples, were measured at room temperature (RT) and at 60 °C in 5 M HNO3 solution. These curves are shown in Figure 2. They were recorded after 30 min of stabilization under OCP conditions. The derived corrosion parameters are summarized in Table 2. At RT, both alloys present a similar behavior, which is characteristic of spontaneously passive valve metal-based alloys with low corrosion activity. The corrosion current density (icorr) values are very low, i.e., around 0.1 × 10⁻⁶ and 0.03 × 10⁻⁶ A/cm2, respectively. The corresponding corrosion potential (Ecorr) values for both alloys are positive, where the value for the Ti40Zr10Cu34Pd14Sn2 alloy is higher by about 550 mV. This difference is mainly explained by the large fraction of the more noble element Pd. Upon anodic polarization, both alloys transfer directly into a stable passive regime corresponding to the wide potential ranges of low current density plateaus (ianodic). These low values are typical of strong barrier-type passive films. The current density level of the Pd-containing alloy is about one order of magnitude lower than that of the other alloy, indicating a stronger protective effect.
However, increasing the temperature of the 5 M HNO3 electrolyte to 60 °C substantially enhances the free corrosion activity of the glassy alloys. The icorr values are increased in both cases by two orders of magnitude compared to the values at RT and the Ecorr values are shifted in a negative direction by 30 and 270 mV. These indicators of enhanced reactivity can be attributed to both the anodic metal oxidation and the cathodic proton reduction. Upon anodic polarization, both alloys also show at the elevated temperature a direct transition into a plateau with current density levels that are about one order of magnitude higher than those at room temperature. This implies the growth of surface oxide layers with lower protective effects than the barrier-type films. Furthermore, the Ti40Zr10Cu34Pd14Sn2 glass confirms again a significantly lower anodic current density level than the Ti47Cu38Zr7.5Fe2.5Sn2Si1Ag2 and thus, the lower permeability of the growing oxide layer.
3.2.2. Potentiostatic Polarization Measurements and Surface Analysis
The potentiostatic polarization measurements were conducted at different anodic potentials in a 5 M HNO3 solution for a duration of 60 min. The impact of these treatments on the surface state evolution of the two glassy alloys was examined. The specific potentials were chosen based on the potentiodynamic polarization curves illustrated in Figure 2.
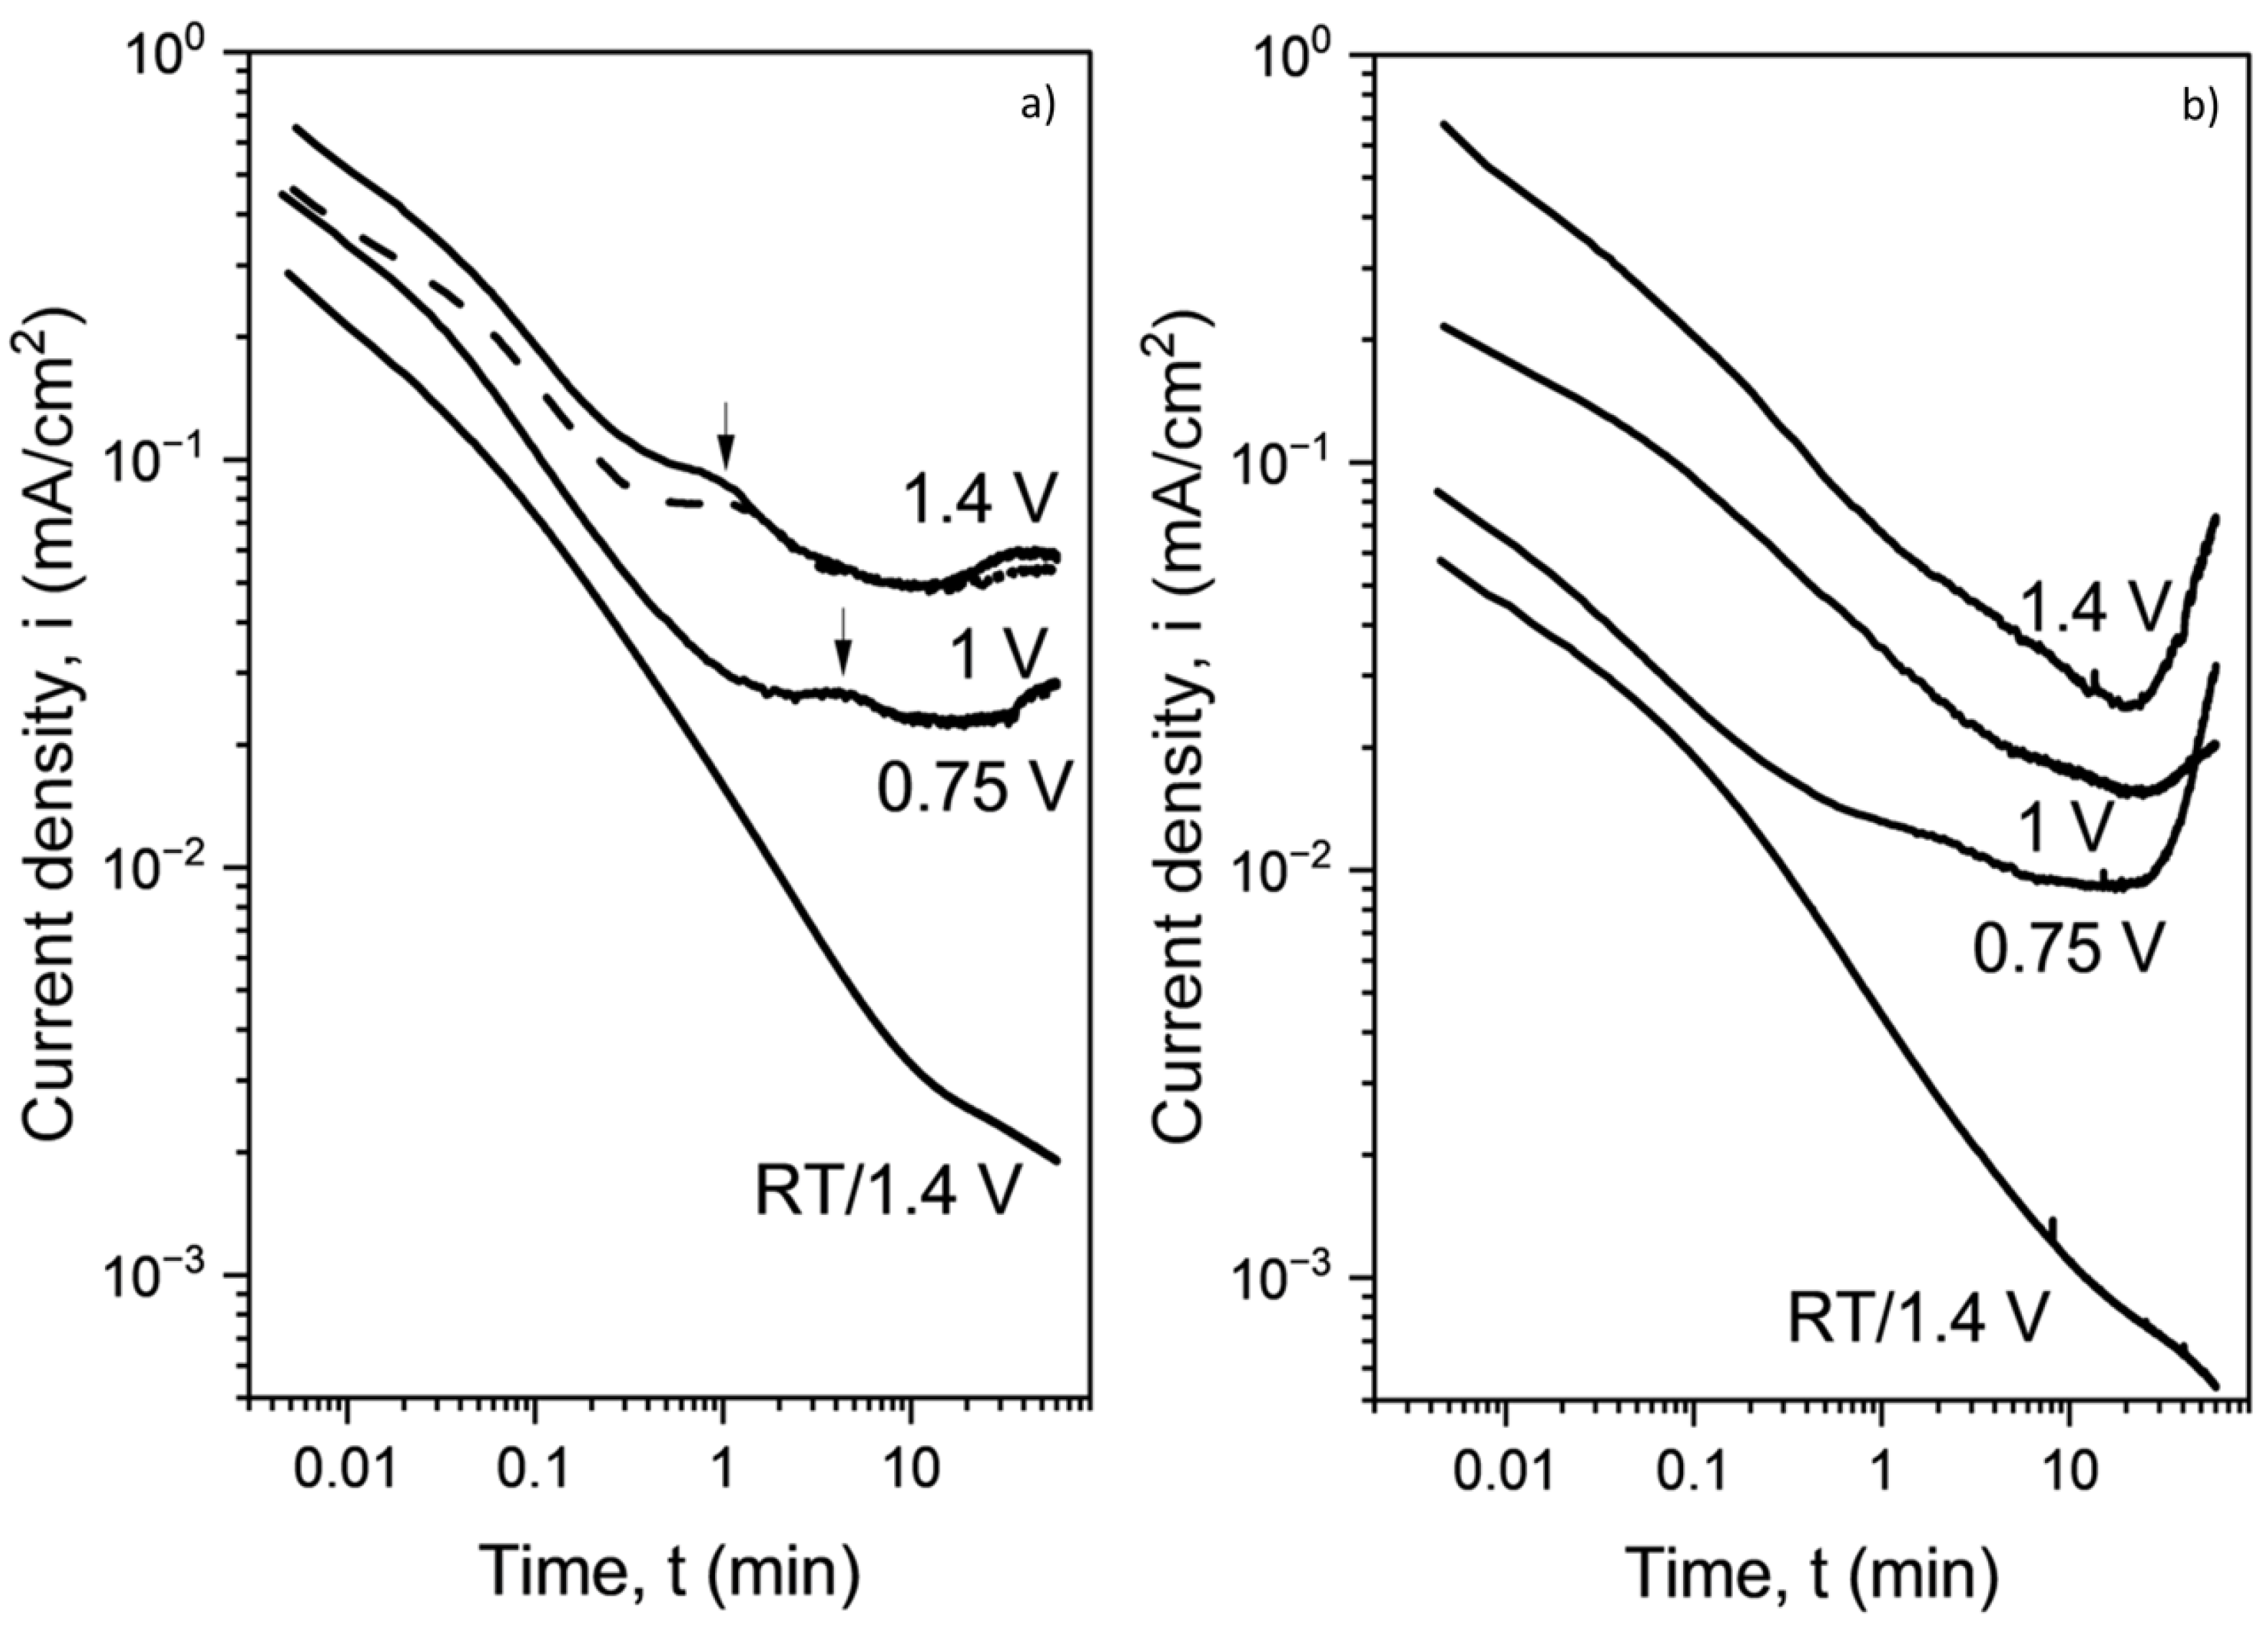
The recorded current density transients after a potential step from OCP to the respective anodic potential for the glassy Ti47Zr7.5Cu38Fe2.5Sn2Si1Ag2 alloy are shown in Figure 3a. Two different trends can be observed depending on the solution temperature. At RT, there is a strong continuous decay of the current density by about two orders of magnitude. After 60 min, a current density value of approximately 2 × 10⁻⁶ A/cm2 is reached, which aligns well with the low values obtained for the potentiodynamic measurements. This behavior confirms the formation of a barrier-type passive film on the surface, which is characteristic of Ti- and Zr-based metallic glasses even in strong acidic solutions without halide ions [32]. At a higher electrolyte temperature of 60 °C, the reactivity enhancement is expressed in overall higher levels of the recorded current densities and in different transient behavior with three distinguishable regions. In the initial period (up to 1 min for 0.75 V vs. SCE and 30 s for 1 V and 1.4 V vs. SCE), a continuous current density decay is recorded, which is similar to the behavior at RT and which hints at the beginning of a passive film growth. Furthermore, a small peak at around 1 min for applied potentials of 1 and 1.4 V vs. SCE and 4 min for 0.75 V vs. SCE can be detected (indicated by arrows in Figure 3a). This is attributed to the breakdown of the passive film and temporary dissolution of Cu, according to the reaction Cu0 → Cu2+ + 2e−. Finally, a region with a minimal current density level is reached, followed by a gradual increase (from 10 min for 0.75 V vs. SCE and 4 min for 1 V and 1.4 V vs. SCE), which is ascribed to a further oxide layer growth. Overall, this indicates more complex transformation reactions on the glassy alloy surface. With increasing applied potential, only a small increase in the current density level is observed, which corresponds to the plateau-like behavior observed in the potentiodynamic polarization measurements (Figure 2). At the same applied potential of 1.4 V vs. SCE, the temperature rise from RT to 60 °C leads to an increase in the current density end value after 60 min by about 1 order of magnitude, i.e., to about 40 × 10−6 A/cm2. This is indicative of different properties in the generated alloy surface state.
The anodic current transients for the Ti40Zr10Cu34Pd14Sn2 alloy are shown in Figure 3b and follow, in principle, a similar behavior. Also, here the RT transient reveals a stable passive film formation with an end value of approximately 5 × 10⁻⁷ A/cm2, which indicates an even higher protective effect of the film. At the higher electrolyte temperature of 60 °C, an initial passive film growth is confirmed, followed by less pronounced peaks corresponding to the Cu reaction. After about 15–20 min, for all the applied potentials, a minimum of the current density is reached, with values ranging from 9 to 25 × 10−6 A/cm2, which are slightly lower than for the other tested alloy. However, different to the firstly presented alloy, in the case of Ti40Zr10Cu34Pd14Sn2, the current density does not exhibit a gradual increase during the third transient period of 20–60 min; instead, it shows a steep rise, increasing by a factor of about 3. This cannot be only attributed to the growth of an oxide layer but is indicative of an enhanced surface reactivity, probably associated with the alloy constituent Pd.
Figure 3.
Current density transients of Ti47Zr7.5Cu38Fe2.5Sn2Si1Ag2 (a) and Ti40Zr10Cu34Pd14Sn2 (b) metallic glass samples recorded in 5 M HNO3 at 1.4 V vs. SCE at room temperature RT and, at 0.75, 1 and 1.4 V vs. SCE at 60 °C. The arrows in (a) indicate the small peaks in the transients.
Figure 3.
Current density transients of Ti47Zr7.5Cu38Fe2.5Sn2Si1Ag2 (a) and Ti40Zr10Cu34Pd14Sn2 (b) metallic glass samples recorded in 5 M HNO3 at 1.4 V vs. SCE at room temperature RT and, at 0.75, 1 and 1.4 V vs. SCE at 60 °C. The arrows in (a) indicate the small peaks in the transients.
To understand the electrochemical behavior of the glassy alloys in more detail, surface analytical studies were performed after polarization measurements. The morphologies of the Ti47Zr7.5Cu38Fe2.5Sn2Si1Ag2 ribbon surfaces (air side) obtained after the potentiostatic treatments in the 5 M HNO3 solution were analyzed by means of FE-SEM, as shown in Figure 4. The sample surface generated at RT while applying a potential of 1.4 V vs. SCE (Figure 4a) is rather smooth and shows only a weakly pronounced nanoroughness. This is similar to the typical surface morphology of the air side of a melt-spun ribbon in the air-aged state. The formed very thin passive films of only a few nanometers thickness are not visible using microscopy. However, when this is compared to the samples anodically treated at 60 °C, the significant difference is obvious (Figure 4b–d). The typical features are nanoporous structures, which are homogenously formed on the entire ribbon surface with typical pore sizes of 10–20 nm and ligament sizes in a similar range. At the highest applied potential, this nanoscale structure is more pronounced. The diffuse contrast of the images is due to the oxidic nature of the surface nanostructures. Surface analytical studies by means of AES and XPS (not shown here) revealed that the nanoporous surface regions of the metallic glass are mainly composed of Ti- and Zr-oxides with potential-dependent thickness values of 15–35 nm, while the Cu species are removed from these regions.
Altogether, the characteristic electrochemical behavior of the glassy Ti47Zr7.5Cu38Fe2.5Sn2Si1Ag2 alloy at elevated temperature in an HNO3 solution and the corresponding surface nanostructuring features gave rise to a “pseudo-dealloying” process. Unlike chemical/electrochemical dealloying of alloys with noble metal components allowing complete nanostructuring of bulk samples [33], for those multi-components Ti-based metallic glass alloys, the dealloying is restricted to only near-surface regions of a bulk sample due to the competing rapid oxide formation.
The question now is whether such a surface modification process is also transferrable to other Ti-based metallic glasses. From the SEM images in Figure 5 for similarly treated Ti40Zr10Cu34Pd14Sn2 glass samples, it is obvious that this is not really the case. After potentiostatic treatment at RT, also in this case a quite featureless air side of the melt-spun ribbon sample is retained due to the homogeneous passive film formation. However, the potentiostatic polarizations in 5 M HNO3 at 60 °C yielded at all three applied anodic potentials a certain nanoroughness but not with clearly defined features like pronounced nanoporosity and ligaments. Moreover, the generated surface states are not very homogeneous but a surface degradation occurred more localized, especially visible in Figure 5c.
Additional chemical surface analysis was performed at various surface regions of the electrochemically treated samples. Figure 6 shows the typical AES sputter depth profiles of glassy Ti40Zr10Cu34Pd14Sn2 ribbons surfaces (air side) in the as-spun state and after potentiostatic treatments at different anodic potentials in 5 M HNO3 at 60 °C. The minor fraction of tin (Sn) is not reliably detectable and therefore is not shown. From the oxygen (O) profile of the as spun alloy, it can be derived that the naturally forming passive film on this alloy is with about 17 nm relatively thick. It is mostly composed of Ti- and Zr- oxides, which form in a selective surface oxidation process. Consequently, Cu species and Pd species are enriched in the near-surface regions at the oxide/metal interface. These are typical surface compositions of rapidly quenched Zr–Cu- or Ti–Cu-based metallic glasses in as-prepared and naturally passivated states [32]. After the potentiostatic treatments in hot HNO3, the thickness values of the grown oxide layers do not substantially increase, and a potential-dependence is not detectable. This is different to the behavior of the earlier described Ti47Zr7.5Cu38Fe2.5Sn2Si1Ag2 glass, and together with the SEM-detected non-homogeneous roughness, this hints at a higher trend for surface dissolution and a retarded surface re-oxidation. It is remarkable that at all three applied potentials the Pd concentrations at the inner oxide/metal interface are now significantly higher than the concentrations of Cu species. These surface analytical results indicate that, also for the Ti40Zr10Cu34Pd14Sn2 glass, the anodic treatments in hot HNO3 enhance the removal of Cu species from the near-surface regions via dissolution but also lead to the relative accumulation of noble Pd species in these regions. This, on the one hand, hinders the homogeneous growth of nanoporous oxide layers and, on the other hand, can enhance the surface reactivity owing to the electrocatalytic properties of this noble metal. Altogether, this can explain the strong increase in the current density in the last period of the potentiostatic polarization measurements (Figure 3b).
3.3. Impact of Surface Treatments of Glassy Alloys on Corrosion Performance in PBS Solution
3.3.1. Electrochemical Analysis of Non-Treated and Treated Glassy Alloys and cp-Ti
For the envisioned implant applications, the glassy Ti-based alloys must exhibit high corrosion resistance and stable passivity in a physiological medium, at least within the stability range of water. Therefore, the corrosion behavior of the two glassy alloy types in their non-treated as-spun state, and after an exemplary electrochemical pre-treatment in hot HNO3, was analyzed in a phosphate-buffered saline solution (PBS) at 37 °C. This was mainly performed to assess the effectiveness of the modified alloy surface states for surface protection in a chloride-containing solution. Based on detailed studies described in Section 3.2, a pre-treatment in 5 M HNO3 at 60 °C applying an anodic potential of 1 V vs. SCE for 60 min was selected. As a conventional reference material, cp-Ti in as-polished and air-aged state was employed.
The open circuit potentials (OCPs) of the test samples were monitored for 30 min prior to potentiodynamic polarization in a PBS solution (Figure S1). The OCPend values are summarized in Table 3. While cp-Ti showed a gradual increase in the OCP value over time, achieving a value of approximately −400 mV vs. SCE, corresponding to progressing surface passivation, the OCP curves of the two multicomponent alloys in the non-treated as-spun states and after the electrochemical treatments were relatively stable and much more positive than that of cp-Ti. The non-treated Ti47Zr7.5Cu38Fe2.5Sn2Si1Ag2 glassy ribbon showed a more positive OCPend value of about −130 mV vs. SCE, indicating the presence of a more noble metal, such as Cu, in the near-surface regions. However, the Pd in the Ti40Zr10Cu34Pd14Sn2 alloy has a stronger effect on the OCP value. This is due to its more positive electrode potential, i.e., the phenomenon of an ennobled surface being observed. Thus, the OCPend reached a value of around 60 mV vs. SCE.
The electrochemical pre-treatment of the glassy alloy samples in an HNO3 solution influenced the OCP trend, especially for the Ti47Zr7.5Cu38Fe2.5Sn2Si1Ag2 alloy. A substantial positive shift in the OCP of more than 100 mV vs. SCE was observed. This fact may indicate difficulties in the anodic reaction of the corrosion process (Evans diagrams), which is due to the presence of a thicker nanoporous oxide layer formed by the valve metal components, as described in Section 3.2. In contrast, for the glassy Ti40Zr10Cu34Pd14Sn2 alloy, the treatment in a hot acidic solution yielded a less defined non-homogeneous surface state and, as a result, did not significantly change the OCP in PBS.
The typical potentiodynamic polarization curves measured for the different sample types in PBS at 37 °C are shown in Figure 7 and the derived corrosion parameters are summarized in Table 3. The OCPend values correspond quite well to the respective Ecorr values and confirm the free corrosion behavior.
The corrosion rate of the cp-Ti with a corrosion current density (icorr) value of about 2 × 10⁻⁸ A/cm2 was low, indicating that the metal oxidation reaction is hindered due to the spontaneous formation of a passive film. This fact was confirmed by a continued potential sweep, and at around 200 mV vs. SCE, a stable anodic passivity region was observed. In contrast, the polarization curve for the non-treated glassy Ti47Cu38Zr7.5Fe2.5Sn2Si1Ag2 ribbon sample showed a different behavior. While the free corrosion activity expressed in the icorr value was similarly low as for cp-Ti, an early pitting event began upon anodic polarization at a potential of around −100 mV vs. SCE. The presence of Cu in the near-surface regions of the alloy reduced the continuity of the Ti- and Zr-oxide passive film (or increased its defectiveness), which provoked the development of pitting corrosion [34,35]. This is similar to Zr–Cu-based bulk glass-forming alloys, for which the clear dependence of the pitting potential on the Cu content of the alloy was demonstrated and attributed to a Cu enrichment underneath the growing Zr-oxide passive films [21,32].
For the non-treated glassy Ti40Zr10Cu34Pd14Sn2 alloy, a very low icorr value of about 9 × 10⁻⁹ A/cm2 was measured at a slightly positive Ecorr value of around 20 mV. Furthermore, upon anodic polarization, the current density of the passive region was found to be significantly lower than the one of cp-Ti, i.e., by 3 orders of magnitude, and of the other tested glassy alloy, as well as the reported values for other Cu-free Ti–Zr–Pd–Si glasses studied under similar conditions [36]. This implies the rather high free corrosion resistance and strong passivation ability of this specific metallic glass composition, which can be attributed to the high fraction of Pd in the alloy. This is supported by the AES measurements shown in Figure 6a, which revealed relatively thick naturally formed Ti- and Zr-oxide passive films with Pd present in the oxide/metal-near surfaces for the as-spun alloy state. But in the chloride-containing PBS solution, the glassy Ti40Zr10Cu34Pd14Sn2 alloy also showed pitting corrosion after the wide passive region at around 450 mV vs. SCE. This is again attributable to the presence of Cu in the near-surface regions of the non-treated sample. The positive effect of cathodic alloying Pd on the corrosion resistance of the Ti alloy is due to the shift of the potential alloy to the region of complete passivity. Since Pd has a low polarizability of the cathodic corrosion reaction, this leads to polarization of the Ti-based metal and provokes several events on its surface. At the initial moment of immersion, the anodic dissolution current of Ti abruptly rises, and its potential shifts to the region of complete passivity. As soon as the potential reaches this region, the dissolution current of Ti will be equal to the passivity current, which is much less with respect to the current of the active dissolution region. At the same time, a passive film is formed on the surface, exhibiting a significant improvement in the protective properties compared to the natural film. Consequently, the free corrosion potential of Ti alloyed with Pd shifts to positive values, and the alloy corrosion current sharply decreases [37].
The pre-treatment of the glassy Ti47Cu38Zr7.5Fe2.5Sn2Si1Ag2 sample in the hot HNO3 solution changed the character of the surface state, as described in Section 3.2, to a thicker oxide layer with a nanoporous structure and a depletion of Cu species from near-surface regions. Consequently, the polarization curve measured in the PBS solution differs from the one measured for the non-treated alloy state. Namely, the Ecorr value (around −15 mV vs. SCE), is significantly more positive, while the icorr retains at a similarly low level, i.e., around 2 × 10⁻⁸ A/cm2. Most remarkably, the anodic passive state is continuously stable within the entire measured potential range of water stability and is at a passive current density level (ipass) similar to that of passive cp-Ti, i.e., around 1.5 × 10⁻⁵ A/cm2. There are no indications of oxide layer breakdown and pitting initiation. This demonstrates the effectiveness of this electrochemical pre-treatment for the suppression of chloride-induced localized corrosion.
After a similar anodic pre-treatment in hot HNO3, the glassy Ti40Zr10Cu34Pd14Sn2 sample demonstrated different behavior in the PBS solution. The icorr increased by a factor of two and the ipass even increased by about two orders of magnitude compared to the non-treated surface state. This already indicates an enhancement of the surface reactivity for this alloy, although the overall current density level remained below that of the other glassy alloy. Furthermore, pitting corrosion was not suppressed and was initiated at around 800 mV vs. SCE. All these facts reveal that the pre-formed surface state with non-homogeneous oxide film, depleted Cu levels but relative Pd accumulation, as described in Section 3.2, has only limited protective effect and does not inhibit local corrosion events.
3.3.2. SEM Analysis of Corroded Alloy Surfaces after Polarization Measurements in PBS
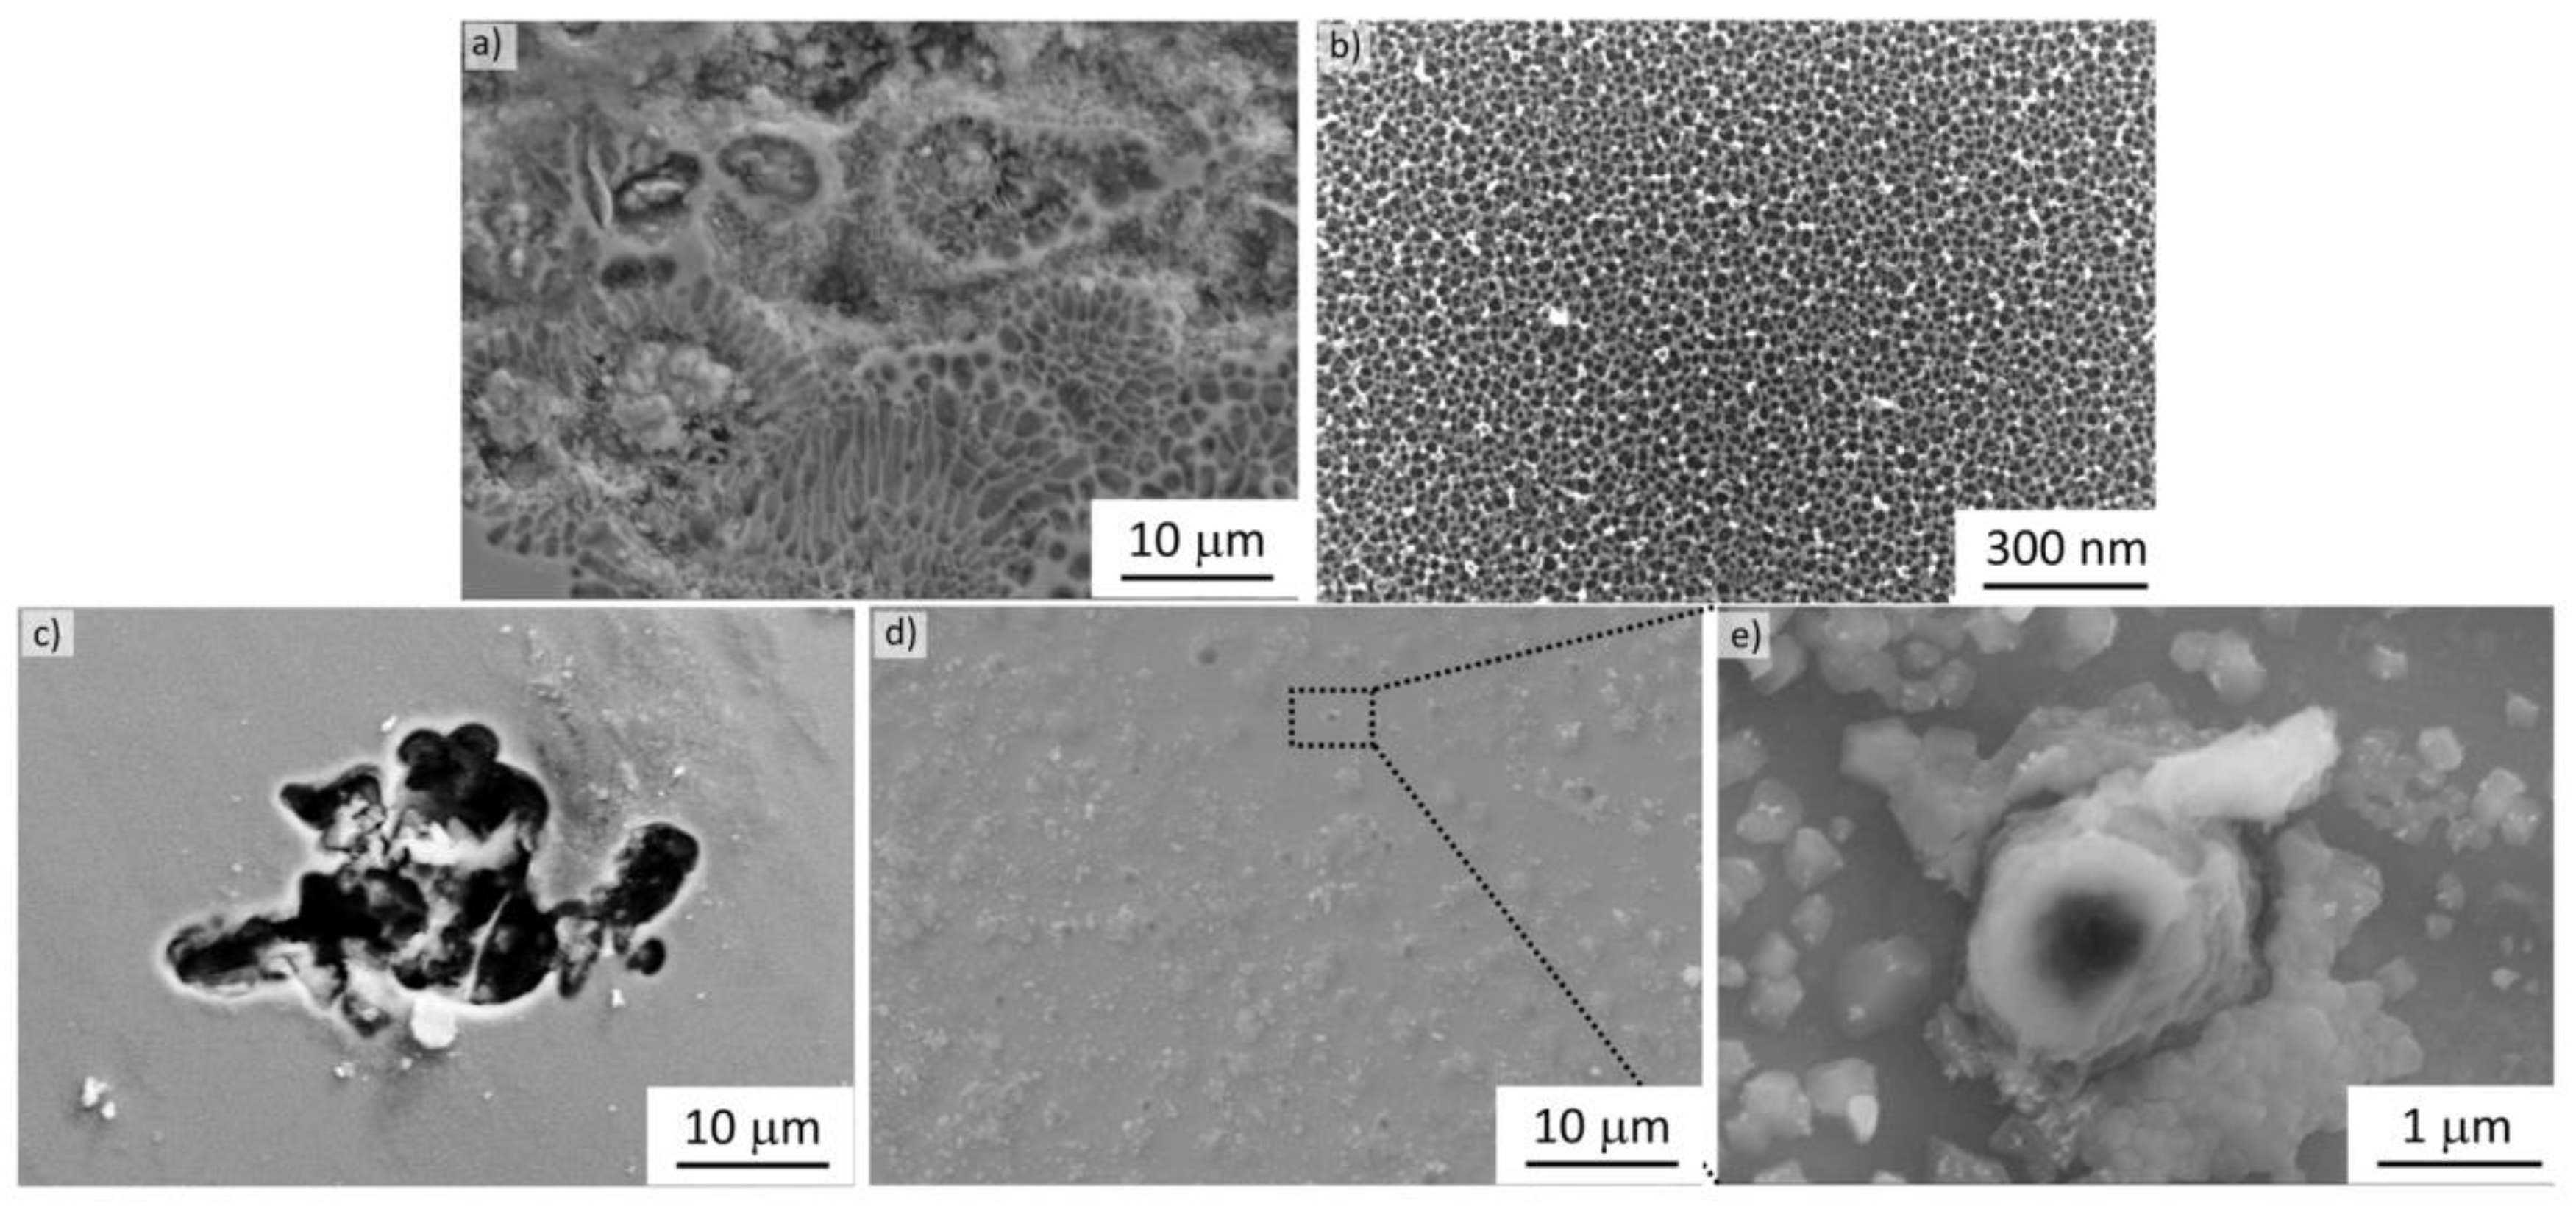
For a more detailed understanding of the pitting corrosion mechanism of the two investigated glassy alloys, SEM studies were conducted after polarization measurements in PBS solution, as shown in Figure 7. SEM images revealing the typical features of the pitting corrosion damage of the non-treated glassy alloy samples and the pre-treated Pd-containing glassy alloy sample are summarized in Figure 8. Figure 8a shows the rim region of a growing corrosion front for a non-treated Ti47Cu38Zr7.5Fe2.5Sn2Si1Ag2 sample. It is visible that the initiation of pitting degradation occurred from a local breakdown of the passive film, and the corrosion reaction proceeded underneath the passive film. This generates a mesh structure that propagates mostly laterally on the glassy alloy surface. This has been similarly observed for the pitting of several Zr–Cu-based metallic glasses [21]. Furthermore, this observed phenomenon is comparable to the evolution of closed-type pitting on the surface of crystalline metal alloys such as chromium–nickel stainless steels in chloride solutions [37]. It should be noted that, on the glassy alloy surface, a large area of corrosion degradation was observed, formed by the accumulation of a large number of smaller pits surrounded by mesh-like regions with a ligament structure. This is similar to the structures formed by the dealloying processes of various metallic glasses [10].
For comparison and to prove the results obtained in Figure 7, an SEM image of the anodic pre-treated Ti47Cu38Zr7.5Fe2.5Sn2Si1Ag2 after potendiodynamic polarization in PBS is shown in Figure 8b. No sign of pitting is observed, as the homogeneous nanoporous structure is conserved (Section 3.2.2, Figure 4b). This fact, once more, proves the effectiveness of the pre-treatment method in suppressing pitting corrosion when applied to the Ti47Cu38Zr7.5Fe2.5Sn2Si1Ag2 glassy alloy.
An SEM image obtained for a non-treated Ti40Zr10Cu34Pd14Sn2 glassy sample after potentiodynamic polarization in PBS is shown in Figure 8c. It reveals some similar and distinctive features, as discussed for the non-treated Ti47Cu38Zr7.5Fe2.5Sn2Si1Ag2 glass. The specific semicircular geometry observed on the surface delineates the origin points of the ligaments formed due to corrosion degradation. However, for this alloy, the development of the corrosion front does not occur laterally but mainly deep into the glass matrix. This indicates the stronger localization of the corrosion reaction and thereby demonstrates a different corrosion degradation behavior of the two glassy alloys in their non-treated state. The more localized pit growth can be attributed to the stronger protective properties of the passive film formed on the glassy Ti40Zr10Cu34Pd14Sn2 alloy compared to that on the Ti47Cu38Zr7.5Fe2.5Sn2Si1Ag2 alloy, as discussed in the previous Section 3.3.1.
Only the glassy Ti40Zr10Cu34Pd14Sn2 alloy showed indications of pitting corrosion under potentiodynamic polarization conditions in PBS (Figure 7) after anodic pre-treatment in a hot HNO3 solution.
Figure 8d shows a typical grown-out pit with similar morphology. The boundaries of the pit had a spherical shape (Figure 8e), with a diameter of 515 ± 135 nm, and the distances between pits are quite significant. It is noteworthy that corrosion products accumulated around the border of deep pits, indicating the process of hydrolysis of cations of the alloy components. Considering the composition of the corrosion medium and its pH, it can be assumed that the corrosion products are mainly Cu oxides. The occurrence of pitting corrosion in the Ti40Zr10Cu34Pd14Sn2 glassy sample is apparently related to the peculiarities of the surface morphology after pre-treatment in 5 M HNO3 at 60 °C. As it was shown in Section 3.2, the sites of inhomogeneity of surface states and localization of degradation of the formed oxide layer became the centers of nucleation, formation and growth of local degradation.
4. Summary and Conclusions
For two notable Ti–Cu-based bulk glass-forming alloys with envisioned biomedical applications, Ti47Cu38Zr7.5Fe2.5Sn2Si1Ag2 and Ti40Zr10Cu34Pd14Sn2, the efficiency of anodic pre-treatments in nitric acid (HNO3) solution for improving their corrosion properties in a phosphate-buffered saline (PBS) solution was comparatively investigated.
Increasing the temperature of the pre-treatment electrolyte (5 M HNO3) from room temperature to 60 °C is essential for both alloys to transition from strong passivity to a more activated state.
For the glassy Ti47Cu38Zr7.5Fe2.5Sn2Si1Ag2 alloy, pre-treatment in the hot acid solution resulted in the formation of thicker nanoporous Ti- and Zr-oxide layers and the removal of Cu species from the near-surface regions. This effectively suppressed chloride-induced pitting corrosion in PBS solution and retained strong passivity up to the water stability limit. However, for the glassy Ti40Zr10Cu34Pd14Sn2 alloy, the pre-treatment led to the anticipated depletion of Cu from the near-surface regions but also resulted in a relative enrichment of Pd species and a non-homogeneous surface oxidation. This led to incomplete inhibition of pitting corrosion in PBS solution.
In conclusion, anodic treatments in hot nitric acid are more suitable for Pd-free glassy Ti-based alloys such as Ti47Cu38Zr7.5Fe2.5Sn2Si1Ag2, as they form a homogeneous protection barrier against chloride-induced pitting corrosion degradation.
Supplementary Materials
The following supporting information can be downloaded at: https://www.mdpi.com/article/10.3390/met14020241/s1, Figure S1. Representative OCP curves measured for 30 min in PBS (pH 7.4) at 37 °C for Ti sheets in as-polished, air-aged states and glassy Ti47Cu38Zr7.5Fe2.5Sn2Si1Ag2 and Ti40Zr10Cu34Pd14Sn2 ribbon samples in as-spun state and after potentiostatic polarization treatment in 5 M HNO3 solution at 60 °C at 1 V vs. SCE for 60 min.
Author Contributions
Conceptualization, N.F.-N., V.S. and A.G.; methodology, N.F.-N., V.S., M.H. and A.G.; validation, N.F.-N., V.S. and M.H.; formal analysis, N.F.-N., V.S. and M.H.; investigation, N.F.-N. and V.S.; resources, A.G.; data curation, N.F.-N., V.S. and M.H.; writing—original draft preparation, N.F.-N., V.S., M.H. and A.G.; writing—review and editing, N.F.-N., V.S. and A.G.; visualization, N.F.-N. and V.S.; supervision, A.G.; project administration, A.G.; funding acquisition, A.G. All authors have read and agreed to the published version of the manuscript.
Funding
N.F.-N., V.S. and A.G. are grateful for the financial support received from Deutsche Foschungsgemeinschaft (DFG) under the grant agreement No. 458057521; GE 1106/15-1 and DFG Mercator Fellowship supplementary to DFG project GE/1106/15-1 (no. 458057521).
Data Availability Statement
The data presented in this study are available on request from the corresponding author. The data are not publicly available due to privacy reasons.
Acknowledgments
The authors are grateful to Sven Donath and Kerstin Hennig for the technical support; Birgit Bartusch (DSC analysis), Steffi Kaschube (AES analysis), Andrea Voss (chemical analysis) and Kai Neufeld for the support with the SEM analysis. Also, they are grateful to colleagues and partners from EU-ITN-BIOREMIA H2020-MSCA, especially Mariana Calin, and from the University of Torino (Italy), Paola Rizzi and Kirti Tiwari, for the fruitful scientific discussion.
Conflicts of Interest
The authors declare no conflicts of interest.
References
- Sharma, A.; Zadorozhnyy, V. Review of the recent development in metallic glass and its composites. Metals 2021, 11, 1933. [Google Scholar] [CrossRef]
- Gao, K.; Zhu, X.G.; Chen, L.; Li, W.H.; Xu, X.; Pan, B.T.; Li, W.R.; Zhou, W.H.; Li, L.; Huang, W.; et al. Recent development in the application of bulk metallic glasses. J. Mater. Sci. Technol. 2022, 131, 115–121. [Google Scholar] [CrossRef]
- Greer, A.L.; Costa, M.B.; Houghton, O.S. Metallic glasses. MRS Bull. 2023, 48, 1054–1061. [Google Scholar] [CrossRef]
- Jabed, A.; Bhuiyan, M.N.; Haider, W.; Shabib, I. Distinctive Features and Fabrication Routes of Metallic-Glass Systems Designed for Different Engineering Applications: A Review. Coatings. 2023, 13, 1689. [Google Scholar] [CrossRef]
- Sohrabi, N.; Jhabvala, J.; Kurtuldu, G.; Frison, R.; Parrilli, A.; Stoica, M.; Neels, A.; Löffler, J.F.; Logé, R.E. Additive manufacturing of a precious bulk metallic glass. Appl. Mater. Today 2021, 24, 101080. [Google Scholar] [CrossRef]
- Luo, H.; Du, Y. Mechanical Properties of Bulk Metallic Glasses Additively Manufactured by Laser Powder Bed Fusion: A Review. Materials 2023, 16, 7034. [Google Scholar] [CrossRef] [PubMed]
- Bera, S.; Sarac, B.; Balakin, S.; Ramasamy, P.; Stoica, M.; Calin, M.; Eckert, J. Micro-patterning by thermoplastic forming of Ni-free Ti-based bulk metallic glasses. Mater. Des. 2017, 120, 204–211. [Google Scholar] [CrossRef]
- Cai, F.F.; Sarac, B.; Chen, Z.; Czibula, C.; Spieckermann, F.; Eckert, J. Surmounting the thermal processing limits: Patterning TiZrCuPdSn bulk metallic glass even with nanocrystallization. Mater. Today Adv. 2022, 16, 100316. [Google Scholar] [CrossRef]
- Jafary-Zadeh, M.; Kumar, G.P.; Branicio, P.S.; Seifi, M.; Lewandowski, J.J.; Cui, F. A critical review on metallic glasses as structural materials for cardiovascular stent applications. J. Funct. Biomater. 2018, 9, 19. [Google Scholar] [CrossRef]
- Gong, P.; Deng, L.; Jin, J.; Wang, S.; Wang, X.; Yao, K. Review on the research and development of Ti-based bulk metallic glasses. Metals 2016, 6, 264. [Google Scholar] [CrossRef]
- Li, H.F.; Zheng, Y.F. Recent advances in bulk metallic glasses for biomedical applications. Acta Biomater. 2016, 36, 1–20. [Google Scholar] [CrossRef]
- Liens, A.; Etiemble, A.; Rivory, P.; Balvay, S.; Pelletier, J.M.; Cardinal, S.; Fabrègue, D.; Kato, H.; Steyer, P.; Munhoz, T.; et al. On the potential of Bulk Metallic Glasses for dental implantology: Case study on Ti40Zr10Cu36Pd14. Materials 2018, 11, 249. [Google Scholar] [CrossRef]
- Calin, M.; Gebert, A.; Ghinea, A.C.; Gostin, P.F.; Abdi, S.; Mickel, C.; Eckert, J. Designing biocompatible Ti-based metallic glasses for implant applications. Mater. Sci. Eng. C. 2013, 33, 875–883. [Google Scholar] [CrossRef]
- Lachová, A.; Stoica, M.; Michalik, Š.; Gostin, P.F.; Fujioka-Kobayashi, M.; Schaller, B.; Löffler, J.F.; Sovák, P. Modification of structural, mechanical, corrosion and biocompatibility properties of Ti40Zr10Cu36Pd14 metallic glass by minor Ga and Sn additions. J. Alloys Compd. 2023, 940, 168776. [Google Scholar] [CrossRef]
- Pang, S.; Liu, Y.; Li, H.; Sun, L.; Li, Y.; Zhang, T. New Ti-based Ti-Cu-Zr-Fe-Sn-Si-Ag bulk metallic glass for biomedical applications. J. Alloys Compd. 2015, 625, 323–327. [Google Scholar] [CrossRef]
- Deng, L.; Gebert, A.; Zhang, L.; Chen, H.Y.; Gu, D.D.; Kühn, U.; Zimmermann, M.; Kosiba, K.; Pauly, S. Mechanical performance and corrosion behaviour of Zr-based bulk metallic glass produced by selective laser melting. Mater. Des. 2020, 189, 108532. [Google Scholar] [CrossRef]
- Ma, Y.; Yan, J.; Yan, T.; Wang, Q.; Bao, Z.; Yi, Z. Biological properties of Cu-bearing and Ag-bearing titanium-based alloys and their surface modifications: A review of antibacterial aspect. Front. Mater. 2022, 9, 999794. [Google Scholar] [CrossRef]
- Wang, Y.B.; Li, H.F.; Cheng, Y.; Zheng, Y.F.; Ruan, L.Q. In vitro and in vivo studies on Ti-based bulk metallic glass as potential dental implant material. Mater. Sci. Eng. C. 2013, 33, 3489–3497. [Google Scholar] [CrossRef] [PubMed]
- Lin, C.H.; Huang, C.H.; Chuang, J.F.; Huang, J.C.; Jang, J.S.C.; Chen, C.H. Rapid screening of potential metallic glasses for biomedical applications. Mater. Sci. Eng. C. 2013, 33, 4520–4526. [Google Scholar] [CrossRef] [PubMed]
- Gostin, P.F.; Addison, O.; Morrell, A.P.; Zhang, Y.; Cook, A.J.M.C.; Liens, A.; Stoica, M.; Ignatyev, K.; Street, S.R.; Wu, J.; et al. In Situ Synchrotron X-Ray Diffraction Characterization of Corrosion Products of a Ti-Based Metallic Glass for Implant Applications. Adv. Healthc. Mater. 2018, 7, 1800338. [Google Scholar] [CrossRef] [PubMed]
- Gostin, P.F.; Eigel, D.; Grell, D.; Eckert, J.; Kerscher, E.; Gebert, A. Comparing the pitting corrosion behavior of prominent Zr-based bulk metallic glasses. J. Mater. Res. 2014, 30, 233–241. [Google Scholar] [CrossRef]
- Gebert, A.; Oswald, S.; Helth, A.; Voss, A.; Gostin, P.F.; Rohnke, M.; Janek, J.; Calin, M.; Eckert, J. Effect of indium (In) on corrosion and passivity of a beta-type Ti-Nb alloy in Ringer’s solution. Appl. Surf. Sci. 2015, 335, 213–222. [Google Scholar] [CrossRef]
- Kirmanidou, Y.; Sidira, M.; Drosou, M.E.; Bennani, V.; Bakopoulou, A.; Tsouknidas, A.; Michailidis, N.; Michalakis, K. New Ti-Alloys and Surface Modifications to Improve the Mechanical Properties and the Biological Response to Orthopedic and Dental Implants: A Review. Biomed Res. Int. 2016, 2016, 2908570. [Google Scholar] [CrossRef]
- Fukushima, Y.; Katsumata, K.I.; Shengli, Z.; Guoqiang, X.; Niinomi, M.; Okada, K.; Matsushita, N. Solution process for synthesizing bioactive nano-mesh layer on Ti-based bulk metallic glasses. Mater. Trans. 2013, 54, 1343–1346. [Google Scholar] [CrossRef]
- Qin, F.X.; Wang, X.M.; Wada, T.; Xie, G.Q.; Asami, K.; Inoue, A. Formation of hydroxyapatite on Ti-coated Ti-Zr-Cu-Pd bulk metallic glass. Mater. Trans. 2009, 50, 605–609. [Google Scholar] [CrossRef]
- Pourbaix, M.; Zhang, H.; Pourbaix, A. Presentation of an Atlas of Chemical and Electrochemical Equilibria in the Presence of a Gaseous Phase; Trans Tech Publications Ltd.: Bäch, Switzerland, 1974. [Google Scholar] [CrossRef]
- Blanquer, A.; Hynowska, A.; Nogués, C.; Ibáñez, E.; Sort, J.; Baró, M.D.; Özkale, B.; Pané, S.; Pellicer, E.; Barrios, L. Effect of surface modifications of Ti40Zr10Cu38Pd12 bulk metallic glass and Ti-6Al-4V alloy on human osteoblasts in vitro biocompatibility. PLoS ONE 2016, 11, 1–15. [Google Scholar] [CrossRef] [PubMed]
- Sittig, C.; Textor, M.; Spencer, N.D.; Wieland, M.; Vallotton, P.H. Surface characterization of implant materials c.p. Ti, Ti-6Al-7Nb and Ti-6Al-4V with different pretreatments. J. Mater. Sci. Mater. Med. 1999, 10, 35–46. [Google Scholar] [CrossRef] [PubMed]
- Zhu, S.L.; He, J.L.; Yang, X.J.; Cui, Z.D.; Pi, L.L. Ti oxide nano-porous surface structure prepared by dealloying of Ti-Cu amorphous alloy. Electrochem. Commun. 2011, 13, 250–253. [Google Scholar] [CrossRef]
- Zhu, S.; Xie, G.; Yang, X.; Cui, Z. A thick hierarchical rutile TiO2 nanomaterial with multilayered structure. Mater. Res. Bull. 2013, 48, 1961–1966. [Google Scholar] [CrossRef]
- Calin, M.; Stoica, M.; Zheng, N.; Wang, X.; Scudino, S.; Gebert, A.; Eckert, J. Thermal stability and crystallization kinetics of Ti40Zr 10Cu34Pd14Sn2 bulk metallic glass. Solid State Phenom. 2012, 188, 3–10. [Google Scholar] [CrossRef]
- Gebert, A.; Gostin, P.F.; Schultz, L. Effect of surface finishing of a Zr-based bulk metallic glass on its corrosion behaviour. Corros. Sci. 2010, 52, 1711–1720. [Google Scholar] [CrossRef]
- Paschalidou, E.M.; Scaglione, F.; Gebert, A.; Oswald, S.; Rizzi, P.; Battezzati, L. Partially and fully de-alloyed glassy ribbons based on Au: Application in methanol electro-oxidation studies. J. Alloys Compd. 2016, 667, 302–309. [Google Scholar] [CrossRef]
- Liu, Y.; Wang, G.; Li, H.; Pang, S.; Chen, K.; Zhang, T. Ti-Cu-Zr-Fe-Sn-Si-Sc bulk metallic glasses with good mechanical properties for biomedical applications. J. Alloys Compd. 2016, 679, 341–349. [Google Scholar] [CrossRef]
- Hasannaeimi, V.; Sadeghilaridjani, M.; Mukherjee, S. Electrochemical and Corrosion Behavior of Metallic Glasses; MDPI: Basel, Switzerland, 2021. [Google Scholar] [CrossRef]
- Oak, J.J.; Inoue, A. Formation, mechanical properties and corrosion resistance of Ti-Pd base glassy alloys. J. Non. Cryst. Solids. 2008, 354, 1828–1832. [Google Scholar] [CrossRef]
- Tomashov, N.; Altvsky, R.; Chernova, G. Passivity and Corrosion Resistance of Titanium and Its Alloys. J. Electrochem. Soc. 1961, 108, 113–118. [Google Scholar] [CrossRef]
Figure 1.
XRD patterns of as-spun Ti47Cu38Fe2.5Zr7.5Sn2Si1Ag2 and Ti40Zr10Cu34Pd14Sn2 ribbons measured in transmission (a). DSC curves of the alloys recorded with a constant heating rate of 0.33 K/s (after pre-relaxation) (b).
Figure 1.
XRD patterns of as-spun Ti47Cu38Fe2.5Zr7.5Sn2Si1Ag2 and Ti40Zr10Cu34Pd14Sn2 ribbons measured in transmission (a). DSC curves of the alloys recorded with a constant heating rate of 0.33 K/s (after pre-relaxation) (b).
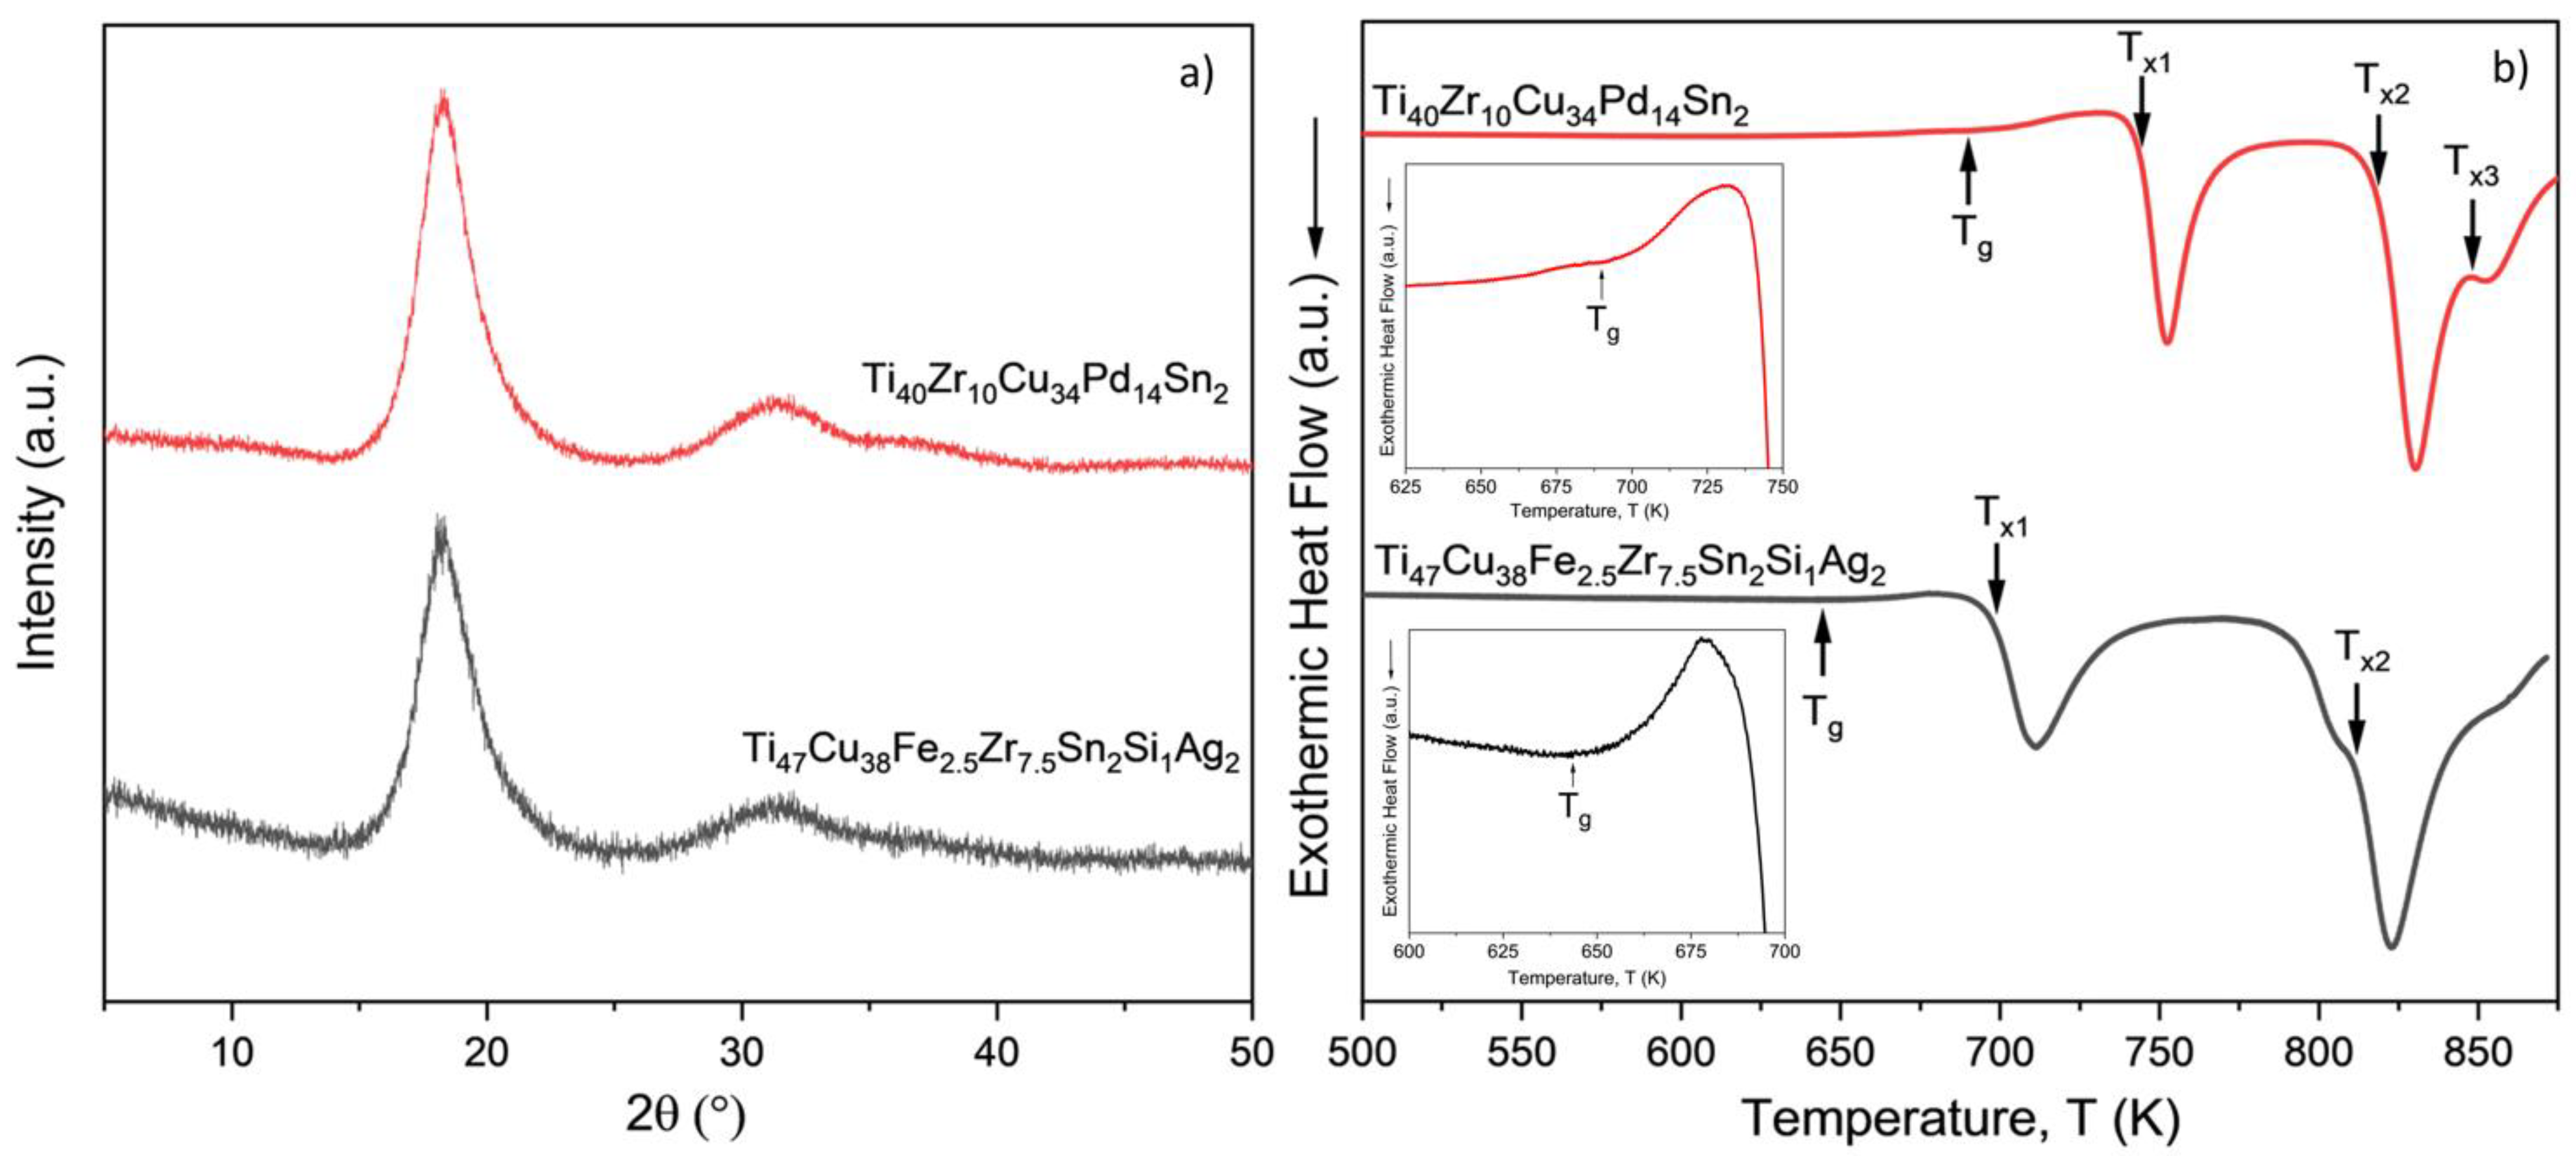
Figure 2.
Potentiodynamic polarization curves of Ti47Zr7.5Cu38Fe2.5Sn2Si1Ag2 and Ti40Zr10Cu34Pd14Sn2 metallic glass samples measured in 5 M HNO3 at RT and 60 °C with a scan rate of 0.5 mV/s. The arrows indicate the potential for potentiostatic polarization measurements (Figure 3).
Figure 2.
Potentiodynamic polarization curves of Ti47Zr7.5Cu38Fe2.5Sn2Si1Ag2 and Ti40Zr10Cu34Pd14Sn2 metallic glass samples measured in 5 M HNO3 at RT and 60 °C with a scan rate of 0.5 mV/s. The arrows indicate the potential for potentiostatic polarization measurements (Figure 3).
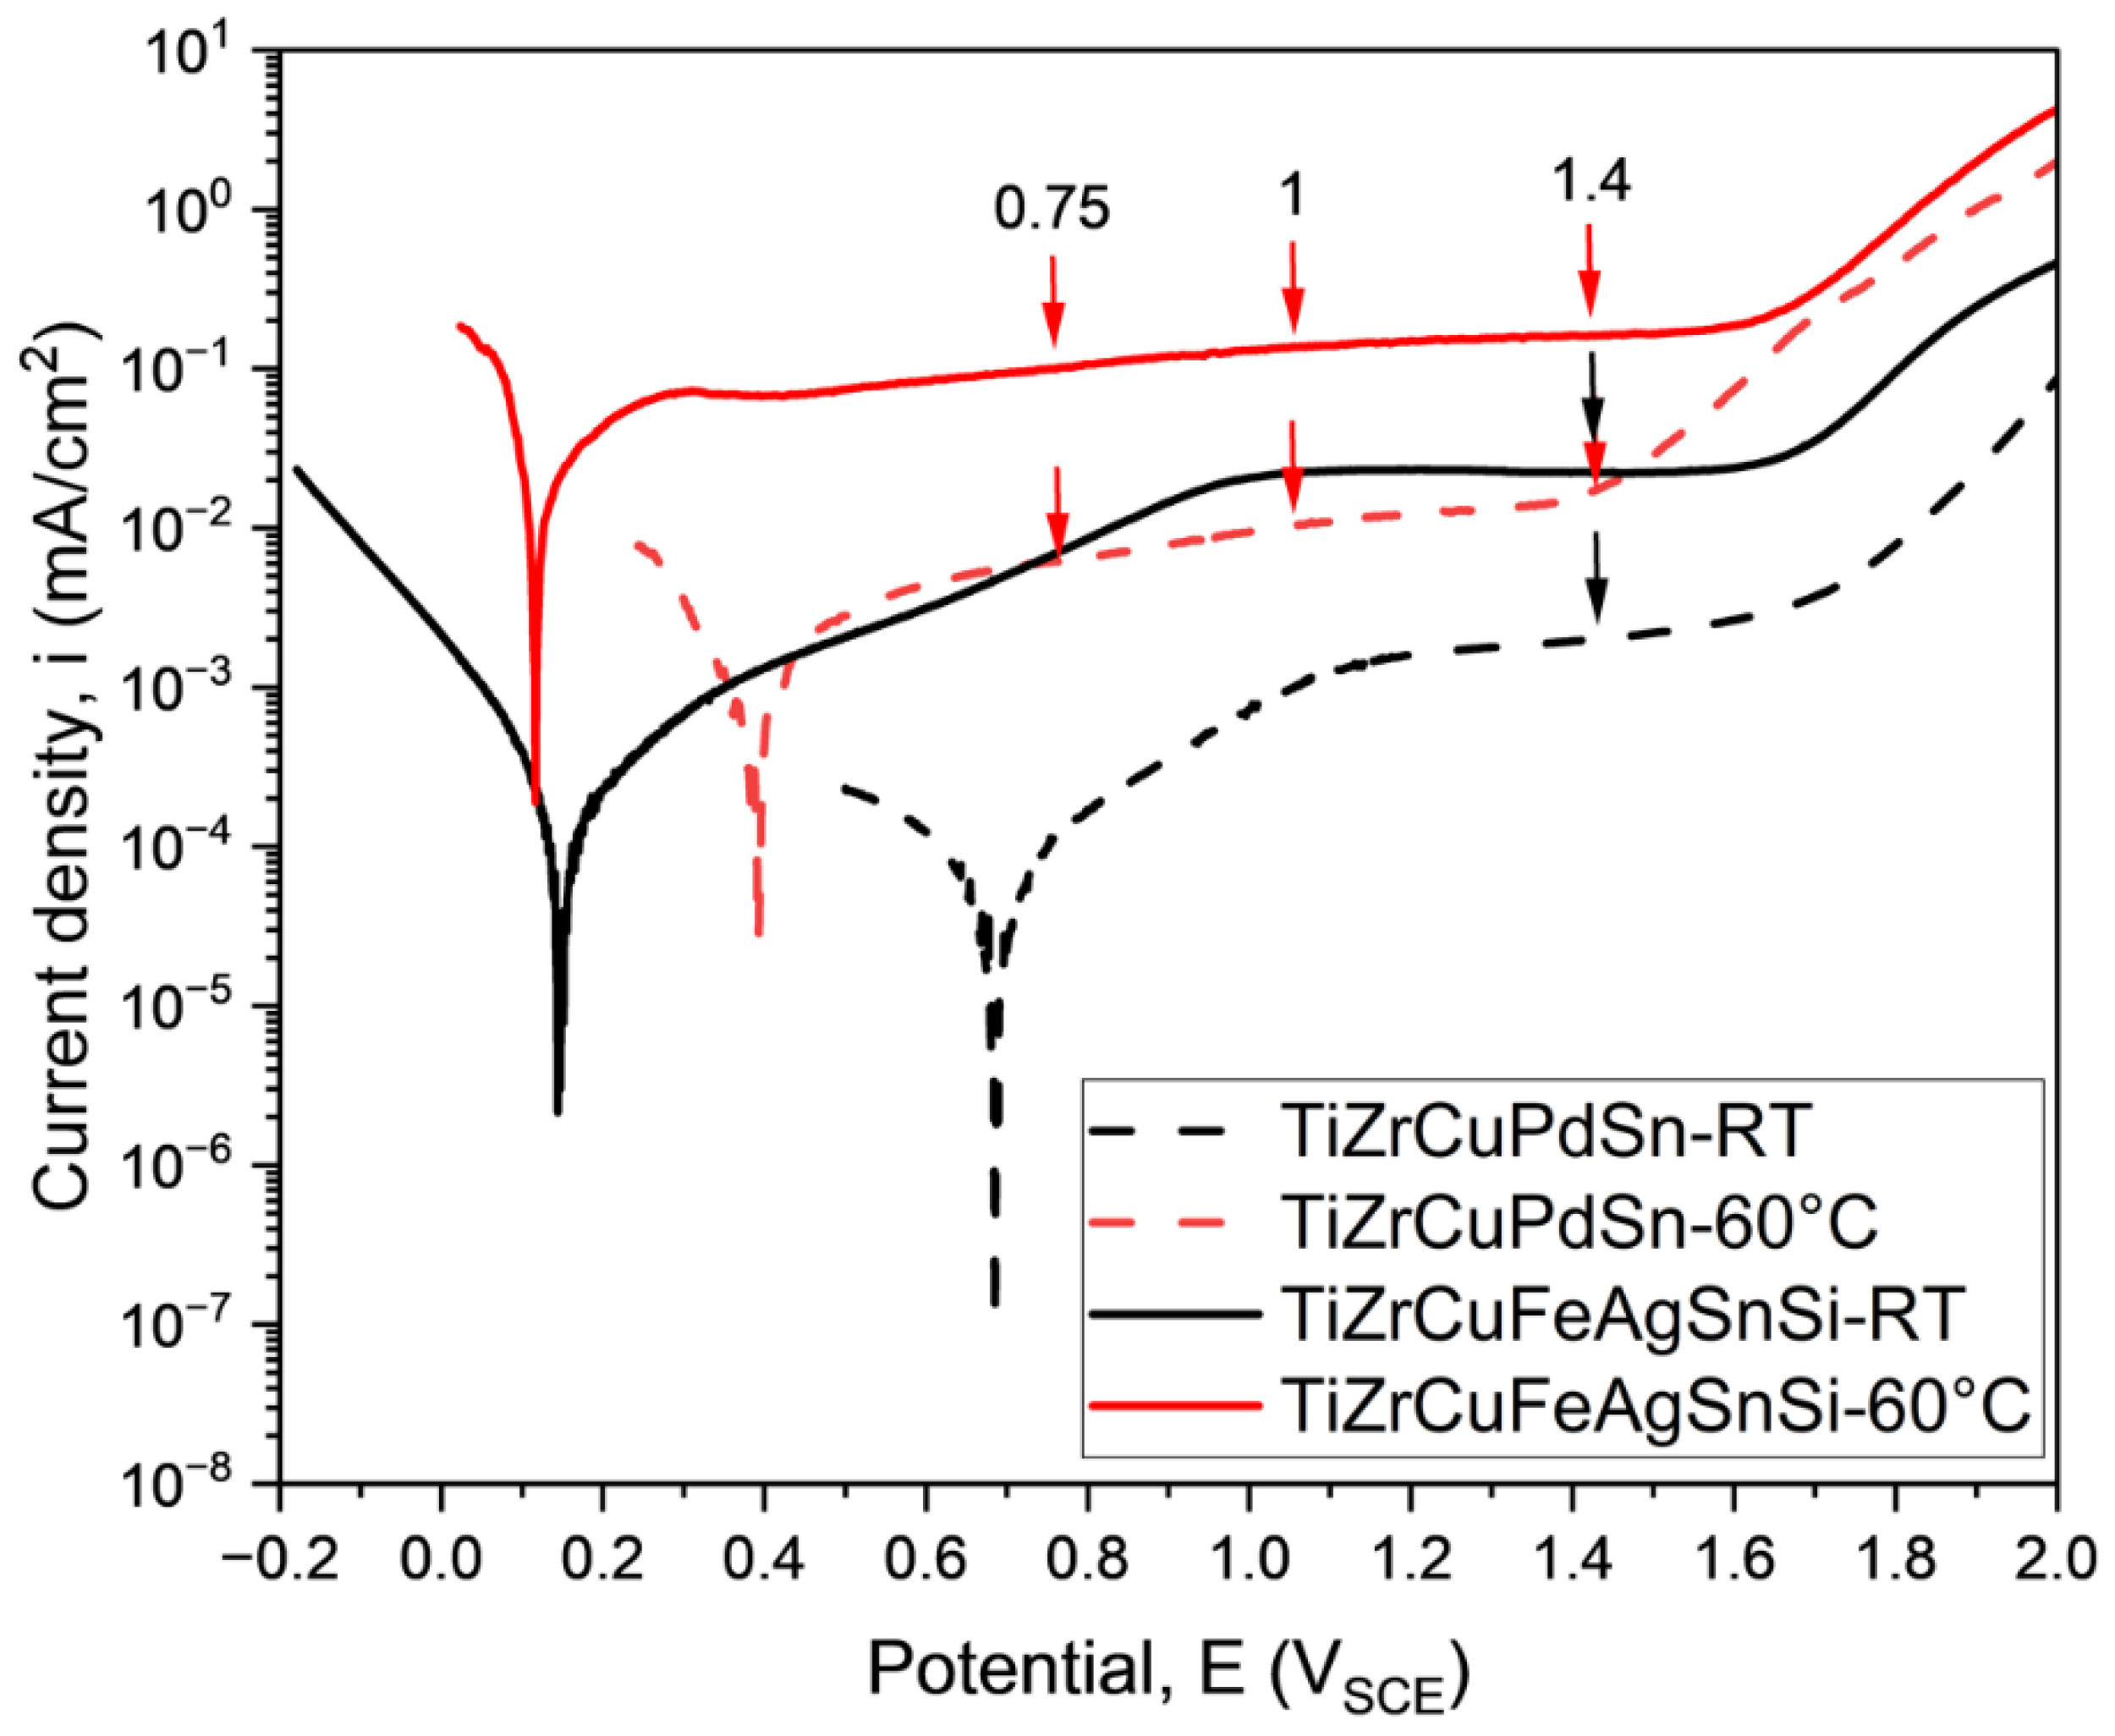
Figure 4.
FE-SEM images showing typical surface morphologies of glassy Ti47Zr7.5Cu38Fe2.5Sn2Si1Ag2 ribbon samples (air side) after potentiostatic treatments at RT, 1.4 V vs. SCE (a), and at 60 °C at 0.75 V vs. SCE (b) 1 V vs. SCE (c) and 1.4 V vs. SCE (d).
Figure 4.
FE-SEM images showing typical surface morphologies of glassy Ti47Zr7.5Cu38Fe2.5Sn2Si1Ag2 ribbon samples (air side) after potentiostatic treatments at RT, 1.4 V vs. SCE (a), and at 60 °C at 0.75 V vs. SCE (b) 1 V vs. SCE (c) and 1.4 V vs. SCE (d).
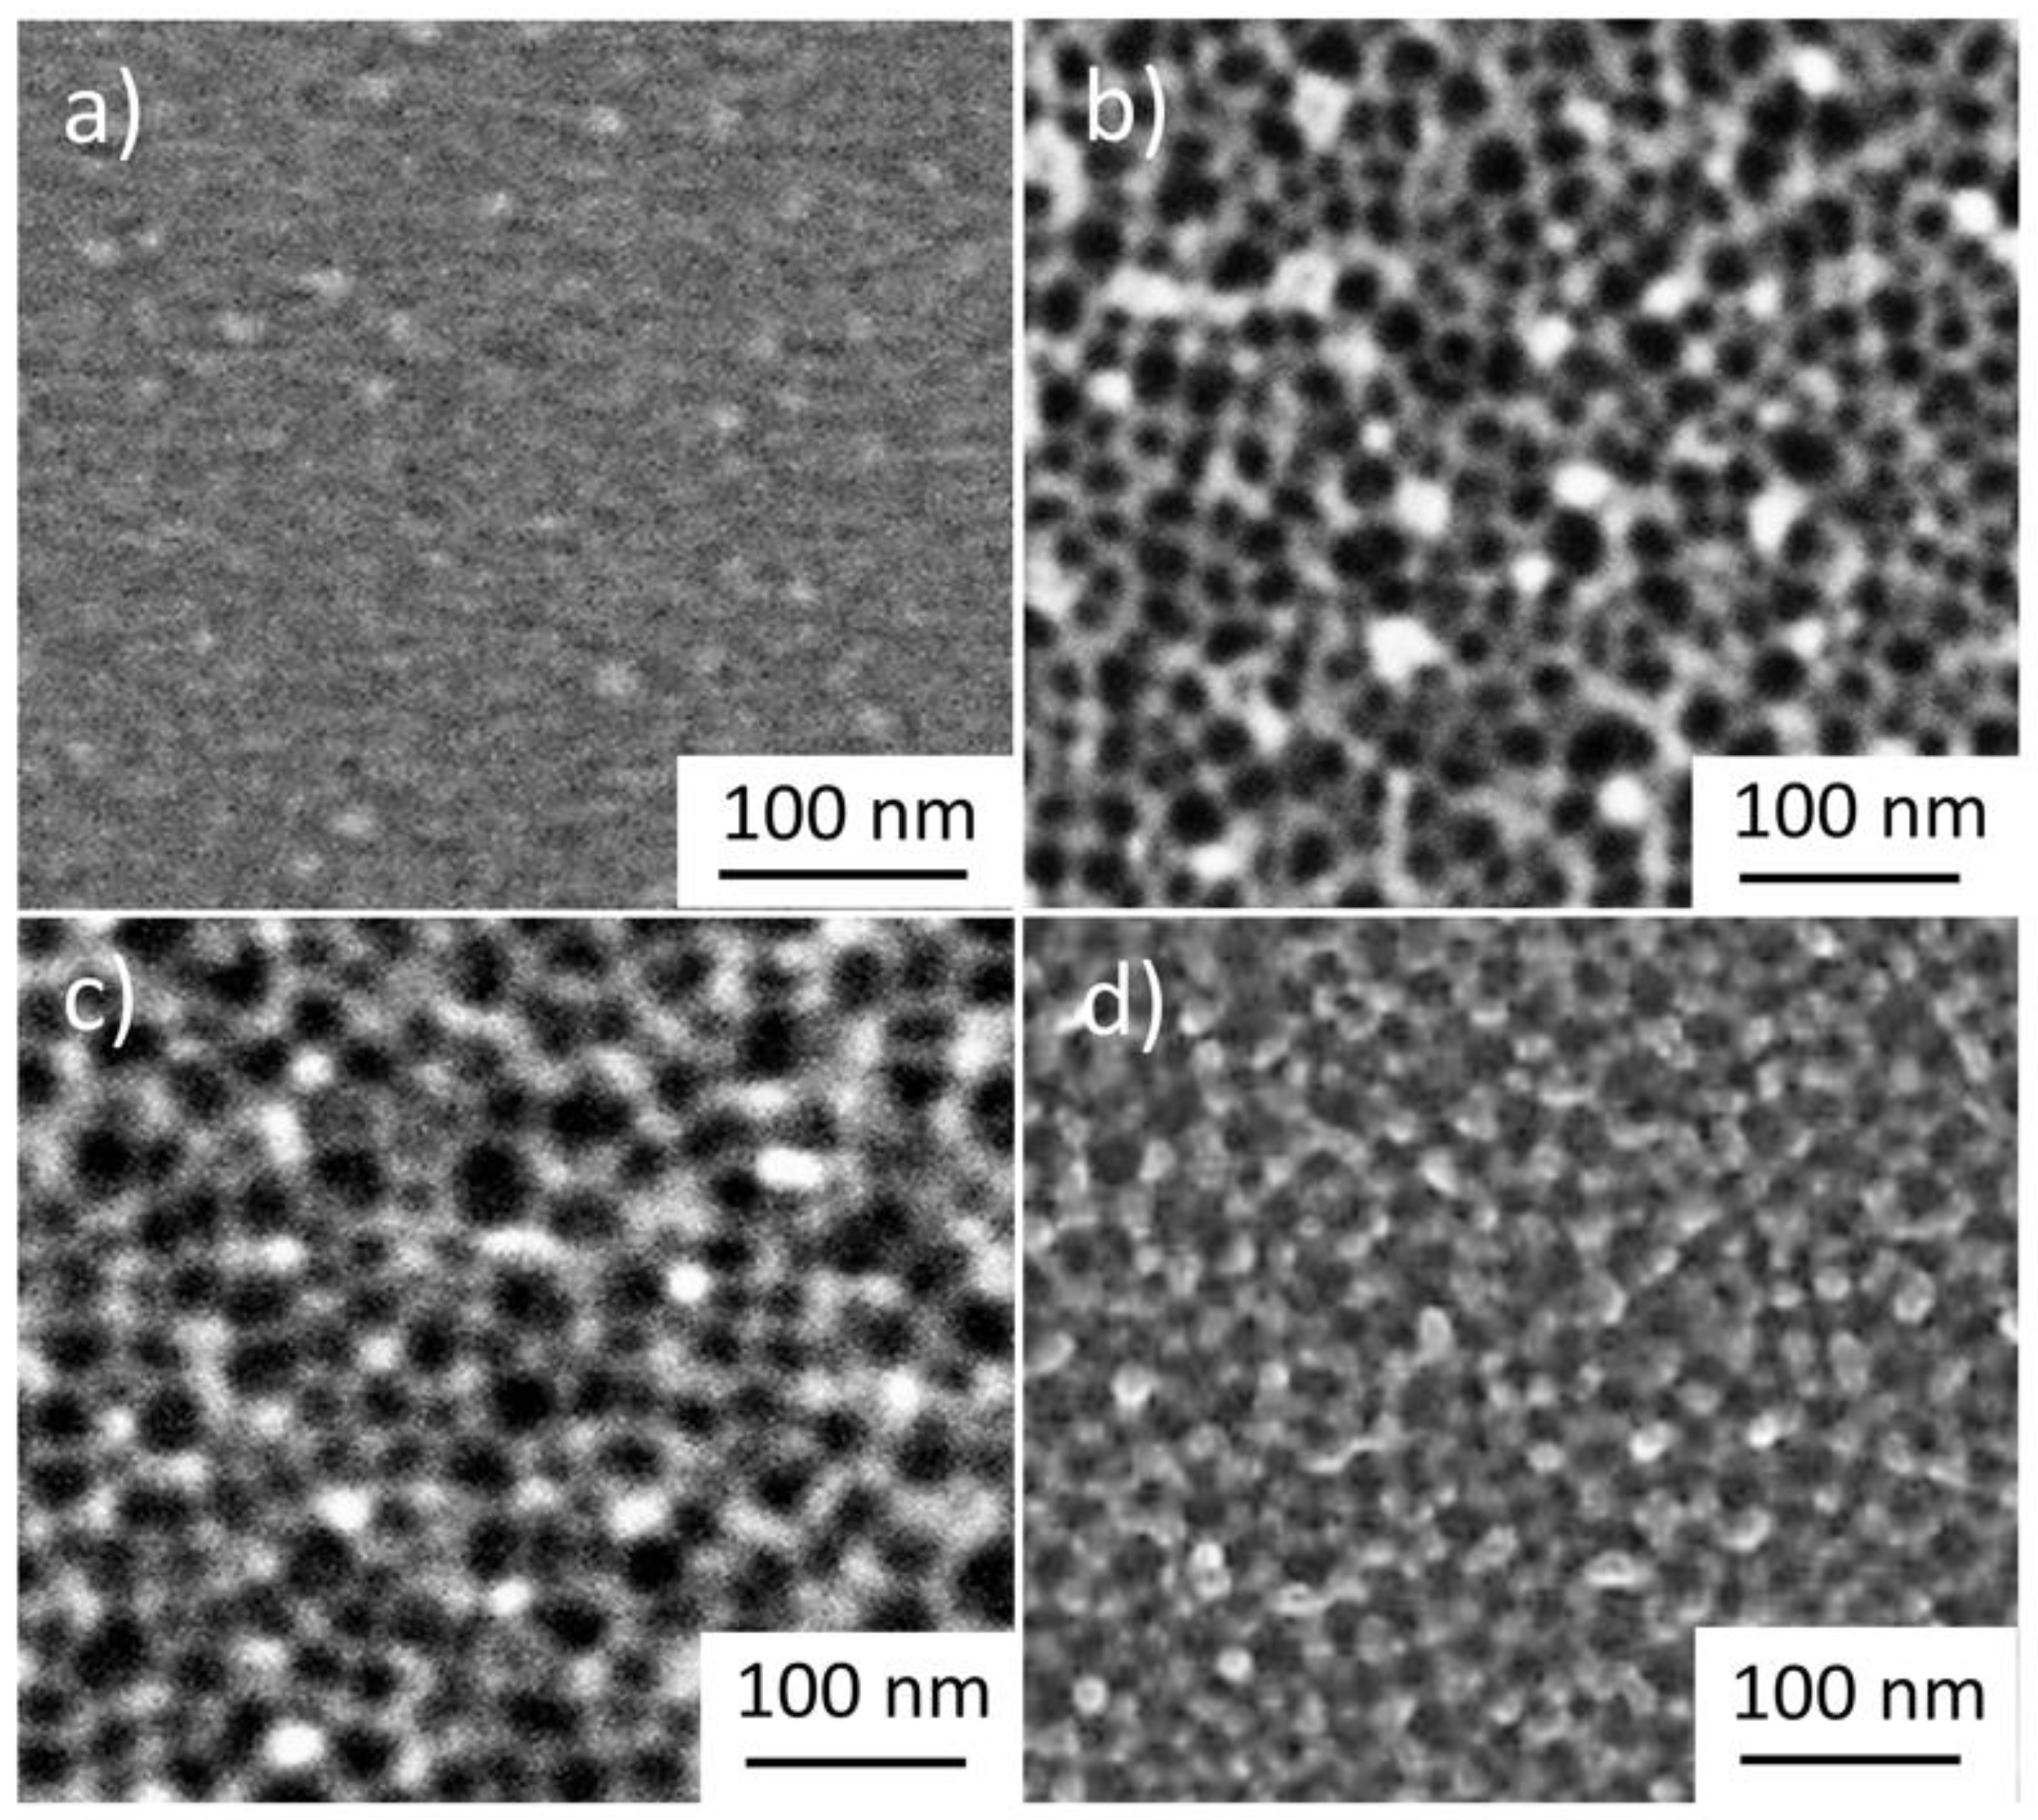
Figure 5.
FE-SEM images showing typical surface morphologies of glassy Ti40Zr10Cu34Pd14Sn2 ribbon samples (air side) after potentiostatic treatments at RT, 1.4 V vs. SCE (a), and at 60 °C at 0.75 V vs. SCE (b) 1 V vs. SCE (c) and 1.4 V vs. SCE (d).
Figure 5.
FE-SEM images showing typical surface morphologies of glassy Ti40Zr10Cu34Pd14Sn2 ribbon samples (air side) after potentiostatic treatments at RT, 1.4 V vs. SCE (a), and at 60 °C at 0.75 V vs. SCE (b) 1 V vs. SCE (c) and 1.4 V vs. SCE (d).

Figure 6.
AES sputter depth profiles showing the chemical surface composition of glassy Ti40Zr10Cu34Pd14Sn2 ribbon samples (air side) in the as-spun state (a) and after potentiostatic polarization treatments in 5 M HNO3 at 60 °C at 0.75 V vs. SCE (b) 1 V vs. SCE (c) and 1.4 V vs. SCE (d). Dashed vertical lines (a–d) indicate the depth extend of the oxide film, derived from the oxygen profile (sputter rate 6 nm/min (calibrated to SiO2)).

Figure 7.
Representative potentiodynamic polarization curves measured in PBS (pH 7.4) at 37 °C for Ti sheets in as-polished, air-aged states and glassy Ti47Cu38Zr7.5Fe2.5Sn2Si1Ag2 and Ti40Zr10Cu34Pd14Sn2 ribbon samples in as-spun state and after potentiostatic polarization treatment in 5 M HNO3 solution at 60 °C at 1 V vs. SCE for 60 min.
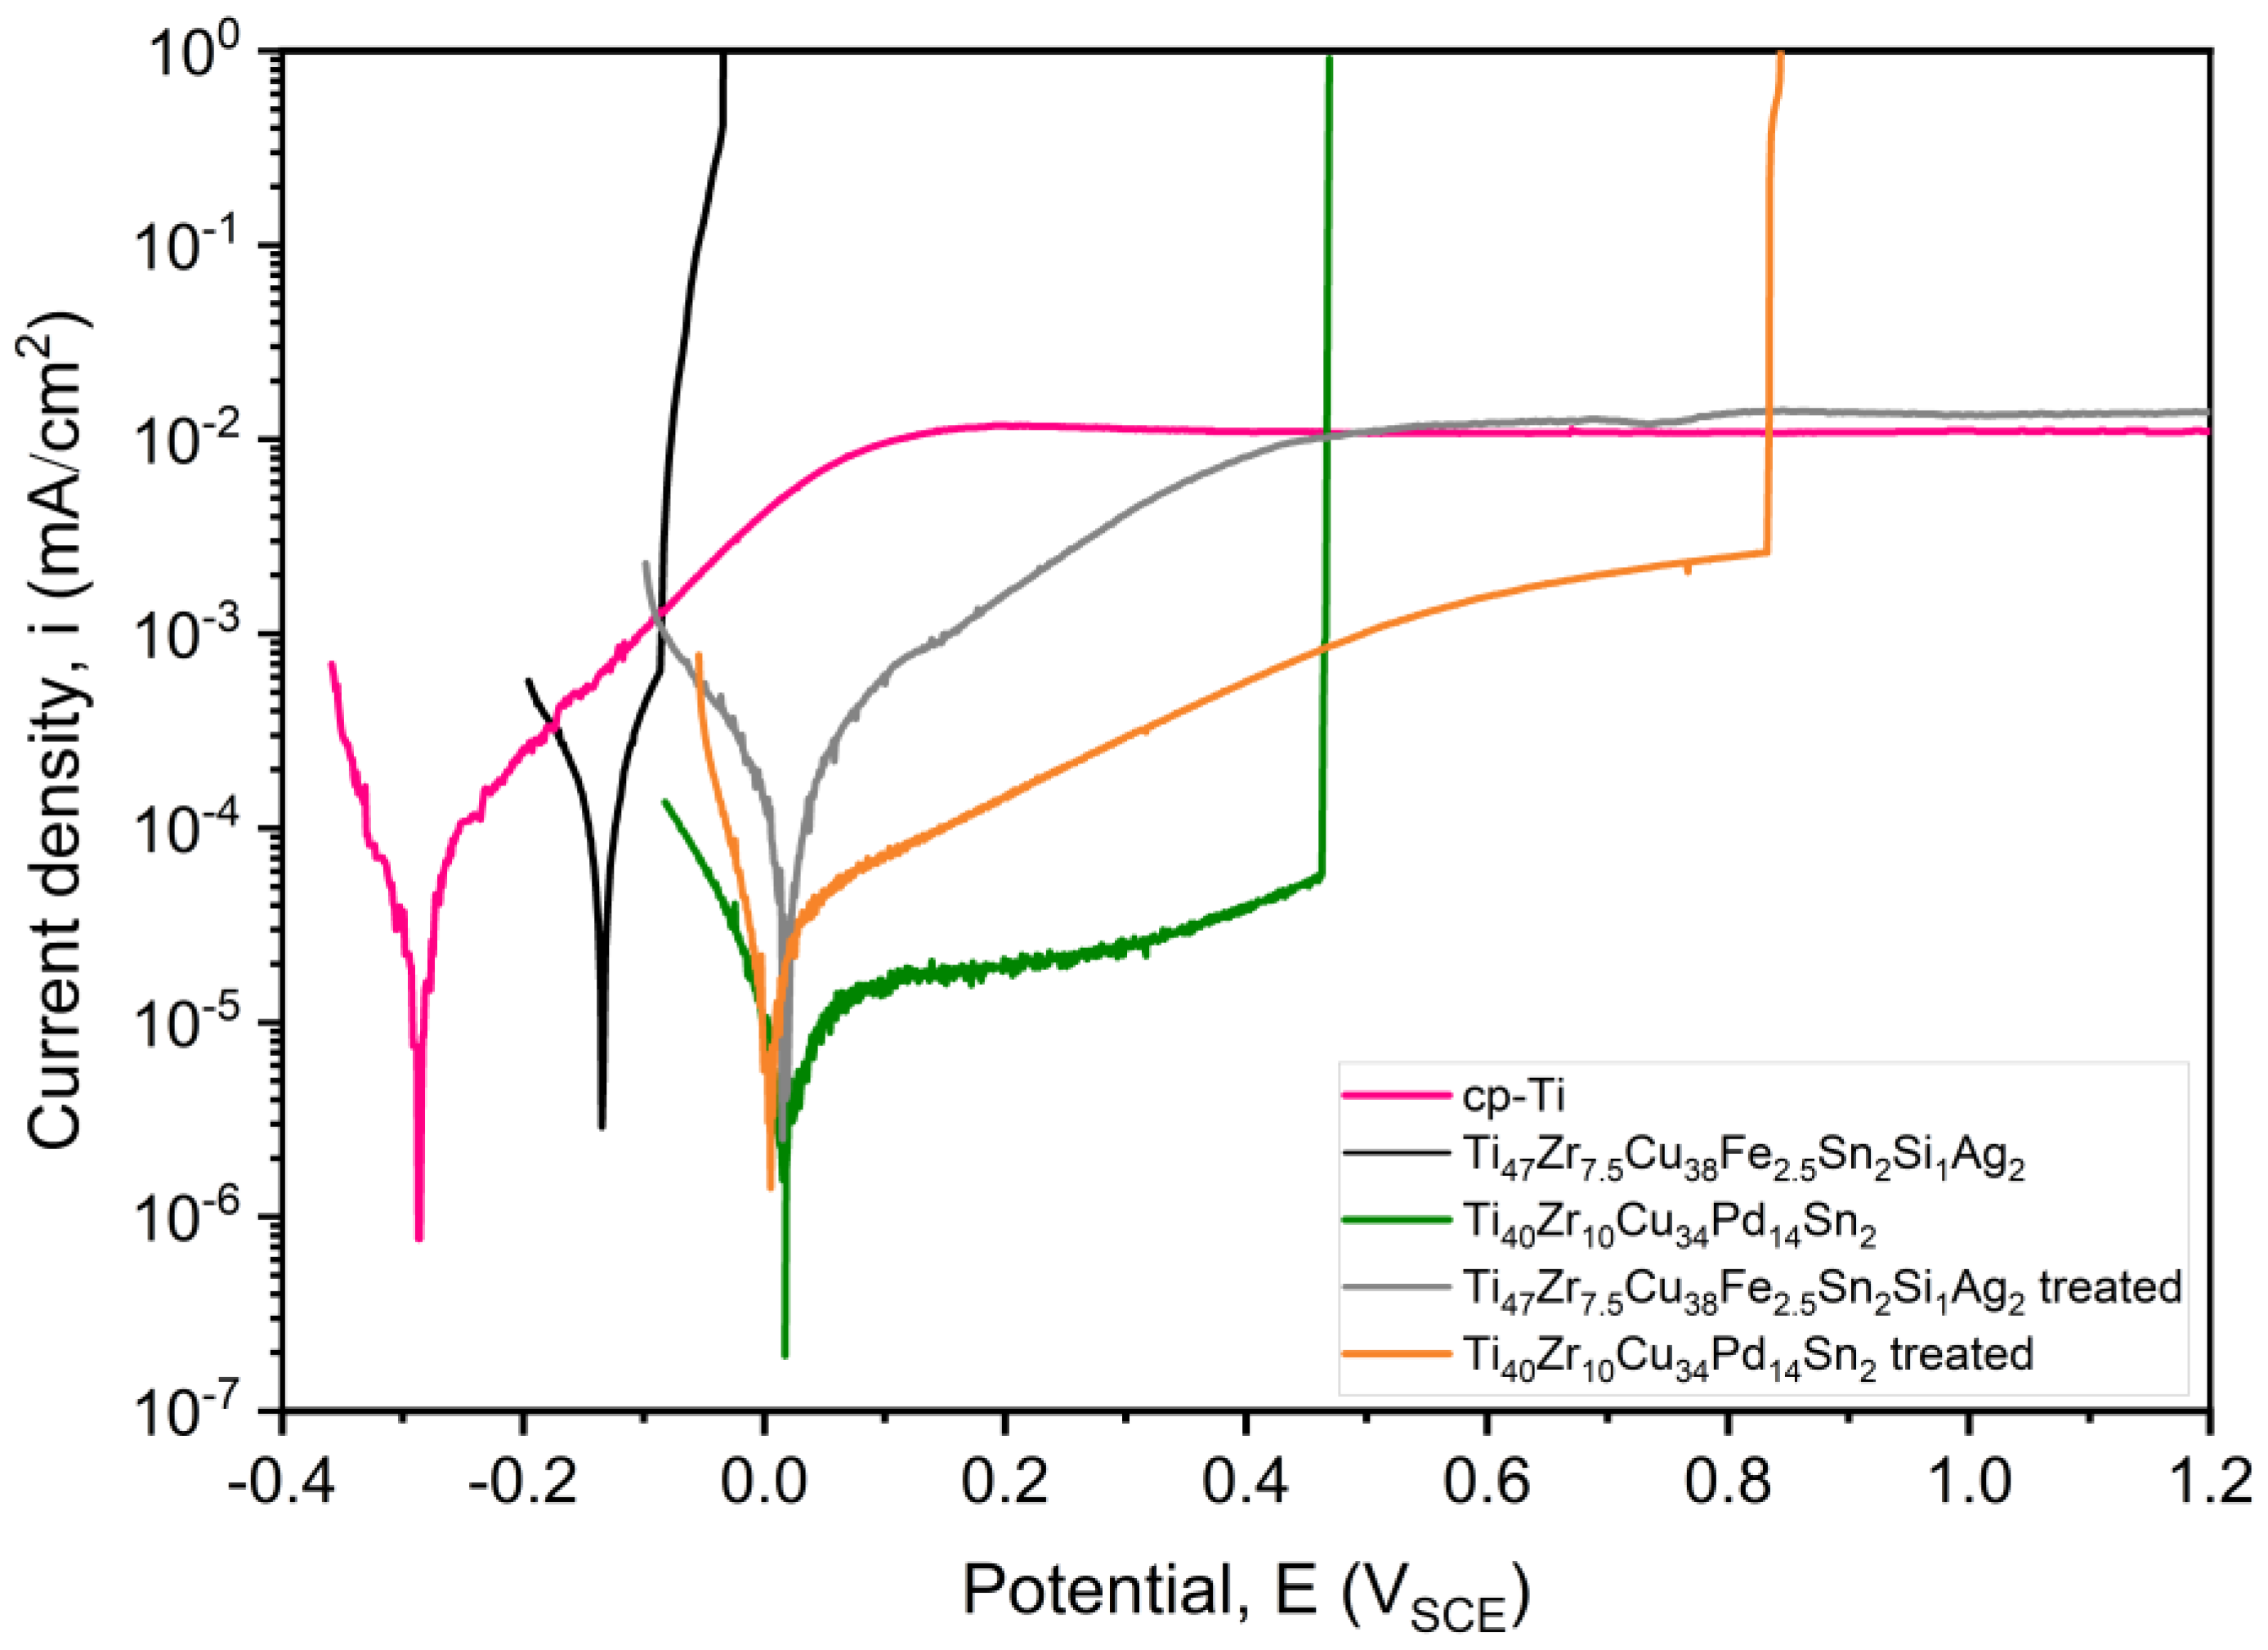
Figure 8.
SEM images of glassy alloy samples after potentiodynamic polarization in PBS (pH 7.4) at 37 °C: Ti47Cu38Zr7.5Fe2.5Sn2Si1Ag2 in the as-spun state (a) and after anodic treatment in 5 M HNO3 (60 °C) at 1 V vs. SCE for 60 min (b) and Ti40Zr10Cu34Pd14Sn2 in the as-spun state (c) and after anodic treatment in 5 M HNO3 (60 °C) at 1 V vs. SCE for 60 min (d). An inset of (d) is shown for better clarity of the pit morphology (e). Note the scale difference in (b).

Table 1.
Thermal properties (onset temperatures) of glassy Ti47Cu38Fe2.5Zr7.5Sn2Si1Ag2 and Ti40Zr10Cu34Pd14Sn2 ribbons from the DSC measurements in Figure 1b.
Table 1.
Thermal properties (onset temperatures) of glassy Ti47Cu38Fe2.5Zr7.5Sn2Si1Ag2 and Ti40Zr10Cu34Pd14Sn2 ribbons from the DSC measurements in Figure 1b.
| Tg (K) | Tx1 (K) | ΔTx (Tx − Tg) (K) | Tx2 | Tx3 | |
|---|---|---|---|---|---|
| Ti47Cu38Fe2.5Zr7.5Sn2Si1Ag2 | 645 ± 2 | 701 ± 2 | 56 ± 2 | 809 ± 1 | - |
| Ti40Zr10Cu34Pd14Sn2 | 686 ± 6 | 728 ± 2 | 54 ± 5 | 798 ± 3 | 828 ± 4 |
Table 2.
Summary of the electrochemical corrosion data (mean and error values from three different and independent tests), as determined from anodic polarization measurements in 5 M HNO3 at RT and 60 °C, exemplified in Figure 2.
Table 2.
Summary of the electrochemical corrosion data (mean and error values from three different and independent tests), as determined from anodic polarization measurements in 5 M HNO3 at RT and 60 °C, exemplified in Figure 2.
| Metallic Glass Composition | T /°C | Ecorr /V vs. SCE | icorr /A/cm2 | ianodic (1 V vs. SCE) /A/cm2 |
|---|---|---|---|---|
| Ti47Cu38Fe2.5Zr7.5Sn2Si1Ag2 | RT | 0.15 ± 0.01 | 0.11 ± 0.04 × 10⁻⁶ | 1.52 ± 0.27 × 10⁻⁵ |
| Ti47Cu38Fe2.5Zr7.5Sn2Si1Ag2 | 60 | 0.12 ± 0.01 | 32.40 ± 14.56 × 10⁻⁶ | 1.31 ± 0.03 × 10⁻⁴ |
| Ti40Zr10Cu34Pd14Sn2 | RT | 0.70 ± 0.01 | 0.03 ± 0.01 × 10⁻⁶ | 1.20 ± 0.14 × 10⁻⁶ |
| Ti40Zr10Cu34Pd14Sn2 | 60 | 0.43 ± 0.06 | 1.51 ± 1.06 × 10⁻⁶ | 1.22 ± 0.26 × 10⁻⁵ |
Table 3.
Summary of the electrochemical corrosion data (mean and error values from three different and independent tests), as determined from anodic polarization measurements in PBS solution at 37 °C, exemplified shown in Figure 7: (open circuit potential after 30 min (OCPend), corrosion current density (icorr), corrosion potential (Ecorr), average passive current density (ipass), pitting potential (Epit).
| Material | OCPend/ V vs. SCE | icorr/ A/cm2 | Ecorr/ V vs. SCE | ipass/ A/cm2 | Epit/ V vs. SCE |
|---|---|---|---|---|---|
| cp-Ti, polished, air aged | −0.412 ± 0.014 | 0.25 ± 0.16 × 10⁻⁷ | −0.283 ± 0.122 | 1.52 ± 0.40 × 10⁻⁵ | - |
| Ti47Cu38Zr7.5Fe2.5Sn2Si1Ag2 as-spun, air-aged | −0.128 ± 0.016 | 0.31 ± 0.22 × 10⁻⁷ | −0.128 ± 0.008 | - | −0.054 ± 0.030 |
| Ti40Zr10Cu34Pd14Sn2 as-spun, air-aged | 0.058 ± 0.041 | 0.09 ± 0.02 × 10⁻⁷ | 0.017 ± 0.005 | 1.95 ± 0.61 × 10⁻⁸ | 0.462 ± 0.025 |
| Ti47Cu38Zr7.5Fe2.5Sn2Si1Ag2 treated | −0.017 ± 0.045 | 0.23 ± 0.16 × 10⁻⁷ | 0.003 ± 0.012 | 1.17 ± 0.19 × 10⁻⁵ | - |
| Ti40Zr10Cu34Pd14Sn2 treated | 0.076 ± 0.035 | 0.18 ± 0.06 × 10⁻⁷ | 0.054 ± 0.025 | 2.56 ± 0.42 × 10⁻⁶ | 0.732 ± 0.024 |
Disclaimer/Publisher’s Note: The statements, opinions and data contained in all publications are solely those of the individual author(s) and contributor(s) and not of MDPI and/or the editor(s). MDPI and/or the editor(s) disclaim responsibility for any injury to people or property resulting from any ideas, methods, instructions or products referred to in the content. |
© 2024 by the authors. Licensee MDPI, Basel, Switzerland. This article is an open access article distributed under the terms and conditions of the Creative Commons Attribution (CC BY) license (https://creativecommons.org/licenses/by/4.0/).
Share and Cite
MDPI and ACS Style
Fernández-Navas, N.; Shtefan, V.; Hantusch, M.; Gebert, A. Acid Treatments of Ti-Based Metallic Glasses for Improving Corrosion Resistance in Implant Applications. Metals 2024, 14, 241. https://doi.org/10.3390/met14020241
AMA Style
Fernández-Navas N, Shtefan V, Hantusch M, Gebert A. Acid Treatments of Ti-Based Metallic Glasses for Improving Corrosion Resistance in Implant Applications. Metals. 2024; 14(2):241. https://doi.org/10.3390/met14020241
Chicago/Turabian StyleFernández-Navas, Nora, Viktoriia Shtefan, Martin Hantusch, and Annett Gebert. 2024. "Acid Treatments of Ti-Based Metallic Glasses for Improving Corrosion Resistance in Implant Applications" Metals 14, no. 2: 241. https://doi.org/10.3390/met14020241
Note that from the first issue of 2016, this journal uses article numbers instead of page numbers. See further details here.