
Machine Learning Design for High-Entropy Alloys: Models and Algorithms


Shanghai Key Lab of Advanced High-Temperature Materials and Precision Forming, School of Materials Science and Engineering, Shanghai Jiao Tong University, Shanghai 200240, China
*
Author to whom correspondence should be addressed.
Metals 2024, 14(2), 235; https://doi.org/10.3390/met14020235
Submission received: 23 January 2024
/
Revised: 12 February 2024
/
Accepted: 13 February 2024
/
Published: 15 February 2024
(This article belongs to the Special Issue Light Alloys and Composites)
Abstract
:High-entropy alloys (HEAs) have attracted worldwide interest due to their excellent properties and vast compositional space for design. However, obtaining HEAs with low density and high properties through experimental trial-and-error methods results in low efficiency and high costs. Although high-throughput calculation (HTC) improves the design efficiency of HEAs, the accuracy of prediction is limited owing to the indirect correlation between the theoretical calculation values and performances. Recently, machine learning (ML) from real data has attracted increasing attention to assist in material design, which is closely related to performance. This review introduces common and advanced ML models and algorithms which are used in current HEA design. The advantages and limitations of these ML models and algorithms are analyzed and their potential weaknesses and corresponding optimization strategies are discussed as well. This review suggests that the acquisition, utilization, and generation of effective data are the key issues for the development of ML models and algorithms for future HEA design.
1. Introduction
The concept of high-entropy alloys (HEAs) has been raised by Cantor [1] and Yeh [2] since 2004. HEAs usually consist of four or five elements with atomic percentages (at.%) that are equal or nearly equal. Usually, the atomic fraction of each component is greater than five percent [3]. Their configurational entropy of mixing is high which is beneficial for the formation of the solid-solution phase [4]. They mainly possess Face-Centered Cubic (FCC), Body-Centered Cubic (BCC), and Hexagonal Close-Packed (HCP) structures [5]. Unlike conventional alloys, the complex compositions of HEAs lead to exceptional effects. HEAs usually exhibit outstanding physical and chemical properties, i.e., high mechanical properties, superior fatigue and wear resistance, good ferromagnetic and superparamagnetic properties, and excellent irradiation and corrosion resistance, etc. [6,7,8,9,10]. Using optimized composition design, a lighter density and better performance of HEAs can be obtained to achieve the purpose of lightweight HEAs [7]. However, due to the flexible compositions and ample performance tuning space, obtaining HEAs with low density and high properties solely through experimental trial-and-error methods requires a substantial investment of time and labor, resulting in low efficiency and high costs.
In recent years, the use of a computer-assisted design method has made significant progress in the field of HEAs. High-throughput calculation (HTC) is one promising computer-assisted design method, which is characterized by concurrent calculations and an automated workflow, enabling efficient computations for tasks at a high scale, rather than sequentially processing multiple tasks [11]. It initially focuses on the quantum scale, effectively meeting the demand for expediting the discovery of new materials and exceptional performance. In recent years, the concept of HTC has been applied to micro-thermodynamic scales, becoming a rapid method for obtaining phase information in metal structural materials [12]. High-throughput first-principles calculations and thermodynamics calculations are two main technologies of the HTC methods. High-throughput first-principles calculations, which do not rely on empirical parameters, can predict material property data by inputting element types and atomic coordinates [13]. They play an indispensable role in understanding and designing target materials from a microscopic perspective and enable the quantitative prediction of composition optimization, phase composition, and the structure–property relationship of materials. High-throughput first-principles calculations demonstrate specific roles and advantages for three aspects of HEAs: (1) the accurate construction of long-range disordered and short-range ordered structures; (2) the precise prediction of the stability of HEA phases; (3) the accurate calculation of the mechanical properties of HEAs [14]. The process of screening HEAs based on high-throughput thermodynamics calculations combines equilibrium calculations with non-equilibrium Scheil solidification calculations [15]. Using high-throughput calculation to predict the melting point, phase composition, and thermodynamic properties of HEAs after processing, it rapidly obtains the alloy composition space that satisfies criteria such as the melting point and phase volume fraction [16]. This assists in the quick analysis of effective alloy compositions, reducing the frequency of experimental trial and error. High-throughput thermodynamics calculations demonstrate specific functions and advantages in three ways: (1) the accurate acquisition of the phase diagrams and thermodynamic properties of HEAs; (2) the rapid retrieval of key microstructural parameters for HEAs; (3) the implementation of cross-scale analysis [12]. However, HTC technology mainly uses the theoretical calculation values such as phases, melting points, and various energies as data sources. Although the amount of data used in HTC calculation is huge, the direct correlation with the performance of HEAs and the accuracy of performance prediction are far from satisfactory. Therefore, the current HTC method can only be used as a reference criterion for HEA design. A certain number of experiments are still needed to verify the accuracy of the HTC design results.
In the past decade, the rapid ascent of artificial intelligence (AI) has brought a transformative revolution [17]. This revolution has not only fundamentally reshaped various domains of computer science, including computer vision and natural language processing, but has also made a significant impact on numerous scientific fields, including materials science. AI success comes from its ability to comprehend complicated patterns, and these complicated AI models and algorithms can be systematically refined through learning from real data, which is closely related to performance [18]. This capability is further enhanced by the availability of computational resources, efficient algorithms, and substantial data collected from experiments or simulations. The exponential increase in relevant publications is indicative of this trend. In essence, with a sufficiently large dataset of high quality, AI can effectively capture the intricate atomic interactions through standard procedures of training, validation, and testing [19]. Additionally, AI models and algorithms can identify non-linear structure–property relationships, which are challenging to determine through human observation [20]. These attributes position AI as an effective tool to tackle the challenges associated with the theoretical modeling of materials [21]. Machine learning (ML) is one of the most important technologies used for the AI design of materials [22]. This method, based on comprehensive experimental and theoretical studies, enables rapid data mining, revealing underlying information and patterns, and accurately predicting material properties for target material selection [23]. However, a small number of datasets becomes a key issue in HEA design, leading to high requirements for accuracy and the generalization ability of ML models and algorithms. This review aims to provide assistance for in-depth ML models and algorithms and their optimization strategies for HEA design by summarizing and sorting out the current research.
2. Machine Learning (ML) in HEA Design
ML is a multidisciplinary field involving probability theory, statistics, approximation theory, and algorithmic complexity theory [24]. The concept of ML, first introduced by Samuel in 1959, has evolved into a cross-disciplinary field spanning computer science, statistics, and other fields. Due to its efficient computational and predictive capabilities, ML has been gradually applied in materials science research [25]. In recent years, ML has gained widespread attention and demonstrated outstanding capabilities in the development of new materials and the prediction of material properties in the field of materials science [26]. A notable example is the 2016 article published in Nature, titled “Machine-learning-assisted materials discovery using failed experiments”, which successfully predicted chemical reactions and the formation of new compounds by mining a large dataset of failed experimental data, further fueling the momentum of research related to the application of ML to materials [27].
With an in-depth understanding of the concept of materials engineering, ML has found extensive applications in the design, screening, and performance prediction and optimization of materials [28]. Data-driven methods significantly expedite the research and development process, reducing time and computational costs. Whether on the micro or macro scale, this approach can be applied to new material discovery and the prediction of material properties in the field of materials science.
The discussion on the rules of phase formation has always accompanied the research on HEAs. The role of phases has been crucial in the design of HEAs. In the design strategy of HEAs, predicting the composition and phase stability of unknown alloy components is an essential aspect [29]. Widely used descriptors for phase prediction include entropy of mixing, enthalpy of mixing, elastic constants, melting temperature, valence electron concentration, electronegativity, etc. [30]. As research advances, the development involves utilizing differentiating alloy elemental contents as inputs or various combinations of the intrinsic properties of monatomic elements such as their physical and mechanical features. Examples of these features include atomic radius difference, valence electron count, configuration entropy, mixing enthalpy, etc. By directly modeling, relationships between the element combinations and phase formation can be obtained.
Besides phase formation, exploring the relationship between the compositions and properties of HEAs is also an essential task. By establishing a correlation model between feature parameters and properties such as strength, it is possible to achieve the rapid prediction of material performance based on chemical composition. This method, supplemented by a substantial amount of experimental data, offers valuable guidance for alloy composition design.
3. Common ML Models and Algorithms in HEA Design
So far, commonly used ML models and algorithms in HEA design include neural networks (NNs) [31,32,33,34,35,36,37,38,39,40,41,42,43], support vector machine (SVM) [44,45,46,47,48,49,50,51,52,53,54], Gaussian process (GP) [36,55,56,57,58,59,60,61], k-nearest neighbors (KNN) [62,63,64,65,66], and random forests (RFs) models and algorithms [67,68] etc.
3.1. Neural Networks (NNs)
NNs are computational models and algorithms inspired by the structure of the human brain [69]. The basic units of a NN are neurons, which simulate the connections and information transmission between biological neurons [70]. They are organized into layers such as the input layer, hidden layer, and output layer [71]. Each neuron receives inputs from neurons in the previous layer, applies weights to these inputs, and then produces an output through an activation function [72]. This output serves as the input for neurons in the next layer. By adjusting the weights of connections, the NNs can learn and adapt to patterns in the input data, enabling it to perform tasks such as learning and prediction. NNs have achieved significant success in areas such as image recognition, natural language processing, and speech recognition, demonstrating powerful performance in various applications. However, the data requirement of NN models and algorithms is huge.
J. Wang et al. [73] developed ensemble NN models and algorithms to test input data in order to design HEAs with a higher yield strength (YS) and ultimate tensile strength (UTS) (see Figure 1). They collected 501 data points from previous studies to be used for NN model training and validation. The data include the chemical composition, process conditions, and tensile mechanical properties of HEAs. The basic models and algorithms included in their experiment are the simple deep neural network (DNN) and the concatenated DNN and conventional neural network (CNN) model. They performed an inverse prediction and selected a random search and designed two HEAs, HEA1 and HEA2. The results are measured using multiple tensile tests. The results show that the combinations of the UTS and total elongation (T.EL.) of the present HEAs are better than the input data, as well as the HEAs from previous ML studies. This research demonstrated the effectiveness of the model in HEA design. This alloy design approach, specialized in finding multiple local optima, could help researchers design an infinite number of new alloys with interesting properties.
3.2. Support Vector Machine (SVM) Algorithm
In the ML model, the SVM algorithm has a good decision boundary [74]. The SVM algorithm was introduced by VaPnik as a supervised learning method falling under the category of binary classification models [75]. Its primary objective is to identify a separation hyperplane in the feature space that maximizes the margin, ensuring the correct classification of samples. This process is eventually transformed into a convex optimization problem. The segmentation principle of the SVM algorithm revolves around maximizing the interval. The SVM algorithm demonstrates significant advantages in addressing non-linear, high-dimensional, and small-sample problems [76]. Originally applied to linear classification, the SVM algorithm was later extended to handle non-linear examples and was further adapted for high-dimensional spaces [77]. It can also solve the problem of overfitting.
In the research of W. Zhang et al. [78], to elucidate the varying prediction accuracies of a singular characteristic parameter within amorphous alloys (AM), solid-solution alloys (SS), and high-entropy alloys containing intermetallic compounds (IM), three approaches were introduced. The first involves qualitatively explaining the high or low prediction accuracies of characteristic parameters in the three types of AM, SS, and HEA-IM alloys by employing a simple division across the entire range of the characteristic parameter. They chose the SVM algorithm as a predictive model and used atomic size difference (δ), mixing enthalpy (), electronegativity difference (Δχ) and mixing entropy () as descriptors. Figure 2 illustrates the 4 × 4 scatter matrix representing the data distribution, aiding in comprehending the relationship among various features of the data [28]. In Figure 2, the correlation degree between 330 data points and four features is depicted. The diagonal scatter plot reveals the association between a single feature and the phase distribution, suggesting that a lone feature is insufficient for distinguishing phases. This is also the reason why the past research on phase prediction with a single feature has been ineffective. In the scatter plot involving two features, the distinct distribution of various features indicates their influence on the phase formation. Considering the average prediction accuracies of the four parameters, δ and exhibit higher accuracies, whereas and Δχ show lower accuracies. However, the prediction accuracies of Δχ in SS and HEA-IM alloys are the highest, reaching values of 83.1% and 72.0%, respectively, which are shown in Figure 3. On the other hand, the parameter demonstrates the lowest prediction accuracies for AM, SS, and HEA-IM alloys, with values of 73.9%, 66.5%, and 65.3%, respectively.
In addition to W. Zhang, Nguyen et al. [79] also conducted research on SVM prediction. They employed the SVM method with hyperparameter tuning and the use of weighted values for the prediction of the alloy’s phase. They wrote a Python program to create a multi-principal element alloy (MPEA) and HEA dataset. Search operations are conducted to optimize the SVM hyperparameters. Finally, cross-validation is used to evaluate the accuracy of the prediction models utilizing the SVM algorithm with the optimized hyperparameters. In addition, they compared their SVM solution with the artificial neural networks (ANN) method, demonstrating that the SVM approach outperforms or is comparable to alternative methods employing the ANN method. Through experimental validation, they showed that incorporating the average melting point and standard deviation of melting point variables into the original dataset can enhance the prediction accuracy for MPEAs and HEAs. The conclusion drawn is that accurately predicting the structure of alloys contributes to an efficient search for new materials, providing feasible candidate materials for various applications that require materials with specific phases. Consequently, combining the SVM method with other ML algorithms is worthwhile for predicting the phases of MPEAs.
The above studies collectively demonstrate the superiority of using the SVM model for predicting and designing HEAs. In comparison to other ML models and algorithms, the SVM model proves to be more effective in handling multi-parameter issues, providing significant assistance in the design of HEAs.
3.3. Gaussian Process (GP) Model
The Gaussian process (GP) model is a statistical model that defines a distribution over functions, embodying a collection of random variables where any finite subset exhibits a joint Gaussian distribution [80]. Within the realm of ML, GP models find extensive application in regression, classification, and optimization tasks [81]. The fundamental concept underlying GP models is the representation of functions as random variables, characterized by a mean function and a covariance function. The mean function delineates the expected value of the function at each point, while the covariance function captures interdependencies between distinct points in the input space.
Tancret et al. [36] design HEAs employing GP statistical analysis (see Figure 4). The datasets include 322 alloys reported in the literature. In the realm of HEA design, the solitary application of any single method proves insufficient for the dependable prediction of a singular solid-solution formation. Rather, a robust strategy is introduced, grounded in a critical evaluation of existing criteria and a statistical analysis leveraging GP models. This innovative approach concurrently considers a multitude of previously proposed criteria, providing a comprehensive method for predicting the emergence of a single solid solution. Thus, it stands as an invaluable guide for the design of novel HEAs.
3.4. K-Nearest Neighbors (KNN) Model
The k-nearest neighbors (KNN) model is a machine learning model used for classification and regression tasks [82]. In the context of this study, the KNN model is employed to predict mechanical properties, specifically tensile strength and hardness [83]. The KNN model operates based on the principle of similarity [84]. Given a new data point, the algorithm identifies the ‘k’ nearest data points from the training dataset in the feature space. The prediction for the new data point is then determined by the average or weighted average of the outcomes of its k-nearest neighbors [85].
Raheleh et al. [65] employed a graph-based KNN approach to predict the phase of HEAs (see Figure 5). Each HEA compound has its distinct phase, falling into five categories: FCC, BCC, HCP, multiphase, and amorphous. A composition phase signifies a material state with a specific energy level. The effectiveness of the phase prediction lies in determining the practical applications of the material. Within the network, each compound has neighboring counterparts, and the phase of a new compound can be predicted based on the phase of its most similar neighbors. The proposed approach was implemented on the HEA network. The experimental results demonstrate that the accuracy of this method in predicting the phase of new alloys is 88.88%, surpassing that of other machine learning methods.
3.5. Random Forests (RFs) Algorithm
The random forests (RFs) algorithm is a ML algorithm that belongs to the ensemble learning category, utilized for both classification and regression tasks [86]. It constructs multiple decision trees during the training phase and aggregates their predictions for robust and accurate results. The algorithm initiates the process by creating numerous bootstrap samples from the original dataset. Each sample is then employed to train an individual decision tree [87]. To introduce diversity and prevent overfitting, a random subset of features is considered at each node of the decision tree. After training the decision trees, the algorithm combines their predictions. For regression tasks, the final prediction is the average of the individual tree predictions [88]. In classification tasks, the mode of the predictions is considered. The RFs algorithm is renowned for its resilience, adaptability, and effectiveness in handling high-dimensional datasets [89]. It is particularly valuable due to its ability to mitigate overfitting compared to individual decision trees, contributing to enhanced predictive accuracy.
Krishna et al. [90] utilized a ML approach to predict the multiphase alloy system, characterized by a combination of solid-solution and intermetallic phases (SS + IM), using a dataset of 636 alloys (see Figure 6). In the investigation of the RF classifier, parameters are varied for n estimators, representing the number of trees in the forest, and maximum depth, ranging from the root node to the leaf node. The range for n estimators is set from 10 to 190 with a 20-unit interval, while the maximum depth varies from three to fourteen. It is determined that, for the current investigation, the optimal parameter values for n estimators are 50, with a maximum depth of 13. These parameter values yield an average cross-validation score of 0.788 based on a set of five cross-validation folds.
However, every model has both advantages and limitations. Four problems in the use of NNs in data modelling are overfitting, chance effects, overtraining, and interpretation [91]. Jack V. Tu draws a similar conclusion in his work [92] and depicts the typical relationship between the network error and training duration, as shown in Figure 7.
As training progresses, the network error gradually decreases until reaching a minimum in the training set. However, the error in the test set may initially decrease and then begin to rise as the network starts overfitting the training data. It is common practice among neural network developers to periodically cross-validate the network on the test set during training and to save the network weight configuration based on either of two criteria: (1) the network with the minimum error in the training set (point B in Figure 7) or (2) the network with the minimum error in the test set (point A in Figure 7). The latter technique is often used to prevent the network from overtraining and overfitting.
The weaknesses of the SVM algorithm include algorithmic complexity, inefficiency in multi-classification, and imbalanced datasets [93]. J. Cervantes et al. also show some of the approaches used to improve the training time of the SVM algorithm. Eliminating data that are less likely to be support vectors is a crucial step. In addition, it is more efficient to decompose the dataset into multiple chunks and optimize each chunk separately.
The limitation of the GP model is mainly the inefficiency in dealing with high-dimensional data and non-stationary data. The KNN model shows slow prediction on large-scale datasets. The RFs algorithm performs well on large-scale datasets but may perform poorly when dealing with highly correlated features [94]. All the advantages and limitations of these five models are shown in Table 1. Researchers need to select the appropriate model or combination of models based on the specific characteristics of the research subject.
In addition to the five ML models and algorithms above, some other common ML models and algorithms, such as principal component analysis (PCA) [95,96] and logistic regression (LR) [97], are used in design of HEAs as well. However, it should be pointed out that a large amount of high-quality data is still needed for the establishment and generalizing of the common ML models and algorithms. Advanced ML models and algorithms should be further explored.
4. Advanced ML Models and Algorithms in HEA Design
Recently, some ML models and algorithms with optimization strategies from underlying logical concepts have been raised up due to their high adaptability of small sample datasets, which are beneficial for HEA design. The active learning (AL) algorithm, the genetic algorithm (GA), the deep learning (DL) algorithm, and the transfer learning (TL) algorithm have achieved remarkable results in this field.
4.1. Active Learning (AL) Algorithm
The general idea of the AL algorithm [98] is to employ ML methods to identify samples that are challenging for classification. These samples are then subjected to human confirmation and review. Subsequently, the human-annotated data are reintegrated into the training process using supervised or semi-supervised learning models. This iterative process aims to progressively enhance the performance of the model by incorporating human expertise into the ML model. Compared to other ML methods, the AL algorithm excels in efficiently reducing data annotation costs [99]. Additionally, in scenarios characterized by class imbalance or label noise within the dataset, the AL algorithm can enhance data quality, enabling the model to focus more effectively on crucial samples for performance improvement, thereby enhancing the generalization capability of the model.
The framework of the AL algorithm has attained significant success in composition design and the performance prediction of HEAs. With the continuous influx of high-quality data, the effectiveness of AL models would be better. In addressing the challenge of simultaneously optimizing competing properties in machine learning-based material design, a constrained AL loop that incorporates domain knowledge was proposed by Li et al. [100] (see Figure 8). This approach aims to design high-entropy alloys with optimized strength and ductility by narrowing down the unexplored space using the valence electron concentration criterion. The active learning loop underwent six iterations, resulting in the synthesis of an alloy with an ultimate strength of 1258 MPa and an elongation of 17.3%. To uncover the underlying mechanism for synergistic optimization, the researchers characterized the phase structure and eutectic microstructure, delving into potential origins from the perspectives of strain hardening and crack initiation. The proposed framework, which integrates domain knowledge with machine learning, has the potential to facilitate the design of target materials with the coordinated optimization of competing properties. However, the most significant challenge that AL frameworks still face is the data source.
4.2. Genetic Algorithm (GA)
The GA, originating from computer-simulated studies of biological systems, is a stochastic global optimization method that emulates phenomena such as natural selection, replication, crossover, and mutation observed in genetics [101,102]. Starting from an initial population, the GA operates through random selection, crossover, and mutation operations to generate a group of individuals better suited to the environment [103]. This evolutionary process leads the population to progressively explore and converge toward more favorable regions within the search space. Iteration by iteration, the population undergoes continuous reproduction and evolution until it converges to a group of individuals that are most adapted to the environment, ultimately providing high-quality solutions to the problem at hand. This algorithm is widely adopted due to its global search capabilities and computational efficiency.
Moses et al. [104] conducted research to develop HEA powders with good control of grain-and-particle sizes (GPSs) for improved flowability (see Figure 9). First, the optimal process control agent type is determined through experimental exploration. Subsequently, a Taguchi experimental design is employed to plan and investigate the impact of parameters on the response variables and GPSs. This is followed by the development of a regression model to create predictive process models, and finally, the implementation of multi-objective optimization using a GA. Both grain size and particle size are simultaneously treated as optimization objectives. The simultaneous optimization of multiple objectives poses a significant challenge in genetic algorithms, as objectives typically conflict with each other. Consequently, multi-objective optimization problems often involve trade-offs. For example, increasing the milling speed to reduce the grain size could concurrently increase particle size, when finer particle sizes are desirable. The curve showing this optimal trade-off solution between objectives is recognized as the Pareto front. The Pareto front is a set of non-dominated solutions where each objective is considered equally favorable. The results obtained from the genetic algorithm align well with those from the Taguchi optimization.
Menou et al. [105] also employed a multi-objective optimization GA to devise HEAs. This methodology seeks an optimal compromise among factors such as single-phase stability, solid-solution hardening, and density. Through this approach, thousands of Pareto-optimal BCC HEAs have been designed. After casting and characterization, the alloy exhibits a microstructure comprising a singular disordered solid solution, uniquely combining outstanding hardness with moderate density. The GA generated 3155 alloys that exhibit Pareto optimality or non-domination. This implies that, for each alloy among them, there is no other alloy that simultaneously possesses a higher likelihood of forming a single solid solution, a greater Specific Solvent Heat (SSH), and a lower density. The outcomes are visually represented on a plot.
4.3. Deep Learning (DL) Algorithm
The deep learning (DL) algorithm is a subset of ML models that involves the use of deep neural networks (DNNs, a special type of neural network used in deep learning (DL) models, consist of multiple hidden layers and can more effectively learn and represent complex features and patterns [106]) to enable machines to learn and make decisions without explicit programming. It is inspired by the structure and function of the human brain, with layers of interconnected neurons that process information. The DL algorithm involves the process of uncovering the inherent patterns and hierarchical representations within sample data [107]. The information acquired through these learning processes significantly aids in interpreting data such as text, images, and sounds.
In the study of Zhu et al. [108], a DNN structure utilizing a residual network (RESNET) was introduced for predicting the phase formation of HEAs. It demonstrated an impressive overall accuracy of 81.9%. Compared to conventional machine learning models such as ANNs and standard DNNs, its Micro-F1 score highlighted its superiority in HEA phase prediction. Notably, this approach effectively mitigated the network degradation and enhanced the algorithmic accuracy. This work presents a novel avenue for developing phase formation prediction models using deep learning models, which holds broad relevance in facilitating the design of HEAs with innovative chemical compositions. The schematic diagram of the DNN model is shown in Figure 10.
4.4. Transfer Learning (TL) Algorithm
The TL algorithm is an algorithm that transfers knowledge from a source domain to a target domain, enabling the target domain to achieve better learning outcomes [109]. Generally, the source domain has an abundant amount of data while the target domain has limited data; TL aims to migrate the knowledge learned from the data-rich environment to the new environment with a smaller dataset.
In the study of Feng et al. [110], researchers aimed to utilize CNNs in conjunction with the TL algorithm to predict the crystalline structures of inorganic substances. The well-trained CNNs’ feature extractors were repurposed to extract features from a phase prototypes dataset, which comprised 17,000 inorganic substances and included 170 crystal structures, as well as two datasets on HEAs. These extracted features were subsequently fed into a random forest classifier as inputs. Exceptionally high classification accuracy, exceeding 0.9, was achieved across all three datasets. The visualization of the extracted features conclusively demonstrated the effectiveness of transferable feature extractors. This method presents a straightforward approach to rapidly constructing ML models with strong performance, eliminating the need for time-consuming manual feature engineering processes. Figure 11 shows the process of the research.
When developers aim for accurate property prediction through the creation of DL models, it is sometimes overlooked that certain physical properties of materials exhibit insensitivity to the local atomic environment. In response to this, Elemental Convolution Neural Networks (ECNets) were introduced by Wang et al. [111] to derive more generalized and globally applicable element-wise representations for the precise modeling of material properties. ECNets demonstrate improved prediction capabilities for properties such as band gaps, refractive indices, and elastic moduli in crystals. In its application to HEAs, the focus is specifically on the FeNiCoCrMn/Pd systems using data derived from Density Functional Theory (DFT) calculations. Leveraging knowledge gained from less-principal element alloys, performance in HEAs is enhanced through the TL technique. Additionally, the element-wise features extracted from the parent model, serving as universal descriptors, maintain accuracy even under limited data conditions. Employing this framework, concentration-dependent formation energy, magnetic moment, and local displacement are successfully obtained, thereby enriching the understanding of the physics behind these HEAs. Figure 12 shows the architecture for the ECNet model. This framework has the ability to acquire material representations from elemental embeddings trained on its own dataset. Through elemental convolution operations, the element-wise features serve as intermediary and final descriptors, extracting knowledge related to both atomic information and crystal structures, while being adaptable through the learning process of target material properties.
The advantages and limitations are shown in Table 2.
To sum up, although these advanced ML models and algorithms possess a high adaptability to small sample datasets, which are beneficial for HEA design, nevertheless, these ML models and algorithms have higher requirements for data quality and discreteness.
5. Potential Weakness of ML Models and Optimization Strategies
However, the ML models used in HEA design have potential weaknesses such as data dependence, model complexity, generalization, interpretability, etc. For these weaknesses, some researchers have raised corresponding countermeasures and conducted optimization strategies.
5.1. Data Dependence and Generalization
The performance of ML models in HEA design is greatly influenced by both the quality and quantity of data. Limited or biased datasets can constrain the accuracy and applicability of predictions. Researchers usually use date pre-processing and data augmentation techniques to weaken the negative impact of data dependence.
Raw data are vulnerable to noisy, corrupted, missing, and inconsistent data; it is necessary to perform pre-processing steps, which is performed using classification, clustering, association and many other pre-processing techniques. This makes the knowledge extraction from the dataset much easier with cleaning, integration, transformation, and reduction methods [118]. The most common steps are data cleaning and noise handling.
Data cleansing is a process of identifying and correcting incorrect data or removing them from the dataset. It typically involves detecting and replacing incomplete, inaccurate, irrelevant, or noisy data and records. Generally, it follows these steps: (1) removing irrelevant or duplicate data; (2) correcting structural errors; (3) filling missing values using interpolation methods; and (4) assessing the consistency of the data. Various methods exist for handling noisy data. One option is to ignore the noise if the model can handle overfitting. Alternatively, the noise can be filtered, modified, or relabeled. Techniques like filtering erroneous values, removing them, or imputation can help clean noisy data. Additionally, binning can reduce minor errors by replacing values with general values derived for each bin, lowering overfitting risks, especially in shorter datasets. Binning methods include equal frequency or equal width binning.
Data pre-processing is crucial for the generalization performance of supervised ML algorithms. As the dimensionality of the input space increases, the quantity of training data grows exponentially. It is estimated that pre-processing may consume 50% to 80% of the entire classification process, underscoring its significance in model construction. Enhancing data quality is equally imperative.
Many global scholars have made progress in image data augmentation, discovering several methods for expanding sample size, thereby enhancing the generalization capability of neural networks in use. Utilizing the AlexNet model based on CNN architecture, several authors evaluated and compared various augmentation strategies. ImageNet and CIFAR10 datasets were employed by these authors. Several studies also assessed the effectiveness of different augmentation processes, such as flipping, rotating, adding noise, shifting, and cropping. Additionally, investigations have been conducted on the semantic segmentation of images and videos using deep learning techniques [119].
Additionally, the models may have a limited capability to generalize to novel alloys, especially when the training data do not encompass a diverse range of material properties and compositions. The generalization ability of models is mainly influenced by the quality and variety of data. Therefore, data augmentation also enhances the generalization capability of models.
5.2. Model Complexity
Advanced ML models, although potent, often come with complexity and high computational demands. These characteristics can restrict their applicability in practical scenarios where computational resources are limited or constrained. Additionally, the complexity of a model directly influences its generalization capability. Overly complex models may perform well on training data but poorly on unseen data because they may overfit noise and specific patterns in the training data.
Model simplification is a method aimed at enhancing interpretability by reducing the complexity of a model. It can be achieved through various approaches: (1) Reducing the number of model parameters. By eliminating certain parameters from the model, its complexity can be reduced. This approach is commonly referred to as “Model Compression”. (2) Reducing the structure of the model. By removing certain layers or nodes from the model, its structural complexity can be reduced. This approach is often called “Model Pruning”.
Model simplification can aid in better understanding the functioning of the model but may also lead to a decrease in performance. Therefore, when undertaking model simplification, it is essential to strike a balance between interpretability and performance.
5.3. Interpretability
Model interpretability refers to the ability of a model to explain its predictions or decision-making process in a simple and intuitive manner. In the field of deep learning, models are often considered black boxes because their internal workings are typically complex and difficult to understand. The improvement of model interpretability means that we can better understand how the model makes predictions or decisions based on input data, thereby enhancing trust and an understanding of the behavior of the model.
For models with weak interpretability, techniques such as feature importance analysis, local interpretability methods, and visualization can be used to enhance model interpretability. Local interpretable model-agnostic explanation (LIME) is a commonly used method.
The basic idea of LIME is to generate a set of local samples around a specific data point, and then use a simple interpretable model to explain the predictions of the original model on these local samples. By analyzing these explanatory models, one can understand how the original model makes decisions about specific predictions, thereby enhancing the understanding of the behavior of the model. The main advantage of LIME is that it is model-agnostic, allowing it to be applied to various types of models, including deep learning models and black-box models.
By improving the interpretability of the model, we can better understand its behavior, thereby increasing trust in the model and making it more actionable in practical applications.
5.4. Integration of Computational Theory and Experiment
Using experimental data to validate ML models helps determine the effectiveness of the model in practical applications and identify potential shortcomings. Additionally, based on the results of experimental validation, improvements can be made to the ML model. This may involve adjusting model parameters, optimizing algorithms, or adding new features to enhance the predictive performance of the model. Establishing a feedback loop is essential to continuously improve and iterate on a model, thereby enhancing its accuracy and reliability over time.
The research of Lee et al. [29] is a great example. It encompasses optimization, generation, and interpretation; the aim is to enhance performance and identify crucial design parameters for predicting phases of HEAs. Initially, a regularized deep neural network is established to predict HEA phases, optimizing model architecture, training, and regularization hyperparameters. To address the data scarcity issue in HEAs, the focus then shifts to the development of a conditional generative adversarial network for generating additional HEA samples. A significant improvement in model performance is observed through augmentation from the generative model, achieving a prediction accuracy of 93.17%. Finally, concentration is placed on understanding the contribution of design parameters to identifying the solid-solution phase. The work not only provides guidance for developing a reliable deep learning-based phase prediction model but also offers insights into explaining crucial design parameters to facilitate the design of novel HEAs. In particular, researchers have employed several regularization methods to optimize the DNN model. Regularization is a strategy that fine-tunes the balance of complexity in the neural network between trained and untrained cases. The DNN model is illustrated in Figure 13.
6. Prospect
With the deepening of research on HEAs and the exploration of potential applications, advanced tools used in HEA discovery and mechanistic exploration will be fully utilized in future studies. However, the methods of using ML to design HEAs still face some challenges.
The first challenge is related to data acquisition. Data are the foundation for the ML method. The greatest challenge for the entire field of ML is high-quality data. Currently, various research groups obtain data under different experimental conditions, necessitating careful calibration when merging the data. The acquisition of this data is time-consuming, and in the case of HEA issues, typically only small datasets are available for use. Meanwhile, computer simulation can generate a large amount of data, but these data are not directly related to performance. Thus, how to effectively extract these simulation data and combine them with experimental data is one of the key issues for the development of ML models and algorithms.
The second challenge is related to data compatibility. The results of ML predictions cannot be blindly trusted when the quantity, quality, and discreteness of data are not desirable. Uncertainty quantification is necessary in such research. In practice, there are different methods to assess the uncertainty of models, including Dempster–Shafer theory, fuzzy sets, interval methods, probability methods, Bayesian methods, etc. Using uncertainty quantification, it is possible to derive the model confidence intervals. This not only helps in understanding the reliability of predictions but also enables ML by adding data in regions with high uncertainty. With the optimization of methods, model accuracy has been significantly improved. For example, using adaptive design can enhance the accuracy of the model. Improving the data compatibility of ML models and algorithms can be beneficial for the future of HEA design.
The third challenge is related to data generation. In addition to the existing methods, other cutting-edge ML approaches may also potentially assist in the future design of HEAs. For example, self-supervised learning [120] models can address issues of small datasets. Meta-learning [121] models can achieve more advanced generalization capabilities. Quantum ML [122] models have the potential to address complex issues in HEAs. The efficient verification, iteration, and generation of data are essential to the future of ML methods.
7. Conclusions
ML has been an efficient and effective tool to assist in HEA design and is considered a promising approach. Commonly used ML models and algorithms in HEA design include ANN, SVM, GP, KNN, PCA, RFs, etc. These models and algorithms are trained using previous data to learn patterns and correlations and can then be used to predict or classify new data. Such models and algorithms can automatically make decisions by learning features and patterns in the data, facilitating the design of HEA compositions and performance predictions. The common ML models and algorithms have a high dependence on the quantity of data. However, a small number of datasets becomes a key issue in HEA design, leading to high requirements in accuracy and the generalization ability of ML models and algorithms.
Recently, some advanced ML models and algorithms with optimization strategies have been raised up due to their high adaptability of small-sample datasets, which are beneficial for HEA design. Nevertheless, these ML models and algorithms have higher requirements for data quality and discreteness. In addition, the ML models used in HEA design have potential weaknesses as well, such as data dependence, model complexity, generalization, interpretability, etc. For these weaknesses, some researchers have raised corresponding countermeasures and introduced optimized strategies.
Overall, the effective acquisition of experimental data and computer simulation data, the high compatibility in data quantity, quality, and discreteness, and the efficient verification, iteration, and generation of data are three development directions for ML models and algorithms in the future of HEA design.
Author Contributions
Conceptualization, C.Y.; methodology, C.Y.; validation, S.L.; formal analysis, S.L.; investigation, S.L.; resources, S.L.; data curation, S.L.; writing—original draft preparation, S.L.; writing—review and editing, C.Y.; visualization, C.Y.; supervision, C.Y.; project administration, C.Y.; funding acquisition, C.Y. All authors have read and agreed to the published version of the manuscript.
Funding
The authors gratefully acknowledge the financial support of the Science and Technology Cooperation Project of Inner Mongolia Autonomous Region and Shanghai Jiao Tong University (No. 2023XYJG0001-01-01).
Data Availability Statement
Data sharing is not applicable. No new data were created or analyzed in this study.
Conflicts of Interest
The authors declare no conflicts of interest.
References
- Cantor, B.; Chang, I.T.H.; Knight, P.; Vincent, A.J.B. Microstructural development in equiatomic multicomponent alloys. Mater. Sci. Eng. A 2004, 375–377, 213–218. [Google Scholar] [CrossRef]
- Yeh, J.W.; Chen, S.K.; Lin, S.J.; Gan, J.Y.; Chin, T.S.; Shun, T.T.; Tsau, C.H.; Chang, S.Y. Nanostructured high-entropy alloys with multiple principal elements: Novel alloy design concepts and outcomes. Adv. Eng. Mater. 2004, 6, 299–303. [Google Scholar] [CrossRef]
- Miracle, D.B.; Senkov, O.N. A critical review of high entropy alloys and related concepts. Acta Mater. 2017, 122, 448–511. [Google Scholar] [CrossRef]
- Dippo, O.F.; Vecchio, K.S. A universal configurational entropy metric for high-entropy materials. Scr. Mater. 2021, 201, 113974. [Google Scholar] [CrossRef]
- Marik, S.; Motla, K.; Varghese, M.; Sajilesh, K.; Singh, D.; Breard, Y.; Boullay, P.; Singh, R. Superconductivity in a new hexagonal high-entropy alloy. Phys. Rev. Mater. 2019, 3, 060602. [Google Scholar] [CrossRef]
- Yeh, J.W. Recent progress in high-entropy alloys. Ann. Chim. Sci. Mat. 2006, 31, 633–648. [Google Scholar] [CrossRef]
- Zhang, Y.; Zuo, T.T.; Tang, Z.; Gao, M.C.; Dahmen, K.A.; Liaw, P.K.; Lu, Z.P. Microstructures and properties of high-entropy alloys. Prog. Mater. Sci. 2014, 61, 1–93. [Google Scholar] [CrossRef]
- Chang, X.; Zeng, M.; Liu, K.; Fu, L. Phase engineering of high-entropy alloys. Adv. Mater. 2020, 32, 1907226. [Google Scholar] [CrossRef]
- Han, C.; Fang, Q.; Shi, Y.; Tor, S.B.; Chua, C.K.; Zhou, K. Recent advances on high-entropy alloys for 3D printing. Adv. Mater. 2020, 32, 1903855. [Google Scholar] [CrossRef]
- Wang, B.; Yang, C.; Shu, D.; Sun, B. A Review of Irradiation-Tolerant Refractory High-Entropy Alloys. Metals 2023, 14, 45. [Google Scholar] [CrossRef]
- Zhang, C.; Jiang, X.; Zhang, R.; Wang, X.; Yin, H.; Qu, X.; Liu, Z.K. High-throughput thermodynamic calculations of phase equilibria in solidified 6016 Al-alloys. Comp. Mater. Sci. 2019, 167, 19–24. [Google Scholar] [CrossRef]
- Li, R.; Xie, L.; Wang, W.Y.; Liaw, P.K.; Zhang, Y. High-throughput calculations for high-entropy alloys: A brief review. Front. Mater. 2020, 7, 290. [Google Scholar] [CrossRef]
- Yang, X.; Wang, Z.; Zhao, X.; Song, J.; Zhang, M.; Liu, H. MatCloud: A high-throughput computational infrastructure for integrated management of materials simulation, data and resources. Comp. Mater. Sci. 2018, 146, 319–333. [Google Scholar] [CrossRef]
- Feng, R.; Liaw, P.K.; Gao, M.C.; Widom, M. First-principles prediction of high-entropy-alloy stability. NPJ Comput. Mater. 2017, 3, 50. [Google Scholar] [CrossRef]
- Gao, J.; Zhong, J.; Liu, G.; Yang, S.; Song, B.; Zhang, L.; Liu, Z. A machine learning accelerated distributed task management system (Malac-Distmas) and its application in high-throughput CALPHAD computation aiming at efficient alloy design. Adv. Powder Technol. 2022, 1, 100005. [Google Scholar] [CrossRef]
- Feng, R.; Zhang, C.; Gao, M.C.; Pei, Z.; Zhang, F.; Chen, Y.; Ma, D.; An, K.; Poplawsky, J.D.; Ouyang, L. High-throughput design of high-performance lightweight high-entropy alloys. Nat. Commun. 2021, 12, 4329. [Google Scholar] [CrossRef]
- Gruetzemacher, R.; Whittlestone, J. The transformative potential of artificial intelligence. Futures 2022, 135, 102884. [Google Scholar] [CrossRef]
- Minh, D.; Wang, H.X.; Li, Y.F.; Nguyen, T.N. Explainable artificial intelligence: A comprehensive review. Artif. Intell. Rev. 2022, 55, 3503–3568. [Google Scholar] [CrossRef]
- Batra, R.; Song, L.; Ramprasad, R. Emerging materials intelligence ecosystems propelled by machine learning. Nat. Rev. Mater. 2021, 6, 655–678. [Google Scholar] [CrossRef]
- Heidenreich, J.N.; Gorji, M.B.; Mohr, D. Modeling structure-property relationships with convolutional neural networks: Yield surface prediction based on microstructure images. Int. J. Plast. 2023, 163, 103506. [Google Scholar] [CrossRef]
- Huang, E.W.; Lee, W.J.; Singh, S.S.; Kumar, P.; Lee, C.Y.; Lam, T.N.; Chin, H.H.; Lin, B.H.; Liaw, P.K. Machine-learning and high-throughput studies for high-entropy materials. Mater. Sci. Eng. R. 2022, 147, 100645. [Google Scholar] [CrossRef]
- Ren, W.; Zhang, Y.F.; Wang, W.L.; Ding, S.J.; Li, N. Prediction and design of high hardness high entropy alloy through machine learning. Mater. Des. 2023, 235, 112454. [Google Scholar] [CrossRef]
- Liu, Y.; Zhao, T.; Ju, W.; Shi, S. Materials discovery and design using machine learning. J. Materiomics 2017, 3, 159–177. [Google Scholar] [CrossRef]
- Oneto, L.; Navarin, N.; Biggio, B.; Errica, F.; Micheli, A.; Scarselli, F.; Bianchini, M.; Demetrio, L.; Bongini, P.; Tacchella, A. Towards learning trustworthily, automatically, and with guarantees on graphs: An overview. Neurocomputing 2022, 493, 217–243. [Google Scholar] [CrossRef]
- Zhang, Y.; Ling, C. A strategy to apply machine learning to small datasets in materials science. NPJ Comput. Mater. 2018, 4, 25. [Google Scholar] [CrossRef]
- Schleder, G.R.; Padilha, A.C.; Acosta, C.M.; Costa, M.; Fazzio, A. From DFT to machine learning: Recent approaches to materials science—A review. J. Phys. Mater. 2019, 2, 032001. [Google Scholar] [CrossRef]
- Raccuglia, P.; Elbert, K.C.; Adler, P.D.; Falk, C.; Wenny, M.B.; Mollo, A.; Zeller, M.; Friedler, S.A.; Schrier, J.; Norquist, A.J. Machine-learning-assisted materials discovery using failed experiments. Nature 2016, 533, 73–76. [Google Scholar] [CrossRef]
- He, H.; Wang, Y.; Qi, Y.; Xu, Z.; Li, Y.; Wang, Y. From Prediction to Design: Recent Advances in Machine Learning for the Study of 2D Materials. Nano Energy 2023, 118, 108965. [Google Scholar] [CrossRef]
- Lee, S.Y.; Byeon, S.; Kim, H.S.; Jin, H.; Lee, S. Deep learning-based phase prediction of high-entropy alloys: Optimization, generation, and explanation. Mater. Des. 2021, 197, 109260. [Google Scholar] [CrossRef]
- Zhang, Y.; Wen, C.; Wang, C.; Antonov, S.; Xue, D.; Bai, Y.; Su, Y. Phase prediction in high entropy alloys with a rational selection of materials descriptors and machine learning models. Acta Mater. 2020, 185, 528–539. [Google Scholar] [CrossRef]
- Shapeev, A. Accurate representation of formation energies of crystalline alloys with many components. Comput. Mater. Sci. 2016, 139, 26–30. [Google Scholar] [CrossRef]
- Song, K.; Xing, J.; Dong, Q. Optimization of the processing parameters during internal oxidation of Cu-Al alloy powders using an artificial neural network. Mater. Des. 2005, 26, 337–341. [Google Scholar] [CrossRef]
- Sun, Y.; Zeng, W.D.; Zhao, Y.Q.; Qi, Y.L.; Ma, X.; Han, Y.F. Development of constitutive relationship model of Ti600 alloy using artificial neural network, Comput. Mater. Sci. 2010, 48, 686–691. [Google Scholar] [CrossRef]
- Su, J.; Dong, Q.; Liu, P.; Li, H.; Kang, B. Prediction of Properties in Thermomechanically Treated Cu-Cr-Zr Alloy by an Artificial Neural Network. J. Mater. Sci. Technol. 2003, 19, 529–532. [Google Scholar]
- Lederer, Y.; Toher, C.; Vecchio, K.S.; Curtarolo, S. The search for high entropy alloys: A high-throughput ab-initio approach. Acta Mater. 2018, 159, 364–383. [Google Scholar] [CrossRef]
- Tancret, F.; Toda-Caraballo, I.; Menou, E.; Díaz-Del, P.E.J.R. Designing high entropy alloys employing thermodynamics and Gaussian process statistical analysis. Mater. Des. 2017, 115, 486–497. [Google Scholar] [CrossRef]
- Grabowski, B.; Ikeda, Y.; Srinivasan, P.; Körmann, F.; Freysoldt, C.; Duff, A.I.; Shapeev, A.; Neugebauer, J. Ab initio vibrational free energies including anharmonicity for multicomponent alloys. NPJ Comput. Mater. 2019, 5, 80. [Google Scholar] [CrossRef]
- Malinov, S.; Sha, W.; McKeown, J. Modelling the correlation between processing parameters and properties in titanium alloys using artificial neural network. Comput. Mater. Sci. 2001, 21, 375–394. [Google Scholar] [CrossRef]
- Warde, J.; DM, K. Use of neural networks for alloy design. ISIJ Int. 1999, 39, 1015–1019. [Google Scholar] [CrossRef]
- Sun, Y.; Zeng, W.; Zhao, Y.; Zhang, X.; Shu, Y.; Zhou, Y. Modeling constitutive relationship of Ti40 alloy using artificial neural network. Mater. Des. 2011, 32, 1537–1541. [Google Scholar] [CrossRef]
- Lin, Y.; Zhang, J.; Zhong, J. Application of neural networks to predict the elevated temperature flow behavior of a low alloy steel. Comput. Mater. Sci. 2008, 43, 752–758. [Google Scholar] [CrossRef]
- Haghdadi, N.; Zarei-Hanzaki, A.; Khalesian, A.; Abedi, H. Artificial neural network modeling to predict the hot deformation behavior of an A356 aluminum alloy. Mater. Des. 2013, 49, 386–391. [Google Scholar] [CrossRef]
- Dewangan, S.K.; Samal, S.; Kumar, V. Microstructure exploration and an artificial neural network approach for hardness prediction in AlCrFeMnNiWx High-Entropy Alloys. J. Alloys Compd. 2020, 823, 153766. [Google Scholar] [CrossRef]
- Zhou, Z.; Zhou, Y.; He, Q.; Ding, Z.; Li, F.; Yang, Y. Machine learning guided appraisal and exploration of phase design for high entropy alloys. npj Comput. Mater. 2019, 5, 128. [Google Scholar] [CrossRef]
- Li, Y.; Guo, W. Machine-learning model for predicting phase formations of high-entropy alloys. Phys. Rev. Mater. 2019, 3, 095005. [Google Scholar] [CrossRef]
- Wen, C.; Zhang, Y.; Wang, C.; Xue, D.; Bai, Y.; Antonov, S.; Dai, L.; Lookman, T.; Su, Y. Machine learning assisted design of high entropy alloys with desired property. Acta Mater. 2019, 170, 109–117. [Google Scholar] [CrossRef]
- Singh, J.; Singh, S. Support vector machine learning on slurry erosion characteristics analysis of Ni-and Co-alloy coatings. Surf. Rev. Let. 2023, 2340006. [Google Scholar] [CrossRef]
- Alajmi, M.S.; Almeshal, A.M. Estimation and optimization of tool wear in conventional turning of 709M40 alloy steel using support vector machine (SVM) with Bayesian optimization. Materials 2021, 14, 3773. [Google Scholar] [CrossRef]
- Lu, W.C.; Ji, X.B.; Li, M.J.; Liu, L.; Yue, B.H.; Zhang, L.M. Using support vector machine for materials design. Adv. Manuf. 2013, 1, 151–159. [Google Scholar] [CrossRef]
- Nain, S.S.; Garg, D.; Kumar, S. Evaluation and analysis of cutting speed, wire wear ratio, and dimensional deviation of wire electric discharge machining of super alloy Udimet-L605 using support vector machine and grey relational analysis. Adv. Manuf. 2018, 6, 225–246. [Google Scholar] [CrossRef]
- Lei, C.; Mao, J.; Zhang, X.; Wang, L.; Chen, D. Crack prediction in sheet forming of zirconium alloys used in nuclear fuel assembly by support vector machine method. Energy Rep. 2021, 7, 5922–5932. [Google Scholar] [CrossRef]
- Xiang, G.; Zhang, Q. Multi-object optimization of titanium alloy milling process using support vector machine and NSGA-II algorithm. Int. J. Simul. Syst. Sci. Technol. 2016, 17, 35. [Google Scholar] [CrossRef]
- Kong, D.; Chen, Y.; Li, N.; Duan, C.; Lu, L.; Chen, D. Tool wear estimation in end milling of titanium alloy using NPE and a novel WOA-SVM model. IEEE. Trans. Instrum. Meas. 2019, 69, 5219–5232. [Google Scholar] [CrossRef]
- Caixu, Y.; Zhenlong, X.; Xianli, L.; Mingwei, Z. Chatter prediction of milling process for titanium alloy thin-walled workpiece based on EMD-SVM. J. Adv. Manuf. Sci. Technol. 2022, 2, 2022010. [Google Scholar] [CrossRef]
- Meshkov, E.A.; Novoselov, I.I.; Shapeev, A.; Yanilkin, V.A. Sublattice formation in CoCrFeNi high-entropy alloy. Intermetallics 2019, 112, 106542. [Google Scholar] [CrossRef]
- Park, S.M.; Lee, T.; Lee, J.H.; Kang, J.S.; Kwon, M.S. Gaussian process regression-based Bayesian optimization of the insulation-coating process for Fe–Si alloy sheets. J. Mater. Res. Technol. 2023, 22, 3294–3301. [Google Scholar] [CrossRef]
- Khatamsaz, D.; Vela, B.; Arróyave, R. Multi-objective Bayesian alloy design using multi-task Gaussian processes. Mater. Lett. 2023, 351, 135067. [Google Scholar] [CrossRef]
- Tancret, F. Computational thermodynamics, Gaussian processes and genetic algorithms: Combined tools to design new alloys. Model. Simul. Mat. Sci. Eng. 2013, 21, 045013. [Google Scholar] [CrossRef]
- Mahmood, M.A.; Rehman, A.U.; Karakaş, B.; Sever, A.; Rehman, R.U.; Salamci, M.U.; Khraisheh, M. Printability for additive manufacturing with machine learning: Hybrid intelligent Gaussian process surrogate-based neural network model for Co-Cr alloy. J. Mech. Behav. Biomed. Mater. 2022, 135, 105428. [Google Scholar] [CrossRef]
- Sabin, T.; Bailer-Jones, C.; Withers, P. Accelerated learning using Gaussian process models to predict static recrystallization in an Al-Mg alloy. Model. Simul. Mat. Sci. Eng. 2000, 8, 687. [Google Scholar] [CrossRef]
- Gong, X.; Yabansu, Y.C.; Collins, P.C.; Kalidindi, S.R. Evaluation of Ti–Mn Alloys for Additive Manufacturing Using High-Throughput Experimental Assays and Gaussian Process Regression. Materials 2020, 13, 4641. [Google Scholar] [CrossRef]
- Hasan, M.S.; Kordijazi, A.; Rohatgi, P.K.; Nosonovsky, M. Triboinformatic modeling of dry friction and wear of aluminum base alloys using machine learning algorithms. Tribol. Int. 2021, 161, 107065. [Google Scholar] [CrossRef]
- Bobbili, R.; Ramakrishna, B. Prediction of phases in high entropy alloys using machine learning. Mater. Today Commun. 2023, 36, 106674. [Google Scholar] [CrossRef]
- Huang, W.; Martin, P.; Zhuang, H.L. Machine-learning phase prediction of high-entropy alloys. Acta Mater. 2019, 169, 225–236. [Google Scholar] [CrossRef]
- Ghouchan Nezhad Noor Nia, R.; Jalali, M.; Houshmand, M. A Graph-Based k-Nearest Neighbor (KNN) Approach for Predicting Phases in High-Entropy Alloys. Appl. Sci. 2022, 12, 8021. [Google Scholar] [CrossRef]
- Gupta, A.K.; Chakroborty, S.; Ghosh, S.K.; Ganguly, S. A machine learning model for multi-class classification of quenched and partitioned steel microstructure type by the k-nearest neighbor algorithm. Comput. Mater. Sci. 2023, 228, 112321. [Google Scholar] [CrossRef]
- Zhang, J.; Wu, J.F.; Yin, A.; Xu, Z.; Zhang, Z.; Yu, H.; Lu, Y.; Liao, W.; Zheng, L. Grain size characterization of Ti-6Al-4V titanium alloy based on laser ultrasonic random forest regression. Appl. Optics 2022, 62, 735–744. [Google Scholar] [CrossRef]
- Zhang, Z.; Yang, Z.; Ren, W.; Wen, G. Random forest-based real-time defect detection of Al alloy in robotic arc welding using optical spectrum. J. Manuf. Process. 2019, 42, 51–59. [Google Scholar] [CrossRef]
- Prieto, A.; Prieto, B.; Ortigosa, E.M.; Ros, E.; Pelayo, F.; Ortega, J.; Rojas, I. Neural networks: An overview of early research, current frameworks and new challenges. Neurocomputing 2016, 214, 242–268. [Google Scholar] [CrossRef]
- Yuste, R. From the neuron doctrine to neural networks. Nat. Rev. Neurosci. 2015, 16, 487–497. [Google Scholar] [CrossRef]
- Islam, M.M.; Murase, K. A new algorithm to design compact two-hidden-layer artificial neural networks. Neural. Netw. 2001, 14, 1265–1278. [Google Scholar] [CrossRef]
- Apicella, A.; Donnarumma, F.; Isgrò, F.; Prevete, R. A survey on modern trainable activation functions. Neural Netw. 2021, 138, 14–32. [Google Scholar] [CrossRef]
- Wang, J.; Kwon, H.; Kim, H.S.; Lee, B.J. A neural network model for high entropy alloy design. NPJ Comput. Mater. 2023, 9, 60. [Google Scholar] [CrossRef]
- Aslani, M.; Seipel, S. Efficient and decision boundary aware instance selection for support vector machines. Inf. Sci. 2021, 577, 579–598. [Google Scholar] [CrossRef]
- Chapelle, O.; Haffner, P.; Vapnik, V.N. Support vector machines for histogram-based image classification. IEEE Trans. Neural Netw. 1999, 10, 1055–1064. [Google Scholar] [CrossRef]
- Xu, X.; Liang, T.; Zhu, J.; Zheng, D.; Sun, T. Review of classical dimensionality reduction and sample selection methods for large-scale data processing. Neurocomputing 2019, 328, 5–15. [Google Scholar] [CrossRef]
- Hussain, S.F. A novel robust kernel for classifying high-dimensional data using Support Vector Machines. Expert Syst. Appl. 2019, 131, 116–131. [Google Scholar] [CrossRef]
- Zhang, W.; Li, P.; Wang, L.; Wan, F.; Wu, J.; Yong, L. Explaining of prediction accuracy on phase selection of amorphous alloys and high entropy alloys using support vector machines in machine learning. Mater. Today Commun. 2023, 35, 105694. [Google Scholar] [CrossRef]
- Chau, N.H.; Kubo, M.; Hai, L.V.; Yamamoto, T. Support Vector Machine-Based Phase Prediction of Multi-Principal Element Alloys. Vietnam. J. Comput. Sci. 2022, 10, 101–116. [Google Scholar] [CrossRef]
- Li, P.; Chen, S. Gaussian process approach for metric learning. Pattern Recognit. 2019, 87, 17–28. [Google Scholar] [CrossRef]
- Liu, H.; Ong, Y.S.; Shen, X.; Cai, J. When Gaussian process meets big data: A review of scalable GPs. IEEE Trans. Neural Netw. Learn Syst. 2020, 31, 4405–4423. [Google Scholar] [CrossRef]
- Ertuğrul, Ö.F.; Tağluk, M.E. A novel version of k nearest neighbor: Dependent nearest neighbor. Appl. Soft Comput. 2017, 55, 480–490. [Google Scholar] [CrossRef]
- Adithiyaa, T.; Chandramohan, D.; Sathish, T. Optimal prediction of process parameters by GWO-KNN in stirring-squeeze casting of AA2219 reinforced metal matrix composites. Mater. Today Proc. 2020, 21, 1000–1007. [Google Scholar] [CrossRef]
- Jahromi, M.Z.; Parvinnia, E.; John, R. A method of learning weighted similarity function to improve the performance of nearest neighbor. Inf. Sci. 2009, 179, 2964–2973. [Google Scholar] [CrossRef]
- Chen, Y.; Hao, Y. A feature weighted support vector machine and K-nearest neighbor algorithm for stock market indices prediction. Expert Syst. Appl. 2017, 80, 340–355. [Google Scholar] [CrossRef]
- Utkin, L.V.; Kovalev, M.S.; Coolen, F.P. Imprecise weighted extensions of random forests for classification and regression. Appl. Soft Comput. 2020, 92, 106324. [Google Scholar] [CrossRef]
- Özçift, A. Random forests ensemble classifier trained with data resampling strategy to improve cardiac arrhythmia diagnosis. Comput. Biol. Med. 2011, 41, 265–271. [Google Scholar] [CrossRef]
- Rokach, L. Decision forest: Twenty years of research. Inf. Fusion 2016, 27, 111–125. [Google Scholar] [CrossRef]
- Yang, L.; Shami, A. IoT data analytics in dynamic environments: From an automated machine learning perspective. Eng. Appl. Artif. Intell. 2022, 116, 105366. [Google Scholar] [CrossRef]
- Krishna, Y.V.; Jaiswal, U.K.; Rahul, M. Machine learning approach to predict new multiphase high entropy alloys. Scr. Mater. 2021, 197, 113804. [Google Scholar] [CrossRef]
- Livingstone, D.J.; Manallack, D.T.; Tetko, I.V. Data modelling with neural networks: Advantages and limitations. J. Comput.-Aided Mol. Des. 1997, 11, 135–142. [Google Scholar] [CrossRef]
- Tu, V.J. Advantages and disadvantages of using artificial neural networks versus logistic regression for predicting medical outcomes. J. Clin. Epidemiol. 1996, 49, 1225–1231. [Google Scholar] [CrossRef]
- Cervantes, J.; Garcia-Lamont, F.; Rodríguez-Mazahua, L.; Lopez, A. A comprehensive survey on support vector machine classification: Applications, challenges and trends. Neurocomputing 2020, 408, 189–215. [Google Scholar] [CrossRef]
- Brieuc, M.S.; Waters, C.D.; Drinan, D.P.; Naish, K.A. A practical introduction to Random Forest for genetic association studies in ecology and evolution. Mol. Ecol. Resour. 2018, 18, 755–766. [Google Scholar] [CrossRef]
- Kasdekar, D.K.; Parashar, V. Principal component analysis to optimize the ECM parameters of Aluminium alloy. Mater. Today Proc. 2018, 5, 5398–5406. [Google Scholar] [CrossRef]
- Sonawane, S.A.; Kulkarni, M.L. Optimization of machining parameters of WEDM for Nimonic-75 alloy using principal component analysis integrated with Taguchi method. J. King Saud Univ. Eng. Sci. 2018, 30, 250–258. [Google Scholar] [CrossRef]
- Bouchard, M.; Mergler, D.; Baldwin, M.; Panisset, M.; Roels, H.A. Neuropsychiatric symptoms and past manganese exposure in a ferro-alloy plant. Neurotoxicology 2007, 28, 290–297. [Google Scholar] [CrossRef]
- Liu, Y.; Yao, C.; Niu, C.; Li, W.; Shen, T. Text mining of hypereutectic Al-Si alloys literature based on active learning. Mater. Today Commun. 2021, 26, 102032. [Google Scholar] [CrossRef]
- Tang, B.; Li, X.; Wang, J.; Ge, W.; Yu, Z.; Lin, T. STIOCS: Active learning-based semi-supervised training framework for IOC extraction. Comput. Electr. Eng. 2023, 112, 108981. [Google Scholar] [CrossRef]
- Li, H.; Yuan, R.; Liang, H.; Wang, W.Y.; Li, J.; Wang, J. Towards high entropy alloy with enhanced strength and ductility using domain knowledge constrained active learning. Mater. Des. 2022, 223, 111186. [Google Scholar] [CrossRef]
- Ahn, K.K.; Kha, N.B. Modeling and control of shape memory alloy actuators using Preisach model, genetic algorithm and fuzzy logic. Mechatronics 2008, 18, 141–152. [Google Scholar] [CrossRef]
- Anijdan, S.H.M.; Bahrami, A.; Hosseini, H.R.M. Using genetic algorithm and artificial neural network analyses to design an Al–Si casting alloy of minimum porosity. Mater. Des. 2006, 27, 605–609. [Google Scholar] [CrossRef]
- Scrucca, L. GA: A package for genetic algorithms in R. J. Stat. Softw. 2013, 53, 1–37. [Google Scholar] [CrossRef]
- Adaan-Nyiak, M.A.; Alam, I.; Tiamiyu, A.A. Ball milling process variables optimization for high-entropy alloy development using design of experiment and genetic algorithm. Powder Technol. 2023, 427, 118766. [Google Scholar] [CrossRef]
- Menou, E.; Tancret, F.; Toda-Caraballo, I.; Ramstein, G.; Castany, P.; Bertrand, E.; Gautier, N.; Rivera Díaz-Del-Castillo, P.E.J. Computational design of light and strong high entropy alloys (HEA): Obtainment of an extremely high specific solid solution hardening. Scr. Mater. 2018, 156, 120–123. [Google Scholar] [CrossRef]
- Kriegeskorte, N. Deep neural networks: A new framework for modeling biological vision and brain information processing. Annu. Rev. Vis. Sci. 2015, 1, 417–446. [Google Scholar] [CrossRef]
- Shen, C. A transdisciplinary review of deep learning research and its relevance for water resources scientists. Water Resour. Res. 2018, 54, 8558–8593. [Google Scholar] [CrossRef]
- Zhu, W.; Huo, W.; Wang, S.; Wang, X.; Ren, K.; Tan, S.; Fang, F.; Xie, Z.; Jiang, J. Phase formation prediction of high-entropy alloys: A deep learning study. J. Mater. Res. Technol. 2022, 18, 800–809. [Google Scholar] [CrossRef]
- Pan, W. A survey of transfer learning for collaborative recommendation with auxiliary data. Neurocomputing 2016, 177, 447–453. [Google Scholar] [CrossRef]
- Feng, S.; Zhou, H.; Dong, H. Application of deep transfer learning to predicting crystal structures of inorganic substances. Comput. Mater. Sci. 2021, 195, 110476. [Google Scholar] [CrossRef]
- Wang, X.; Tran, N.D.; Zeng, S.; Hou, C.; Chen, Y.; Ni, J. Element-wise representations with ECNet for material property prediction and applications in high-entropy alloys. NPJ Comput. Mater. 2022, 8, 253. [Google Scholar] [CrossRef]
- Beg, A.H.; Islam, M.Z. Advantages and limitations of genetic algorithms for clustering records. In Proceedings of the 2016 IEEE 11th Conference on Industrial Electronics and Applications (ICIEA), Hefei, China, 5–7 June 2016; pp. 2478–2483. [Google Scholar] [CrossRef]
- Papernot, N.; McDaniel, P.; Jha, S.; Fredrikson, M.; Celik, Z.B.; Swami, A. The limitations of deep learning in adversarial settings. In Proceedings of the 2016 IEEE European Symposium on Security and Privacy (EuroS&P), Saarbruecken, Germany, 21–24 March 2016; pp. 372–387. [Google Scholar] [CrossRef]
- Shen, C.; Nguyen, D.; Zhou, Z.; Jiang, S.B.; Dong, B.; Jia, X. An introduction to deep learning in medical physics: Advantages, potential, and challenges. Phys. Med. Biol. 2020, 65, 05TR01. [Google Scholar] [CrossRef] [PubMed]
- Ahmed, S.F.; Alam, M.S.B.; Hassan, M.; Rozbu, M.R.; Ishtiak, T.; Rafa, N.; Mofijur, M.; Ali, A.S.; Gandomi, A.H. Deep learning modelling techniques: Current progress, applications, advantages, and challenges. Artif. Intell. Rev. 2023, 56, 13521–13617. [Google Scholar] [CrossRef]
- Zhao, Z.; Alzubaidi, L.; Zhang, J.; Duan, Y.; Gu, Y. A comparison review of transfer learning and self-supervised learning: Definitions, applications, advantages and limitations. Expert Syst. Appl. 2023, 242, 122807. [Google Scholar] [CrossRef]
- Niu, S.; Liu, Y.; Wang, J.; Song, H. A decade survey of transfer learning (2010–2020). IEEE Trans. Artif. Intell. 2020, 1, 151–166. [Google Scholar] [CrossRef]
- Maharana, K.; Mondal, S.; Nemade, B. A review: Data pre-processing and data augmentation techniques. Glob. Transit. Proc. 2022, 3, 91–99. [Google Scholar] [CrossRef]
- Le, N.T.; Wang, J.-W.; Le, D.H.; Wang, C.-C.; Nguyen, T.N. Fingerprint enhancement based on tensor of wavelet subbands for classification. IEEE Access 2020, 8, 6602–6615. [Google Scholar] [CrossRef]
- Zhai, X.; Oliver, A.; Kolesnikov, A.; Beyer, L. S4l: Self-supervised semi-supervised learning. In Proceedings of the 2019 IEEE/CVF International Conference on Computer Vision (ICCV), Seoul, Republic of Korea, 27 October–2 November 2019; pp. 1476–1485. [Google Scholar]
- Hospedales, T.; Antoniou, A.; Micaelli, P.; Storkey, A. Meta-learning in neural networks: A survey. IEEE Trans Pattern Anal. Mach. Intell. 2021, 44, 5149–5169. [Google Scholar] [CrossRef]
- Ciliberto, C.; Herbster, M.; Ialongo, A.D.; Pontil, M.; Rocchetto, A.; Severini, S.; Wossnig, L. Quantum machine learning: A classical perspective. Proc. Math. Phys. Eng. Sci. 2018, 474, 20170551. [Google Scholar] [CrossRef]
Figure 1.
(a) R2 and (b) RMSE comparison of NN models and the present model (w/T&C). (c) R2 and (d) RMSE comparison of ML models other than NN models and the present model. (e) The comparison plot for YS data. (f) The comparison plot for UTS data. Reprinted with permission from Ref. [73]. Copyright Springer Nature (2023).
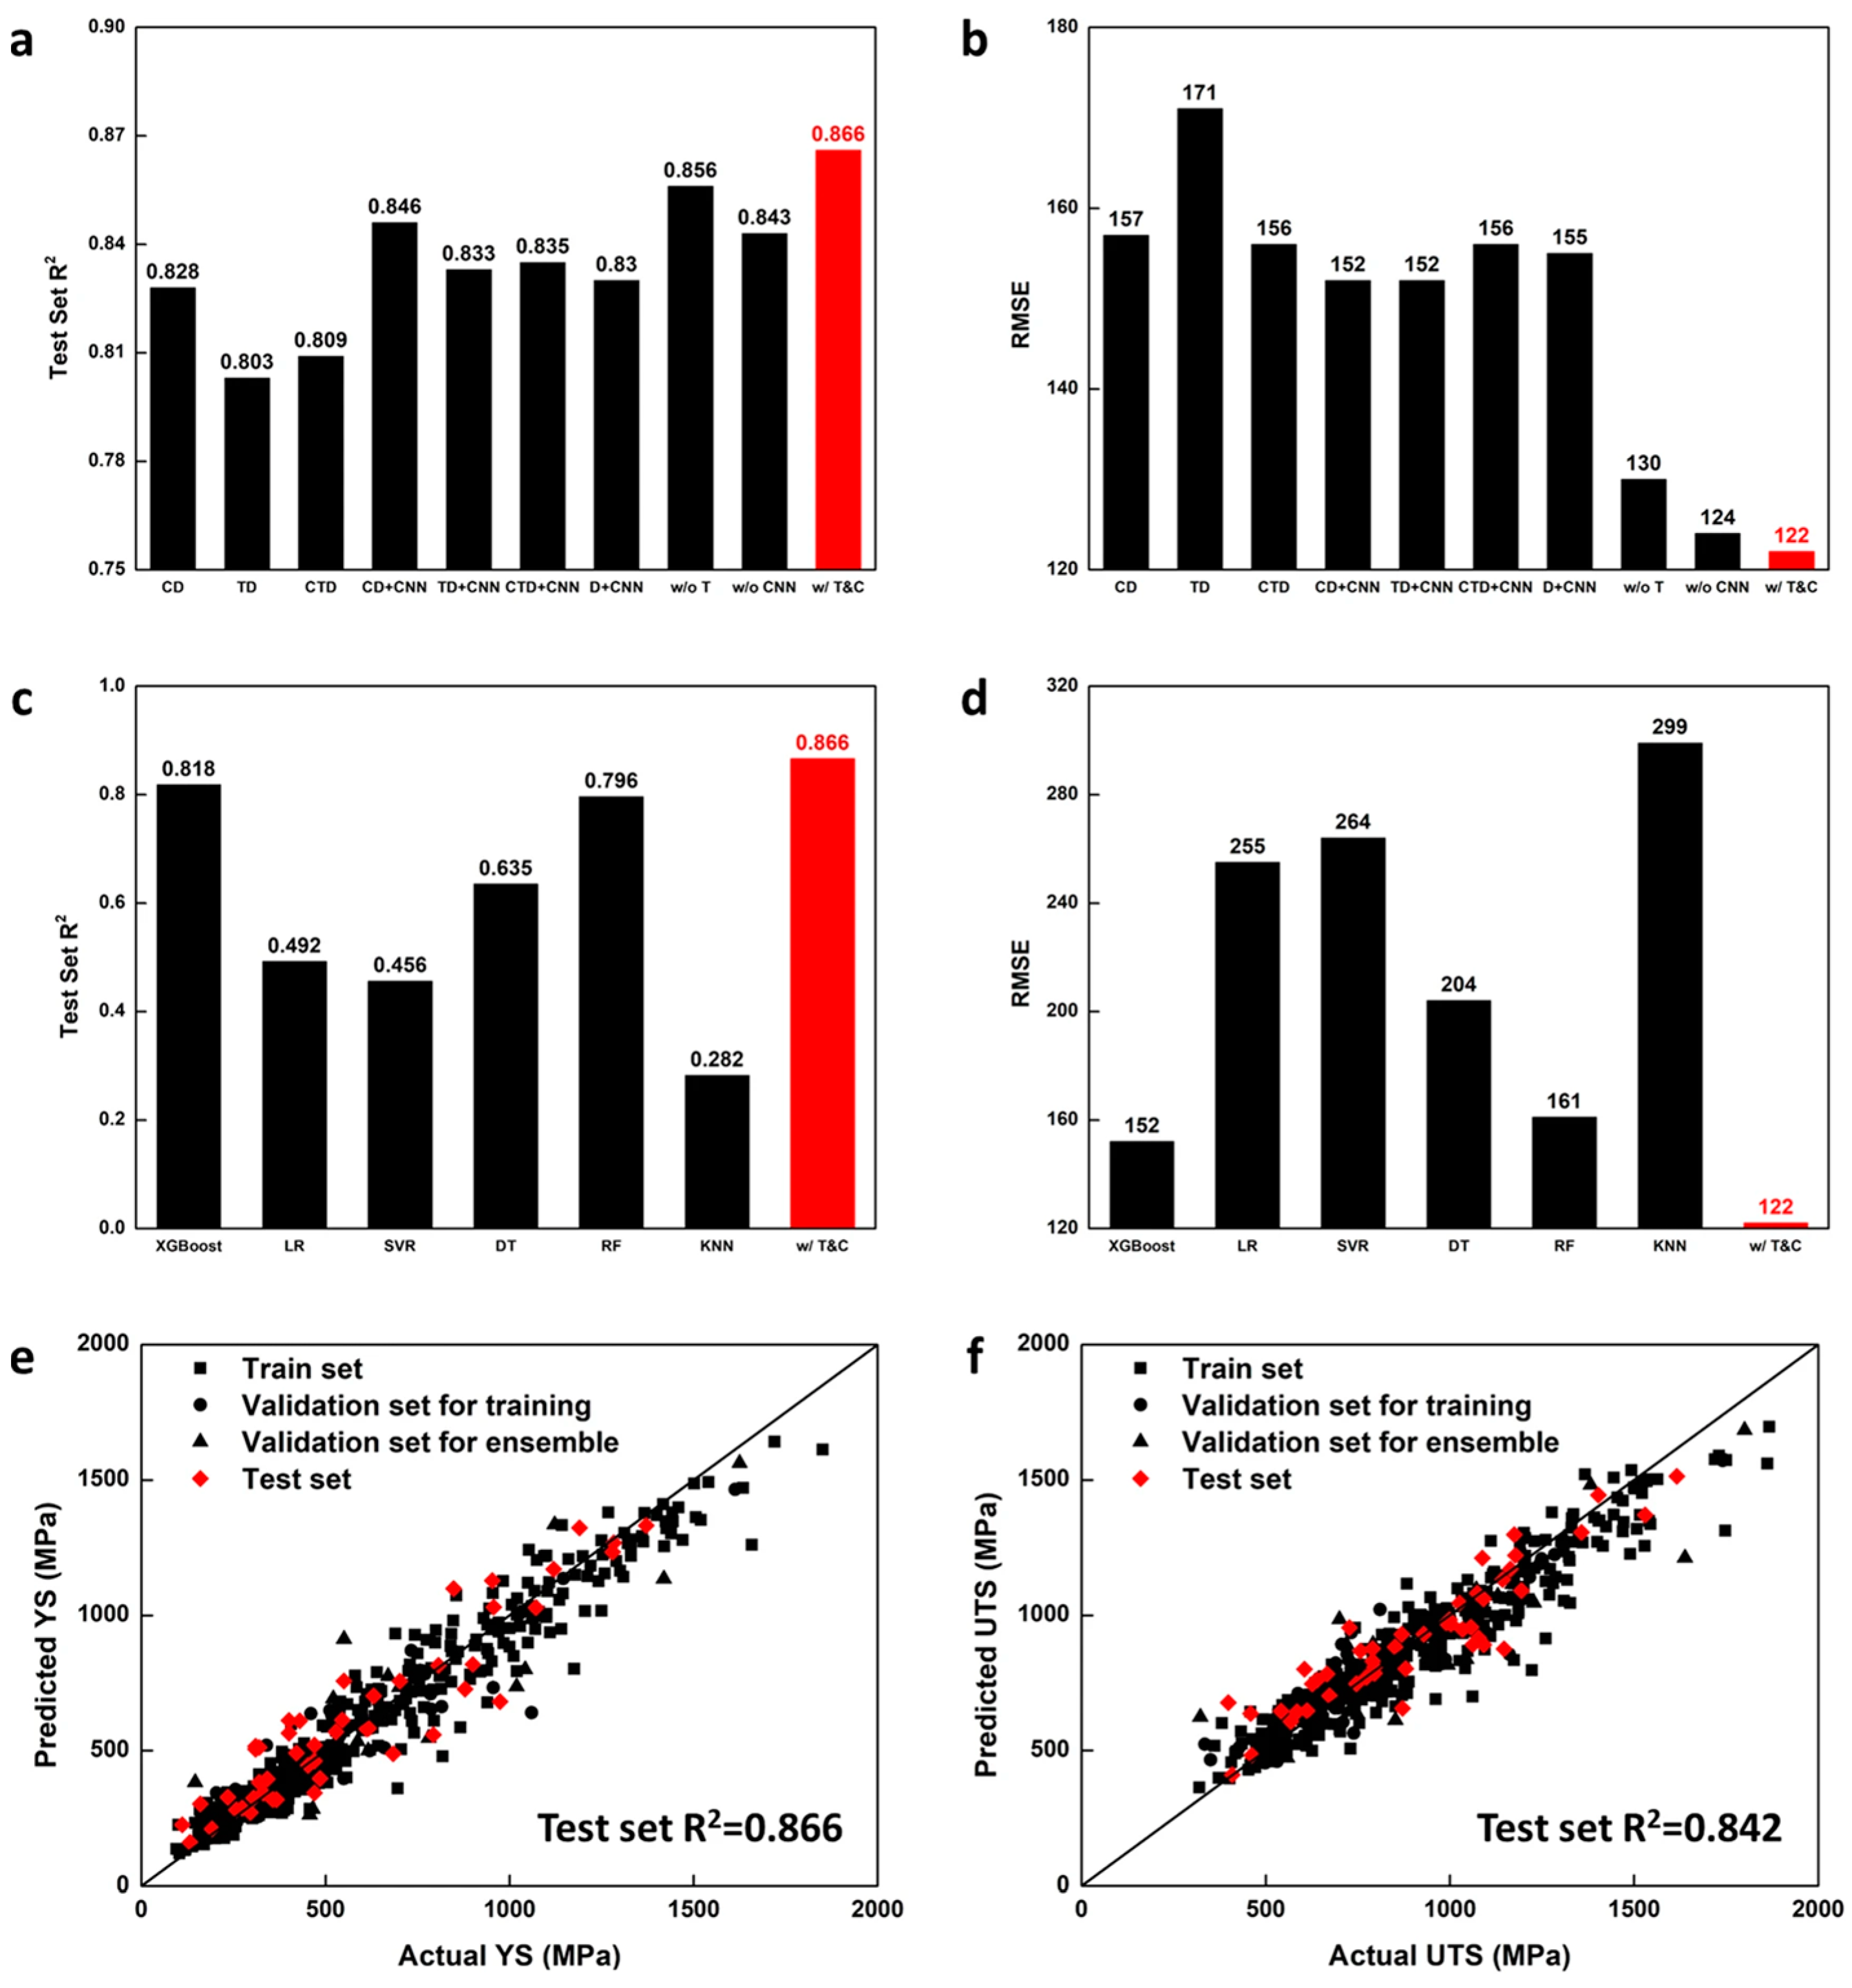
Figure 2.
Scatter diagram matrix of correlation of 4 features in phase selection of 330 alloys, in which the vertical and horizontal axes are input feature parameters. Black stars represent AM, red fivepointed stars represent SS, and blue circles represent HEA-IM. Reprinted with permission from Ref. [78]. Copyright Elsevier (2023).

Figure 3.
The histogram of 15 prediction results of phase selection of (a) AM, (b) SS, and (c) IM alloys by a single parameter among the four parameters. Black represents δ, red represents Δχ, blue represents ΔHm, and green represents Sid. Reprinted with permission from Ref. [78]. Copyright Elsevier (2023).
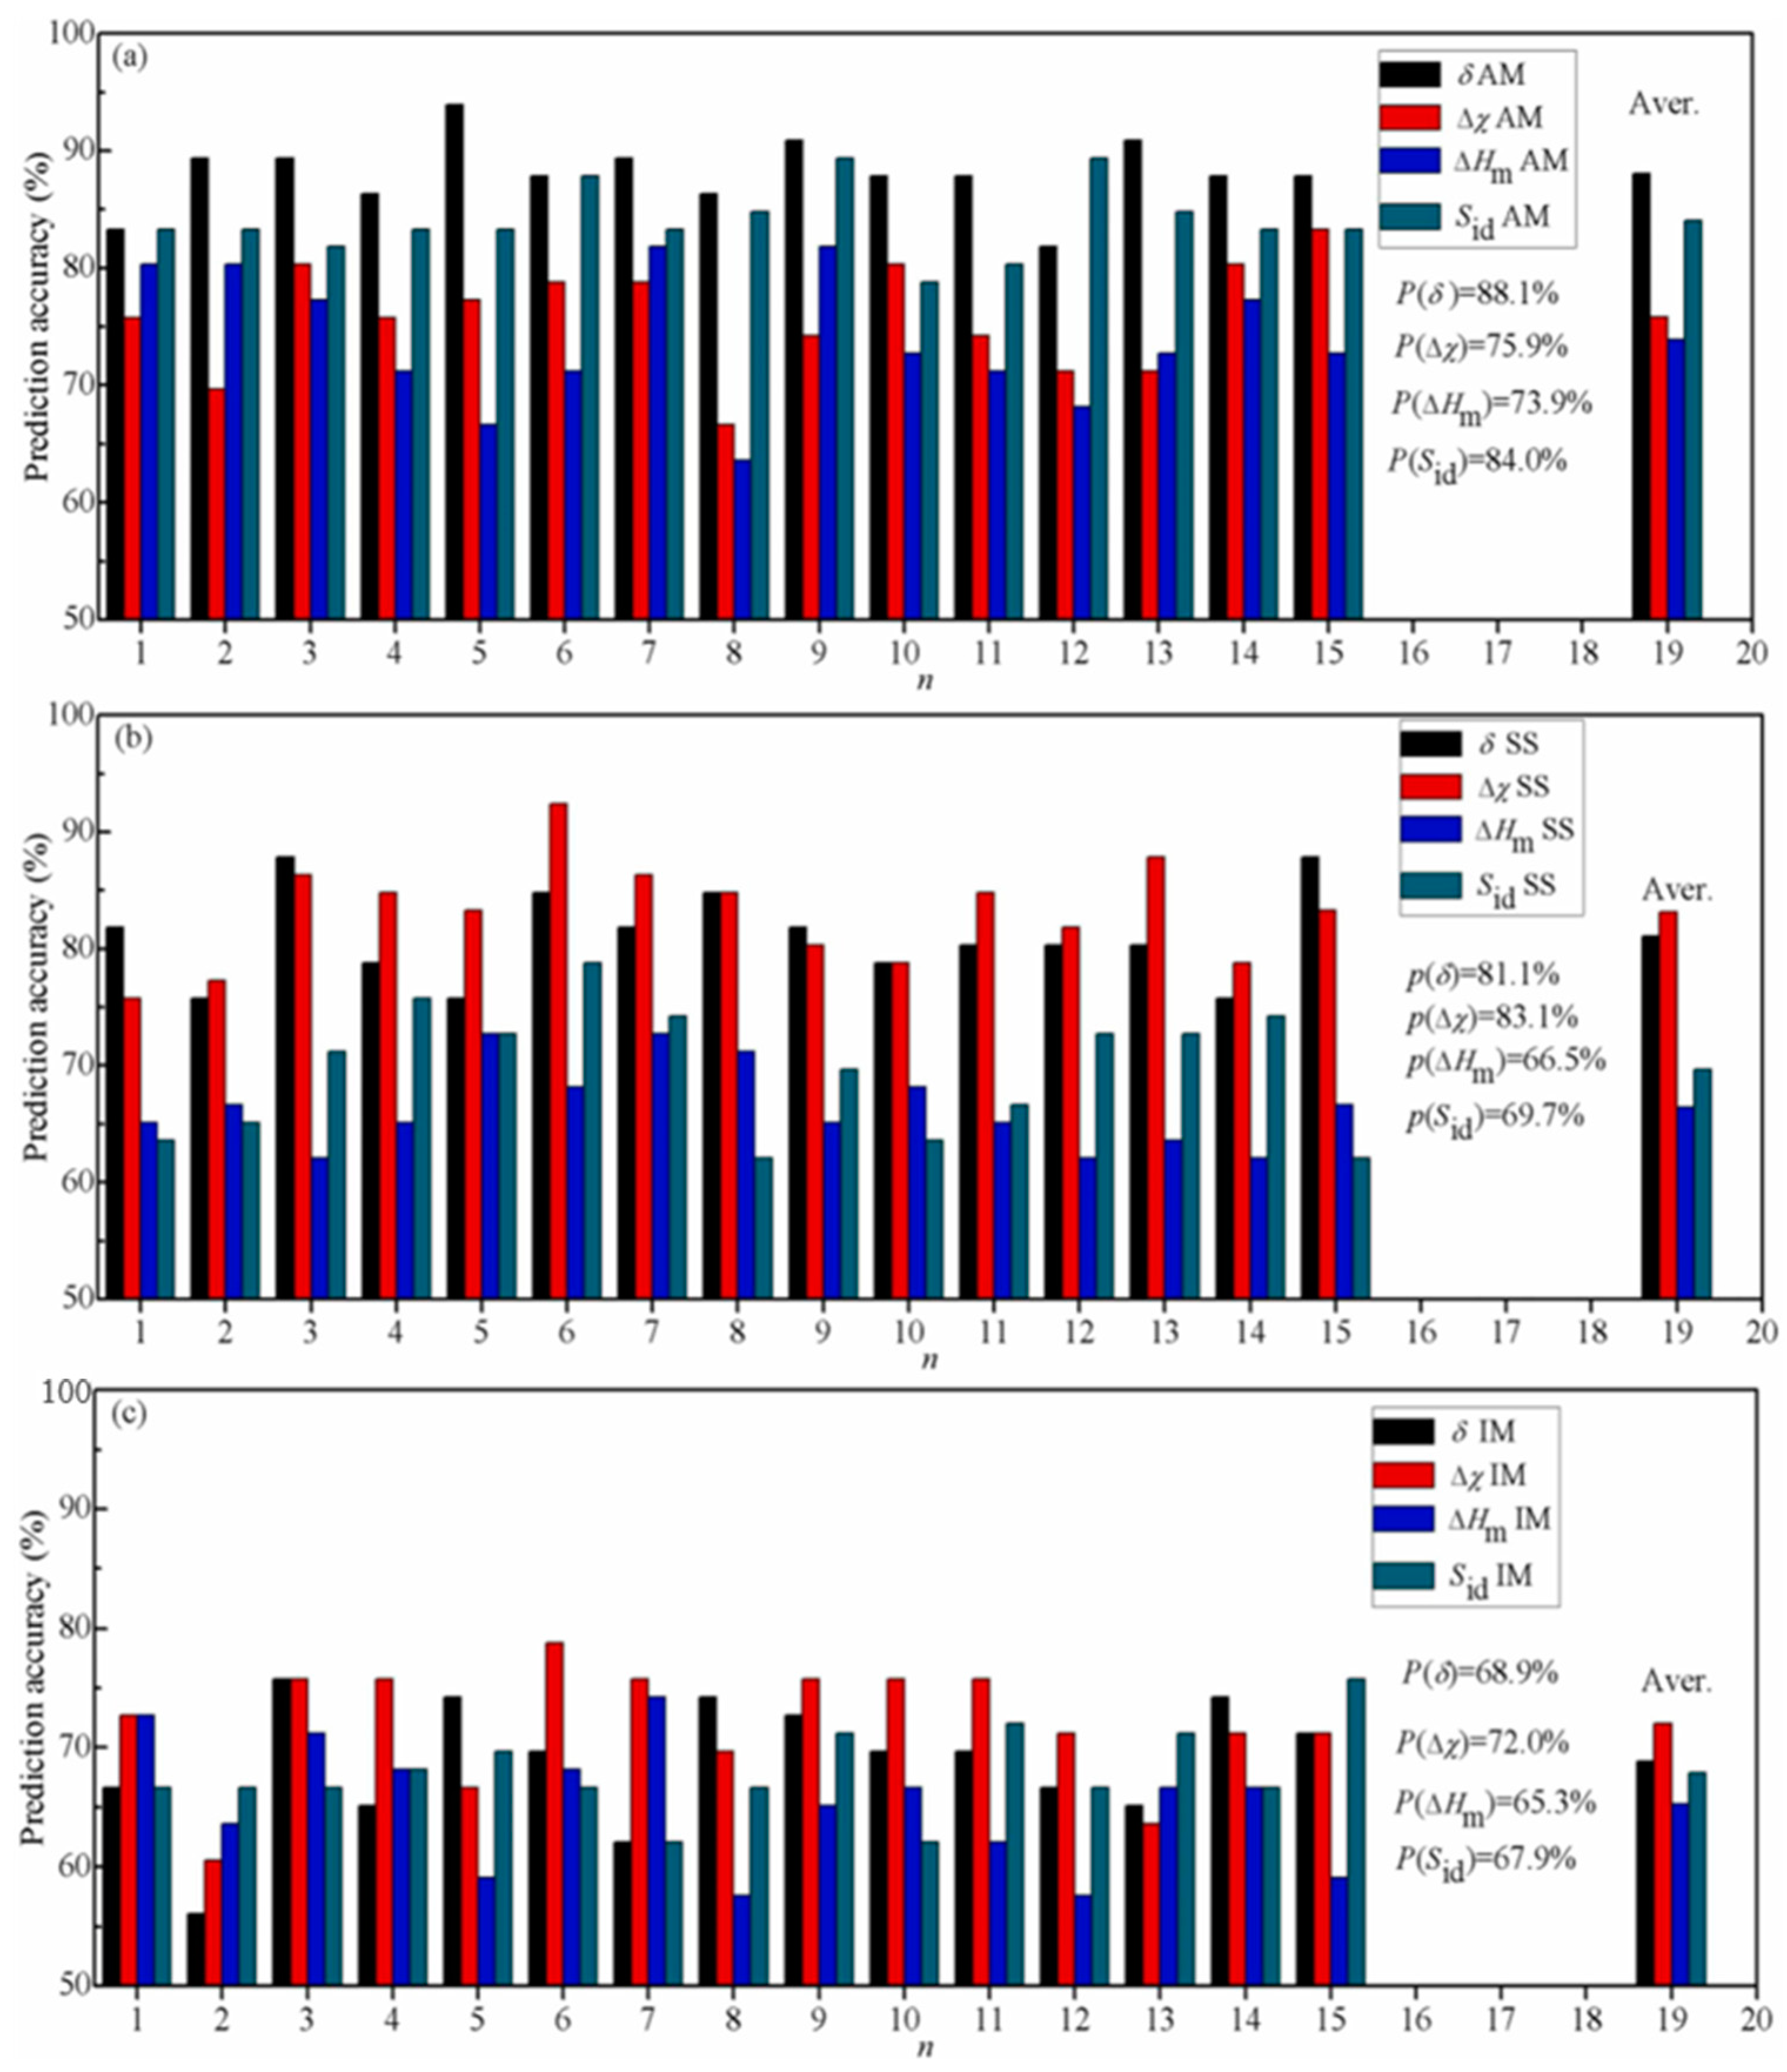
Figure 4.
“Probability” to produce different constitutions as a function of alloy rank: (a) PI(HEA), (b) PF(HEA). Blue bubbles represent HEAs, green bubbles represent solid solutions with more than one phase, and red bubbles represent (a) other alloys or (b) non-HEAs. Reprinted with permission from Ref. [36]. Copyright Elsevier (2017).
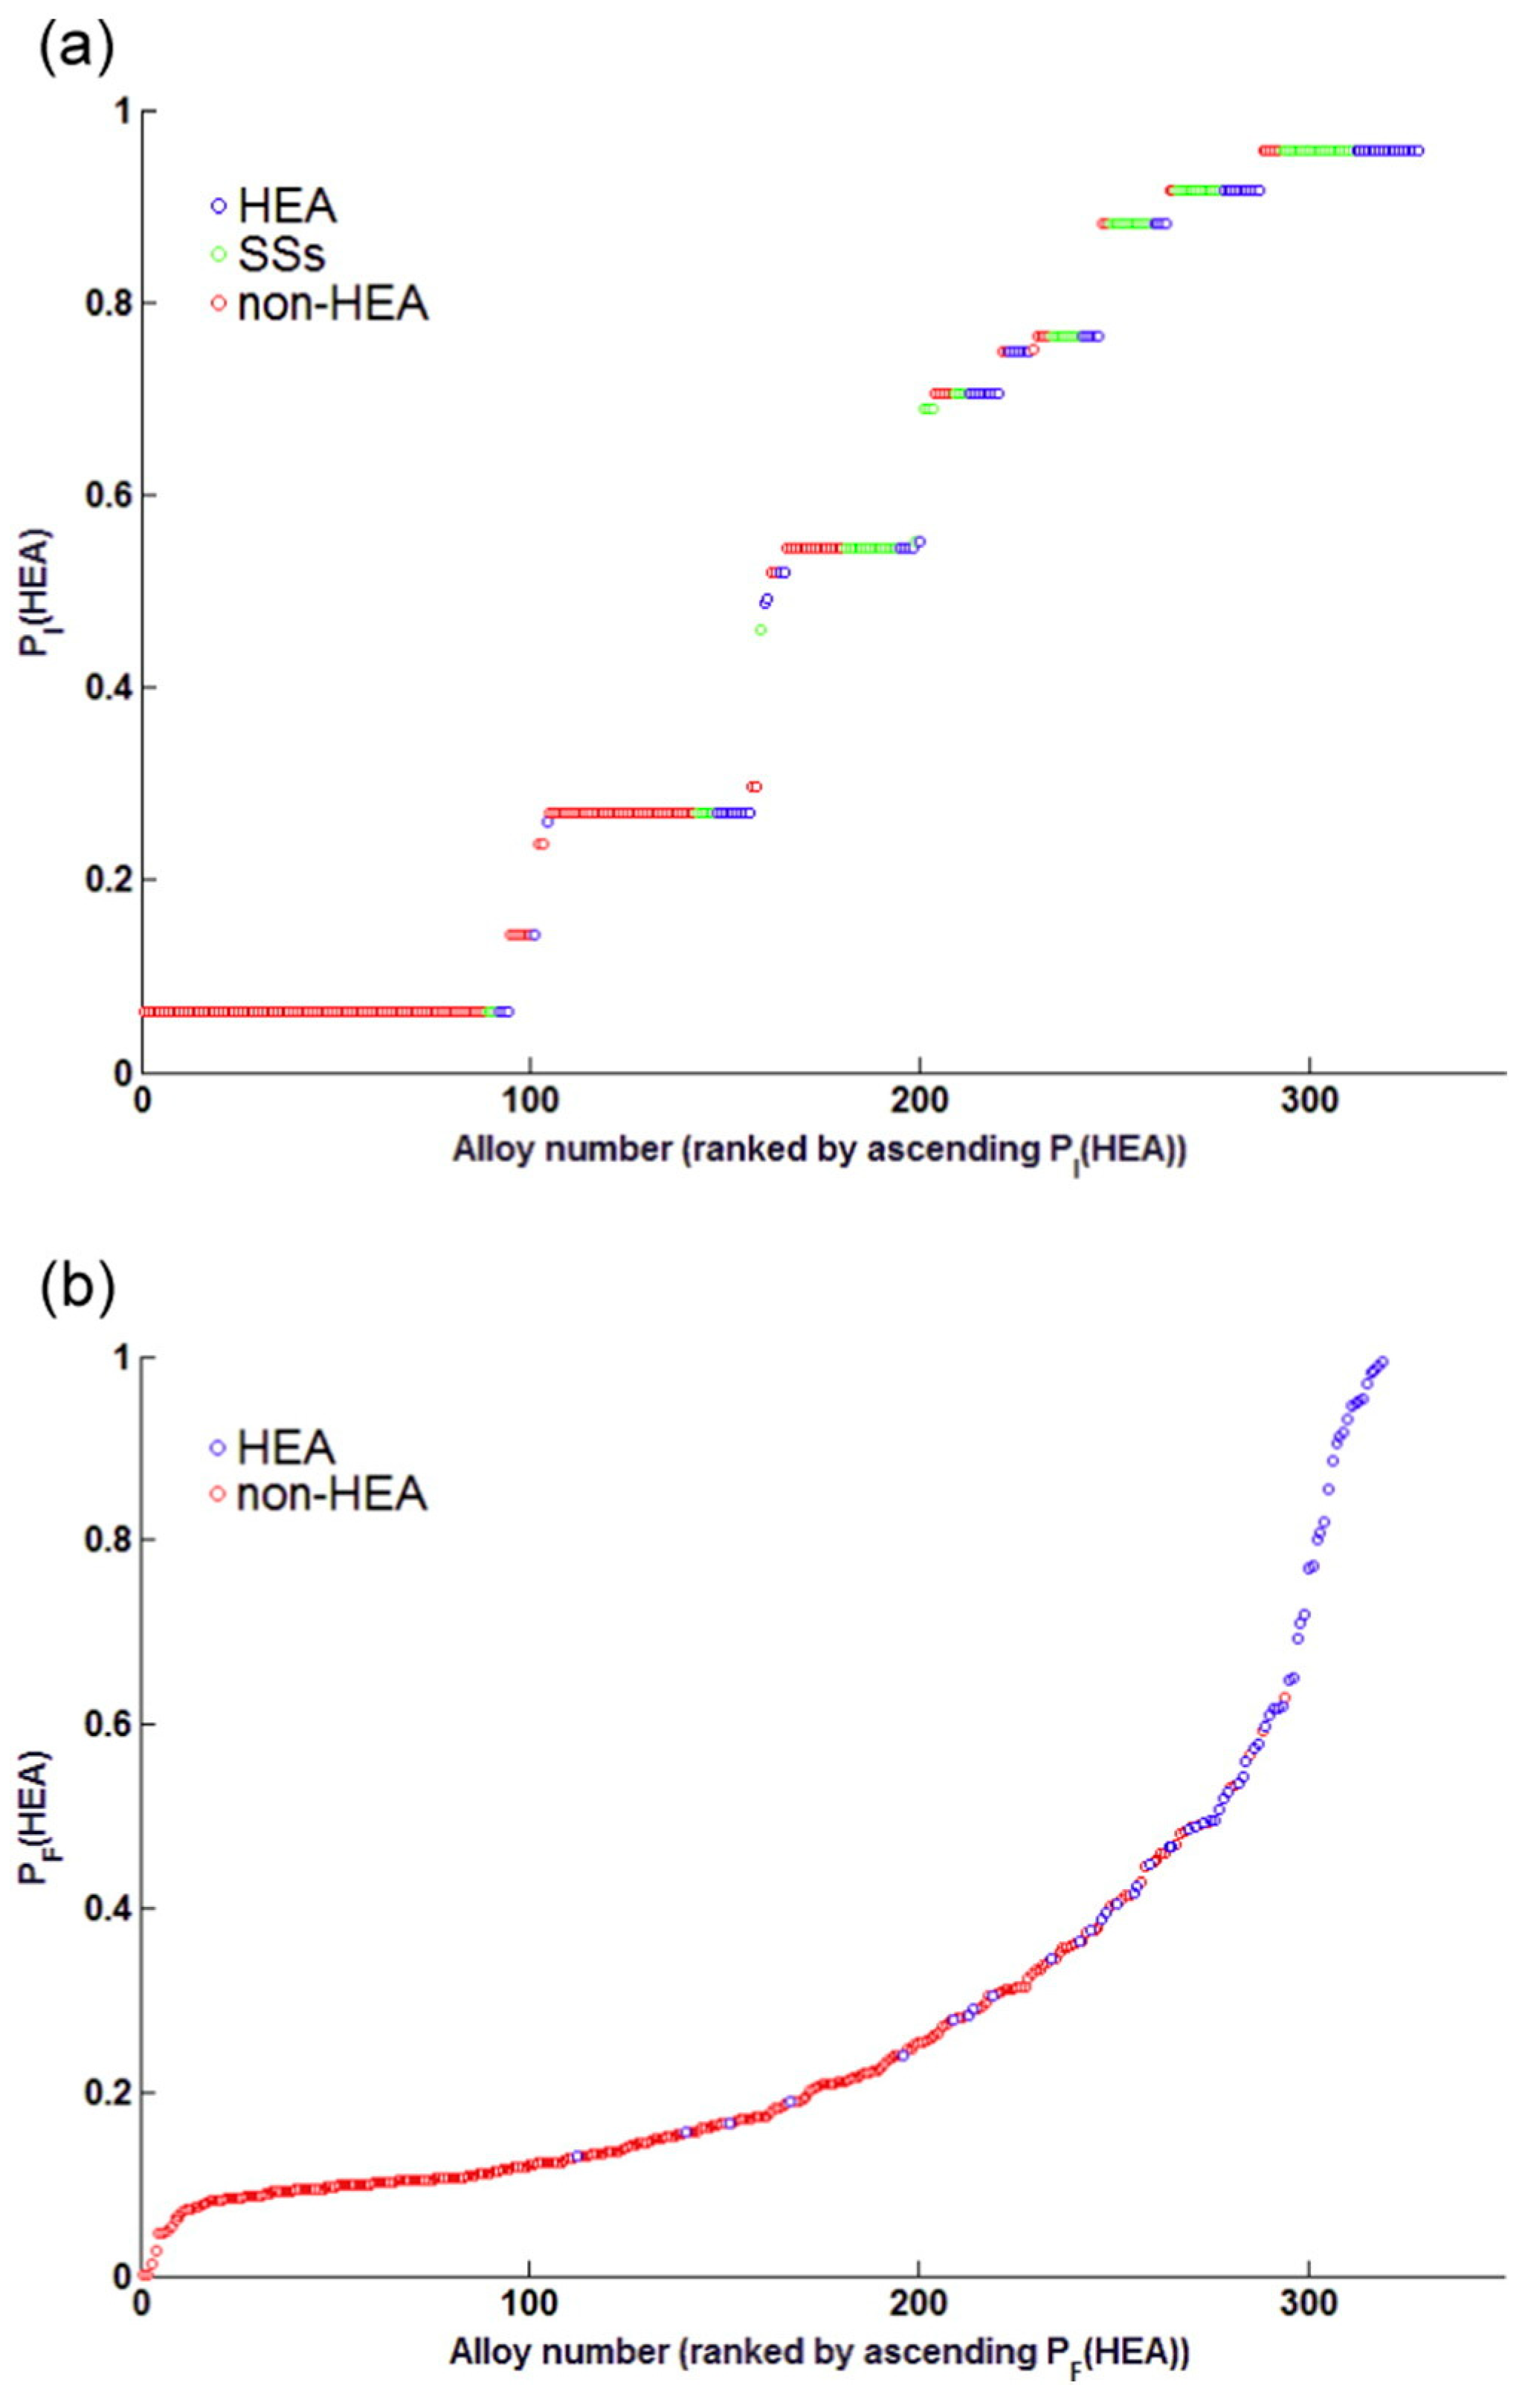
Figure 5.
An example of the proposed method for phase prediction in HEAs. We (a) extracted the related features/descriptors from the HEA database, and then (b) created an interaction network based on the similarities between HEAs. (c) In this example, the ZrHfTiCuNi alloy is considered as a phase prediction sample; hence, the related community of this HEA is extracted from the interaction network. (d) The ZrHfTiCuNi has four neighbors; therefore, three of them were selected, which are highlighted in dark blue if k is three. (e) Finally, the phase can be predicted by voting on neighbors’ labels as Amorphous for ZrHfTiCuNi. Reprinted with permission from Ref. [65]. Copyright MDPI (2022).
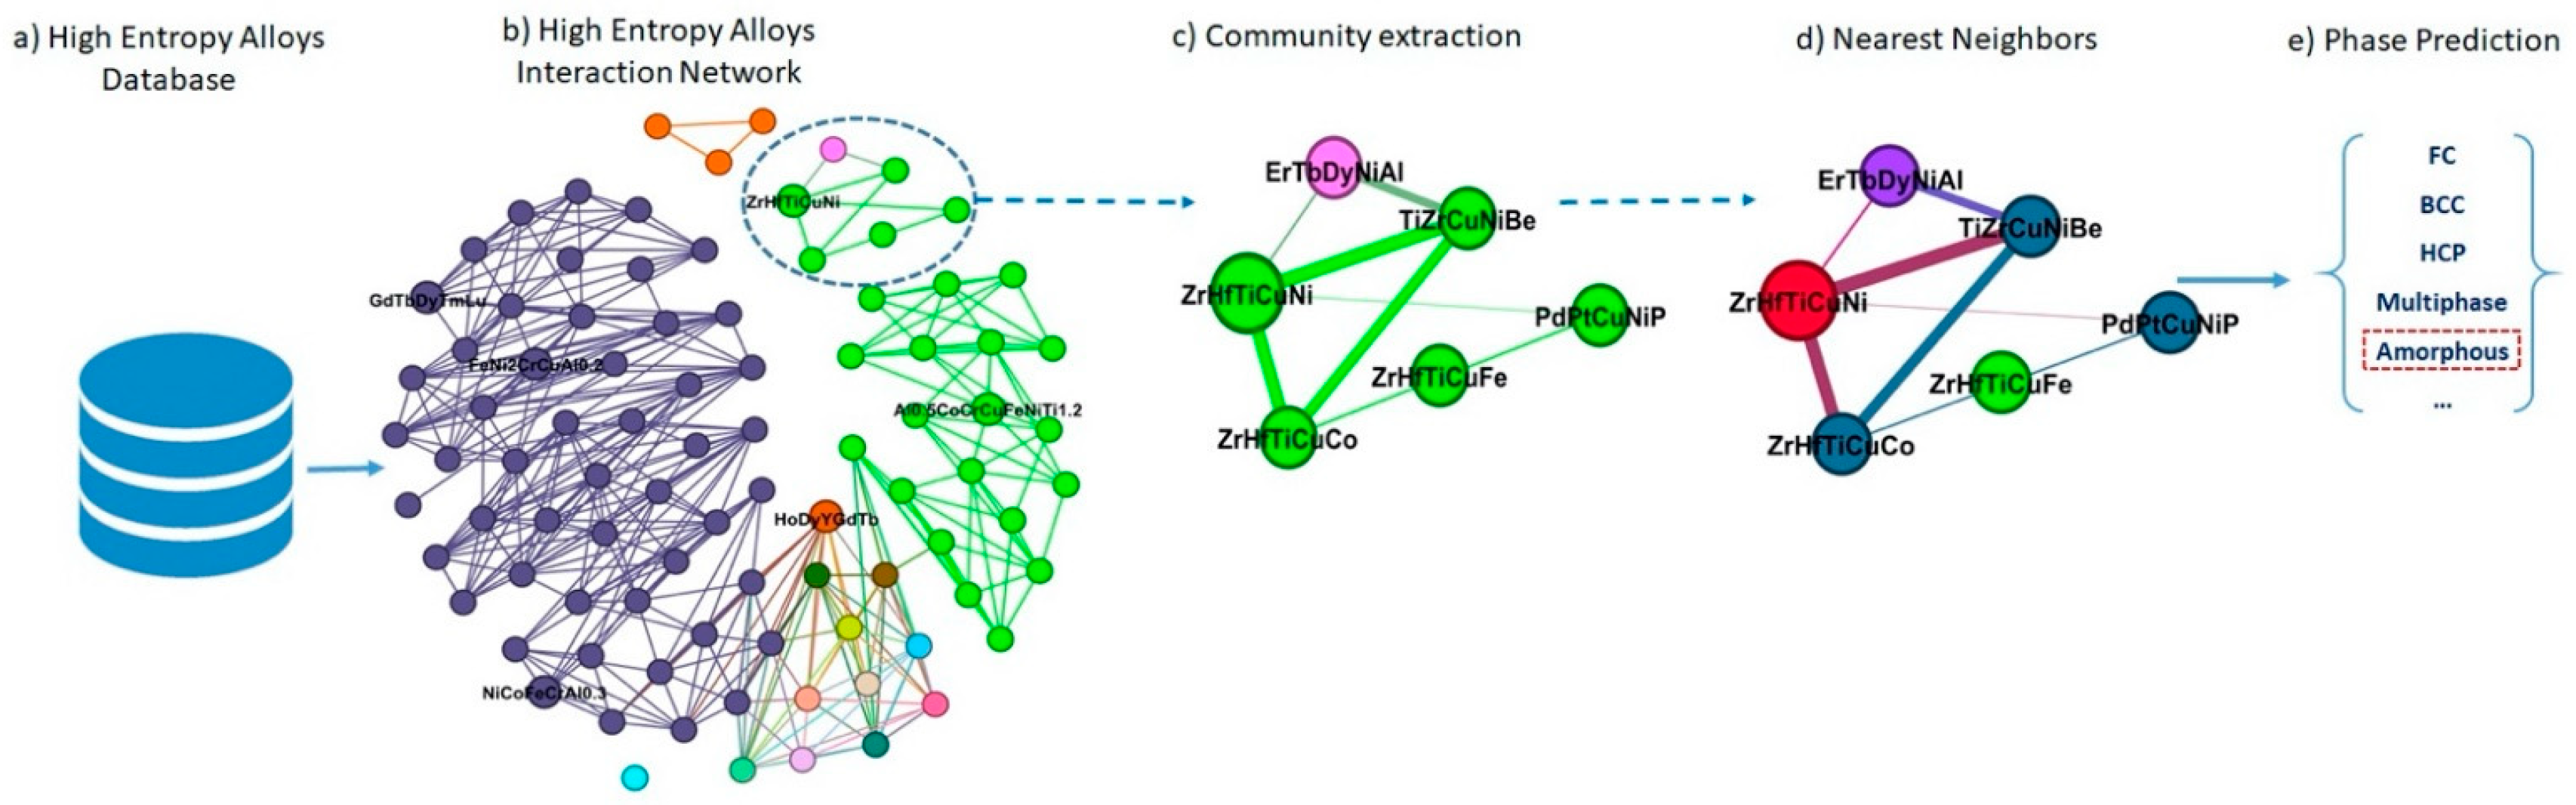
Figure 6.
(a) Scatter plot for design parameters used for HEA prediction, (b) heatmap of alloys with SS + IM phases, (c) radar plot of design parameters considered for the current study for the alloys with SS + IM phases. Reprinted with permission from Ref. [90]. Copyright Elsevier (2021).
Figure 6.
(a) Scatter plot for design parameters used for HEA prediction, (b) heatmap of alloys with SS + IM phases, (c) radar plot of design parameters considered for the current study for the alloys with SS + IM phases. Reprinted with permission from Ref. [90]. Copyright Elsevier (2021).
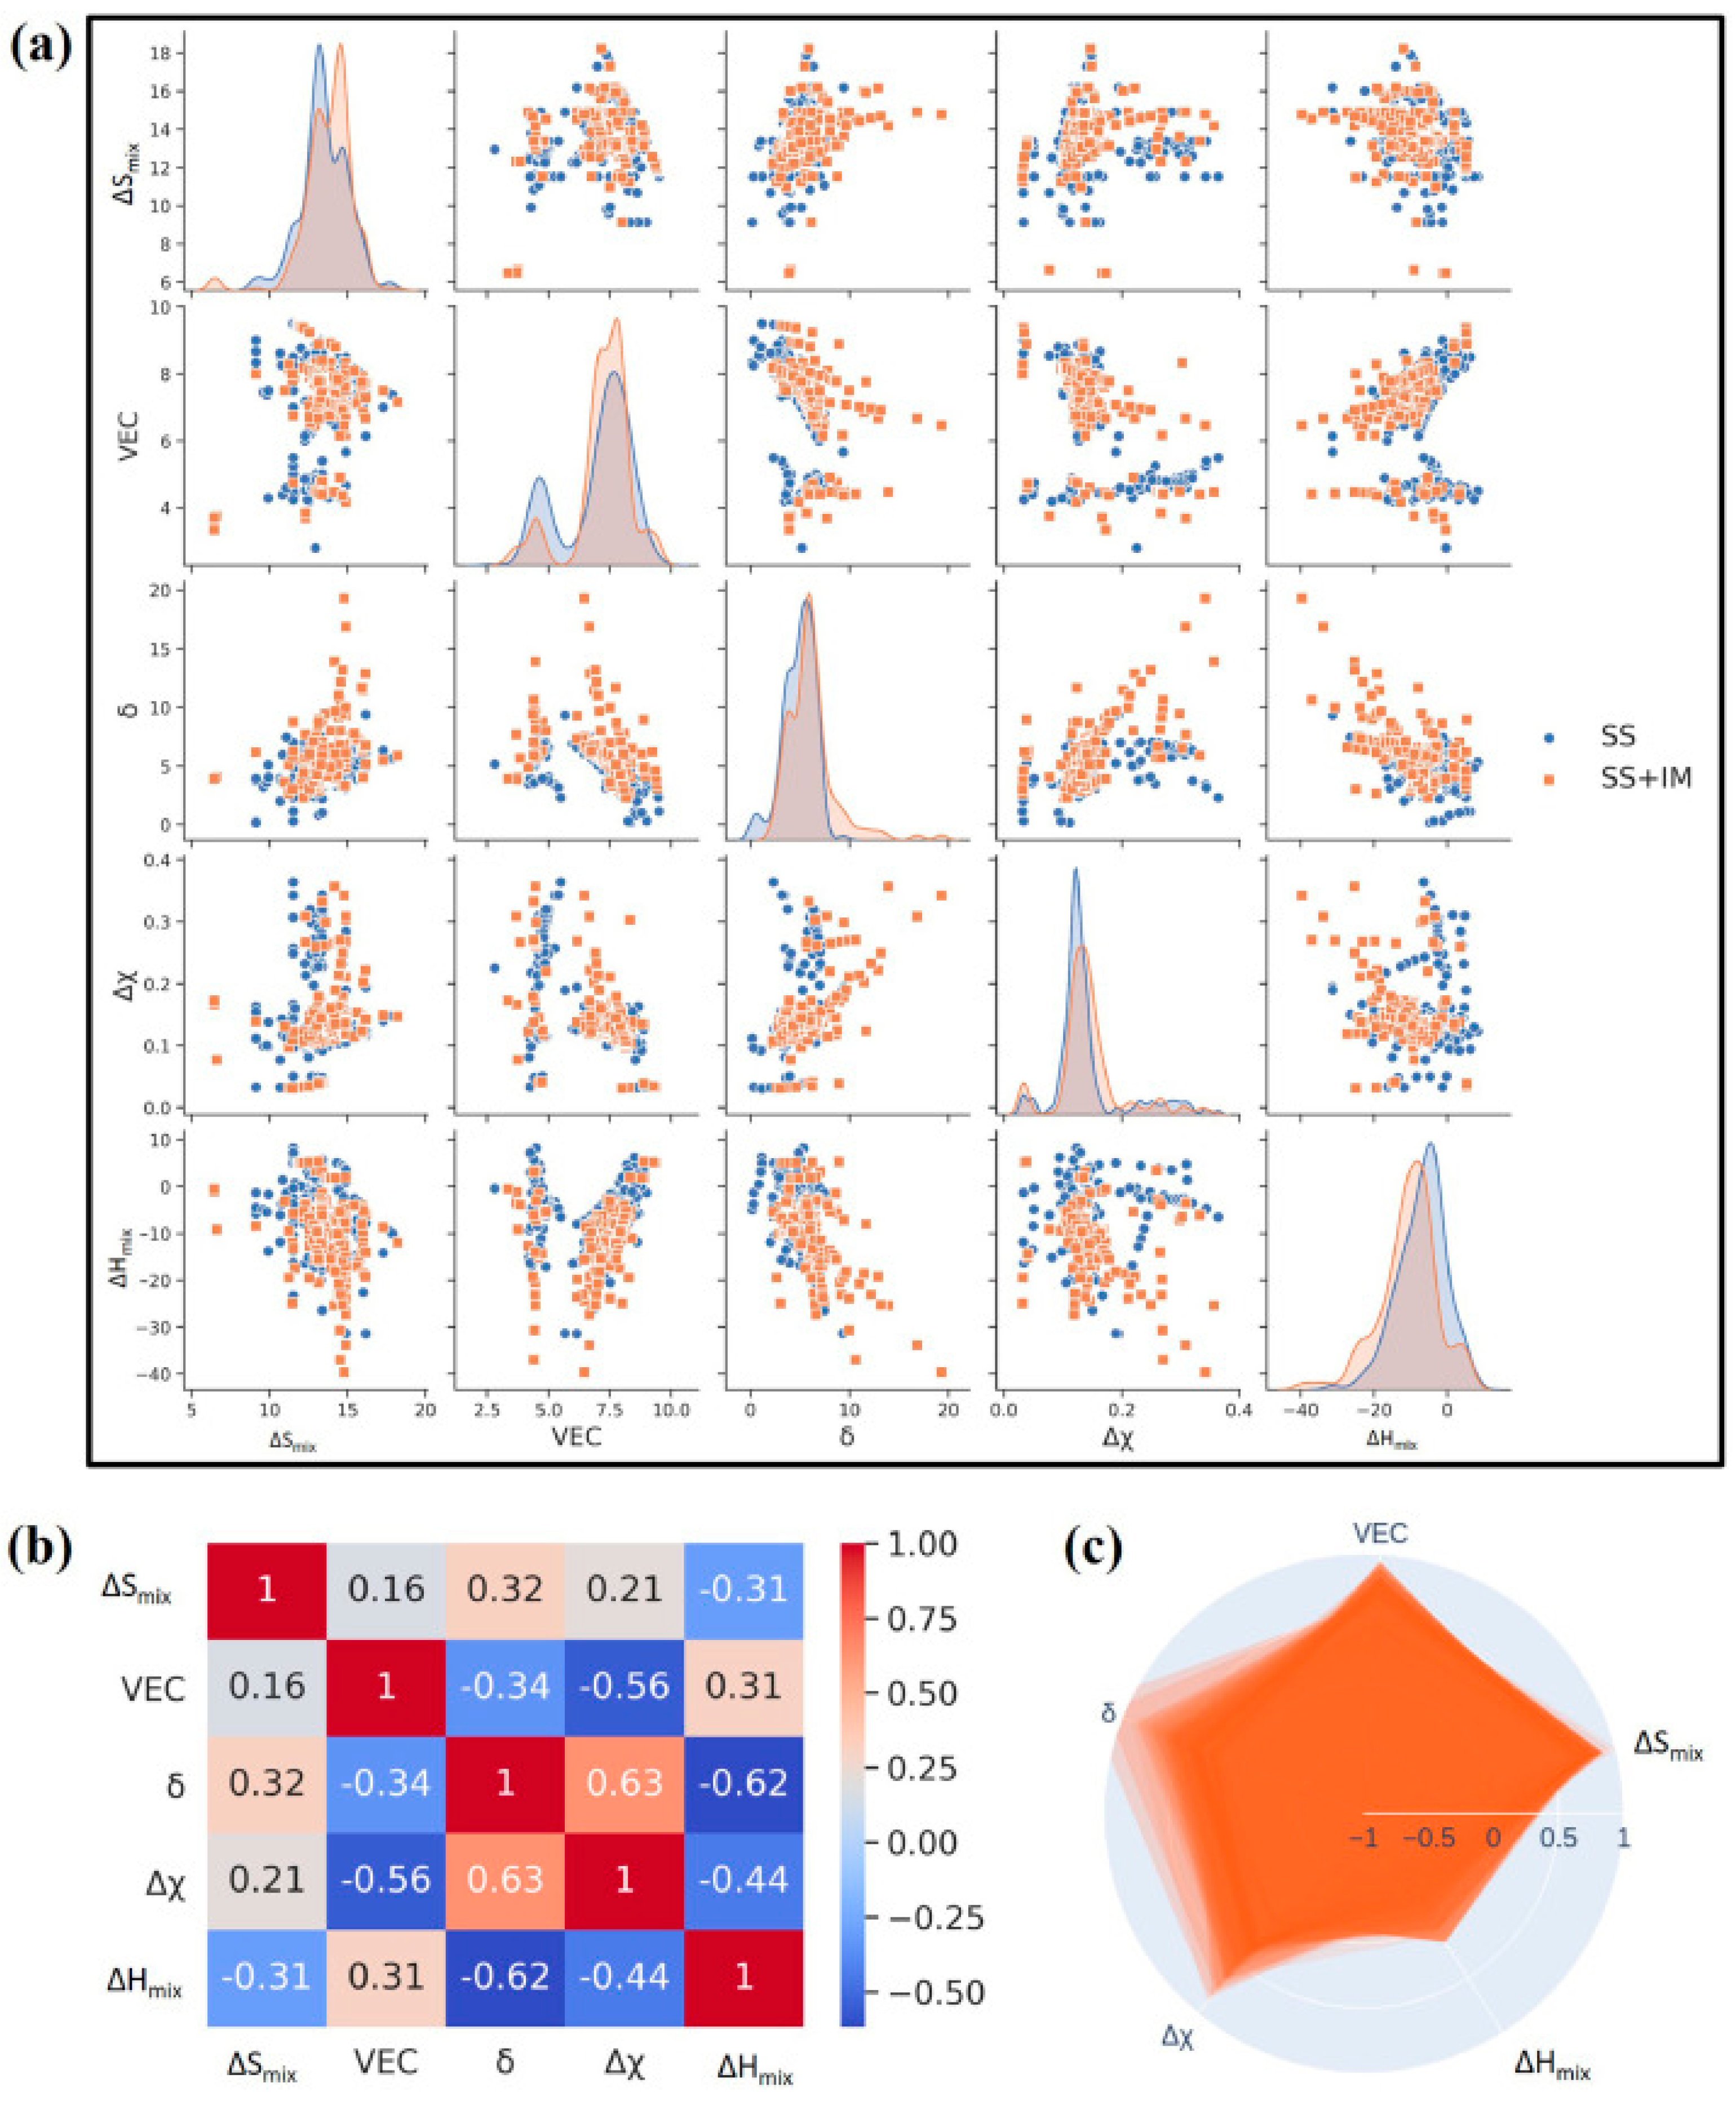
Figure 7.
Diagram showing a typical relationship between the number of errors in the training and test datasets, and the overall duration of neural network training (Point A represents the point at which the error is minimal in the test set, while point B represents the point at which the error is minimal in the training set.). Reprinted with permission from Ref. [92]. Copyright Elsevier (1996).
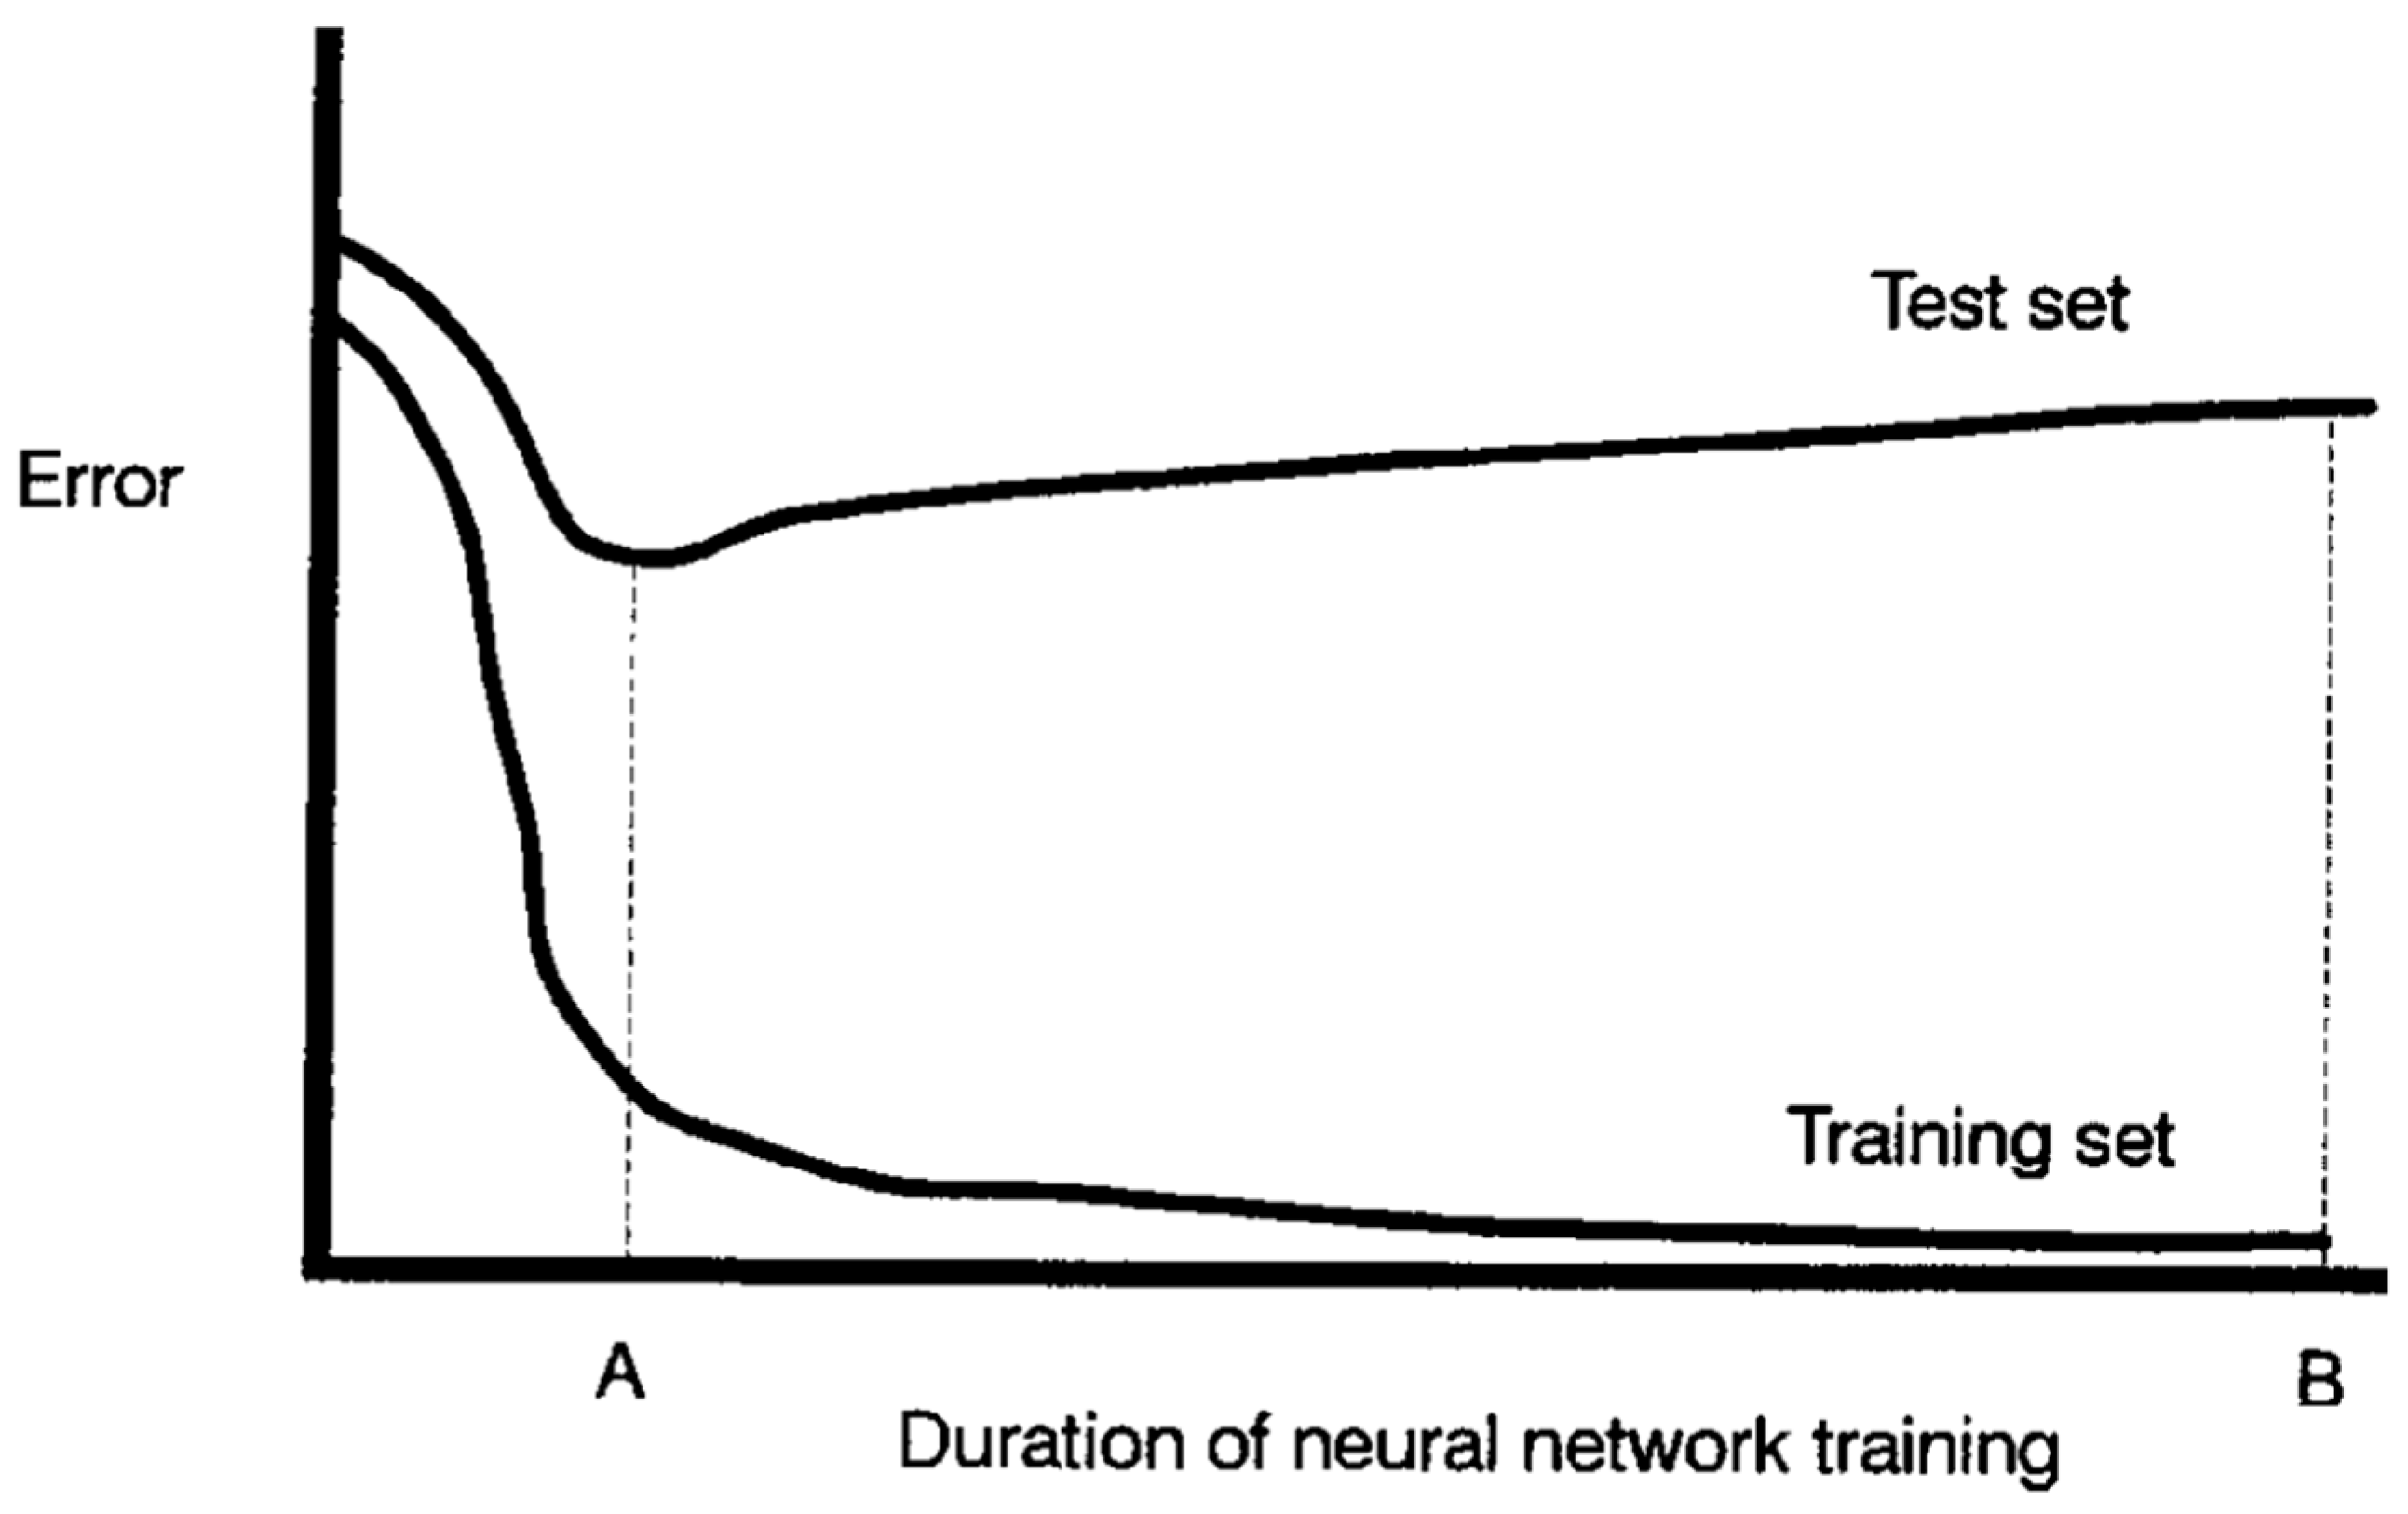
Figure 8.
The valence electron concentration (VEC)-constrained active learning loop for HEA design. The loop includes dataset establishment, model training, domain knowledge application, alloy design, experimental validation, and feedback. Adapted with permission from Ref. [100]. UTS means ultimate tensile strength. Copyright Elsevier (2022).
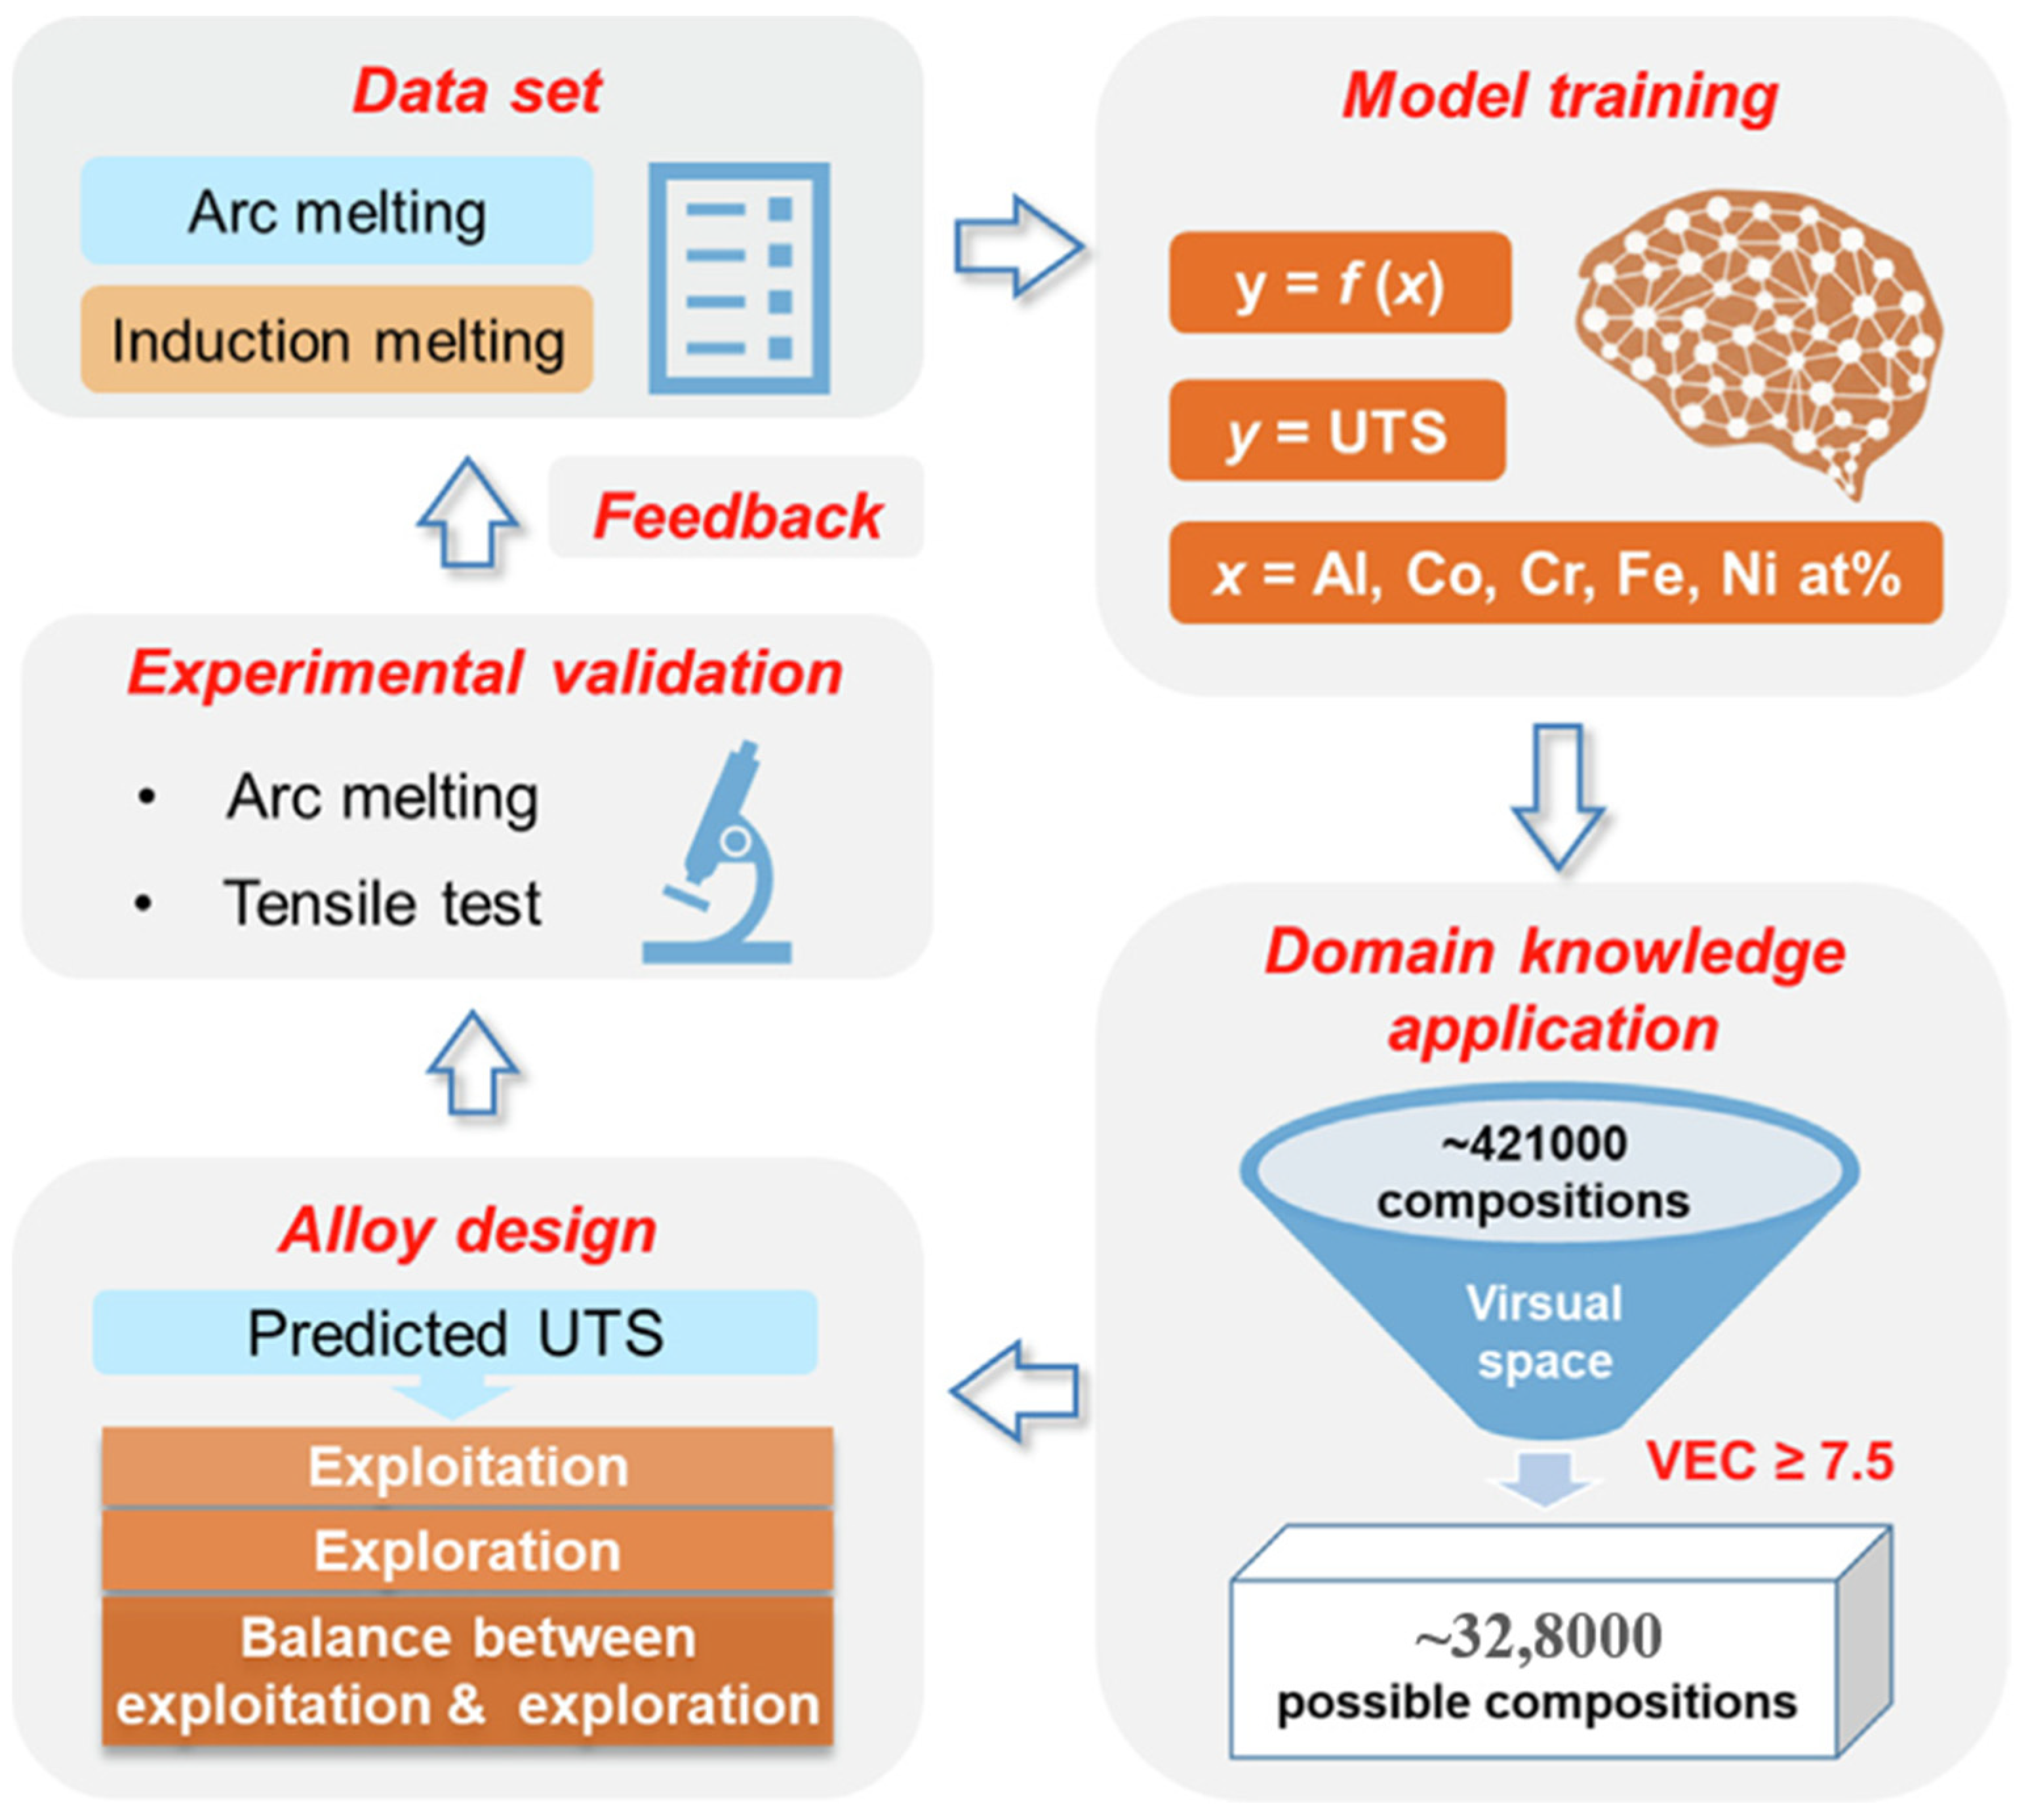
Figure 9.
Contour plots for grain size at different combinations of processing parameters. Speed is held constant at (a) 150, (b) 200, (c) 250, (d) 300, (e) 350, and (f) 400 rpm. Reprinted with permission from Ref. [104]. Copyright Elsevier (2023).
Figure 9.
Contour plots for grain size at different combinations of processing parameters. Speed is held constant at (a) 150, (b) 200, (c) 250, (d) 300, (e) 350, and (f) 400 rpm. Reprinted with permission from Ref. [104]. Copyright Elsevier (2023).
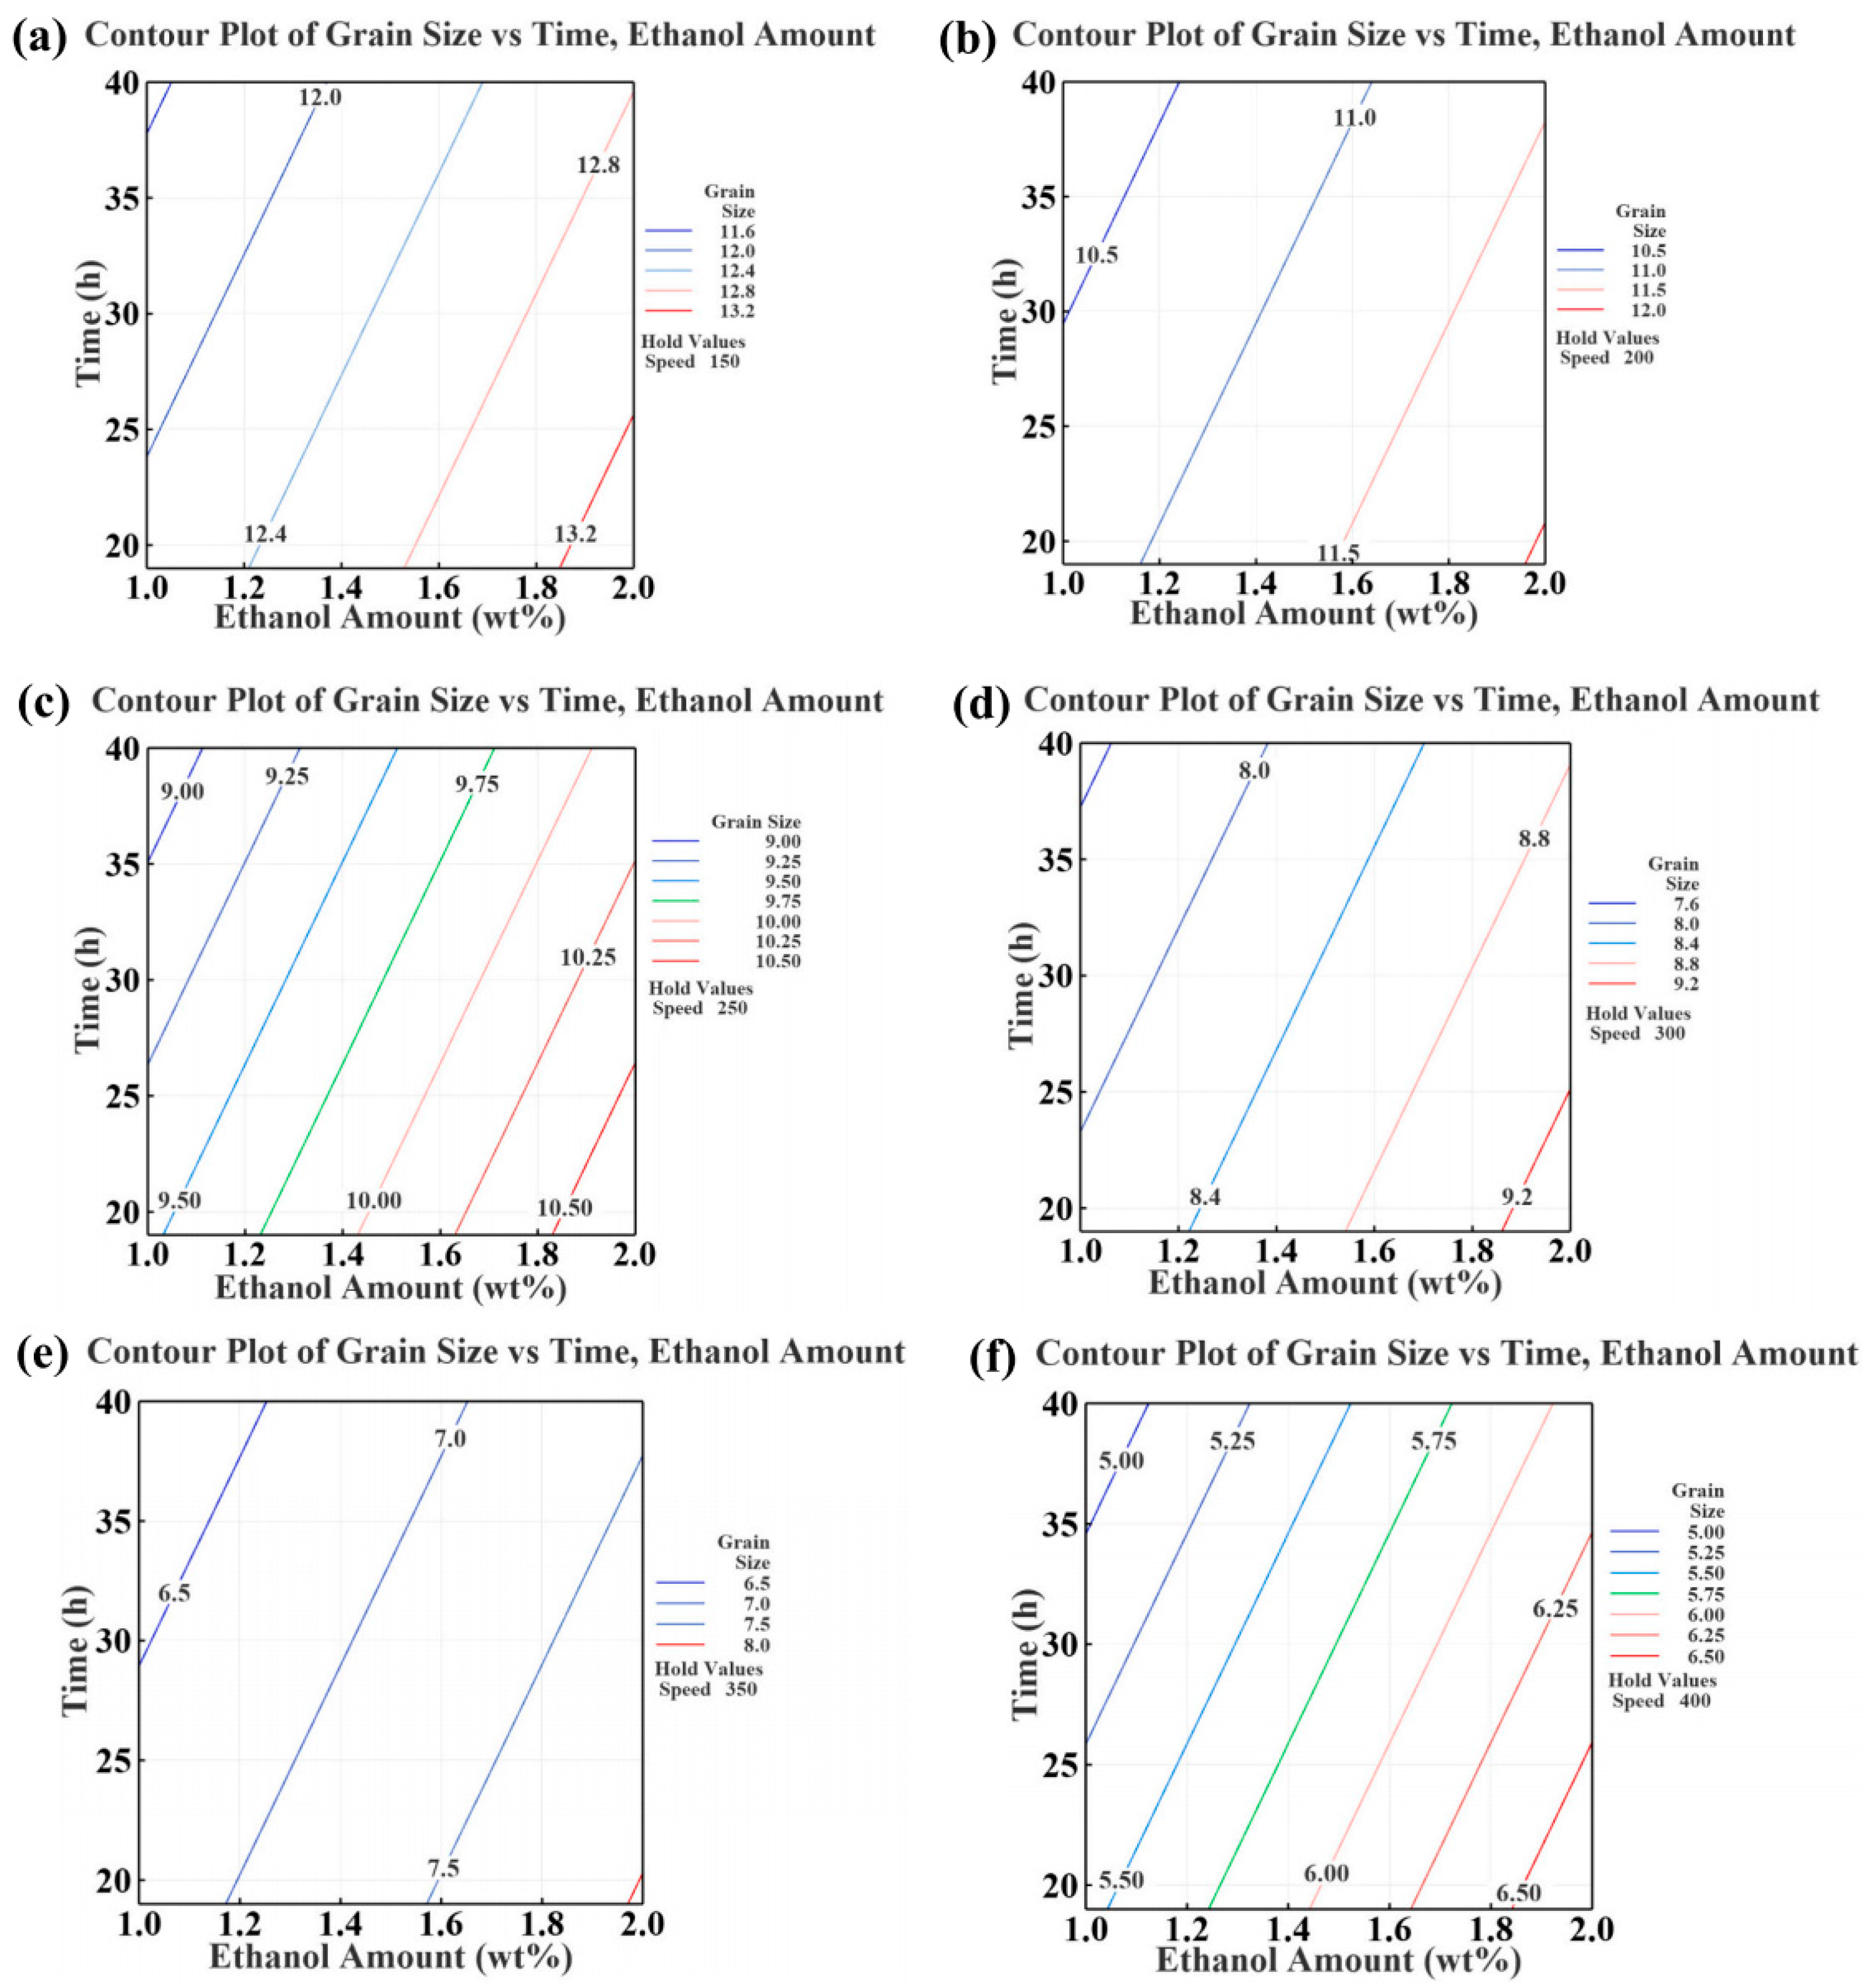
Figure 10.
Schematic diagram of the DNN model for the phase formation prediction of HEAs. (a) A deep neural network is made up of an input layer, multiple hidden layers, and one output layer. (b) Random interconnections of neurons in the hidden layers are regulated by the dropout technique. Reprinted with permission from Ref. [108]. Copyright Elsevier (2022).
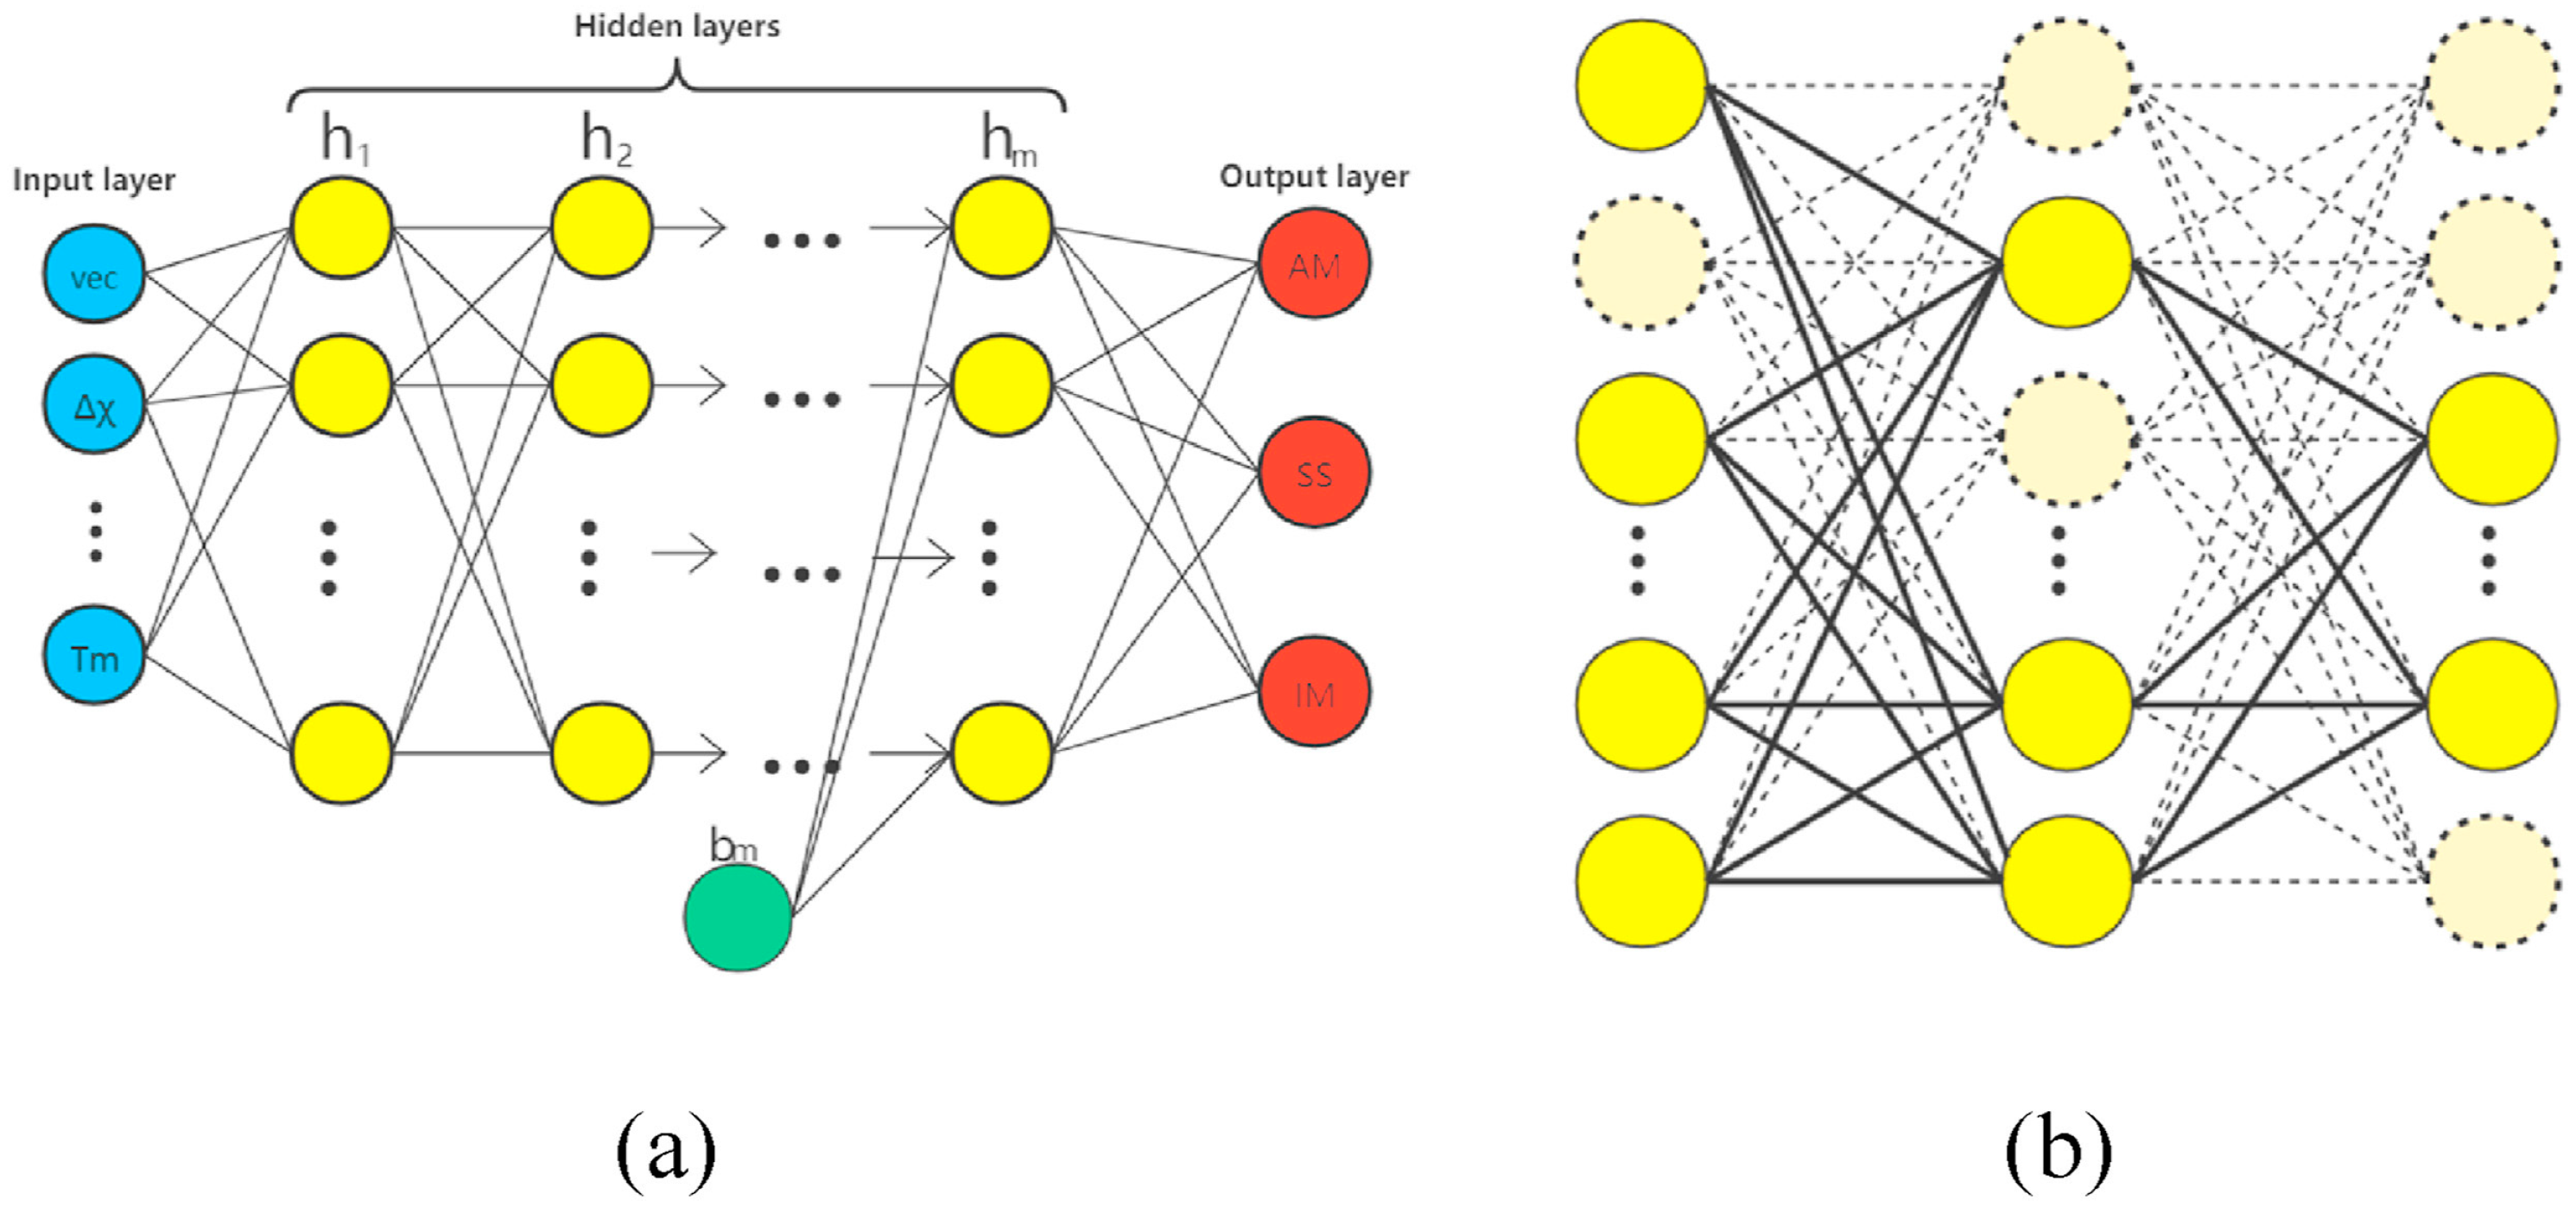
Figure 11.
(a) Schematic diagram for mapping the chemical formula of a material into a 2D representation with periodic table structure, i.e., a 2D pseudo-image. (b) The CNN trained on a big dataset to obtain the transferable feature extractor. (c) The workflow of TL. Conv, FC, OQMD, CNN, SNN, RF, SVM denote convolutional operation, fully connected layer, open quantum materials database, convolutional neural network, shallow neural network, random forest, supported vector machine, respectively. Reprinted with permission from Ref. [110]. Copyright Elsevier (2021).
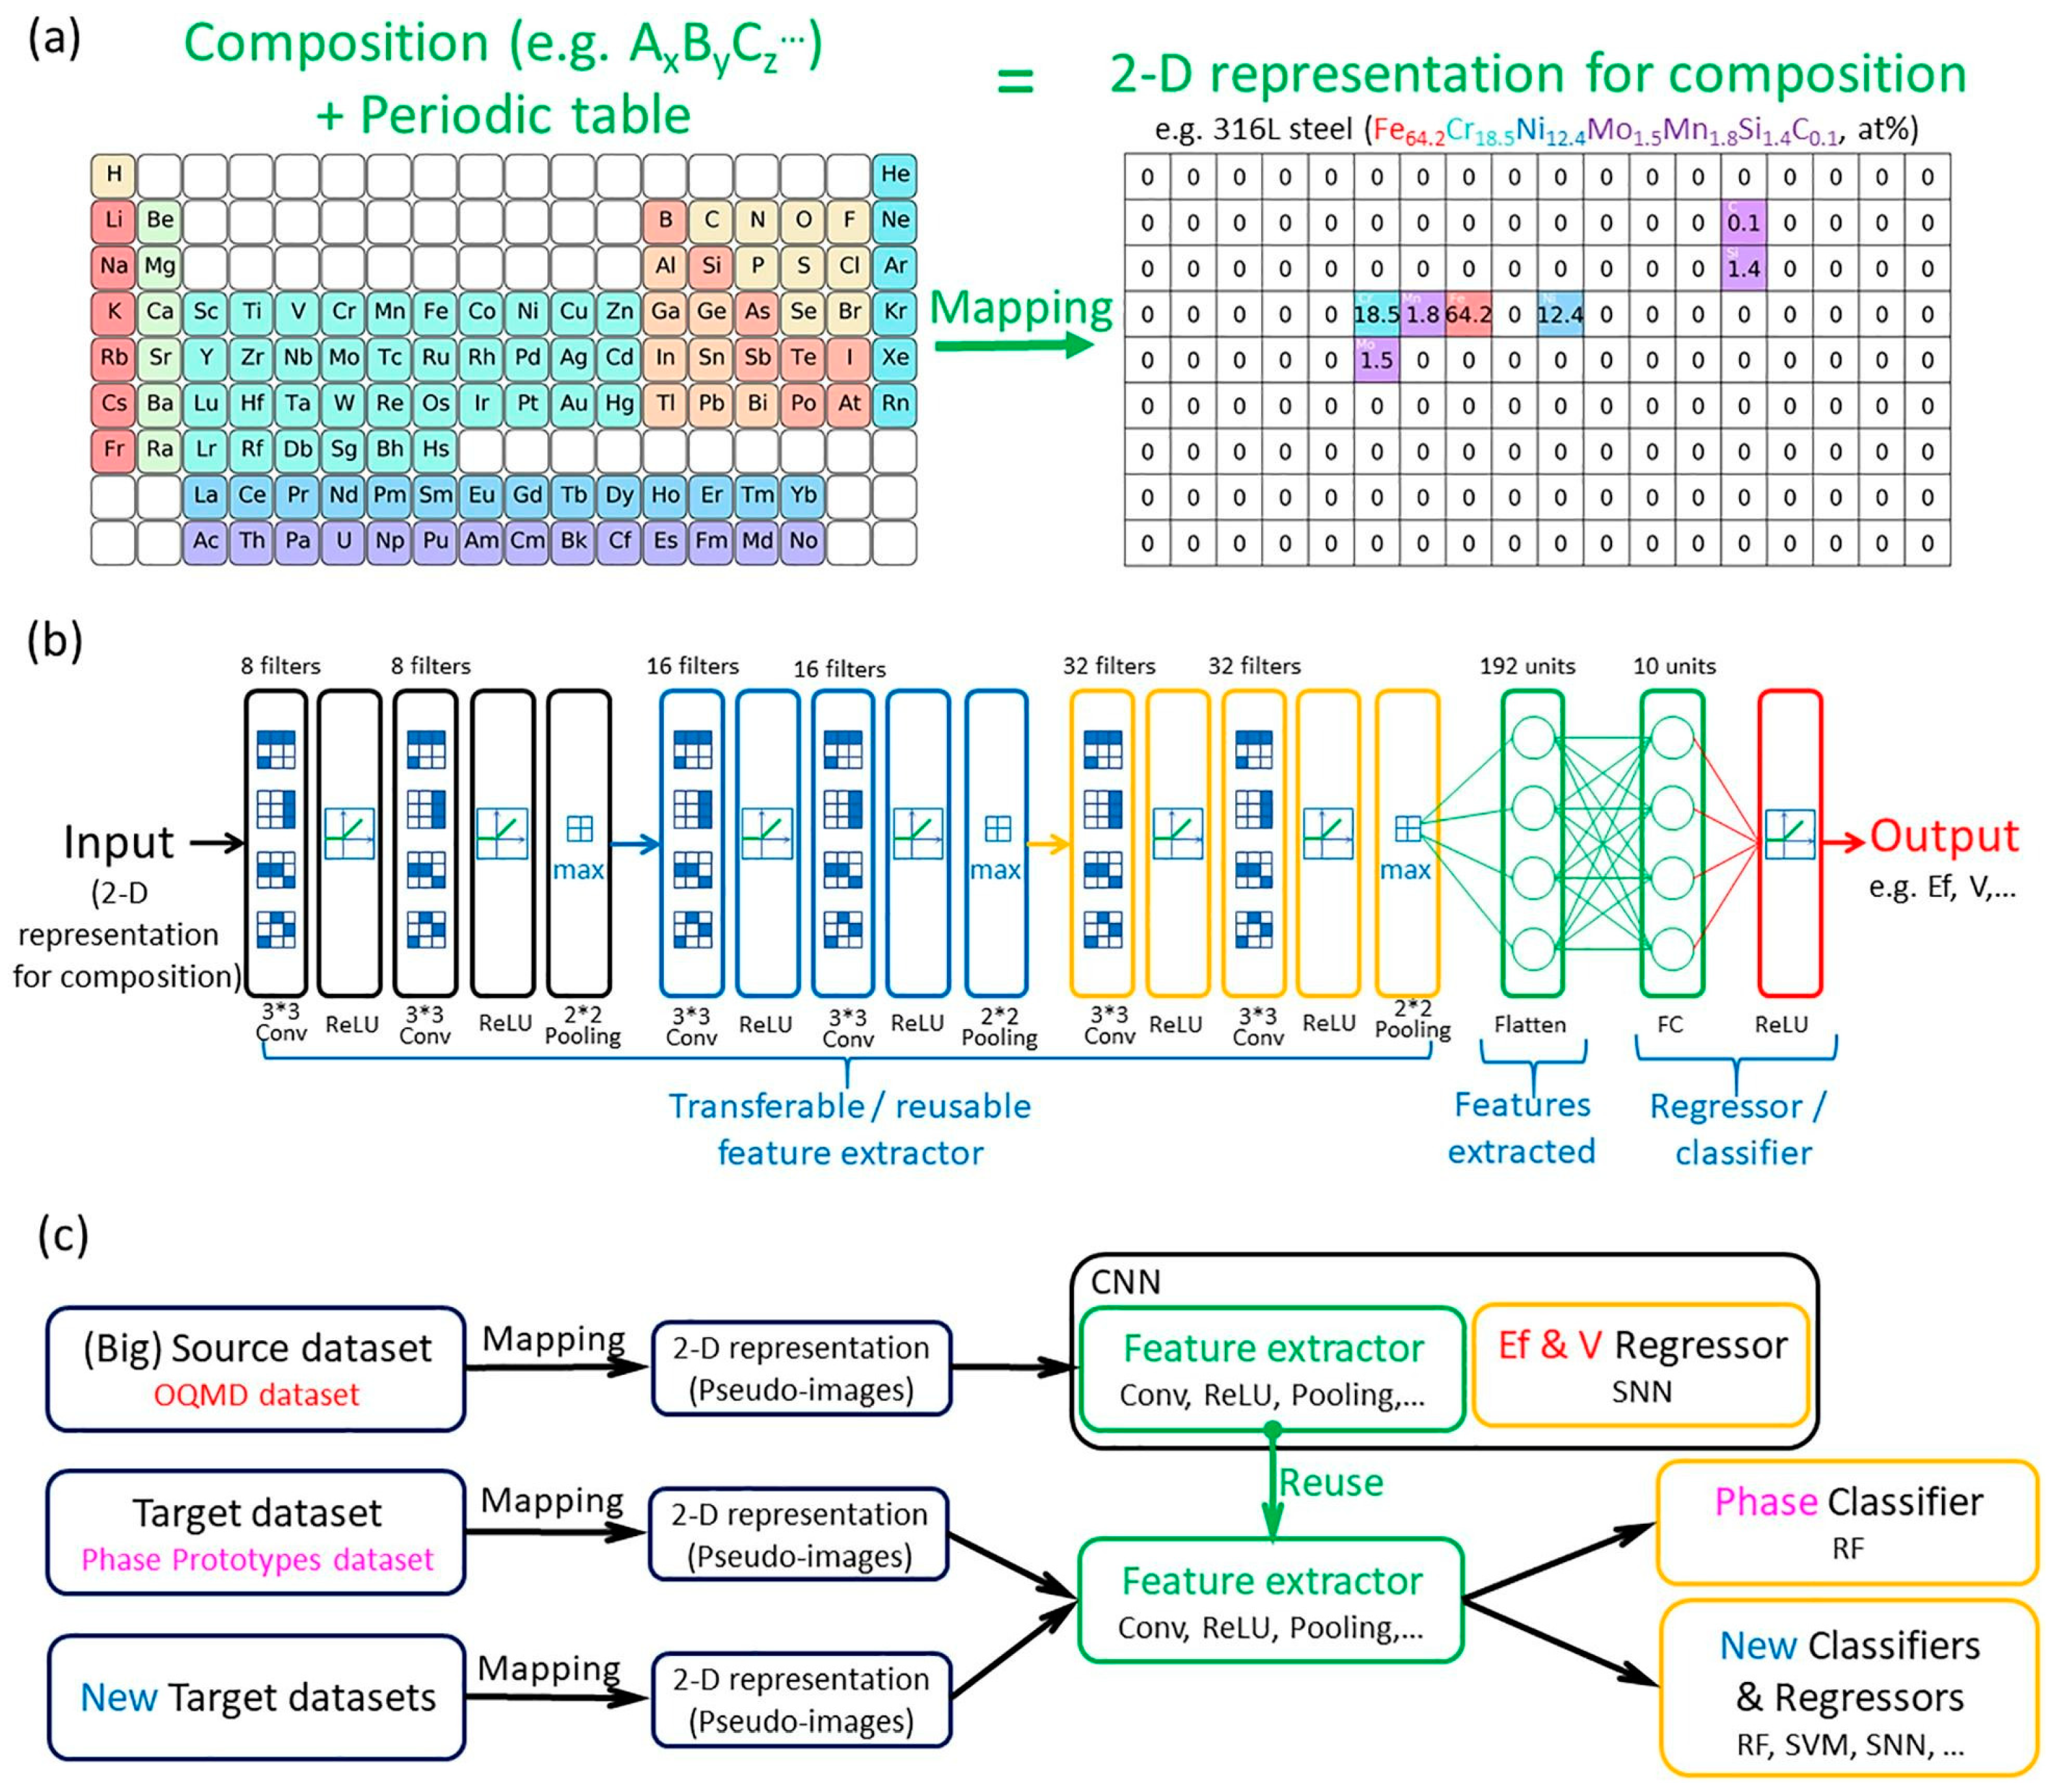
Figure 12.
The architecture of the ECNet model. The embedding layer is used to encode initial inputs from the atomic numbers. In the interaction block, a series of neural networks is used to transform the crystal structures into atomic attributes. The elemental convolution operation takes average values of atom-wise features according to the atomic element type. Reprinted with permission from Ref. [111]. Copyright Springer Nature (2022).

Figure 13.
Schematic diagram of the deep neural network: (a) an architecture of DNN model comprised of input, hidden, and output layers, and (b) dropout regularization method that controls the connection of the neurons in the hidden layers. Reprinted with permission from Ref. [29]. Copyright Elsevier (2021).
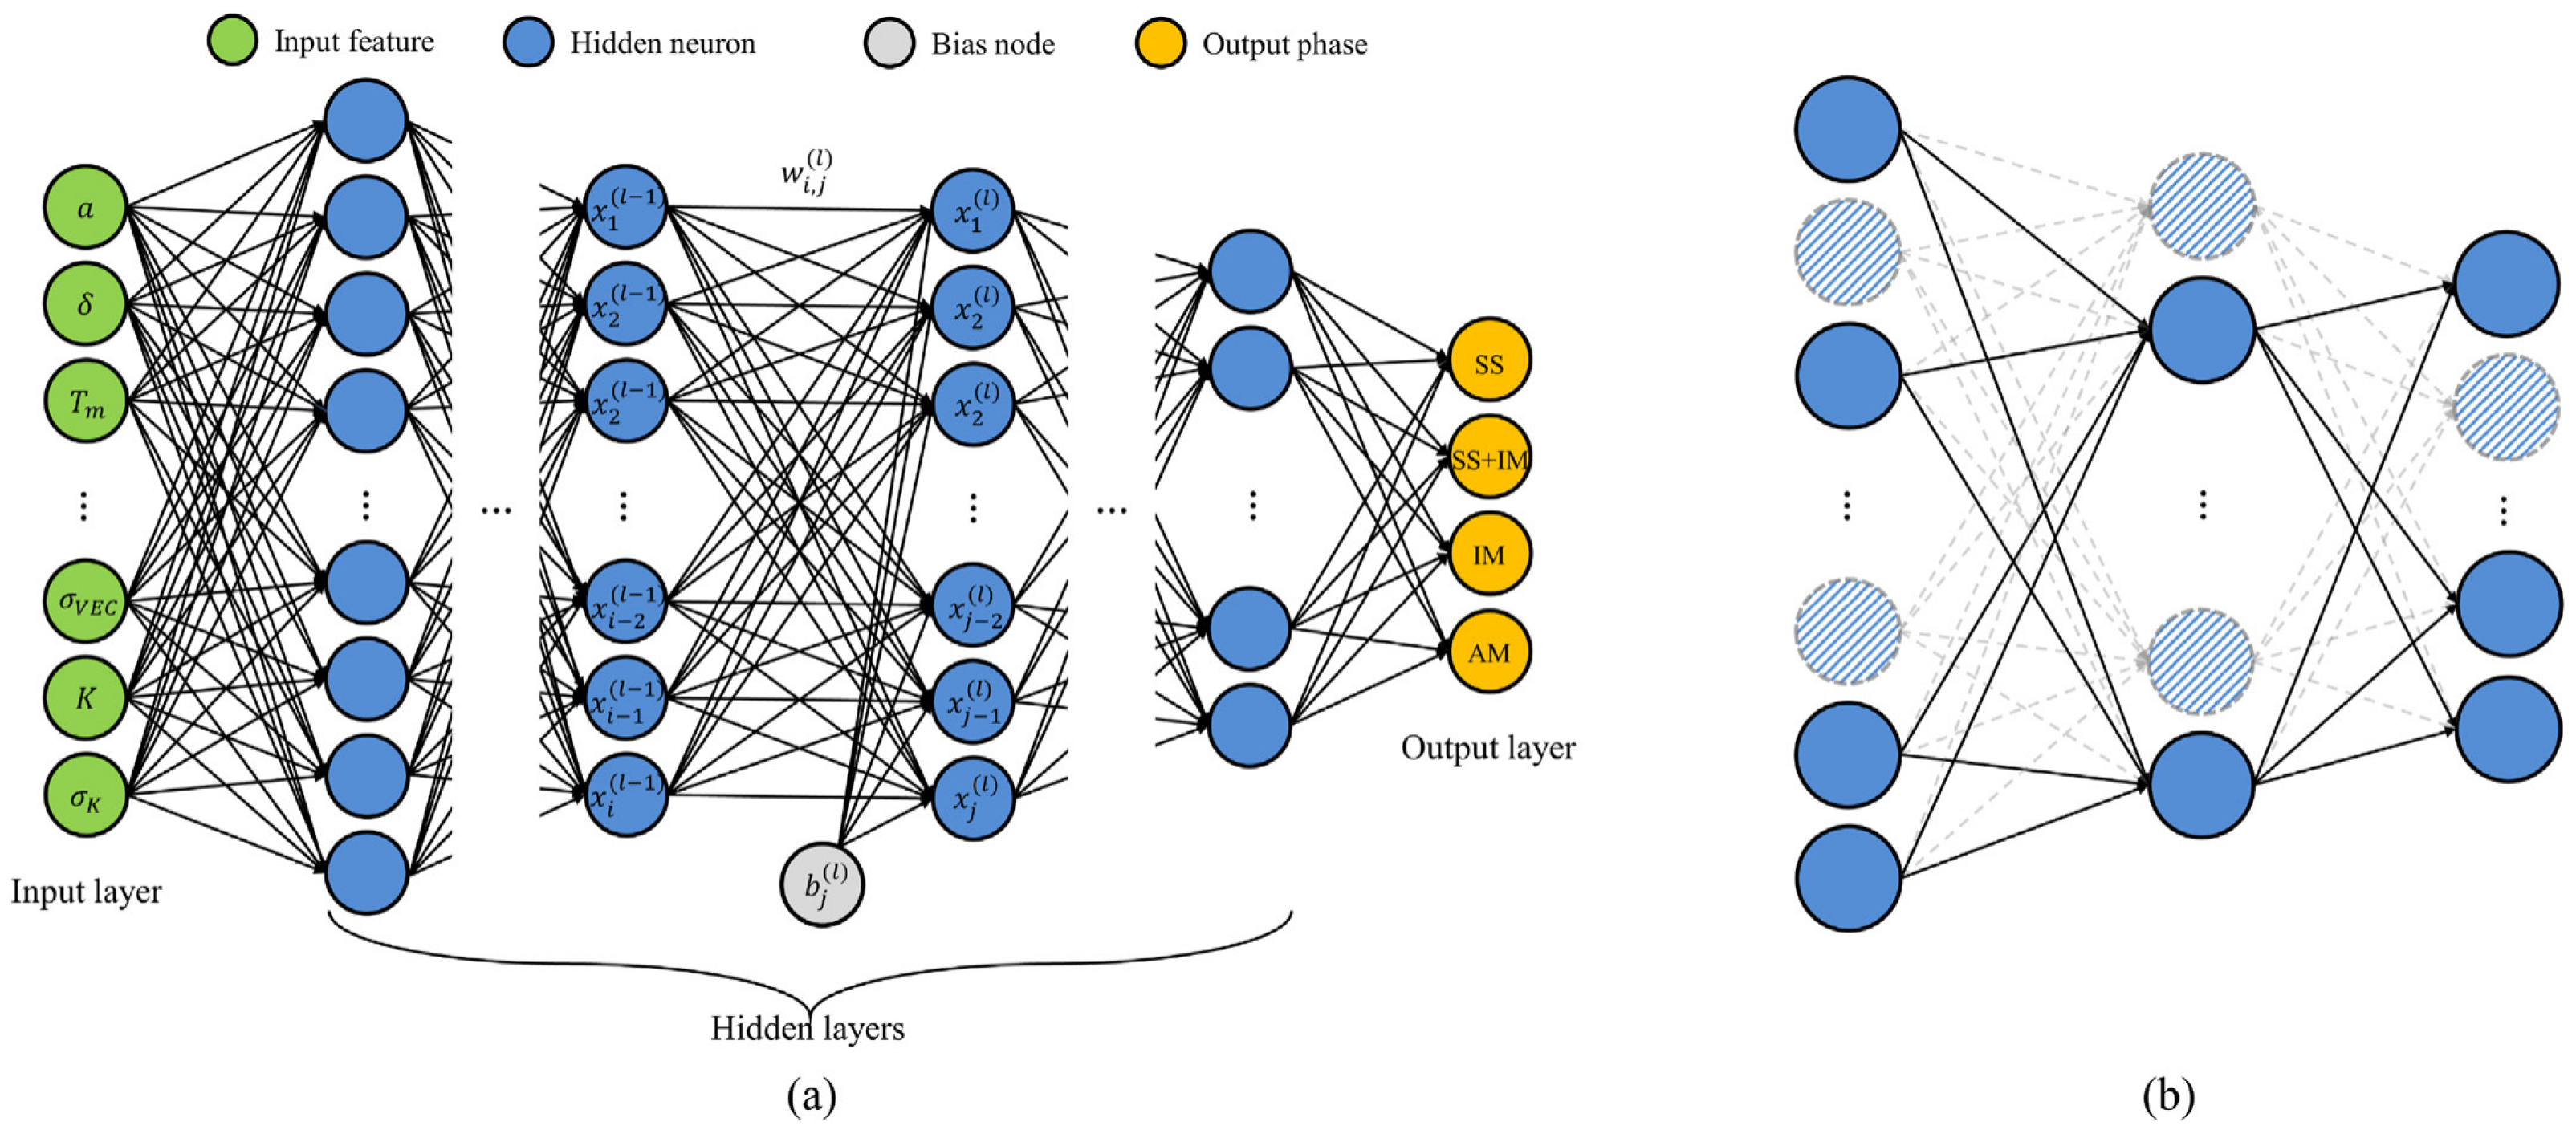

| Model | Advantages | Limitations |
|---|---|---|
| NNs | (1) Powerful for complex, non-linear relationships. (2) Robust to noisy data. (3) Ability to learn from large datasets. | (1) Prone to overfitting, especially with small datasets. (2) Requires careful tuning of parameters. (3) Black-box nature makes interpretation difficult. |
| SVM [93] | (1) Effective in high-dimensional spaces. (2) Works well with small to medium-sized datasets. (3) Versatile due to kernel trick for non-linear classification. | (1) Can be slow to train on large datasets. (2) Sensitivity to choice of kernel parameters. (3) Memory-intensive for large-scale problems. |
| GP | (1) Provides uncertainty estimates for predictions. (2) Flexible and interpretable modeling. (3) Can handle small datasets effectively. | (1) Provides uncertainty estimates for predictions. (2) Flexible and interpretable modeling. (3) Can handle small datasets effectively. |
| KNN [94] | (1) Simple and easy to understand. (2) No training phase, making it fast for inference. (3) Robust to noisy data and outliers. | (1) Simple and easy to understand. (2) No training phase, making it fast for inference. (3) Robust to noisy data and outliers. |
| RF | (1) High accuracy and robustness. (2) Works well with high-dimensional data. (3) Handles missing values and maintains accuracy. | (1) Can be slow to predict on large datasets. (2) Lack of interpretability due to ensemble nature. (3) May overfit noisy datasets if not tuned properly. |
Table 2.
Advantages and limitations of AL, GA, DL, and TL.
| Models | Advantages | Limitations |
|---|---|---|
| AL | (1) Reduces labeling effort (2) Improves model performance with limited data (3) Allows for adaptive training | (1) Requires expert query strategies (2) Can be computationally expensive (3) Depends on query strategy quality |
| GA [112] | (1) Optimizes complex problems (2) Searches across wide spaces (3) Handles multi-objective tasks | (1) No guaranteed global optimum (2) Complexity increases with dimensions (3) Sensitive to noisy objectives |
| DL [113,114,115] | (1) Learns complex patterns (2) Automatically extracts features (3) Excels in various tasks | (1) Needs large, labeled data (2) Prone to overfitting (3) Requires powerful hardware |
| TL [116,117] | (1) Leverages related knowledge (2) Reduces data need for new tasks (3) Speeds up training, improves performance | (1) Performance depends on domain similarity (2) Domain shift may affect transferability (3) Fine-tuning may still be necessary |
Disclaimer/Publisher’s Note: The statements, opinions and data contained in all publications are solely those of the individual author(s) and contributor(s) and not of MDPI and/or the editor(s). MDPI and/or the editor(s) disclaim responsibility for any injury to people or property resulting from any ideas, methods, instructions or products referred to in the content. |
© 2024 by the authors. Licensee MDPI, Basel, Switzerland. This article is an open access article distributed under the terms and conditions of the Creative Commons Attribution (CC BY) license (https://creativecommons.org/licenses/by/4.0/).
Share and Cite
MDPI and ACS Style
Liu, S.; Yang, C. Machine Learning Design for High-Entropy Alloys: Models and Algorithms. Metals 2024, 14, 235. https://doi.org/10.3390/met14020235
AMA Style
Liu S, Yang C. Machine Learning Design for High-Entropy Alloys: Models and Algorithms. Metals. 2024; 14(2):235. https://doi.org/10.3390/met14020235
Chicago/Turabian StyleLiu, Sijia, and Chao Yang. 2024. "Machine Learning Design for High-Entropy Alloys: Models and Algorithms" Metals 14, no. 2: 235. https://doi.org/10.3390/met14020235
Note that from the first issue of 2016, this journal uses article numbers instead of page numbers. See further details here.