
Leak-before-Break (LBB)-Based Safety Verification of Reverse Cyclic Loading for 316L Stainless Steel: A Study Using Flat ESG Specimens
1
Smart Manufacturing Technology R&D Group, Korea Institute of Industrial Technology, Daegu 42994, Republic of Korea
2
Smart Agricultural Machinery R&D Group, Korea Institute of Industrial Technology, Jeonju 54853, Republic of Korea
3
Department of Mechanical & Materials Engineering, Korea Institute of Nuclear Safety, Daejeon 34142, Republic of Korea
4
Department of Mechanical Engineering, Sungkyunkwan University, Suwon 16419, Republic of Korea
*
Author to whom correspondence should be addressed.
Metals 2023, 13(12), 1999; https://doi.org/10.3390/met13121999
Submission received: 24 October 2023
/
Revised: 6 December 2023
/
Accepted: 9 December 2023
/
Published: 12 December 2023
(This article belongs to the Special Issue Crack Growth Resistance of Structural Alloys)
Abstract
:The leak-before-break design concept is based on J-R curves, which are obtained by J-R tests on various types of specimens and are known to be dependent on the cyclic load history. The J-R curves of standard specimens suggested by the American Society for Testing Materials are determined based on quasi-static tensile loading. However, seismic loading induces a reverse cyclic loading that alternately applies a tensile and a compressive load to nuclear plant piping. Therefore, it is very important to obtain the fracture toughness characteristics under reverse cyclic loading for the integrity estimation of nuclear plant piping. The objective of this paper is to study the effects of reverse cyclic loading on the fracture toughness characteristics of SA312 TP316L stainless steel, which is a nuclear plant piping material. J-R tests on a flat, equivalent stress gradient specimen with varying incremental displacement were carried out. The test results were reviewed by comparing the J-R test results under quasi-static loading. In addition, the safety margin of the nuclear plant piping was evaluated using a crack driving force diagram method. For the SA312 TP316L stainless steel, the results showed that the J-R curves were decreased with a decrease in the incremental displacement. When the incremental displacement was set to 0.25 mm, the unstable crack growth point value was about 73.0% of those for the quasi-static loading conditions.
1. Introduction
The most prevalent concern that challenges the sustainable and secure operation of any pressurized pipeline is the impending occurrence of leaks and bursts, caused either by gradually deteriorating intrinsic pipe properties or sudden extrinsic events like operational discrepancies, anthropogenic activities, or environmental factors [1]. Furthermore, not all types of pipeline systems respond identically to leak-causing stresses or undergo similar damage [2]. A key lesson learned from the Fukushima Daiichi nuclear disaster was that earthquakes have a high potential to cause substantial damage and disruption to the operation of nuclear power plants. This lesson has emphasized the importance of safety evaluation of nuclear power plants against seismic load [3,4,5]. Of particular significance is the potential damage to the piping of the primary cooling system, which conveys radioactively contaminated cooling water within the nuclear reactor. Damage to this piping would lead to radiation leakage with unimaginable consequences [6]. Therefore, it is essential to evaluate the integrity of nuclear plant piping (NPP) against seismic loads to ensure safety during operation and to maintain reliability during the lifetime warranty period.
Seismic load consists of two types: dynamic load and reverse cyclic load. Reverse cyclic loading, which involves repeated tension and compression from longitudinal and transverse waves, is influenced by factors such as load speed, load ratio (R), and incremental displacement (δcycle) [7,8]. The incremental displacement parameter is related to the amount of crack propagation during one cycle under repeated reverse cyclic loading; this parameter varies with each cycle depending on the strength of the earthquake [9]. By considering the effect of reverse cyclic loading due to the incremental displacement, it is possible to determine the fracture toughness characteristics due to the strength and frequency of the seismic waves that are propagated during the earthquake [10].
The leak-before-break (LBB) design philosophy used for high-pressure vessels and power-related plant equipment has been attracting much interest from a safety and economic point of view. The LBB concept is a design methodology to guarantee that an unstable fracture does not occur before a crack penetrates the wall thickness [11]. Even after complete wall penetration, it is required that structural integrity is still maintained for a certain period in order to allow shutdown procedures. In addition to that, an acceptable LBB case can still be made if the leakage is detectable before the crack size reaches the critical length [12]. Elastic–plastic fracture mechanics (EPFM), which are based on the J-integral, are generally used to apply the LBB design concept and analysis of the fracture behavior to the piping of nuclear power plants. The fracture resistance (J-R) curve for NPP is indispensable in evaluating the integrity of NPP based on the LBB design concept [13,14]. The J-R curve can only be obtained through the fracture resistance test. The fracture resistance test has been standardized by the American Society for Testing and Materials (ASTM) as test method ASTM E1820. However, this test method is insufficient for application to reverse cyclic load cases because it is limited to monotonic tensile loading [15]. Previous studies have compared the J-R curves obtained under monotonic tensile loading according to ASTM E1820, to those obtained under reverse cyclic loading. The results obtained for carbon steel piping indicated that the incremental displacement and load ratio under reverse cyclic loading have a substantial effect on the J-R curve, with a reduction in the J-R curve to as low as 25%, as compared to the monotonic tensile load conditions [7,10]. For stainless steel piping, this reduction was estimated to be as low as 40% [6,9]. Other previous studies indicated that seismic loads can cause more rapid crack propagation of NPP than monotonic tensile loading. Therefore, it is very important to examine the effect of reverse cyclic loading on the fracture toughness characteristics (especially the J-R curve) of nuclear power plant piping materials in order to secure the integrity of the nuclear reactor against seismic loads.
The purpose of this study was to investigate the effect of incremental displacement on the J-R curve of SA312 TP316L stainless steel piping, which is used as the primary cooling system of nuclear power plants. For this purpose, fracture resistance tests were carried out under various incremental displacements using an equivalent stress gradient (ESG) specimen with a stress gradient similar to that of the real piping on the crack surface as proposed by Park et al. [16]. In addition, the J-R curves obtained from the fracture resistance tests under monotonic tensile loading for the same material and test specimen were compared, and the effect of the incremental displacement under reverse cyclic loading on the fracture toughness characteristics was examined using LBB analysis.
2. Validation of Fracture Toughness Characteristics Using ESG Specimen
To apply the LBB concept, it is ideal to use the J-R curve of real piping. However, standard test specimens prescribed by ASTM E1820 are used instead of real piping because it is difficult and costly to perform fracture resistance tests with real piping. The J-R curves obtained from the standard test specimens provide a very conservative prediction of fracture behavior relative to that obtained from real piping. The effect of constraints such as the size, thickness, crack length, and load conditions of the test specimen is important in measuring the J-R curve [17]. To accurately measure the J-R curve of real piping with a specific crack length, it is necessary to quantify the difference in the constraint effects between the real piping and the specimen. The J-Q theory is generally used to characterize the crack tip stress fields and quantify the constraint effects for various geometries and loading configurations in elastic–plastic materials. However, in the case of stainless steel piping with high ductility, the Q factor obtained at r = J/2σ0 cannot be used to quantify the difference in the constraint effects between the real piping and the specimen before crack growth, since a large deformation occurs near the crack tip before crack growth begins [18,19,20,21]. Therefore, the need for a new nonstandard test specimen with low constraint effect that can accurately simulate the constrain effect of the real piping has become an important issue. To design a test specimen with similar constraint effect at the crack tip of the real piping, Park et al. suggested a single-edge notched tension (SENT) specimen corresponding to the stress gradient of the real piping at the crack tip; this specimen was named the equivalent stress gradient (ESG) specimen [16].
Figure 1 shows the schematic design of the ESG specimen, which replicates the crack-opening stress gradient at the crack tip of the real piping with circumferential crack. Tao Shen et al. evaluated the crack-opening stress gradients of real piping, a standard compact tension (CT) specimen, and a curved ESG specimen for SA312 TP304 stainless steel material through finite element (FE) analysis [22]. The results, as shown in Figure 2a, indicate that the crack-opening stress gradients of the CT specimen and the real piping were significantly different, whereas the curved ESG specimen and the real piping had similar crack-opening stress gradients. In addition, Figure 2b shows that the J-R curves obtained from the fracture resistance tests of the curved ESG specimen are similar to those of the real piping but different from that of the CT specimen. Thus, we can conclude that, in applying the LBB concept to the design of NPP, ESG specimens demonstrate identical constraint effects as real piping, thus reducing the overly conservative designs obtained by using conventional standard CT specimens [22].
3. Fracture Toughness Tests under Reverse Cyclic Loading
3.1. Materials and Specimen
The shutdown cooling system of a nuclear power plant is exposed to high temperatures, high neutron doses, and extreme caustic environments during operation. Therefore, the piping for these systems in made with materials that have excellent mechanical properties and corrosive resistance at high temperatures, such as austenitic stainless steel, Ni-based alloy, ferrite–martensitic steel, and oxide dispersion-strengthened steel [23,24,25]. The test material used in this study was SA312 TP316L stainless steel. The mechanical properties and chemical composition of SA312 TP316L stainless steel are listed in Table 1 and Table 2. The flat ESG specimens were extracted from real piping (12 inch in diameter) along the transverse–longitudinal (T-L) orientation. The shape and dimensions of the flat ESG specimen are illustrated in Figure 3 and the dimensions of real piping are listed in Table 3.
Figure 4 shows the comparison of the crack-opening stress gradient at crack tip of the real piping with circumferential crack angle (θ) of 120°, and a flat ESG specimen with a dimensionless crack length (a/W) of 0.08. It is calculated using finite element methods. The result shows that the crack-opening stress gradient of the flat ESG specimen and real piping were within 3%, which indicates that the crack-opening stress gradient of the real piping can be replicated with the flat ESG specimen.
3.2. Test Procedures
An electro-hydraulic universal testing machine (Model 8503, Instron Corporation, Norwood, MA, USA) with a capacity of 490 kN was used to perform the fracture resistance tests. The unloading compliance method was used to measure the crack length and extension. The crack-mouth opening displacement was measured using a capacitance-type clip-on gauge, and the potential difference, which was measured as the crack extended, was amplified 10,000 times using an amplifier. All the test data (e.g., load, displacement, and gauge signal) were converted to digital signals and saved using the data acquisition system (Model SXCI-1000, National Instrument Corporation, Austin, TX, USA). Figure 5 shows the schematic and actual views of the fracture resistance test system.
Since a standardized method for the fracture resistance test under reverse cyclic loading had not been established yet, we used the single-specimen technique in accordance with ASTM E1820. The initial dimensionless crack length (a0/W) of the specimens was set to 0.08 by inserting a fatigue pre-crack to ensure that the specimen had the same condition at the crack tip. To investigate the effect of incremental displacement on the fracture toughness characteristics, five incremental displacements (0.25, 0.5, 0.75, 1, and 2 mm) were selected. The fracture resistance tests were performed under a load ratio (R) of −0.5 at a loading speed of 3 mm/min; this test was also performed at the same test speed under a quasi-static load in order to confirm the effect of reverse cyclic loading. The amount of crack propagation during the test was indicated by heat tinting, and post-cracking, was performed under fatigue loading to prevent excessive deformation of the ESG specimen.
3.3. Equations of J-R Curve for Flat ESG Specimen Using FE Analysis
In 1968, Rice developed another parameter to characterize nonlinear material behavior ahead of cracking. By idealizing plastic deformation as nonlinear elastic, Rice was able to generalize the energy release rate to nonlinear materials [26]. Rice proposed the J-integral as a contour integration method for crack analysis; this method is independent of the path around the crack. Hutchinson, Rice, and Rosengren et al. have shown that the J-integral characterizes the stress and strain fields in the vicinity of the crack tip, as expressed in Equations (1) and (2) [26]:
where, is a constant that is a function of n, and and are known dimensionless functions of the circumferential position, θ, and the hardening exponent, n. These equations are often referred to as the HRR field equations.
The J-integral, which is a measure of fracture toughness of a nonlinear material, is calculated as the sum of the elastic and plastic components, as expressed in Equation (3) [26]:
where, J is J-integral, Jel is elastic component of J-integral, Jpl is plastic component of J-integral. The elastic component of the J-integral is calculated by Equation (4) [26]:
where, E′ = E in the plane stress condition or E′ = E/(1 − ν2) in the plane strain condition. E is Young’s modulus. In the case of the flat ESG specimen used in this study, the thickness is 20 mm and it is in a plane strain condition in which stress exists in the thickness direction and no strain exists. The stress intensity factor (K) is calculated by Equation (5) [26]:
where, a is the crack length, σ is the remote stress, and F is the shape factor. The plastic component of the J-integral is calculated by Equation (6) [26]:
where, P is the applied load, Δpl is the plastic component of the load-line displacement, a0 is the initial crack length, and ηpl and γ are the test correction coefficients. If Equation (6) is summarized using the trapezoidal rule, the plastic component of the J-integral can be calculated as follows [26]:
where, Upl is the area of the load versus the load-line displacement curve as shown in Figure 6, and the subscript i means the loading step. The coefficients ηpl and γ are calculated using the plastic limit load of the test specimen, as follows [26]:
where, PL is the plastic limit load of the test specimen, A is the cracked area, and a is the crack length.
To obtain the J-R curve of the flat ESG specimen, it is necessary to calculate the stress intensity factor using Equation (5), the coefficients ηpl and γ using Equation (8), and crack length. For standard specimens (e.g., CT, single-edge bend, disk-shaped compact) with deep cracks in the tensile and bending load states, these equations are suggested in ASTM E1820. However, new equations are required, since ESG specimens are nonstandard specimens. To derive the necessary equations for calculating the J-integral, an FE analysis for flat ESG specimens was performed using ABAQUS (Ver. 2021, Dassault Systèmes, Paris, France) software. As shown in Figure 7, only half of the specimen was modeled because of symmetry, and the symmetric condition was applied to the cross-section, including the crack. To avoid problems associated with incompressibility, reduced integration with eight-node brick elements (C3D8R) was used, and the FE model was composed of 142,956 elements. In addition, a sufficiently fine mesh was used at the crack tip region to resolve crack tip stress fields. Six cases were set up to model the flat ESG specimens by increasing the dimensionless crack length from 0.1 to 0.6 in steps of 0.1.
3.3.1. Calculation of K
According to Equation (2), the stress intensity factor is needed for calculating the elastic component of the J-integral. The stress intensity factor changes with the shape of the specimen and the loading configuration, as shown in Equation (3). To obtain the equation relating to the crack length and the stress intensity factor for the ESG specimen, a three-dimensional elastic FE analysis was performed. Six cases were set up to model the flat ESG specimens by increasing the dimensionless crack length from 0.1 to 0.6 in steps of 0.1. The results of this analysis (Figure 8) indicate that the shape factor increased with the dimensionless crack length of the flat ESG specimen according to the relationship given in Equation (9), which was derived by the least squares method. The coefficient of determination for Equation (9) is 0.998, thus confirming that the correlation equation is reliable. By substituting Equations (5) and (9) into Equation (4), the elastic component of the J-integral can be calculated.
where, F is the shape factor, a is the crack length, and W is the specimen width.
3.3.2. Calculation of ηpl and γ
According to Equation (8), the plastic limit load is needed for calculating ηpl and γ. These coefficients change with the shape of the specimen. To derive the equation for the plastic limit load, three-dimensional FE analysis for flat ESG specimens was performed. This analysis used the same model as the FE analysis for the shape factor (Section 3.3.1), and the material was assumed to be perfectly plastic. Figure 9 shows the relationship between the dimensionless crack length and the plastic limit load obtained from the FE analysis. The plastic limit load decreased as the dimensionless crack length of the flat ESG specimen increased, and the relationship between these parameters is given in Equation (10), which was obtained using the least squares method. The coefficient of determination for Equation (10) is 0.999, thus confirming that the correlation equation is reliable. Equation (11) for ηpl and γ was derived by substituting Equation (10) into Equation (8). By substituting Equation (11) into Equation (6), the plastic component of the J-integral can be calculated.
where, PL is the plastic limit load, σY is the yield stress, W is the specimen width, t is the specimen thickness, and a is the crack length.
where, ηpl is the experimental calibration factor, t is the specimen thickness, γ is the experimental calibration factor, a is the crack length, and W is the specimen width.
3.3.3. Calculation of Crack Length
In order to obtain the J-R curve from the fracture resistance test, it is necessary to plot the load versus crack extension curve. The most common single-specimen test technique is the unloading compliance method, in which the crack length is computed at regular intervals by partially unloading the specimen and measuring the compliance [26]. To determine the relationship between the crack length and the elastic compliance for the flat ESG specimen, another three-dimensional FE analysis was performed using the same model as the FE analysis for the plastic limit load (Section 3.3.2). Seven cases were set up for this analysis by increasing the dimensionless crack length from 0.08 to 0.44 in steps of 0.06. The results of this analysis (Figure 10) indicate that the elastic compliance increases with the dimensionless crack length of the flat ESG specimen according to the relationship given in Equation (12), which was obtained using the least squares method. The coefficient of determination for Equation (12) is 0.998, thus confirming that the correlation equation is reliable.
where, Ci is the experimental compliance, a is the crack length, and W is the specimen width.
4. Results
Figure 11 shows the load versus load-line displacement curve for each incremental displacement obtained from the fracture resistance tests. It was confirmed that the load reached its peak in all test conditions and then decreased again. This indicates that cracks propagate stably without unstable fractures occurring throughout the entire test process. Since the crack grows continuously during the fracture resistance test, the J-integral must also be calculated continuously. The unloading compliance method that was used in calculating the J-integral applied only the data within 50% of the maximum load when the load was removed during one cycle. It was confirmed that the final crack extension, measured by the nine-point method for fractured specimens after post-cracking, and the final crack extension calculated by Equation (12) were within 4.5%. Therefore, polynomial expressions that relate a/W to compliance derived by the FE analysis were valid. As shown in Figure 12, the J-R curves were derived using the load versus load-line displacement curve and the J-integral equations of the flat ESG specimen, as derived in Section 3.3. Equation (11) describes the J-R curves obtained for the five incremental displacements, and the results of the fracture resistance tests are listed in Table 4, where C1 and C2 are regression constants obtained by the least squares method.
where, J is the J-integral, C1 is the power law coefficient, C2 is the power law coefficient, and ∆a is crack extension length.
The J-R curves obtained under reverse cyclic loading conditions were lower than that obtained under monotonic tensile loading conditions, and the J-R curve decreased as the incremental displacement decreased within the effective range [∆a < 0.2(W-ai)]. In particular, the reduction was somewhat large when the incremental displacement was more than 1 mm. This behavior is consistent with the results of a previous study on the effects of reverse cyclic loading on the J-R curves for NPP materials (e.g., S5146 Gr. 70 steel, SA312 TP304 stainless steel) using CT specimens [9,10]. The result was attributed mainly to the fatigue effect that occurred as the number of repetitions increased and as the incremental displacement decreased. The other reason was because the tensile residual stress increased with the number of repetitions. In addition, we considered the possibilities that the reverse cyclic loading caused crack opening and closure at the crack tip, that crack opening was initiated when a load less than zero was applied at the crack tip, and that the plastic deformation was caused by the compressive load [10,27,28,29].
5. Discussion
To apply the LBB design concept to the NPP, it is necessary to demonstrate that cracks can be detected and repaired before sudden failure occurs, even in the event of an ultimate load such as an earthquake. Therefore, prediction of an unstable crack growth point is very important in the application of the LBB design concept. For this purpose, an elastic–plastic fracture mechanics method based on the crack driving force was applied [13]. As shown in Figure 13, the crack driving force diagram (CDFD) method is one approach for predicting unstable crack initiation at some point by comparing experimentally determined crack extension resistance to the theoretically calculated unstable crack initiation (JINST).
The curve J(M, a) is a function of applied load level (M) and crack length (a), and JR is the J-R curves of material obtained from the fracture resistance tests. Instability occurs when the crack driving force J curve is tangential to the J-R curve. When the load is fixed in the CDFD, the unstable crack growth condition is mathematically expressed by Equation (14) [26]:
where, J is the J-integral, a is the crack length, and JR is the J-R curves of the material.
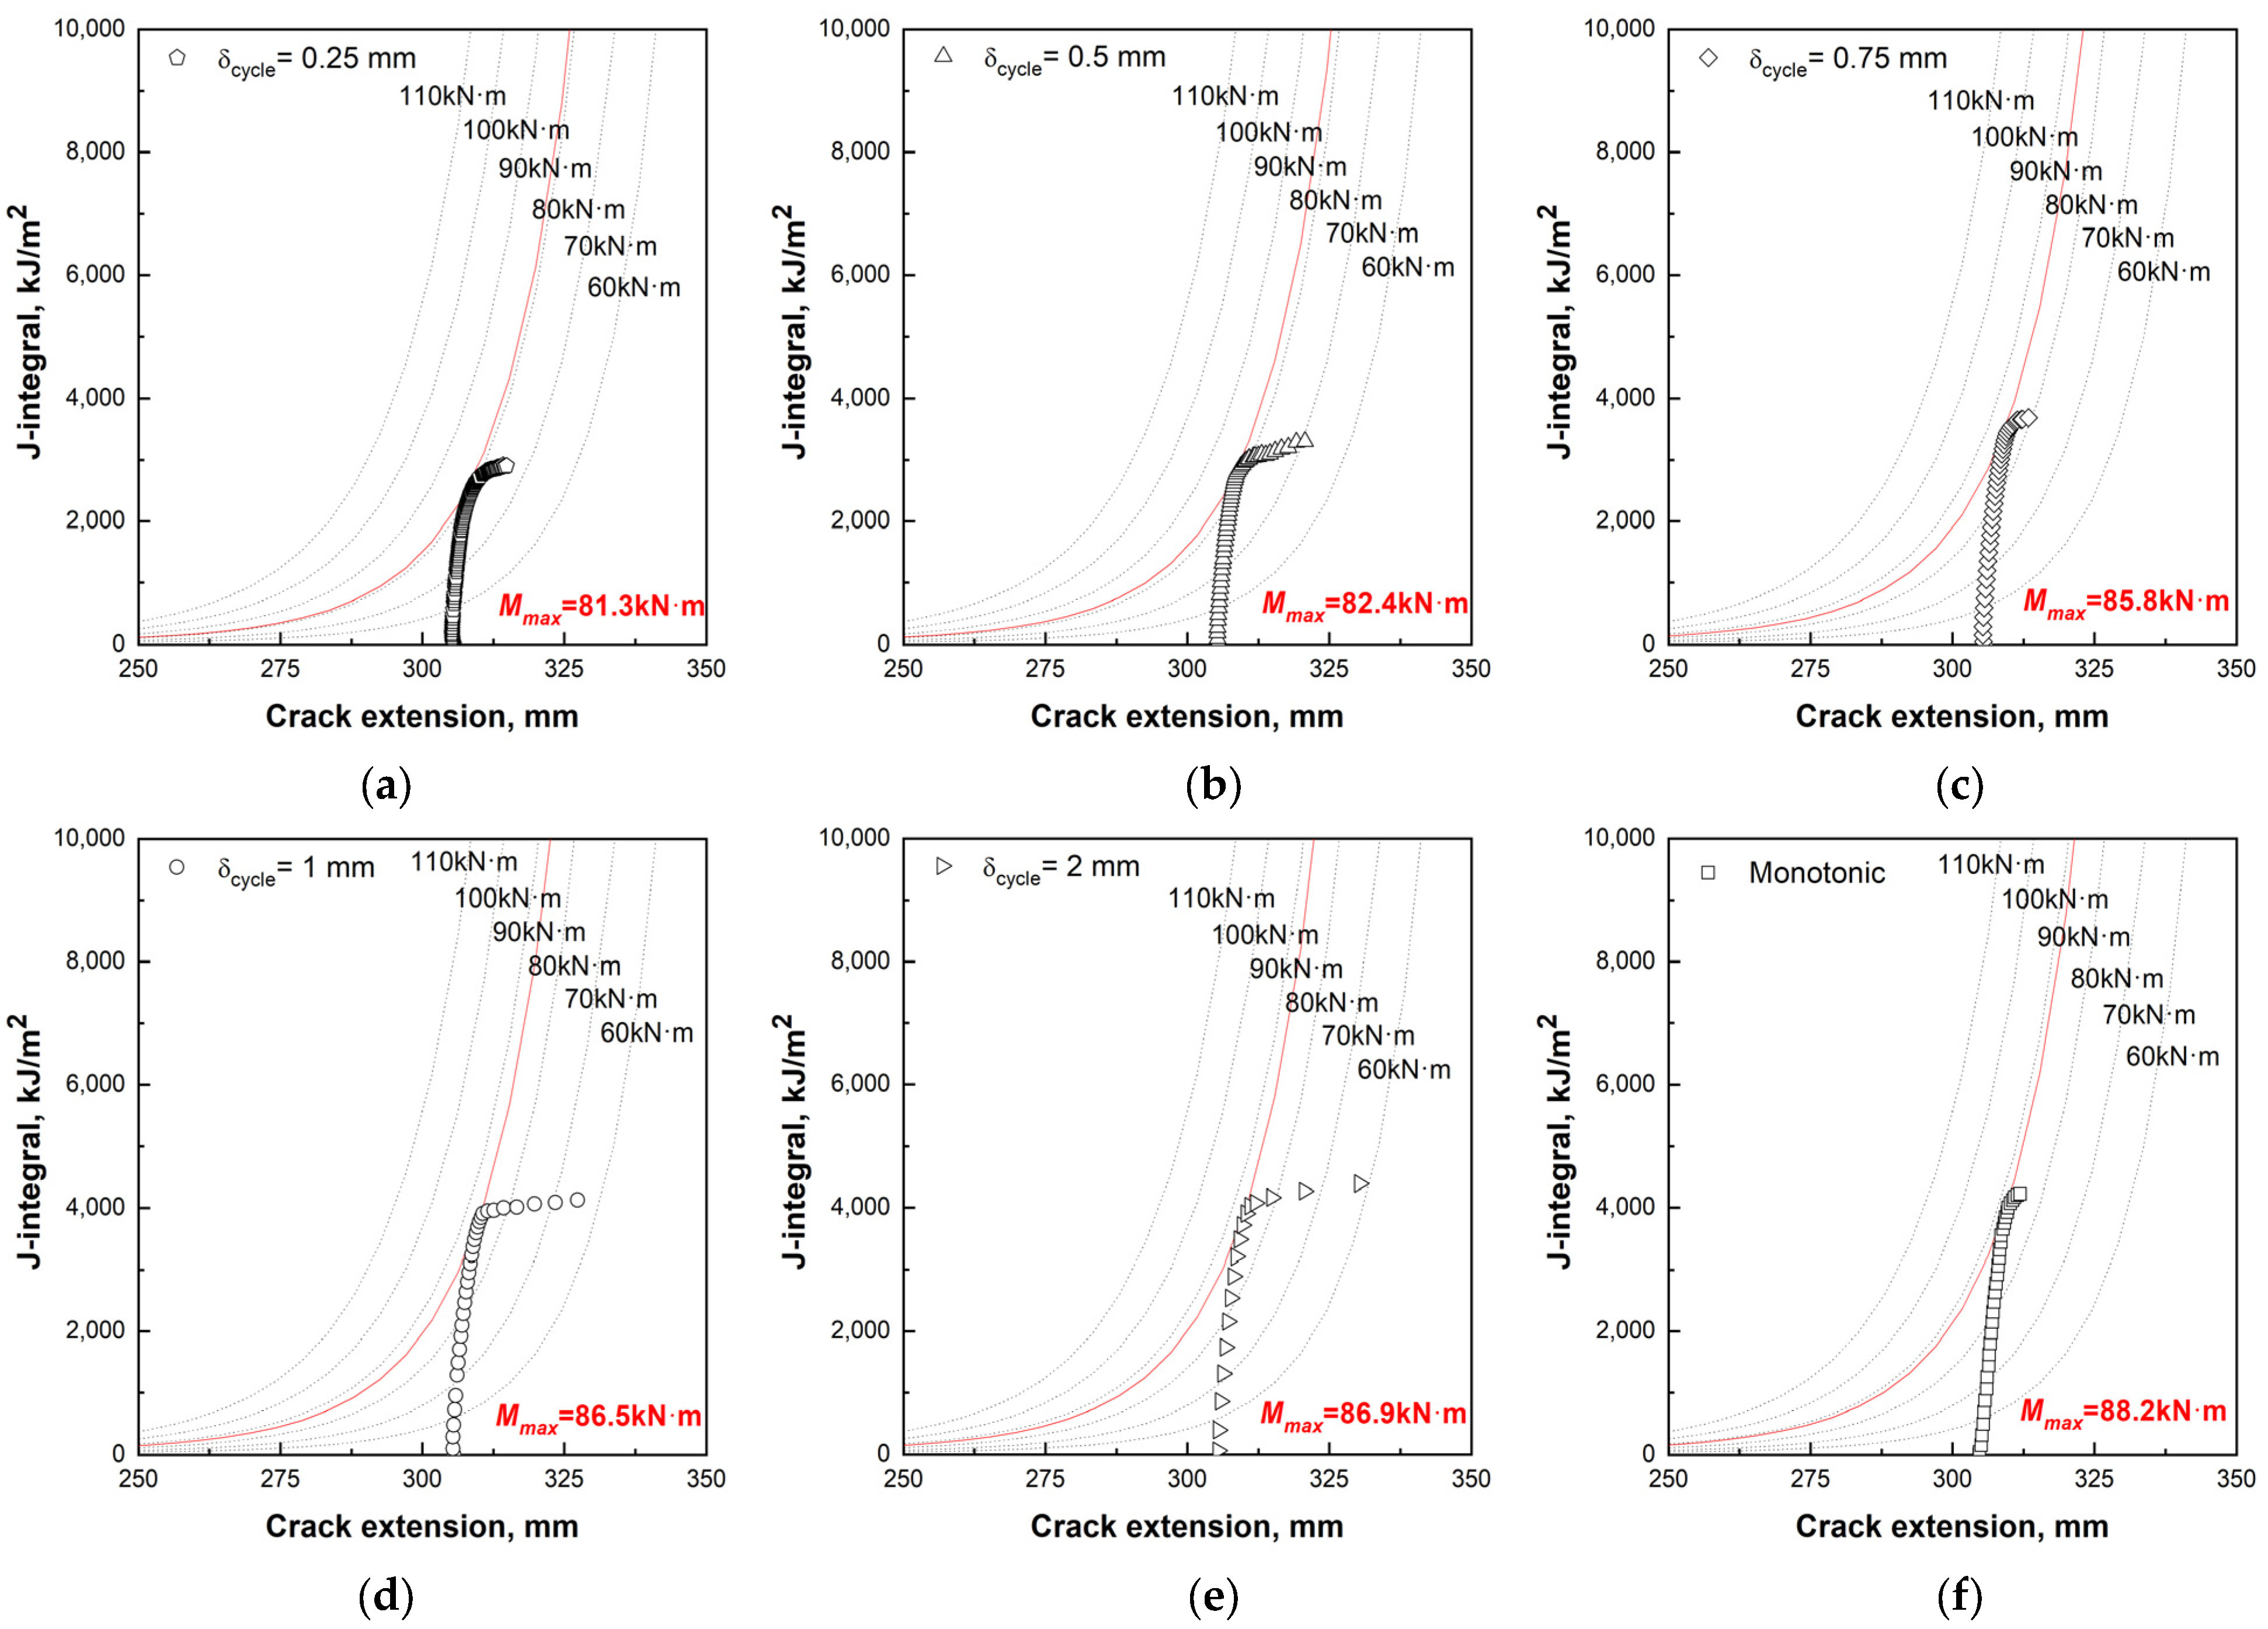
The GE/EPRI method was proposed based on the results of FE analysis using the plastic deformation theory for real piping with a circumferential crack [30]. In the LBB analysis, the crack angle of the real piping was assumed to be 120° because the flat ESG specimen with a/W = 0.08 had a stress gradient at the crack tip that was similar to that of real piping with a crack length of 120°. In the theoretical J-integral equation proposed by the GE/EPRI method, the CDFD associated with the moment change was derived by substituting the dimensions of the real piping listed in Table 3 and material constants of SA312 TP316L stainless steel. As shown in Figure 14, by comparing the derived CDFD with the J-R curves according to the incremental displacement obtained from the ESG specimen tests, the J(M, a) = JR contact point was determined and the JINST and the maximum moment (Mmax) at that time were confirmed. The results of this comparison are listed in Table 5.
When the incremental displacement was greater than 1 mm under reverse cyclic loading conditions, the reduction rates of JINST and Mmax were small compared with the monotonic tensile loading conditions. However, the reduction rates of JINST and Mmax increased significantly when the incremental displacement was less than 0.75 mm. The JINST and Mmax values showed a tendency to decrease as the incremental displacement decreased. The JINST values obtained under reverse cyclic loading conditions for incremental displacement of 0.25, 0.5, 0.75, 1, and 2 mm were all lower than the corresponding values obtained under monotonic tensile loading conditions by 27.0%, 22.5%, 10.0%, 4.7%, and 2.4%, respectively. In addition, for the same incremental displacements, the Mmax values under reverse cyclic loading conditions were lower than the corresponding values obtained under monotonic tensile loading conditions by 0.6, 0.9, 1.6, 5.0, and 6.1 kN·m, respectively. Therefore, real piping of SA312 TP316L stainless steel is considered to have a higher risk of fracture due to high frequency vibration from seismic loads than low frequency vibration. It is necessary to account for this behavior when developing design standards for nuclear power plant piping.
6. Conclusions
To investigate the effect of reverse cyclic loading on the fracture toughness characteristics of SA312 TP316L stainless steel (the piping material used in nuclear power plants), fracture resistance tests were performed with various incremental displacements using flat ESG specimens. In addition, the J-R curves obtained from the fracture resistance tests under the monotonic tensile loading (for the same material and type of test specimen) were compared, and the effect of the incremental displacement of the reverse cyclic loading conditions on the fracture toughness characteristics was examined using LBB analysis. The conclusions of this study are summarized as follows:
- For the nonstandard flat ESG specimens, new equations for calculating the J-integral and crack length were derived through FE analysis. And the new equations were confirmed to be valid and effective through comparison with experimental results.
- The J-R curve obtained under reverse cyclic loading conditions was lower than the J-R curve obtained under monotonic tensile loading conditions. In addition, the J-R curve was lower as the incremental displacement decreased within the effective range [∆a < 0.2(W-ai)].
- LBB analysis by the CDFD method was performed using real piping with a crack angle of 120°. The JINST and Mmax values showed a tendency to decrease as the incremental displacement decreased. When the incremental displacement was greater than 1 mm under reverse cyclic loading conditions, the reduction rates of JINST and Mmax were small compared with under monotonic tensile loading conditions. However, the reduction rates of JINST and Mmax increased significantly when the incremental displacement was less than 0.75 mm.
- For SA312 TP316L stainless steel, it was confirmed that there is a constant relationship between the incremental displacement and the maximum moment obtained from LBB analysis. Therefore, it is necessary to account for this behavior when developing design standards for nuclear power plant piping.
Author Contributions
Conceptualization: J.C., K.P. and S.P., Data curation: J.C., D.L. and K.P., Formal analysis: J.C., K.P. and S.P., Investigation: J.C., D.L. and K.P., Writing–original draft preparation: J.C., Writing–review and editing: D.L., K.P. and S.P., Validation: J.C. and S.P., Project Administration: J.C. and S.P., All authors have read and agreed to the published version of the manuscript.
Funding
This work was supported by a National Research Foundation of Korea (NRF) grant funded by the Korea government (RS-2022-00155157).
Data Availability Statement
The data presented in this study are available upon request from the corresponding author. The data are not publicly available due to confidentiality.
Acknowledgments
We are grateful to the Korea Atomic Energy Research Institute in analyzing the data in this article.
Conflicts of Interest
The authors declare no conflict of interest.
References
- Zaman, D.; Gupta, A.K.; Tiwari, M.K.; Sen, D. A review of leakage detection strategies for pressurised pipeline in steady-state. Eng. Fail. Anal. 2020, 109, 104264. [Google Scholar] [CrossRef]
- Ferrante, M.; Massari, C.; Brunone, B.; Meniconi, S. Experimental evidence of hysteresis in the head-discharge relationship for a leak in a polyethylene pipe. J. Hydraul. Eng. 2010, 137, 775–780. [Google Scholar] [CrossRef]
- Han, T.S.; Huh, N.S.; Park, C.Y. Evaluation of crack growth estimation parameters of thick-walled cylinder with non-idealized circumferential through-wall cracks. J. Korean Soc. Nondestruct. Test. 2013, 33, 138–146. [Google Scholar] [CrossRef]
- Yi, H.B.; Lee, J.K.; Kang, T.I. A seismic stability design by the KEPIC code of main pipe in reactor containment building of a nuclear power plant. J. Korean Soc. Precis. Eng. 2011, 28, 233–238. [Google Scholar]
- Li, S.; Zhang, H.; Li, S.; Wang, Y.; Xue, F.; Wang, X. Probabilistic fracture mechanics analysis of thermally aged nuclear piping in a pressurized water reactor. Nucl. Eng. Des. 2013, 265, 611–618. [Google Scholar] [CrossRef]
- Kim, S. Load ratio effect on fracture resistance curve of SA312 TP304 under reverse cyclic loading condition. J. Korean Soc. Precis. Eng. 2017, 34, 425–429. [Google Scholar] [CrossRef]
- Seok, C.S.; Murty, K.L. A study on the decrease of fracture resistance curve under reversed cyclic loading. Int. J. Press. Vessel. Pip. 2000, 77, 303–311. [Google Scholar] [CrossRef]
- Murty, K.L.; Seok, C.S. Fracture in ferritic reactor steel—Dynamic strain aging and cyclic loading. J. Miner. Met. Mater. Soc. 2001, 53, 23–26. [Google Scholar] [CrossRef]
- Kim, S. Effect of incremental displacement on the fracture resistance curve of nuclear piping materials under reverse cyclic loading. Korean J. Met. Mater. 2017, 55, 85–90. [Google Scholar] [CrossRef]
- Weon, J.I.; Kim, Y.J.; Seok, C.S. Effect of reverse cyclic loading on the fracture resistance curve in C(T) specimen. Nucl. Eng. Des. 1999, 191, 217–224. [Google Scholar]
- Iannitti, G.; Bonora, N.; Gentile, D. Assessment of an engineering approach to the evaluation of the cod of off-centred crack in pipes under bending for LBB design. Eng. Fract. Mech. 2012, 81, 69–79. [Google Scholar] [CrossRef]
- Nam, K.-W.; Ahn, S.-H. Crack Opening Behavior of Penetrated Crack Under Fatigue Load. J. Mech. Sci. Technol. 2002, 16, 24–31. [Google Scholar] [CrossRef]
- Park, S.; Shen, T.; Koo, J.-M.; Seok, C.-S. Validation of fracture toughness characteristics of nuclear plant piping and safety margin analysis by using CP specimen. Eng. Fract. Mech. 2017, 186, 39–46. [Google Scholar] [CrossRef]
- Shin, I.-H.; Park, S.-K.; Kim, S.-Y.; Seok, C.-S.; Koo, J.-M. Effect of Welding Parameters on Fracture Resistance Characteristics of Nuclear Piping. Int. J. Precis. Eng. Manuf. 2015, 16, 65–71. [Google Scholar] [CrossRef]
- ASTM E1820; American Society for Testing and Materials. Standard Test Method for Measurement of Fracture Toughness. ASTM International: West Conshohocken, PA, USA, 2023.
- Park, K.T.; Shin, I.H.; Kim, I.H.; Kim, Y.S.; Kwon, H.S.; Koo, J.M.; Seok, C.S. A Study on the Fracture Toughness Characteristics of Equivalent Stress Gradient Specimen. J. Korean Soc. Precis. Eng. 2014, 31, 551–557. [Google Scholar] [CrossRef]
- Lee, O.-S.; Kim, D.-H. Effects of Crack Geometries on Reliabilities using Probability Theories. Int. J. Precis. Eng. Manuf. 2009, 10, 119–126. [Google Scholar] [CrossRef]
- Shen, T.; Park, K.; Choi, J.; Moon, B.; Koo, J.-M.; Seok, C.-S. Transformation of Fracture Resistance Curves by using Bending Modified Q(Qm) Factor. Int. J. Precis. Eng. Manuf. 2017, 18, 85–91. [Google Scholar] [CrossRef]
- O′Dowd, N.P.; Shih, C.F. Family of Crack-Tip Fields Characterized by a Triaxiality Parameter-II. Fracture Applications. J. Mech. Phys. Solids 1992, 40, 939–963. [Google Scholar] [CrossRef]
- Cravero, S.; Ruggieri, C. Estimation procedure of J-resistance curves for SE(T) fracture specimens using unloading compliance. Eng. Fract. Mech. 2007, 74, 2735–2757. [Google Scholar] [CrossRef]
- Yu, C.; Steve, L. Analysis of ductile tearing of pipeline-steel in single edge notch tension specimens. Int. J. Fract. 2003, 124, 179–199. [Google Scholar]
- Shen, T.; Park, K.; Choi, J.; Moon, B.; Koo, J.-M.; Seok, C.-S. Evaluation for fracture resistance curves of nuclear real pipes using curved equivalent stress gradient (curved ESG) specimens. Eng. Fract. Mech. 2017, 169, 89–98. [Google Scholar] [CrossRef]
- Casati, R.; Lemke, J.; Vedani, M. Microstructure and Fracture Behavior of 316L Austenitic Stainless Steel Produced by Selective Laser Melting. J. Mater. Sci. Technol. 2016, 32, 738–744. [Google Scholar] [CrossRef]
- Du, D.; Chen, K.; Yu, L.; Zhang, L.; Shi, X.; Xu, X. SCC crack growth rate of cold worked 316L stainless steel in PWR environment. J. Nucl. Mater. 2015, 456, 228–234. [Google Scholar] [CrossRef]
- Nezakat, M.; Akhiani, H.; Penttilä, S.; Sabet, S.M.; Szpunar, J. Effect of thermo-mechanical processing on oxidation of austenitic stainless steel 316L in supercritical water. Corros. Sci. 2015, 94, 197–206. [Google Scholar] [CrossRef]
- Anderson, T.L. Fracture Mechanics: Fundamentals and Applications, 3rd ed.; CRC Press: Boca Raton, FL, USA, 2005. [Google Scholar]
- Rudland, D.L.; Brust, F.; Wilkowski, G.M. The Effects of Cyclic and Dynamic Loading on the Fracture Resistance of Nuclear Piping Steels. NUREG/CR-6440(BMI-2190); US NRC: Rockville, MD, USA, 1996.
- Chen, J.; Huang, Y.; Dong, L.; Li, Y. A study on evaluation method of crack tip reverse plastic zone size for the center cracked steel plate model under tension-compression cyclic loading. Eng. Fract. Mech. 2015, 133, 138–151. [Google Scholar] [CrossRef]
- Daniewicz, S.R.; Bloom, J.M. An assessment of geometry effects on plane stress fatigue crack closure using a modified strip-yield model. Int. J. Fatigue 1996, 18, 483–490. [Google Scholar] [CrossRef]
- Wilkowski, G.M.; Ahmad, J.; Brust, F.; Ghadiali, N.; Landow, M.; Marschall, C.W.; Scott, P.; Vieth, P. Short Cracks in Piping and Piping Welds. NUREG/CR-4599; US NRC: Rockville, MD, USA, 1991.
Figure 1.
Schematic design of the ESG specimen.
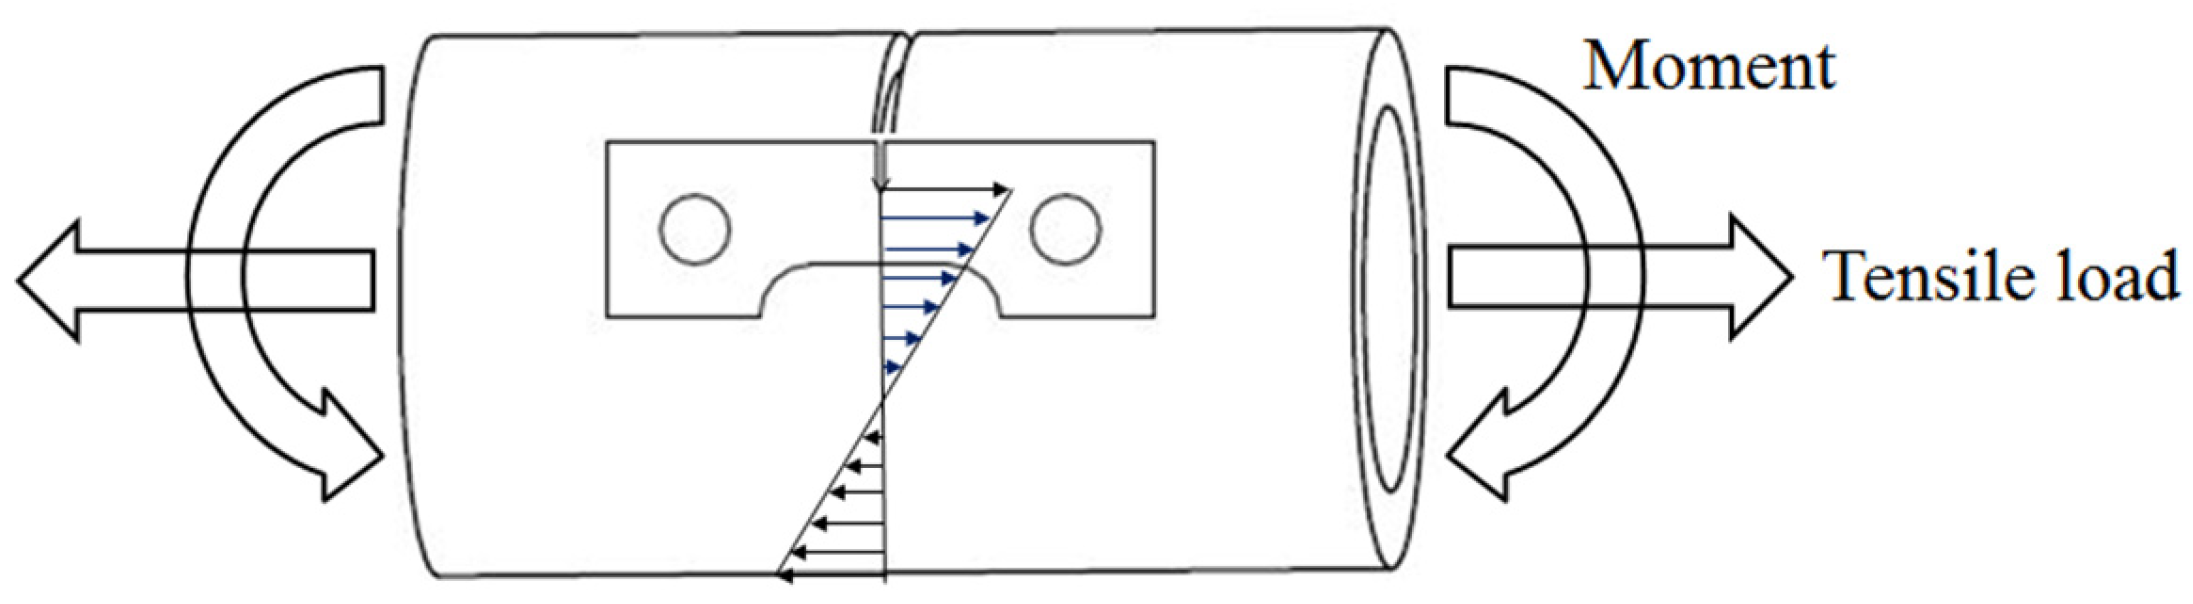
Figure 2.
Comparison of fracture toughness characteristics from real pipe, curved ESG specimen, and CT specimens (data from Ref. [22]): (a) Crack−opening stress gradient; (b) J−R curves.
Figure 2.
Comparison of fracture toughness characteristics from real pipe, curved ESG specimen, and CT specimens (data from Ref. [22]): (a) Crack−opening stress gradient; (b) J−R curves.
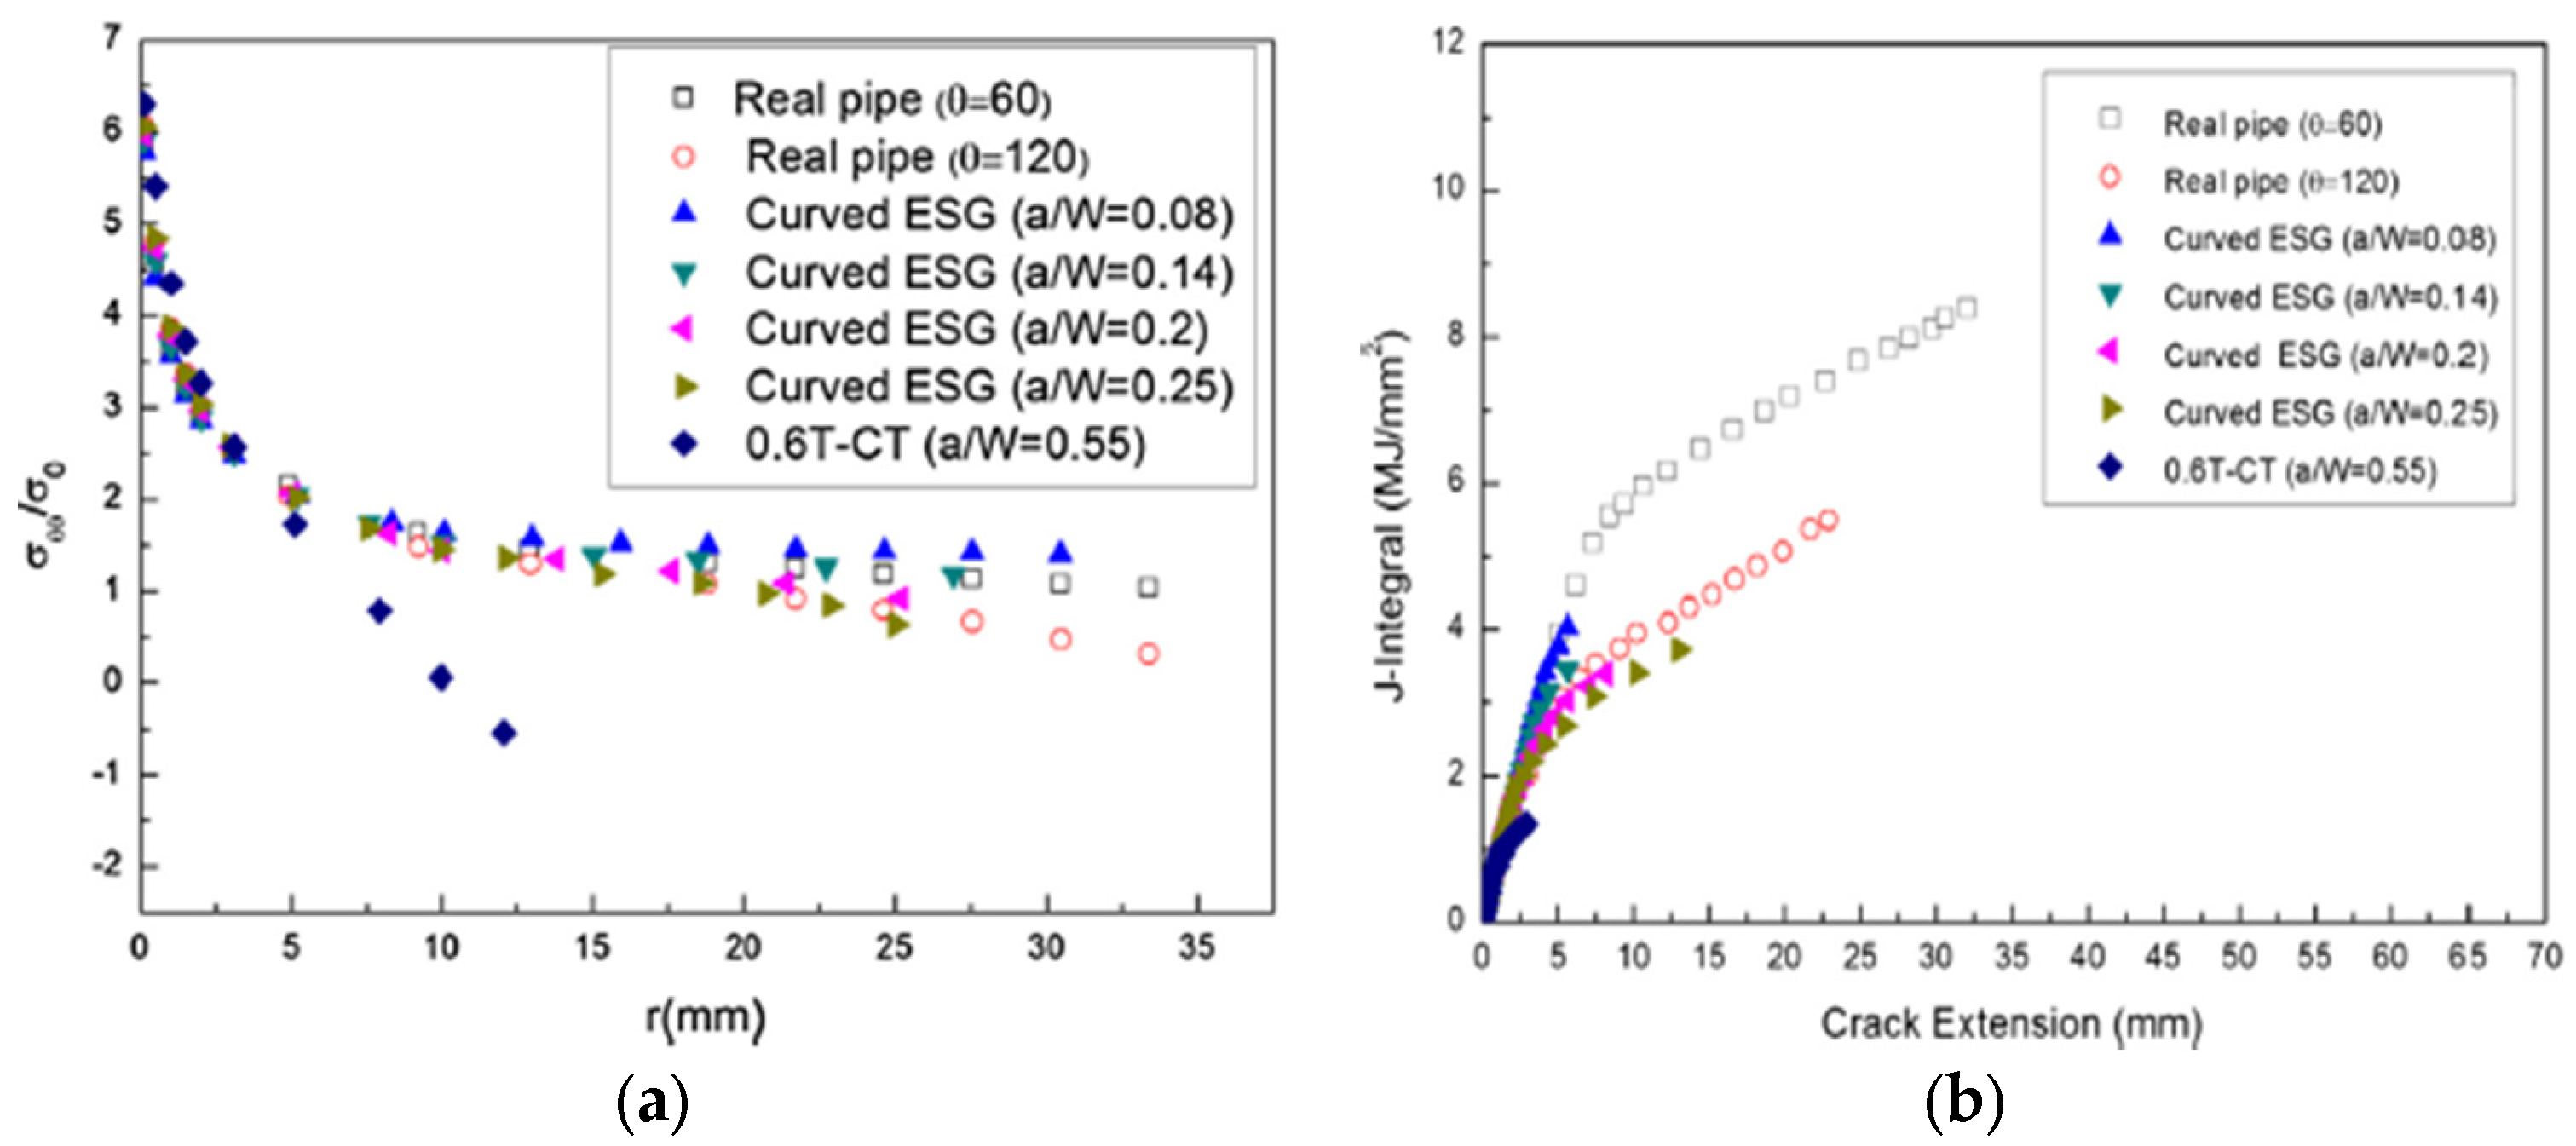
Figure 3.
Shape and dimension of flat ESG specimen (mm).
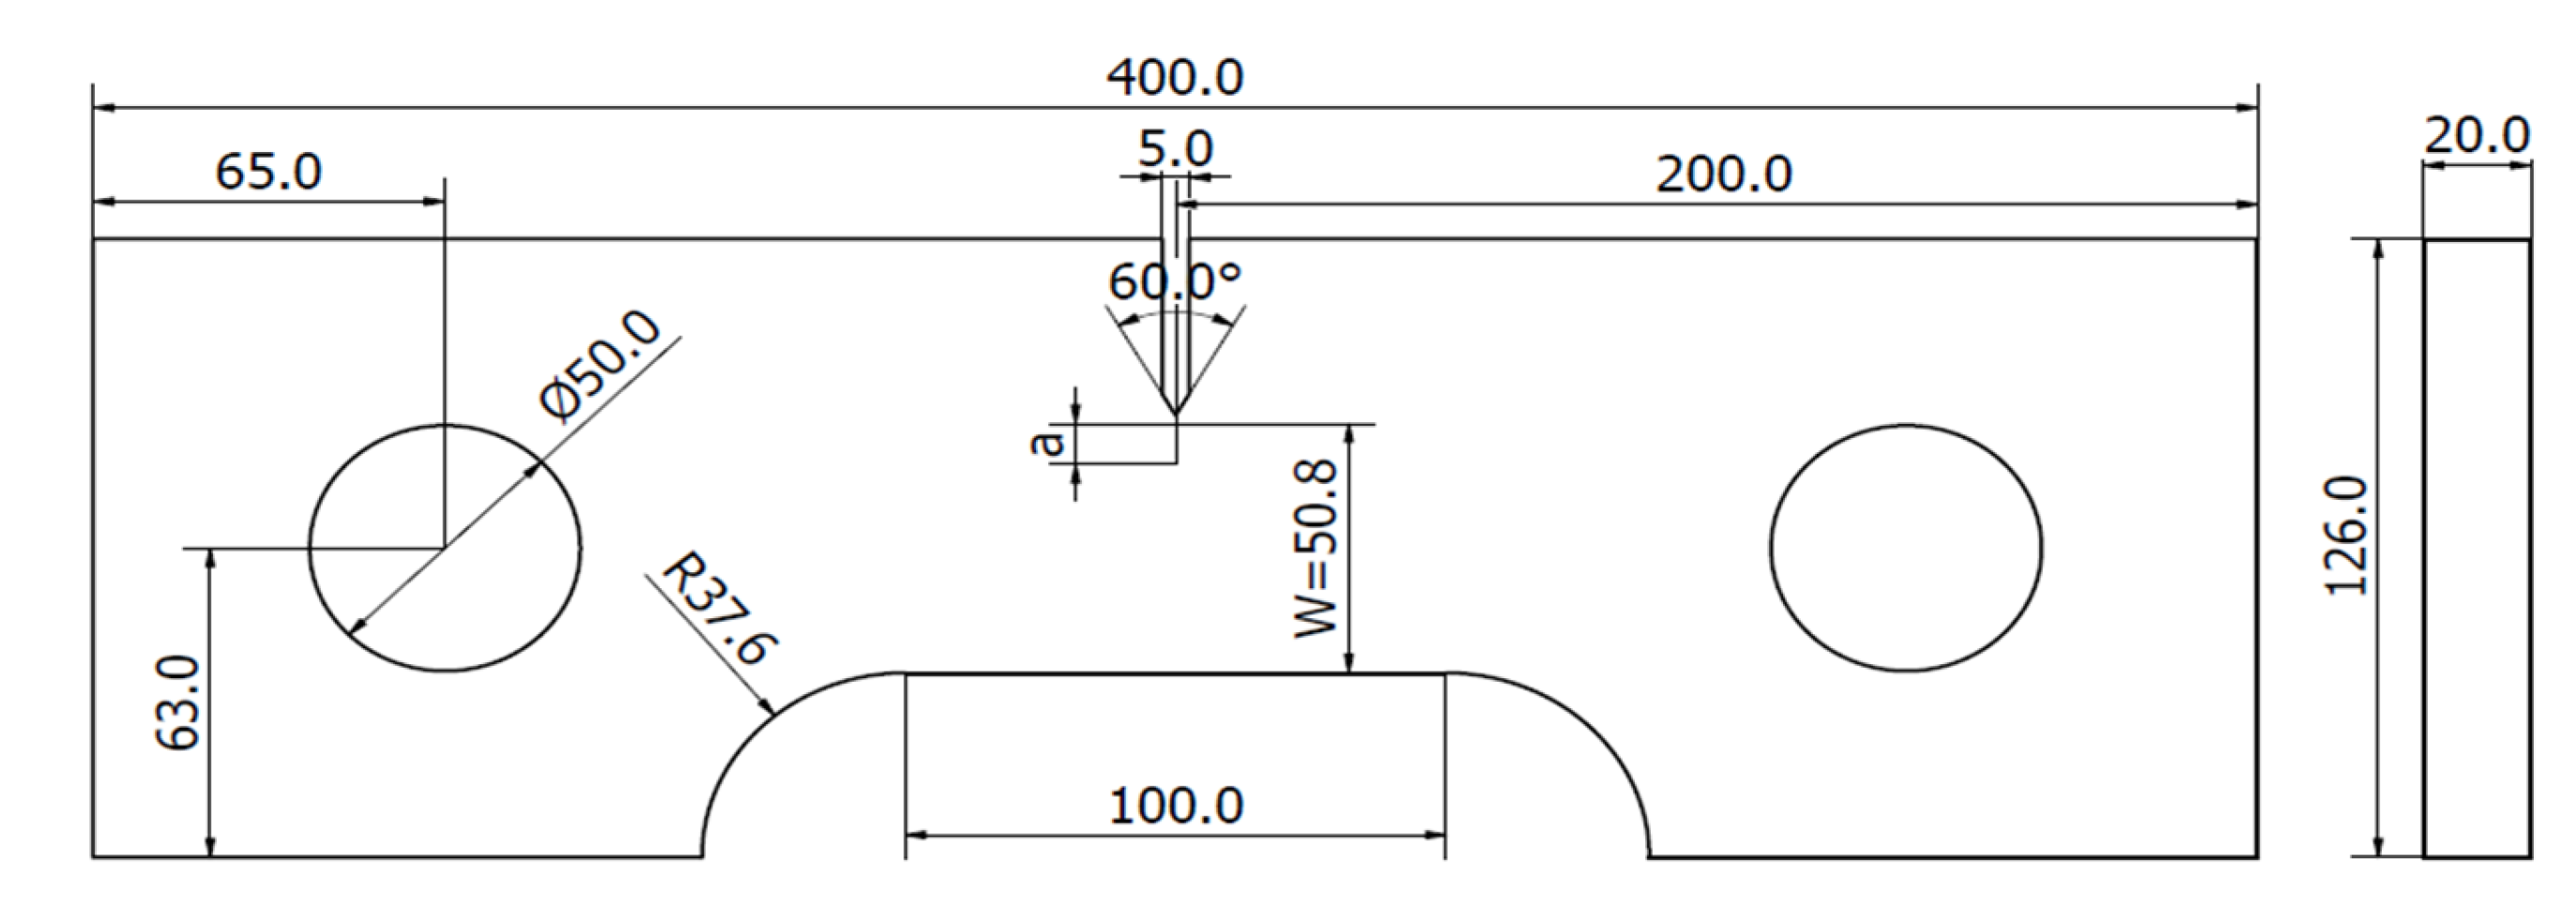
Figure 4.
Comparison of stress gradient of ESG specimen and real pipe.
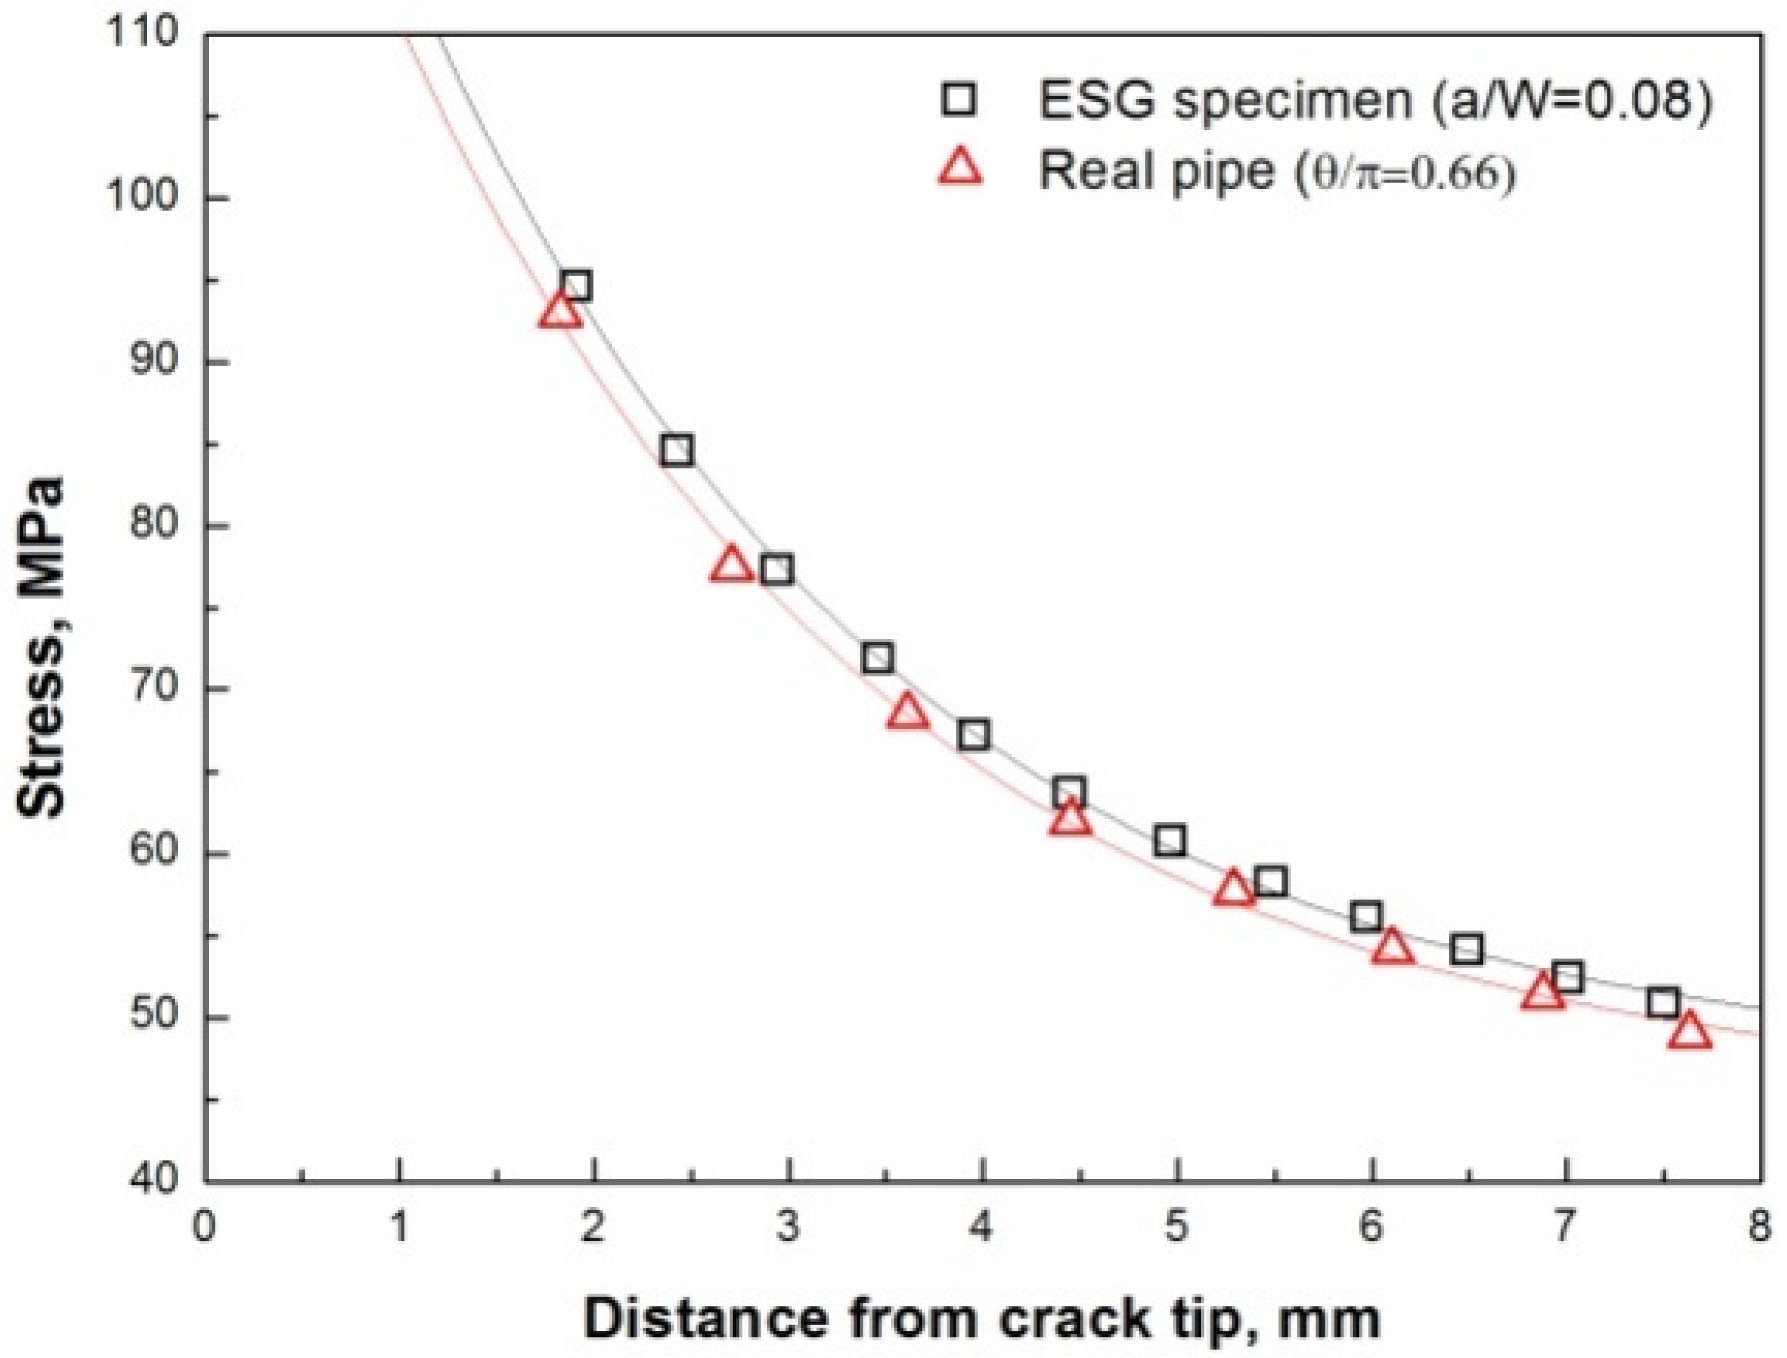
Figure 5.
Fracture resistance test system for flat ESG specimen.

Figure 8.
Result of finite element analysis for the shape factors.
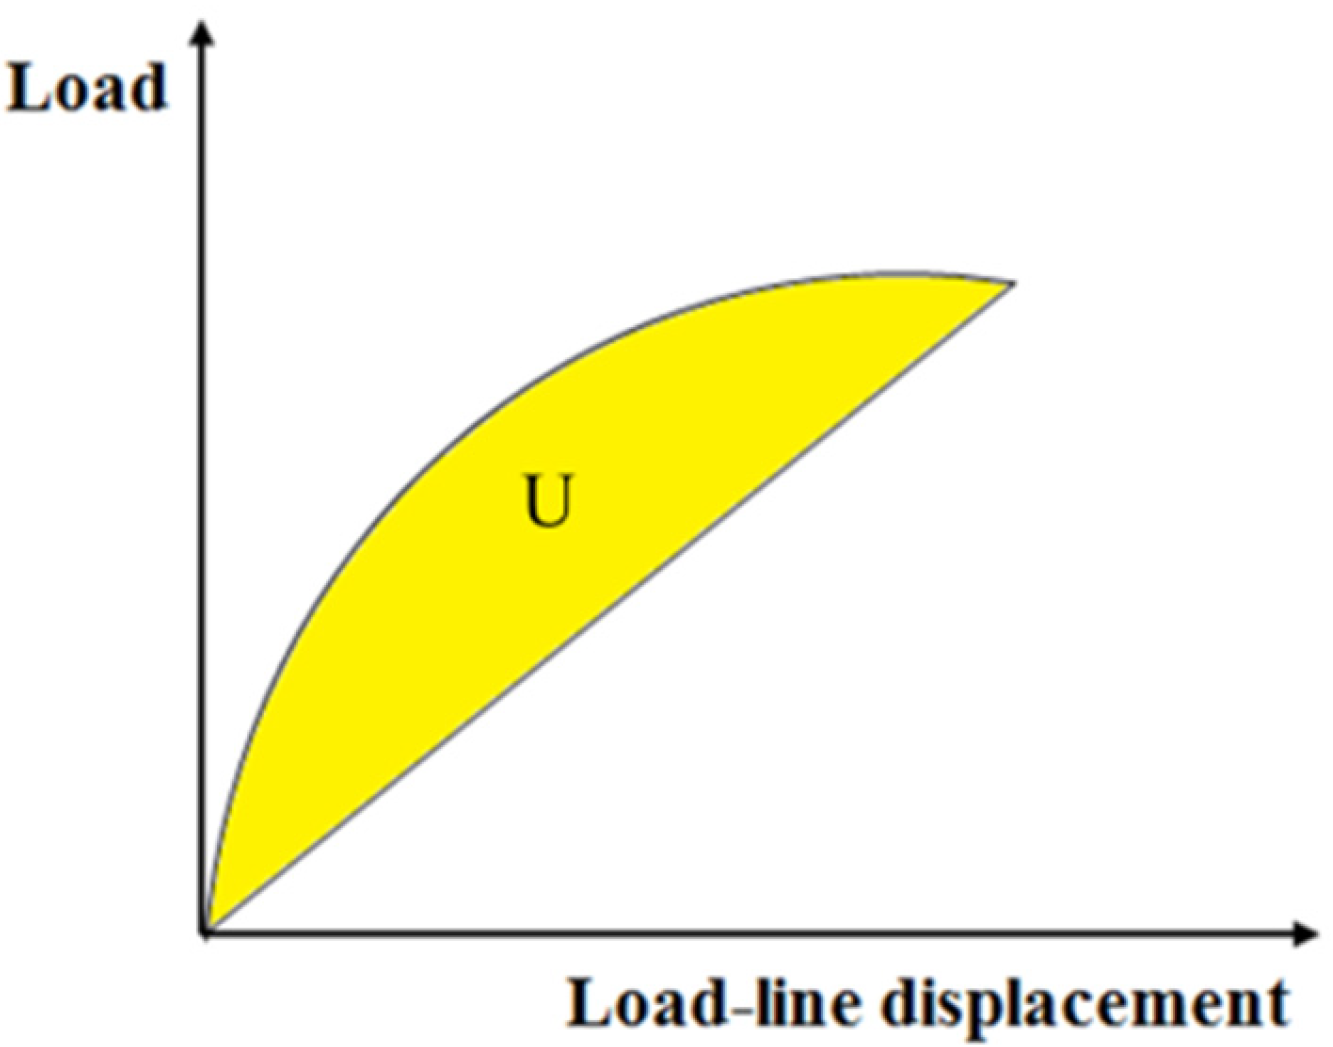
Figure 9.
Result of finite element analysis for the plastic limit load.

Figure 10.
Result of finite element analysis for elastic compliance.
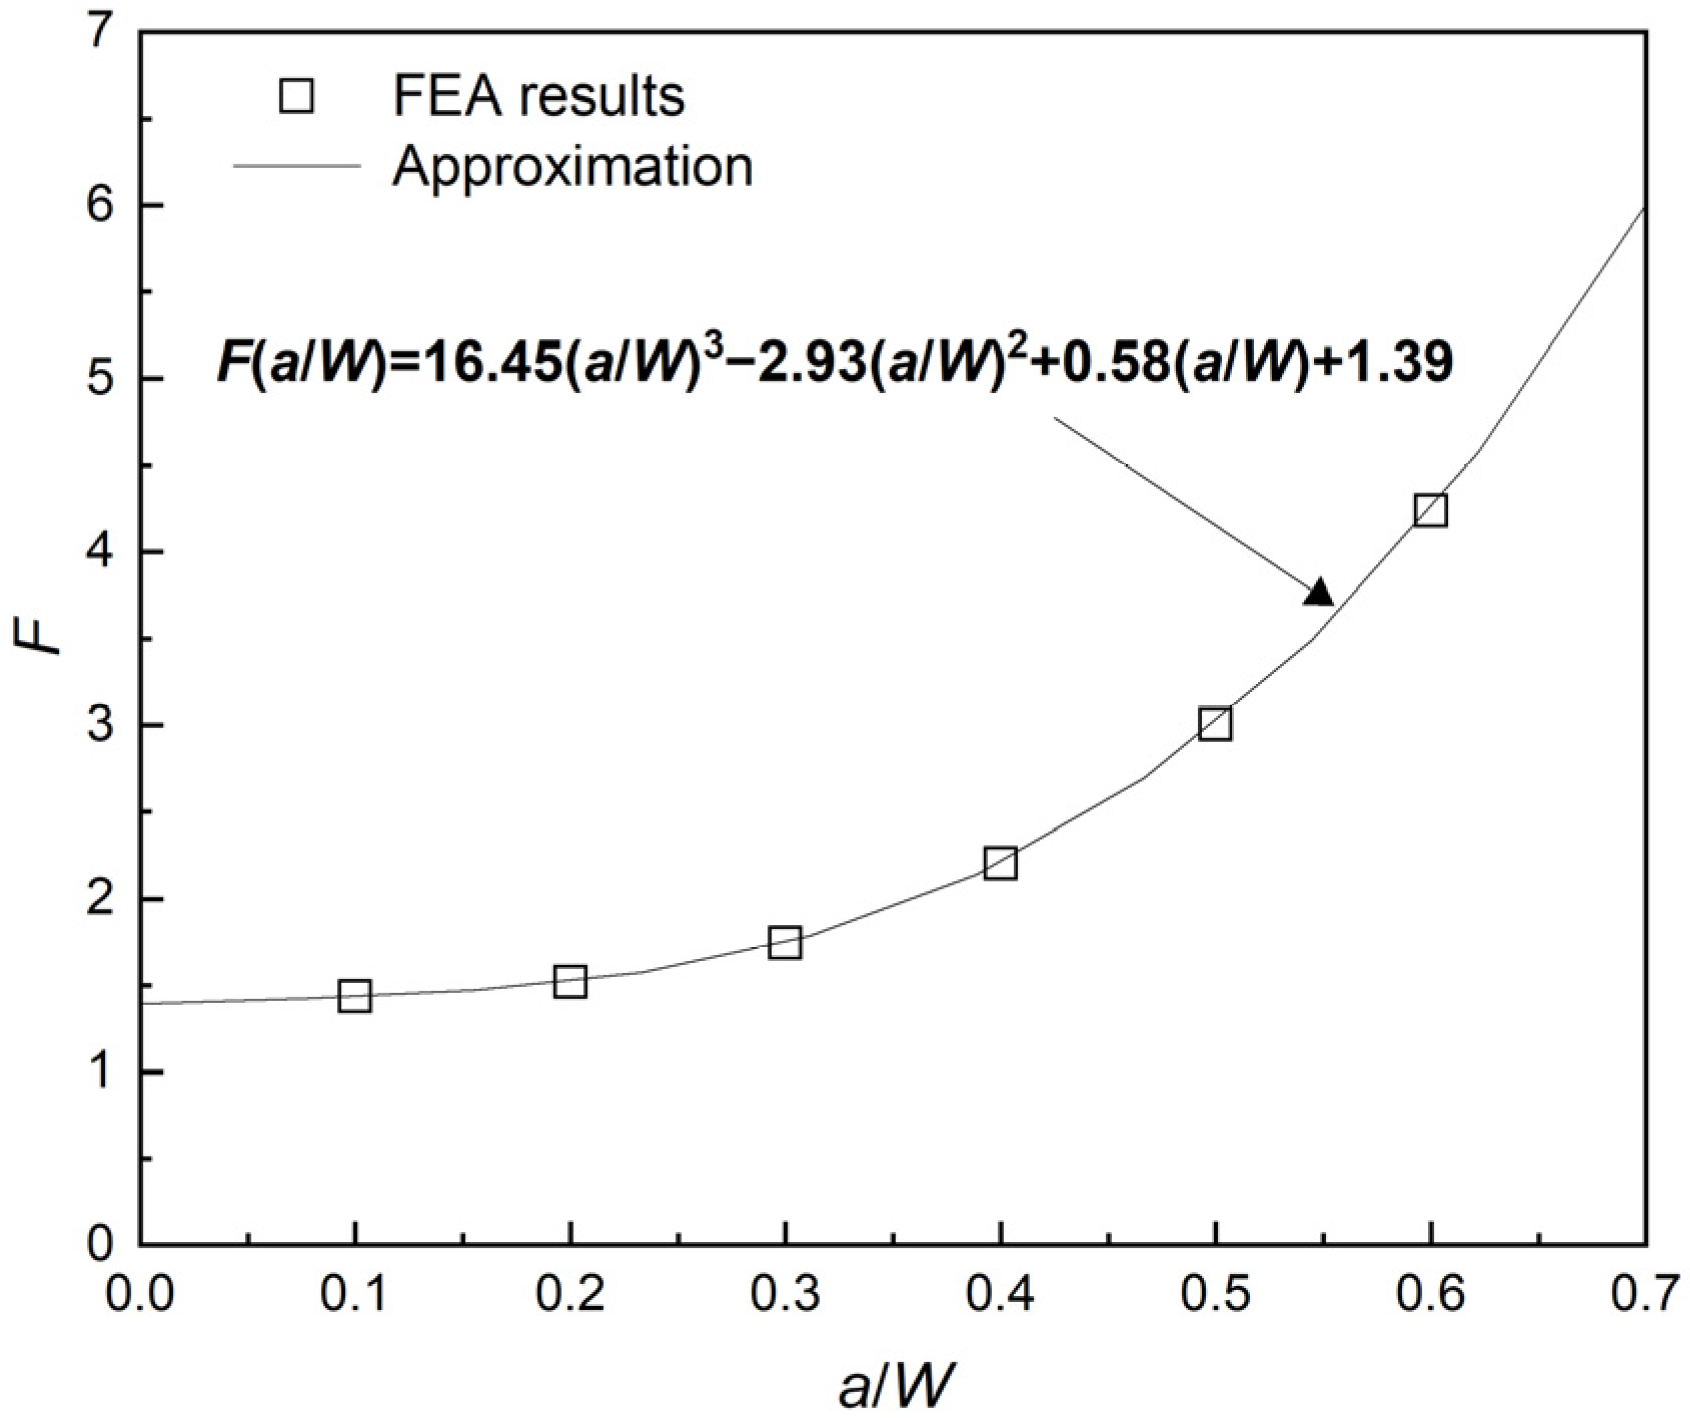
Figure 6.
Determination of plastic area under experimental load versus load-line displacement curve for J estimations.
Figure 6.
Determination of plastic area under experimental load versus load-line displacement curve for J estimations.

Figure 7.
Finite element modeling of flat ESG specimen.

Figure 11.
Load versus load-line displacement curves for incremental displacement: (a) 0.25 mm; (b) 0.5 mm; (c) 0.75 mm; (d) 1 mm; (e) 2 mm.
Figure 11.
Load versus load-line displacement curves for incremental displacement: (a) 0.25 mm; (b) 0.5 mm; (c) 0.75 mm; (d) 1 mm; (e) 2 mm.
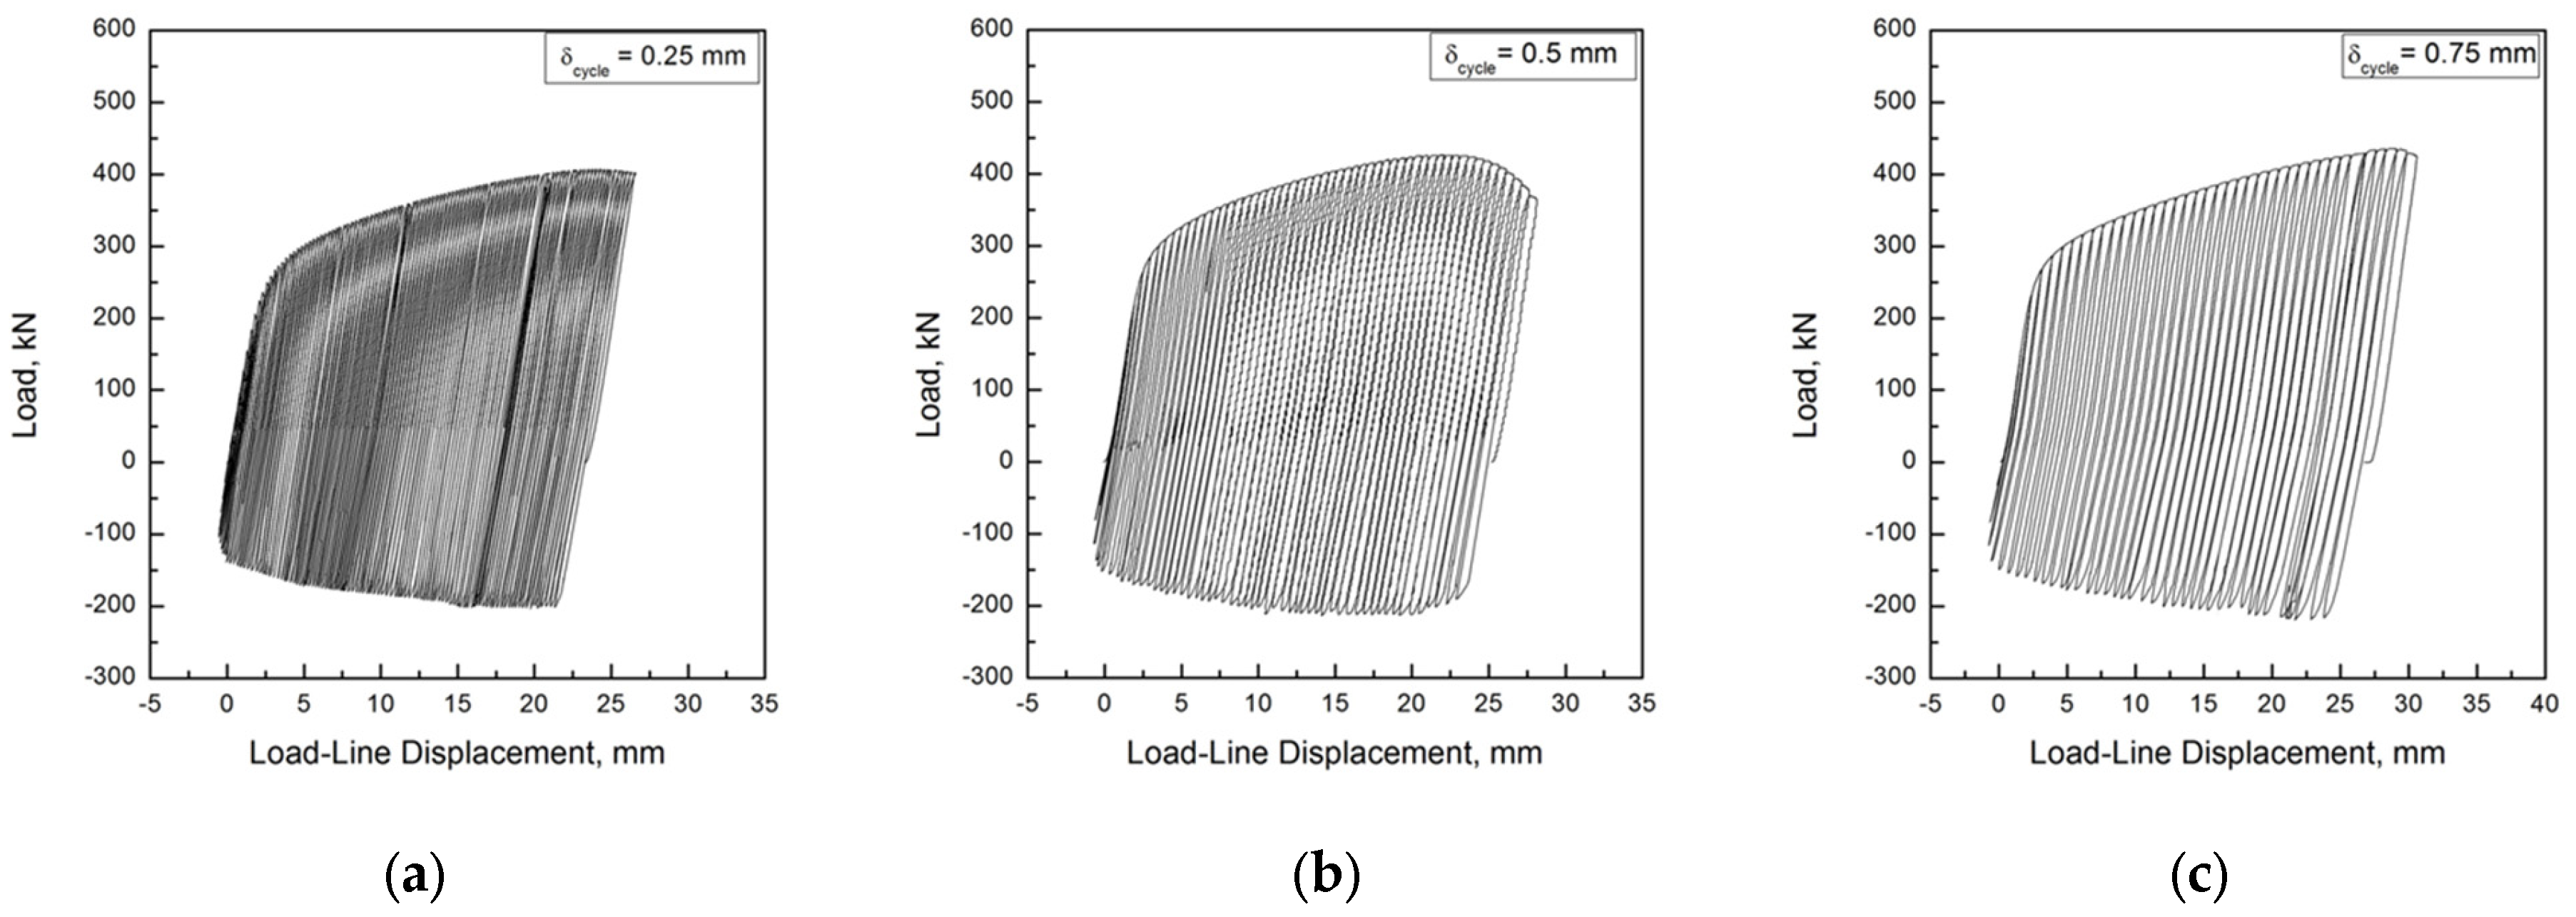
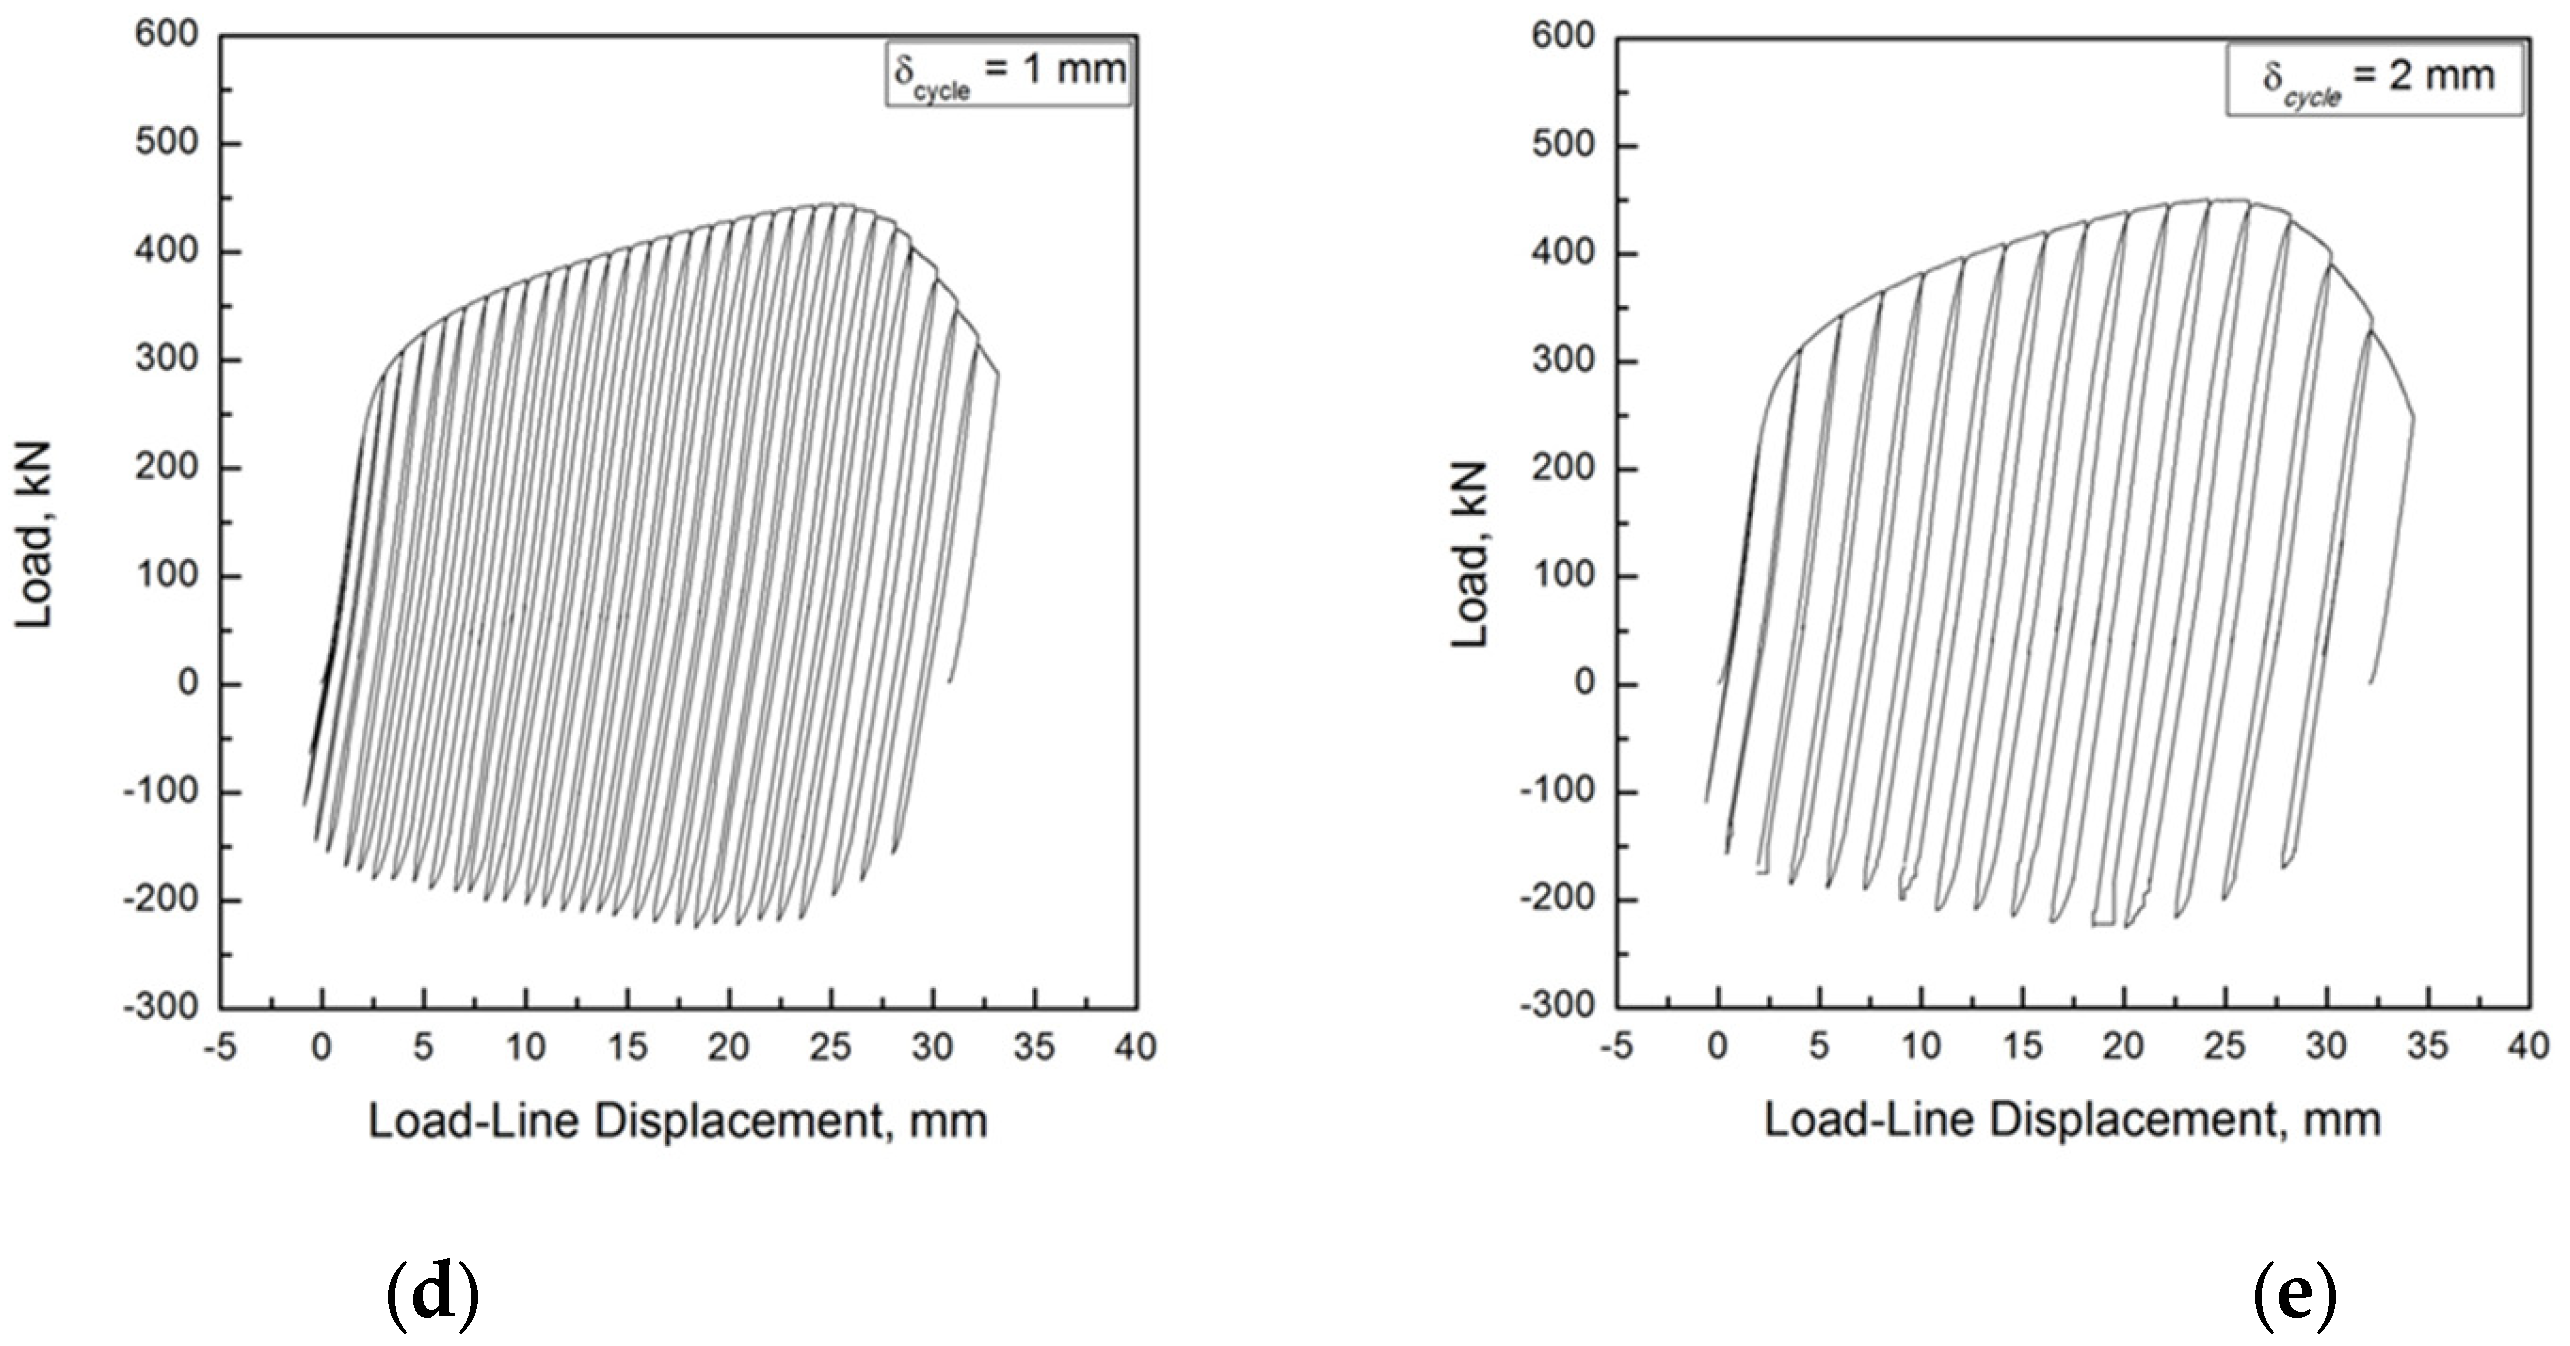
Figure 12.
Comparison between J-R curves under reverse cyclic loading and J-R curve under monotonic tensile loading conditions.
Figure 12.
Comparison between J-R curves under reverse cyclic loading and J-R curve under monotonic tensile loading conditions.
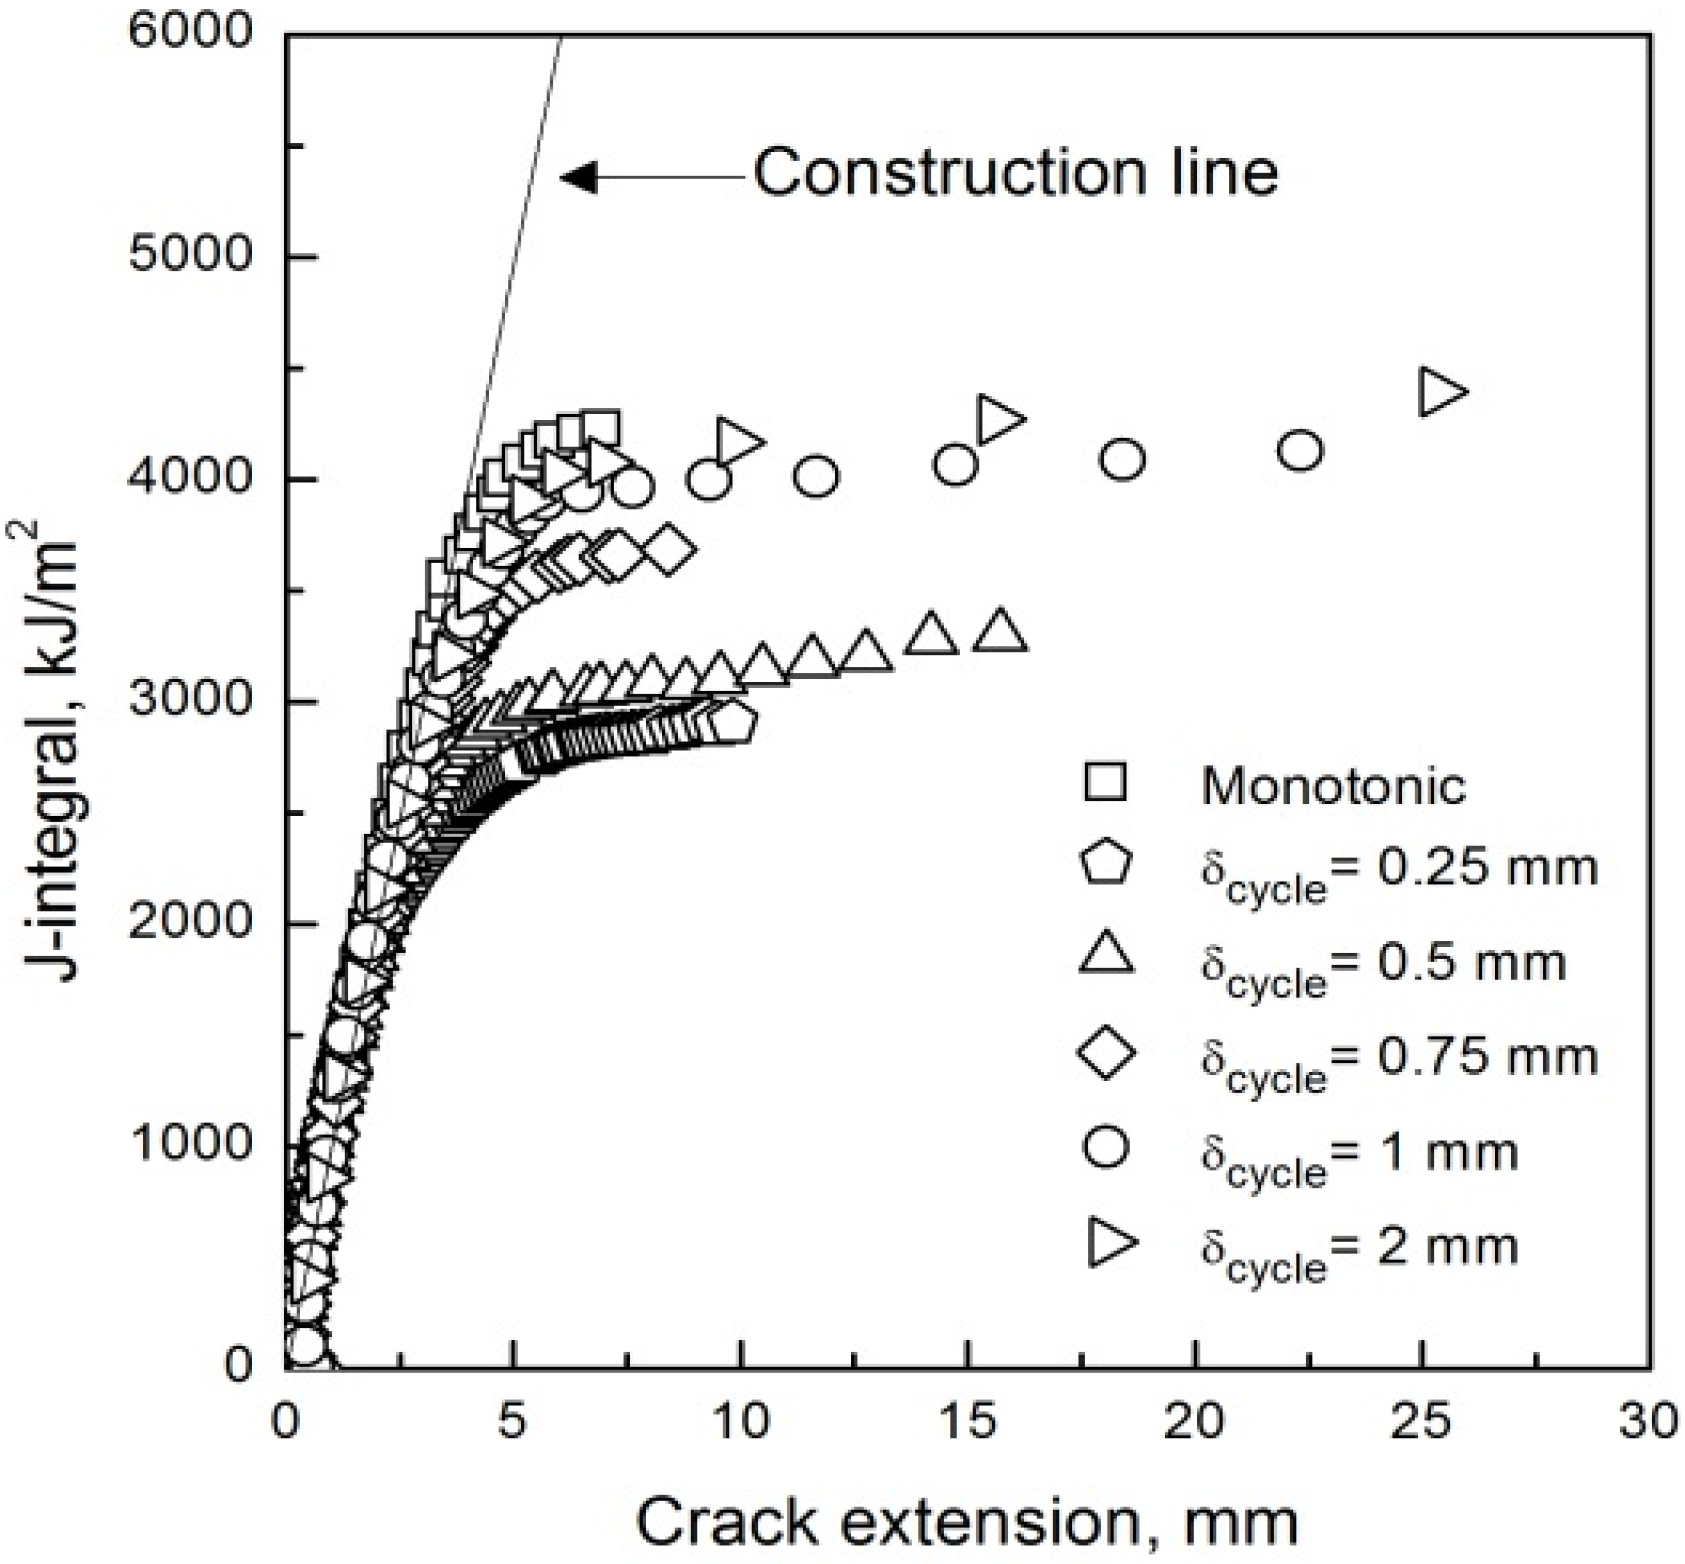
Figure 13.
Crack driving force diagram.
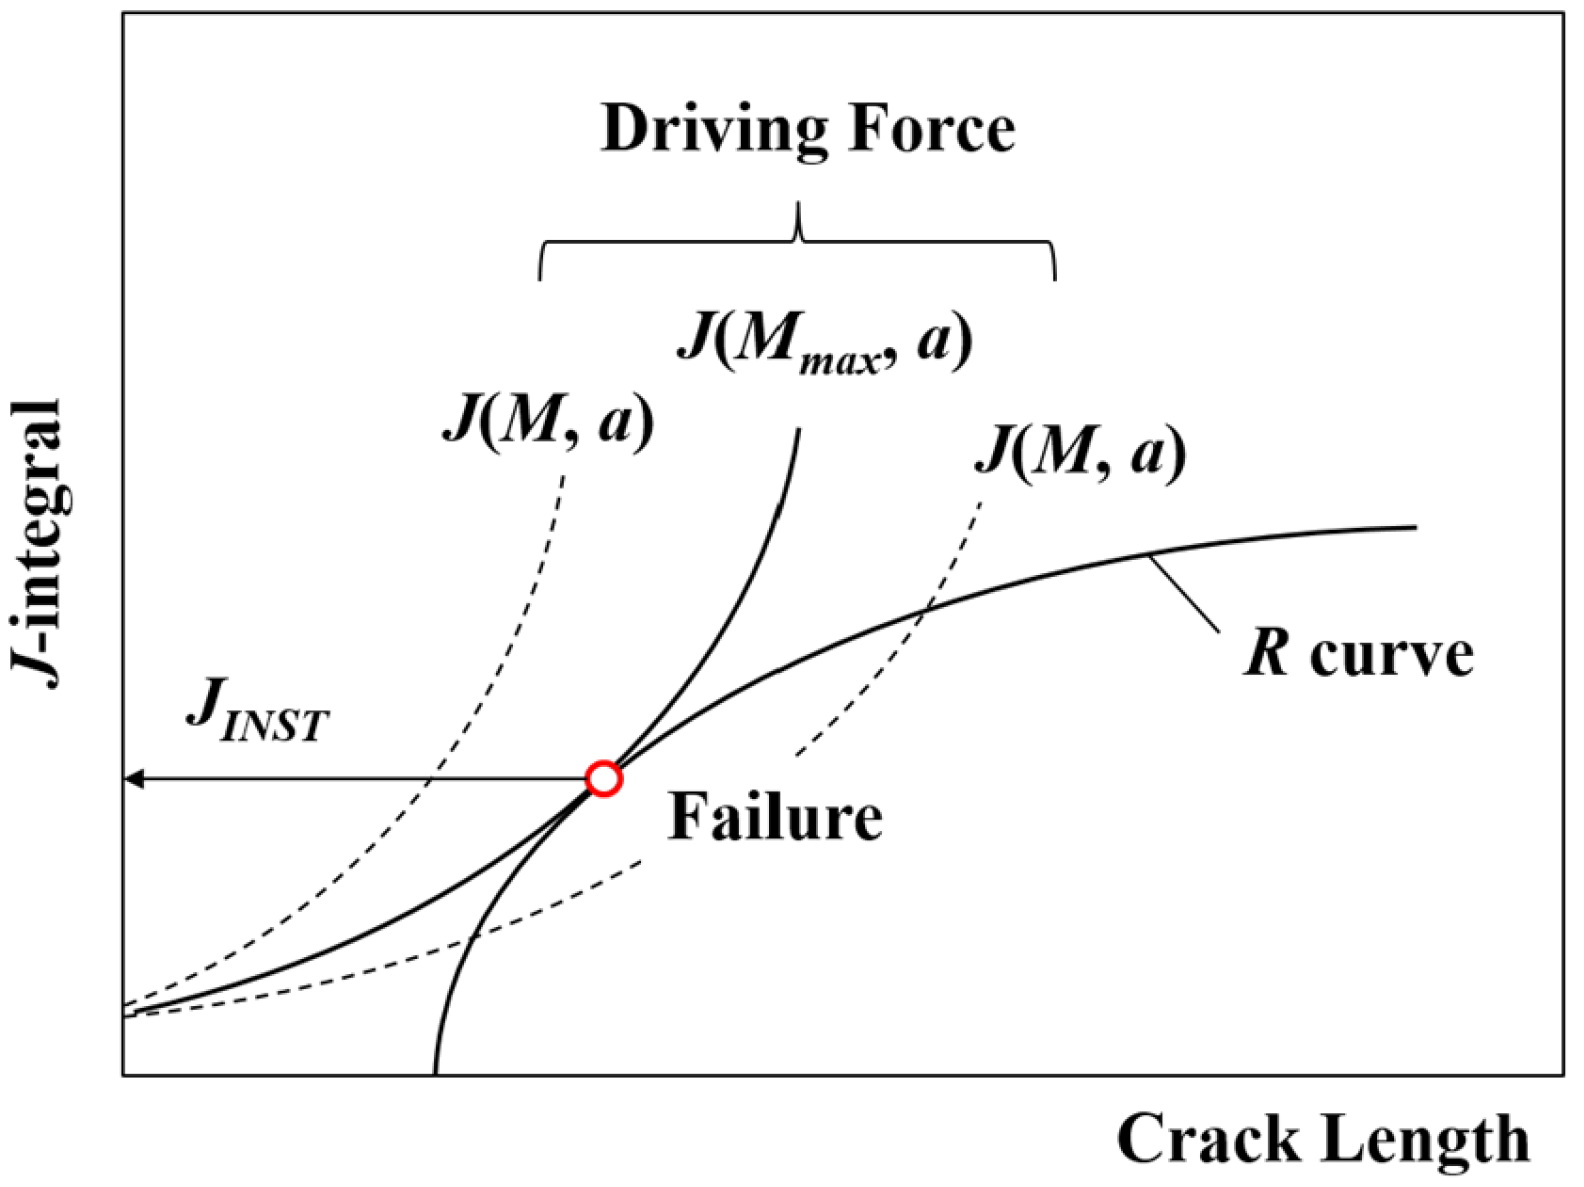
Figure 14.
Results of crack driving force diagram analysis: (a) 0.25 mm; (b) 0.5 mm; (c) 0.75 mm; (d) 1 mm; (e) 2 mm; (f) Quasi-static.
Figure 14.
Results of crack driving force diagram analysis: (a) 0.25 mm; (b) 0.5 mm; (c) 0.75 mm; (d) 1 mm; (e) 2 mm; (f) Quasi-static.

Table 1.
Mechanical properties of SA312 TP316L.
| Young’s Modulus | Poisson’s Ratio | Yield Strength | Tensile Strength | Ramberg–Osgood Constant | |
|---|---|---|---|---|---|
| α | n | ||||
| 204 GPa | 0.3 | 160 MPa | 485 MPa | 2.36 | 3.39 |
Table 2.
Chemical composition of SA312 TP316L.
| Elements | C | Mn | Si | P | S | Cr | Mo | Ni | Fe |
|---|---|---|---|---|---|---|---|---|---|
| SA312 TP316L | 0.03 | 2.0 | 1.0 | 0.045 | 0.03 | 17.0 | 2.5 | 12.0 | Balance |
(Unit: wt.%).
Table 3.
Dimensions of nuclear plant piping.
| Outer Diameter | Inner Diameter | Thickness |
|---|---|---|
| 323 mm (12.717 in) | 258 mm (10.157 in) | 33 mm (1.299 in) |
Table 4.
Summary of fracture resistance test results.
| Material | Strain Rate [mm/min] | Load Ratio | Incremental Displacement [mm] | C1 [kJ/m2] | C2 |
|---|---|---|---|---|---|
| SA312 TP316L | 3 | −0.5 (Reverse cyclic) | 0.25 | 2,422 | 0.081 |
| 0.5 | 2,506 | 0.098 | |||
| 0.75 | 2,991 | 0.102 | |||
| 1 | 3,016 | 0.114 | |||
| 2 | 3,053 | 0.124 | |||
| 0(Quasi-static) | 0 | 3,294 | 0.131 |
Table 5.
Results of LBB analysis using CDFD method.
| Specimen Type | Crack Length | Load Ratio | Incremental Displacement [mm] | JINST [kJ/m2] | Mmax [kN·m] |
|---|---|---|---|---|---|
| ESG | a/W = 0.08 | −0.5 (Reverse cyclic) | 0.25 | 2,751 | 81.3 |
| 0.5 | 2,919 | 82.4 | |||
| 0.75 | 3,392 | 85.8 | |||
| 1 | 3,592 | 86.5 | |||
| 2 | 3,679 | 86.8 | |||
| 0(Quasi-static) | 0 | 3,768 | 87.4 |
Disclaimer/Publisher’s Note: The statements, opinions and data contained in all publications are solely those of the individual author(s) and contributor(s) and not of MDPI and/or the editor(s). MDPI and/or the editor(s) disclaim responsibility for any injury to people or property resulting from any ideas, methods, instructions or products referred to in the content. |
© 2023 by the authors. Licensee MDPI, Basel, Switzerland. This article is an open access article distributed under the terms and conditions of the Creative Commons Attribution (CC BY) license (https://creativecommons.org/licenses/by/4.0/).
Share and Cite
MDPI and ACS Style
Choi, J.; Lee, D.; Park, K.; Park, S. Leak-before-Break (LBB)-Based Safety Verification of Reverse Cyclic Loading for 316L Stainless Steel: A Study Using Flat ESG Specimens. Metals 2023, 13, 1999. https://doi.org/10.3390/met13121999
AMA Style
Choi J, Lee D, Park K, Park S. Leak-before-Break (LBB)-Based Safety Verification of Reverse Cyclic Loading for 316L Stainless Steel: A Study Using Flat ESG Specimens. Metals. 2023; 13(12):1999. https://doi.org/10.3390/met13121999
Chicago/Turabian StyleChoi, Jaegu, Dongkeun Lee, Keontae Park, and Soo Park. 2023. "Leak-before-Break (LBB)-Based Safety Verification of Reverse Cyclic Loading for 316L Stainless Steel: A Study Using Flat ESG Specimens" Metals 13, no. 12: 1999. https://doi.org/10.3390/met13121999
Note that from the first issue of 2016, this journal uses article numbers instead of page numbers. See further details here.