
Forming and Microstructure Evolution Mechanism of Asymmetric Molten Pool in Laser Cladding
by
 and
and
Hong Wang
1,
Xiaofeng Zhang
1,
Yunfei Wang
2,
Jiali Zhou
2,
Kai Ma
3,
Fuwen Ma
1,
Yanhai Cheng
2,* and
Chuwei Gao
2 1
CCTEG Taiyuan Research Institute Co., Ltd., Taiyuan 030006, China
2
School of Mechatronics Engineering, China University of Mining and Technology, Xuzhou 221116, China
3
Shanxi Tiandi Coal Mining Machinery Co., Ltd., Taiyuan 030006, China
*
Author to whom correspondence should be addressed.
Metals 2023, 13(12), 1970; https://doi.org/10.3390/met13121970
Submission received: 25 July 2023
/
Revised: 31 August 2023
/
Accepted: 6 September 2023
/
Published: 3 December 2023
Abstract
:This study aimed to investigate the impact of substrate tilt angle and different scanning methods on powder utilization, morphology profile parameters, and microstructure evolution in laser cladding single-track experiments. The results revealed several key findings. Firstly, as the substrate tilt angle increased, the laser spot projected on the tilted substrate transformed from circular to elliptical, and the substrate heat input decreased proportionally with the tilt angle. Secondly, regardless of the scanning method employed, powder utilization decreased with higher substrate tilt angles due to increased powder asymmetry, leading to more collisions and rebounds between the powder particles and the substrate. Moreover, the trends of morphology profile parameters in longitudinal upward and downward scanning methods were similar to the transverse scanning, except for the clad width, which exhibited an opposite trend. Notably, the longitudinal downward scanning method demonstrated superior stability and higher powder utilization. These findings offer valuable insights for optimizing laser cladding processes, with the ultimate goal of enhancing the quality and efficiency of the fabricated components.
1. Introduction
The concept of laser cladding technology was first proposed by American engineer Gnanamuthu in the 1970s [1]. Due to its advantages such as its green and environmentally friendly nature, good economic benefits, high forming efficiency, and excellent coating performance, it has been widely applied in various fields of metallurgy, mining, marine engineering, aerospace, and other critical component remanufacturing [2]. Numerous scholars have conducted research on the influence of laser cladding process parameters on cladding formation, optical-powder coupling characteristics, heat and mass transfer in the molten pool, powder flow convergence characteristics, mechanical properties of cladding layers, formation defect control, and material system development [3,4,5]. Most of the existing studies analyze the conditions based on the arrangement at the substrate level, where the nozzle axis is perpendicular to the substrate, and the molten pool exhibits a high degree of symmetry during cladding [6,7,8]. However, in the practical laser cladding repair of components with complex shapes, such as gear surfaces, engine blades, crankshafts, and spiral shafts, maintaining a perpendicular arrangement between the repair surface and the nozzle may cause interference, resulting in equipment damage. Moreover, when molten metal droplets are deposited on non-horizontal surfaces, the presence of an asymmetric laser energy distribution [9,10], powder flow field [11,12], gravity effect [13,14], surface tension [15,16,17] and unbalanced force inside the molten pool [18] can lead to unfavorable molten pool flow behavior [18,19] and asymmetric cladding morphology [20,21,22], which will affect the forming accuracy and stability [23], and even form defects [24], which will reduce the performance of the cladding layer [25]. To meet the practical production needs and broaden the application scope of laser cladding technology, it is urgent to conduct research on the formation and microstructural evolution mechanism of asymmetric molten pools in laser cladding.
Currently, most studies on the formation characteristics of asymmetric molten pools in laser cladding have been based on ideal assumptions [10,26], neglecting the influence of powder particles on the energy distribution and cladding formation, which has compromised the reliability of experimental results. Therefore, this study establishes a model for the attenuation rate of powder flow and the distribution of energy density based on the Mie scattering theory. It investigates the impact of non-horizontal surfaces on the formation efficiency of cladding layers and powder utilization rates under different scanning strategies, aiming to provide theoretical support for the laser cladding repair of complex surface components.
2. Experimental Procedures
The cladding powder used in the experiment was an Fe-based Rockit-401 alloy powder [27,28] made using the MD-PF(W)25/100-2.5 water atomization pulverizing device, and the substrate was made of high-quality alloy steel 20Cr2Ni4A [29], whose chemical composition is shown in Table 1. The surface morphology of Rockit-401 powder is spherical, sausage-like, and irregularly granular, and its coating has excellent wear and corrosion resistance, which can be an environmentally friendly alternative to the hard-chrome plating [27]. On the other hand, the thermophysical properties of substrate and powder are similar, as shown in Figure 1, which is suitable for laser cladding experiments. The diameter of the alloy powder is basically in the range of 20~140 μm, with a Rosin–Rammler distribution, and the median diameter is d = 56 μm. Since the powder feeder of the RFL-C2000X laser cladding system used relied on a rotating disk to transport the powder to the nozzle, it was unable to directly display the numerical value of the powder feeding rate. Therefore, the relationship between the rotating speed of the disk and the powder feeding quantity was obtained using a weighing method, as shown in Figure 2, with the following fitted equation:
The parameters of the laser cladding process are shown in Table 2. The powder utilization rate under the condition of tilting the substrate using the weighing method and keeping the laser head perpendicular to the horizontal plane was calculated. Ten single-track cladding deposition experiments were conducted using the parameters in Table 2, with each scan length being 40 mm. The quality of the samples before and after deposition was measured using a high-precision balance. Before weighing, the cladding layer and the unmelted 20Cr2Ni4A powder particles on the substrate were cleaned with a brush and wiped clean with anhydrous alcohol, followed by drying. The masses before and after deposition are represented as M1 and M2, respectively. Three sets of the above steps were repeated at each inclination angle, and the average of the difference between the two masses was taken as the effective deposition powder mass. The total powder feed mass is represented as m, with the feed rate Q and feed time t being fixed values. The powder utilization rate R under this set of experimental parameters is determined by
The post-cladding specimens were cut into 10 × 10 × 10 mm cubes. Grinding and polishing were performed using 240#, 600#, 1000#, 1500#, and 2000# sandpaper, as well as polishing cloth. The cladding layer was etched with aqua regia for 10 s. The cross-sectional morphology of the cladding layer was examined using a Sony M3LY630T metallographic microscope (SUNNY, CHN), while the microstructure was observed using an MAIA3 LMH (TESCAN, CZ, Brno, Czechia) field emission scanning electron microscope (FSEM) operating at a high voltage (HV) of 10 kV and a working distance (WD) of 10 mm. The Thema-CAM A615 infrared thermal imager was employed for real-time monitoring of the laser cladding process temperature.
3. Results and Discussion
3.1. Laser Energy Distribution and Attenuation Model
3.1.1. Laser Attenuation Rate Model
The powder, when irradiated by a laser, absorbs its energy and scatters the laser beam, which refers to the attenuation effect of the powder flow on laser energy, as shown in Figure 3. According to Mie scattering theory, the attenuation rate of a laser can be characterized by the extinction coefficient Kexc [1]. The increase in laser power after a length of l is given by
where I0 and I represent the laser energy densities at the nozzle orifice and the matrix surface, respectively. S is the cross-sectional area of the laser beam and Sp is the cross-sectional area of the powder. n represents the powder concentration. The laser attenuation rate U can be calculated as follows:
The parameters of powder particle size and distance between the nozzle outlet and the substrate were predetermined in the experiment. Therefore, by utilizing Equation (4), the influence curve of gas flow rate and powder feeding rate on laser power attenuation can be obtained, as illustrated in Figure 4.
Under the same powder feeding conditions, the gas flow rate exhibits an exponential decrease in the laser energy attenuation rate. Similarly, the laser energy attenuation rate shows an exponential increase as the powder feed rate increases. It is generally assumed that the powder particles maintain a consistent velocity with the gas flow after being transported through a long powder tube. Therefore, the gas flow rate affects the motion state of the particles. With the increase in carrier gas flow, the collision between particles and particles, as well as between particles and the wall of the powder feeding channel, becomes more pronounced. Additionally, the higher gas flow rate results in a larger Reynolds number, leading to increased turbulence in both the powder and gas flow fields. Consequently, the powder particles become more susceptible to disturbances from the airflow, causing them to deviate from the region where laser-powder coupling occurs. As a result, the mass concentration of the powder flow decreases in the surrounding space, resulting in a reduced attenuation effect on the laser. Conversely, increasing the powder feed rate significantly enhances the likelihood of effective particles being present in the laser-powder coupling region. This leads to an increased mass concentration of the powder flow in the aggregation area, gradually amplifying the laser attenuation rate.
3.1.2. Laser Energy Density Model
The projection of the laser beam on the horizontal plane is circular, and its energy density follows a Gaussian normal distribution as follows:
When the substrate is placed at an inclined angle, the projection of the laser spot transforms into an elliptical shape, as shown in Figure 5.
When considering the influence of laser attenuation rate, combined with Equation (4), the laser energy density distribution on the tilted surface of the substrate with an angle θ can be obtained:
As it gradually elongates along the inclined direction with increasing angle, the study of energy distribution along the y-axis reveals that x = 0. Consequently, the peak power density can be determined:
The peak offset value is
The energy density distribution curve on the substrate surface can be obtained from Equations (4)–(6), as shown in Figure 6.
When the substrate is placed horizontally, the laser energy density curve exhibits y-axis symmetry and a concentrated distribution, as illustrated in Figure 6a. However, as the substrate inclination angle increases, there is an overall decreasing trend in the laser power density, and the symmetrical center gradually moves along the positive y-axis, resulting in a more dispersed distribution. The peak intensity of the laser also decreases as the substrate inclination angle increases, with the magnitude of the decline initially increasing and then decreasing. Additionally, the offset and amplitude of the symmetrical center of the laser power density increase as the substrate inclination angle increases, as shown in Figure 6b. The elongation of the major axis of the elliptical beam along the y-axis causes a reduction in the laser power density and a gradual divergence in the distribution. In the absence of powder effects, the distribution of the laser power density remains symmetric about the y-axis. However, when considering the coupling effect between light and powder, due to the inclined placement of the substrate, there is an uneven distance of the powder particle interaction with the laser along the y-axis. Powder particles in the positive half of the y-axis exhibit a weaker attenuation on the laser, while in the lower half, the attenuation is stronger. As the angle gradually increases, the difference in the coupling effect between the upper and lower halves in terms of light–powder interaction heightens, and the asymmetry in the concentration of powder mass becomes increasingly prominent. The combined effect leads to the symmetrical center of the light intensity distribution curve being positioned in the positive y-axis direction, with an increased magnitude of offset.
Figure 7 and Figure 8 illustrate the temperature distribution in the molten pool during the cladding process captured by the infrared imaging system. As the inclination angle increases, there is a decreasing trend in the overall temperature of the molten pool. When the laser beam is applied, the matrix and powder are heated instantaneously and reach the maximum temperature in a very short time. During the 3 s laser beam exposure, the temperature of the molten pool remains relatively stable. Furthermore, the maximum temperature of the molten pool decreases with an increasing inclination angle. This result is consistent with the trend of power density changes shown in Figure 6.
3.2. Powder Catchment Efficiency
In complex light–powder coupling scenarios, not all powder particles are able to enter the molten pool; under the influence of the flow field, they may deviate from their trajectory, collide with the substrate, and bounce back. This is often accompanied by splashing of molten droplets and vaporization and combustion, which significantly reduces the powder utilization rate. The powder utilization rate is a critical indicator for evaluating the material consumption level in laser cladding and repair technology. It is also an important parameter for cost estimation, formation evaluation, and production efficiency assessment. When the substrate is inclined, we are particularly interested in understanding how the powder utilization rate varies with the inclination angle. Based on the different forces of gravity acting downward along the y-axis and the scanning direction of the laser head, there are three scanning modes: transverse scanning, bottom-up scanning along the y-axis, and top-down scanning along the y-axis, as shown in Figure 5. By utilizing the process parameters shown in Table 2, we can observe the variation in the powder utilization rate with the substrate inclination angle under different scanning modes, as illustrated in Figure 9.
According to Figure 9, as the inclination angle gradually increases, the powder utilization rate in all three scanning modes exhibits a significant downward trend. At θ = 40°, the powder utilization rate has already decreased by more than 30% compared to when the substrate is placed horizontally, indicating a substantial decline in powder utilization. This is because, with an increasing angle, the overall power density decreases, leading to a significant reduction in the light intensity at the edge of the beam. As a result, the substrate cannot reach its melting point to form a molten pool, resulting in more unmelted powder particles. Simultaneously, in the positive y-axis direction, the laser irradiation duration is insufficient to achieve complete melting of the powder into the molten pool. Consequently, solid powder particles collide with and rebound from the substrate within the cladding region, leading to the wastage of powder material. On the other hand, in the negative y-axis direction, as the distance of the light–powder coupling increases, the attenuation of the powder flow on the laser intensifies, resulting in a decrease in the laser power density at the substrate surface, which hinders the formation of a molten pool. This leads to a decrease in the powder utilization rate. As the angle increases, the rebound angle of the powder particles from the substrate surface increases, while the decrease in the laser energy density on the substrate surface becomes more pronounced, resulting in a decline in the powder utilization rate.
The powder utilization rate curve for the top-down scanning mode always remains above that of the bottom-up scanning mode. This is due to the inconsistent laser energy density between the upper and lower parts of the elliptical beam, with higher intensity in the upper half and lower intensity in the lower half, as shown in Figure 10. When the laser head scans from bottom to top, there is a large agglomerative unmelted powder in the surface area of the cladding layer, which is because the energy density in the front of the molten pool is sufficient to completely melt the metal particles, but the back edge of the molten pool is covered by the lower-energy-density laser during the scanning process. As a result, partially melted powder is retained during the solidification process, becoming adhered powder on the surface. However, when the laser head scans from top to bottom, the energy density at the front edge of the melt pool is lower, making it easier to form partially melted powder particles. But the energy at the rear edge of the melt pool is high enough to melt the adhered powder particles at the front edge as the laser moves, resulting in a high-quality surface. Additionally, during the top-down scanning, the scanning direction, melt pool flow direction, and the component of the protective gas along the negative y-axis are consistent, reducing oxidation of the clad layer and further improving the powder utilization rate.
3.3. Analysis on Forming of Single-Pass Cladding
As the inclination angle of the substrate increases, the asymmetry of the cross-sectional morphology of the cladding layer becomes more pronounced. Its contour gradually flattens, and the highest point is no longer at the center but shifts toward the negative y-axis direction. In other words, the morphology of the cladding layer exhibits the characteristic of being wider in the lower half and narrower in the upper half, as shown in Figure 11. At the same time, there is warping, unmelted powder, and incomplete melting of the molten slag at the edge of the lower half of the cladding layer, while such phenomena are almost absent at the edge of the upper half of the cladding layer.
With the increase in substrate tilt angle, the width of the cladding layer also gradually increases, as shown in Figure 12a. The enlargement of the beam leads to an expansion of the energy zone acting on the substrate surface, resulting in a larger melting region and a corresponding increase in cladding layer width. The cladding layer height, melt pool depth, cross-sectional area of the cladding layer, and cross-sectional area of the melt pool all decrease with the increase in tilt angle, as shown in Figure 12b,c. The cladding layer height and cross-sectional area are directly related to the powder utilization rate. As the tilt angle increases, the powder utilization rate gradually decreases, resulting in a decrease in cladding layer height and cross-sectional area [22]. The size of the melt pool cross-sectional area depends on the distribution of light intensity. An increased substrate tilt angle reduces the overall heat input, leading to a decreasing trend in the melt pool area. The depth of the melt pool reflects the magnitude of the laser energy density peak, with a larger melt depth corresponding to a larger peak value. The actual trend of melt depth change is consistent with Equation (5).
Both the offset of the cladding layer and the offset of the melt pool increase with the increase in substrate tilt angle. The contour shape of the cladding layer cross-section is mainly affected by factors such as the dynamic viscosity of the melt pool, surface tension, gravity, laser shielding gas, and powder carrier gas flow impact. When the substrate is placed horizontally, the direction of gravity is perpendicular to the substrate surface. In this case, the laser beam coincides with the center of the powder spot, forming a coaxial alignment of the light and powder. Under the influence of surface tension, the melt pool converges and contracts, forming a stable and relatively symmetric cladding layer. When the substrate is tilted, the coaxial alignment of the light and powder is no longer maintained, and the melt pool is affected by gravity and flows accordingly. With an increasing substrate tilt angle, the vertical component of the gravitational force along the negative y-axis gradually increases. The offset of the melt pool reflects the varying pattern of the offset of the laser power density peak, which increases gradually with the increase in tilt angle, as shown in Figure 12d.
3.4. Analysis of Microstructures
The SEM images of the middle section morphology of the cladding layer at different inclinations are shown in Figure 13. When the substrate is placed horizontally, gravity and heat dissipation have the same direction, which is beneficial for the heat dissipation of the melt pool [30]. In this case, the temperature gradient G in the middle of the melt pool is higher, resulting in a higher nucleation rate and the formation of finer dendritic and cellular crystals, as illustrated in Figure 13a.
With increasing substrate tilt, the molten droplets are influenced by their gravity force M and overcome the effects of surface tension Fµ, viscous shear force Fμ, and shielding gas pressure FP, resulting in the phenomenon of flowing. The force analysis along the y-axis direction of the melt pool yields
where Fγy and FPy represent the components of surface tension and shielding gas pressure, respectively, acting in the direction of the inclined surface.
As the substrate tilt angle increases, the temperature of the melt pool gradually decreases, leading to an increase in the cooling rate. Simultaneously, the dynamic viscosity decreases, resulting in reduced flowability of the melt pool, which facilitates grain refinement. Furthermore, the component of shielding gas pressure along the inclined surface can be regarded as an increase in viscous shear force, which enhances the cooling rate and provides a certain inhibitory effect on the flow of the melt pool. However, the increase in tilt angle amplifies the phenomenon of melt pool flow, as the force of gravity promotes internal flow activity within the melt pool, prolonging the solidification time and allowing sufficient time for grain growth, thereby increasing grain size. When the tilt angle variation is small, the effects of these factors counterbalance each other, resulting in a minimal difference in grain size at the center of the deposited layer compared to when the substrate is placed horizontally, as shown in Figure 13b–d. As the tilt angle continues to increase, gravity weakens the cooling effect on the melt pool and significantly interferes with internal flow patterns, further agitating the melt pool and accelerating element diffusion within it, leading to significant grain growth, as illustrated in Figure 13e.
In order to investigate the impact of different laser energy density distributions of elliptical spots on the microstructure of the molten pool, the microstructure of the upper and lower regions of the cladding layer obtained at an inclination of 40° is analyzed, as shown in Figure 14. According to the theories of HOADLEY et al. [31], the angle between the solid–liquid interface normal and the scanning velocity v is defined as the solidification front direction angle ω, which has an analytical relationship with the solidification rate, as follows:
When the scanning speed v is fixed, the solidification direction angle ω gradually decreases from 90° to 0° as it progresses from the bottom to the top of the molten pool, leading to a gradual decrease in the solidification rate S. The temperature gradient G in the lower half of the spot is smaller, and with an increasing tilt angle, the asymmetry of the melt pool becomes more pronounced, with the circulating material being concentrated in the lower half. This results in an increased solidification time of the melt pool. Consequently, the cooling rate λ (G × S) decreases, leading to larger grain sizes in the lower half compared to the upper half, as shown in Figure 14c,f. The temperature gradient G in the lower half of the melt pool changes less, resulting in a relatively small variation in the shape control factor G/S. Thus, the occurrence of a transition in the structural type of the lower half cladding layer is not evident. At this stage, the lower half of the melt pool is mainly composed of coarse columnar crystals. As the solid–liquid interface moves, larger cell-like crystals and dendritic crystals appear, as shown in Figure 14a,b. The upper half of the melt pool exhibits smaller columnar crystals, dendritic crystals, and cell-like crystals, as shown in Figure 14d,e. Simultaneously, due to the high tilt angle, there is significant asymmetry in the flow field of the melt pool, with a denser and more chaotic distribution of velocity vectors in the lower half. The peak velocity gradually moves downward, and the velocity gradient is greater in the lower half compared to the upper half [19], resulting in a more disorderly direction of grain growth and heat dissipation.
4. Conclusions
- (1)
- The introduction of the extinction coefficient Kexc in the calculation of laser energy attenuation reveals its inverse proportionality to the carrier gas flow rate and direct proportionality to the powder feeding rate. The projection of the laser spot on the tilted substrate changes from a circular shape to an elongated ellipse along the inclined direction, resulting in a decrease in laser energy density and a gradual dispersion of its distribution, with the symmetrical center shifting toward the upper edge of the inclined surface. The melt pool temperature at different tilt angles is monitored using an infrared thermal forming system, confirming the inverse proportionality between substrate thermal input and tilt angle and validating the numerical model of laser energy density.
- (2)
- The powder utilization rate decreases as the matrix inclination angle increases under all three scanning modes. The increase in angle results in a reduction in heat input to the matrix, making it more challenging to form a molten pool in the edge region. Additionally, the asymmetry of powder flow intensifies collisions and rebounds between the powder and matrix, further diminishing the powder utilization rate.
- (3)
- Laser-based cladding on non-horizontal surfaces results in an asymmetric melt pool, which becomes increasingly flattened with larger tilt angles, exhibiting a wider width on the downhill side and a narrower width on the uphill side of the cladding layer. With an increase in tilt angle, the melting width, the highest point of the cladding layer, and the deepest point of the melt pool show a decreasing trend, while the melting height, depth, and cross-sectional area exhibit an increasing trend.
- (4)
- The melt pool experiences asymmetry due to the influence of gravity, while the pressure of the shielding gas and internal viscous shear can to some extent inhibit the effect of gravity. Under larger tilt angles, gravity weakens the asymmetrical internal flow field of the melt pool, prolongs the solidification time, and promotes the grain growth.
- (5)
- Under the 40° scanning mode, the lower half of the asymmetric melt pool exhibits smaller temperature gradients, a greater amount of material participating in flow circulation, and denser and more chaotic velocity vectors. Therefore, the grain size in the lower half is larger and the growth direction is more random compared to the upper half.
Author Contributions
Conceptualization, H.W., X.Z., Y.W., J.Z., K.M., Y.C. and C.G.; Methodology, H.W., Y.W., J.Z. and C.G.; Software, H.W; Validation, H.W., Y.W., K.M., F.M. and C.G.; Investigation, H.W., Y.W., F.M., Y.C. and C.G.; Writing—Original Draft Preparation, H.W.; Writing—Review & Editing, X.Z., Y.W., K.M., F.M. and Y.C.; Visualization, X.Z. and J.Z.; Supervision, X.Z.; Funding Acquisition, X.Z. All authors have read and agreed to the published version of the manuscript.
Funding
This work was supported by the National Key R&D Program (2023YFE0201600), the Fundamental Research Funds for the Central Universities (2021ZDPY0223), and a Project Funded by the Priority Academic Program Development of Jiangsu Higher Education Institutions.
Data Availability Statement
The experimental datasets obtained from this research work and the analyzed results during the current study are available from the corresponding author on reasonable request.
Conflicts of Interest
Authors Hong Wang, Xiaofeng Zhang, and Fuwen Ma were employed by the company CCTEG Taiyuan Research Institute Co., Ltd. Author Kai Ma was employed by the company Shanxi Tiandi Coal Mining Machinery Co., Ltd. The remaining authors declare that the research was conducted in the absence of any commercial or financial relationships that could be construed as a potential conflict of interest.
References
- Nanamuthun, D.S. Cladding: America. U.S. Patent US3952180A, 20 April 1976. [Google Scholar]
- Schopphoven, T.; Gasser, A.; Backes, G. EHLA: Extreme High-speed Laser Material Deposition-economical and Effective Protection against Corrosion and Wear. Laser Technol. J. 2017, 14, 26–29. [Google Scholar] [CrossRef]
- Takemura, S.; Koike, R.; Kakinuma, Y.; Sato, Y.; Oda, Y. Design of powder nozzle for high resource efficiency in directed energy deposition based on computational fluid dynamics simulation. Int. J. Adv. Manuf. Technol. 2019, 105, 4107–4121. [Google Scholar] [CrossRef]
- Wang, H.Z.; Cheng, Y.H.; Song, W.; Yang, J.Y.; Liang, X.B. Research on the influence of laser scanning speed on Fe-based amorphous coating organization and performance. Intermetallics 2021, 136, 107266. [Google Scholar] [CrossRef]
- Zhou, J.L.; Cheng, Y.H.; Yang, J.Y.; Wang, Q.Q.; Liang, X.B. Effects of WS2 and Ti3AlC2 additions on the high temperature wear properties of laser cladding YW1/NiCoCrAlY tool coating. Ceram. Int. 2021, 47, 35124–35133. [Google Scholar] [CrossRef]
- Lee, Y.S.; Farson, D.F. Surface tension-powered build dimension control in laser additive manufacturing process. Int. J. Adv. Manuf. Technol. 2016, 85, 1035–1044. [Google Scholar] [CrossRef]
- Bruna-Rosso, C.; Demir, A.G.; Previtali, B. Selective laser melting finite element modeling: Validation with high-speed imaging and lack of fusion defects prediction. Mater. Des. 2018, 156, 143–153. [Google Scholar] [CrossRef]
- Li, Z.; Yu, G.; He, X.; Li, S.; Tian, C.; Dong, B. Analysis of surface tension driven flow and solidification behavior in laser linear welding of stainless steel. Opt. Laser Technol. 2020, 123, 105914. [Google Scholar] [CrossRef]
- Chai, Q.; Wang, Z.; Fang, C.; Xing, Y.; Qiu, X.; Zhou, Z. Numerical and experimental study on the profile of metal alloys formed on the inclined substrate by laser cladding. Surf. Coat. Technol. 2021, 422, 127494. [Google Scholar] [CrossRef]
- Lin, J.; Hwang, B.C. Coaxial laser cladding on an inclined substrate. Opt. Laser Technol. 1999, 31, 571–578. [Google Scholar] [CrossRef]
- Li, X.; Li, T.; Shi, B.; Wang, D.; Adnan, M.; Lu, H. The influence of substrate tilt angle on the morphology of laser cladding layer. Surf. Coat. Technol. 2020, 391, 125706. [Google Scholar] [CrossRef]
- Mohammadpour, M.; Yang, B.; Wang, H.P.; Forrest, J.; Poss, M.; Carlson, B.; Kovacevic, R. Influence of laser beam inclination angle on galvanized steel laser braze quality. Opt. Laser Technol. 2020, 129, 106303. [Google Scholar] [CrossRef]
- Huang, J.; Qi, L.; Luo, J.; Hou, X. Insights into the impact and solidification of metal droplets in ground-based investigation of droplet deposition 3D printing under microgravity. Appl. Therm. Eng. 2021, 183, 116176. [Google Scholar] [CrossRef]
- Xu, B.; Yuan, Z.; Wu, Y. Simulation analysis on surface morphology and hysteresis characteristics of molten Sn-3.0Ag-0.5Cu sitting on the inclined Ni substrate. Colloids Surf. A Physicochem. Eng. Asp. 2014, 441, 217–225. [Google Scholar] [CrossRef]
- Gu, H.; Li, L. Computational fluid dynamic simulation of gravity and pressure effects in laser metal deposition for potential additive manufacturing in space. Int. J. Heat Mass Transf. 2019, 140, 51–65. [Google Scholar] [CrossRef]
- Tan, H.; Fan, W.; Qian, Y.; Chen, Y.; Liu, S.; Lin, X. Influence of inclined substrate on process characteristics of directed energy deposition. Opt. Laser Technol. 2020, 129, 106288–106297. [Google Scholar] [CrossRef]
- Tan, H.; Shang, W.; Zhang, F.; Clare, A.T.; Lin, X.; Chen, J.; Huang, W. Process mechanisms based on powder flow spatial distribution in direct metal deposition. J. Mater. Process. Technol. 2018, 254, 361–372. [Google Scholar] [CrossRef]
- Yang, J.; Aiyiti, W.; Jiang, H.; Shan, J.; Zhang, Y. Evolution of molten pool morphology and prediction of inclined cladding layer morphology. Opt. Laser Technol. 2021, 142, 107164. [Google Scholar] [CrossRef]
- Cao, H.; Huang, R.; Yi, H.; Liu, M.; Jia, L. Asymmetric molten pool morphology in wire-arc directed energy deposition: Evolution mechanism and suppression strategy. Addit. Manuf. 2022, 59, 103113. [Google Scholar] [CrossRef]
- Khan, M.S.; Ali, S.; Westerbaan, D.; Duley, W.; Biro, E.; Zhou, Y.N. The effect of laser impingement angle on the optimization of melt pool geometry to improve process stability during high-speed laser welding of thin-gauge automotive steels. J. Manuf. Process. 2022, 78, 242–253. [Google Scholar] [CrossRef]
- Wang, D.; Li, T.; Shi, B.; Wang, H.; Xia, Z.; Cao, M.; Zhang, X. An analytical model of bead morphology on the inclined substrate in coaxial laser cladding. Surf. Coat. Technol. 2021, 410, 126944–126956. [Google Scholar] [CrossRef]
- Alya, S.; Vundru, C.; Ankamreddy, B.; Singh, R. Characterization and modeling of deposition geometry in directed energy deposition over inclined surfaces. Procedia Manuf. 2019, 34, 695–703. [Google Scholar] [CrossRef]
- Ghorbani, J.; Li, J.; Srivastava, A.K. Application of optimized laser surface re-melting process on selective laser melted 316L stainless steel inclined parts. J. Manuf. Process. 2020, 56, 726–734. [Google Scholar] [CrossRef]
- Le, K.Q.; Wong, C.H.; Chua, K.H.G.; Tang, C.; Du, H. Discontinuity of overhanging melt track in selective laser melting process. Int. J. Heat Mass Transf. 2020, 162, 120284. [Google Scholar] [CrossRef]
- He, Y.; Wei, J.; Liu, J.; Wang, X.; Wang, Y.; He, L. Experimental study on the fabrication profile and mechanical properties by substrate-inclined angle using laser melting deposition (LMD) integrating with the substrate of stainless steel. Opt. Laser Technol. 2020, 125, 106038–106044. [Google Scholar] [CrossRef]
- Hao, J.; Meng, Q.; Li, C.; Li, Z.; Wu, D. Effects of tilt angle between laser nozzle and substrate on bead morphology in multi-axis laser cladding. J. Manuf. Process. 2019, 43, 311–322. [Google Scholar] [CrossRef]
- Mahade, S.; Awe, S.A.; Björklund, S.; Lukáč, F.; Mušálek, R.; Joshi, S. Sliding wear behavior of a sustainable Fe-based coating and its damage mechanisms. Wear 2022, 500–501, 204375. [Google Scholar] [CrossRef]
- Olofsson, U.; Lyu, Y.; Åström, A.H.; Wahlström, J.; Dizdar, S.; Nogueira, A.P.G.; Gialanella, S. Laser Cladding Treatment for Refurbishing Disc Brake Rotors: Environmental and Tribological Analysis. Tribol. Lett. 2021, 69, 57. [Google Scholar] [CrossRef]
- Zhang, X.; Jiang, X.; Li, M.; Gong, P. Surface Morphology and Subsurface Microstructure Evolution When Form Grinding 20Cr2Ni4A Alloys. Materials 2023, 16, 425. [Google Scholar] [CrossRef]
- Li, L.; Shen, F.; Zhou, Y.; Tao, W. Comparative study of stainless steel AISI 431 coatings prepared by extreme-high-speed and conventional laser cladding. J. Laser Appl. 2019, 31, 042009. [Google Scholar] [CrossRef]
- Hoadley, A.; Rappaz, M. A thermal model of laser cladding by powder injection. Metall. Trans. B 1992, 23, 631–642. [Google Scholar] [CrossRef]
Figure 1.
Thermophysical properties of substrate and powder by the calculation of JMatPro: (a) latent heat; (b) density; (c) thermal conductivity; (d) specific heat.
Figure 1.
Thermophysical properties of substrate and powder by the calculation of JMatPro: (a) latent heat; (b) density; (c) thermal conductivity; (d) specific heat.
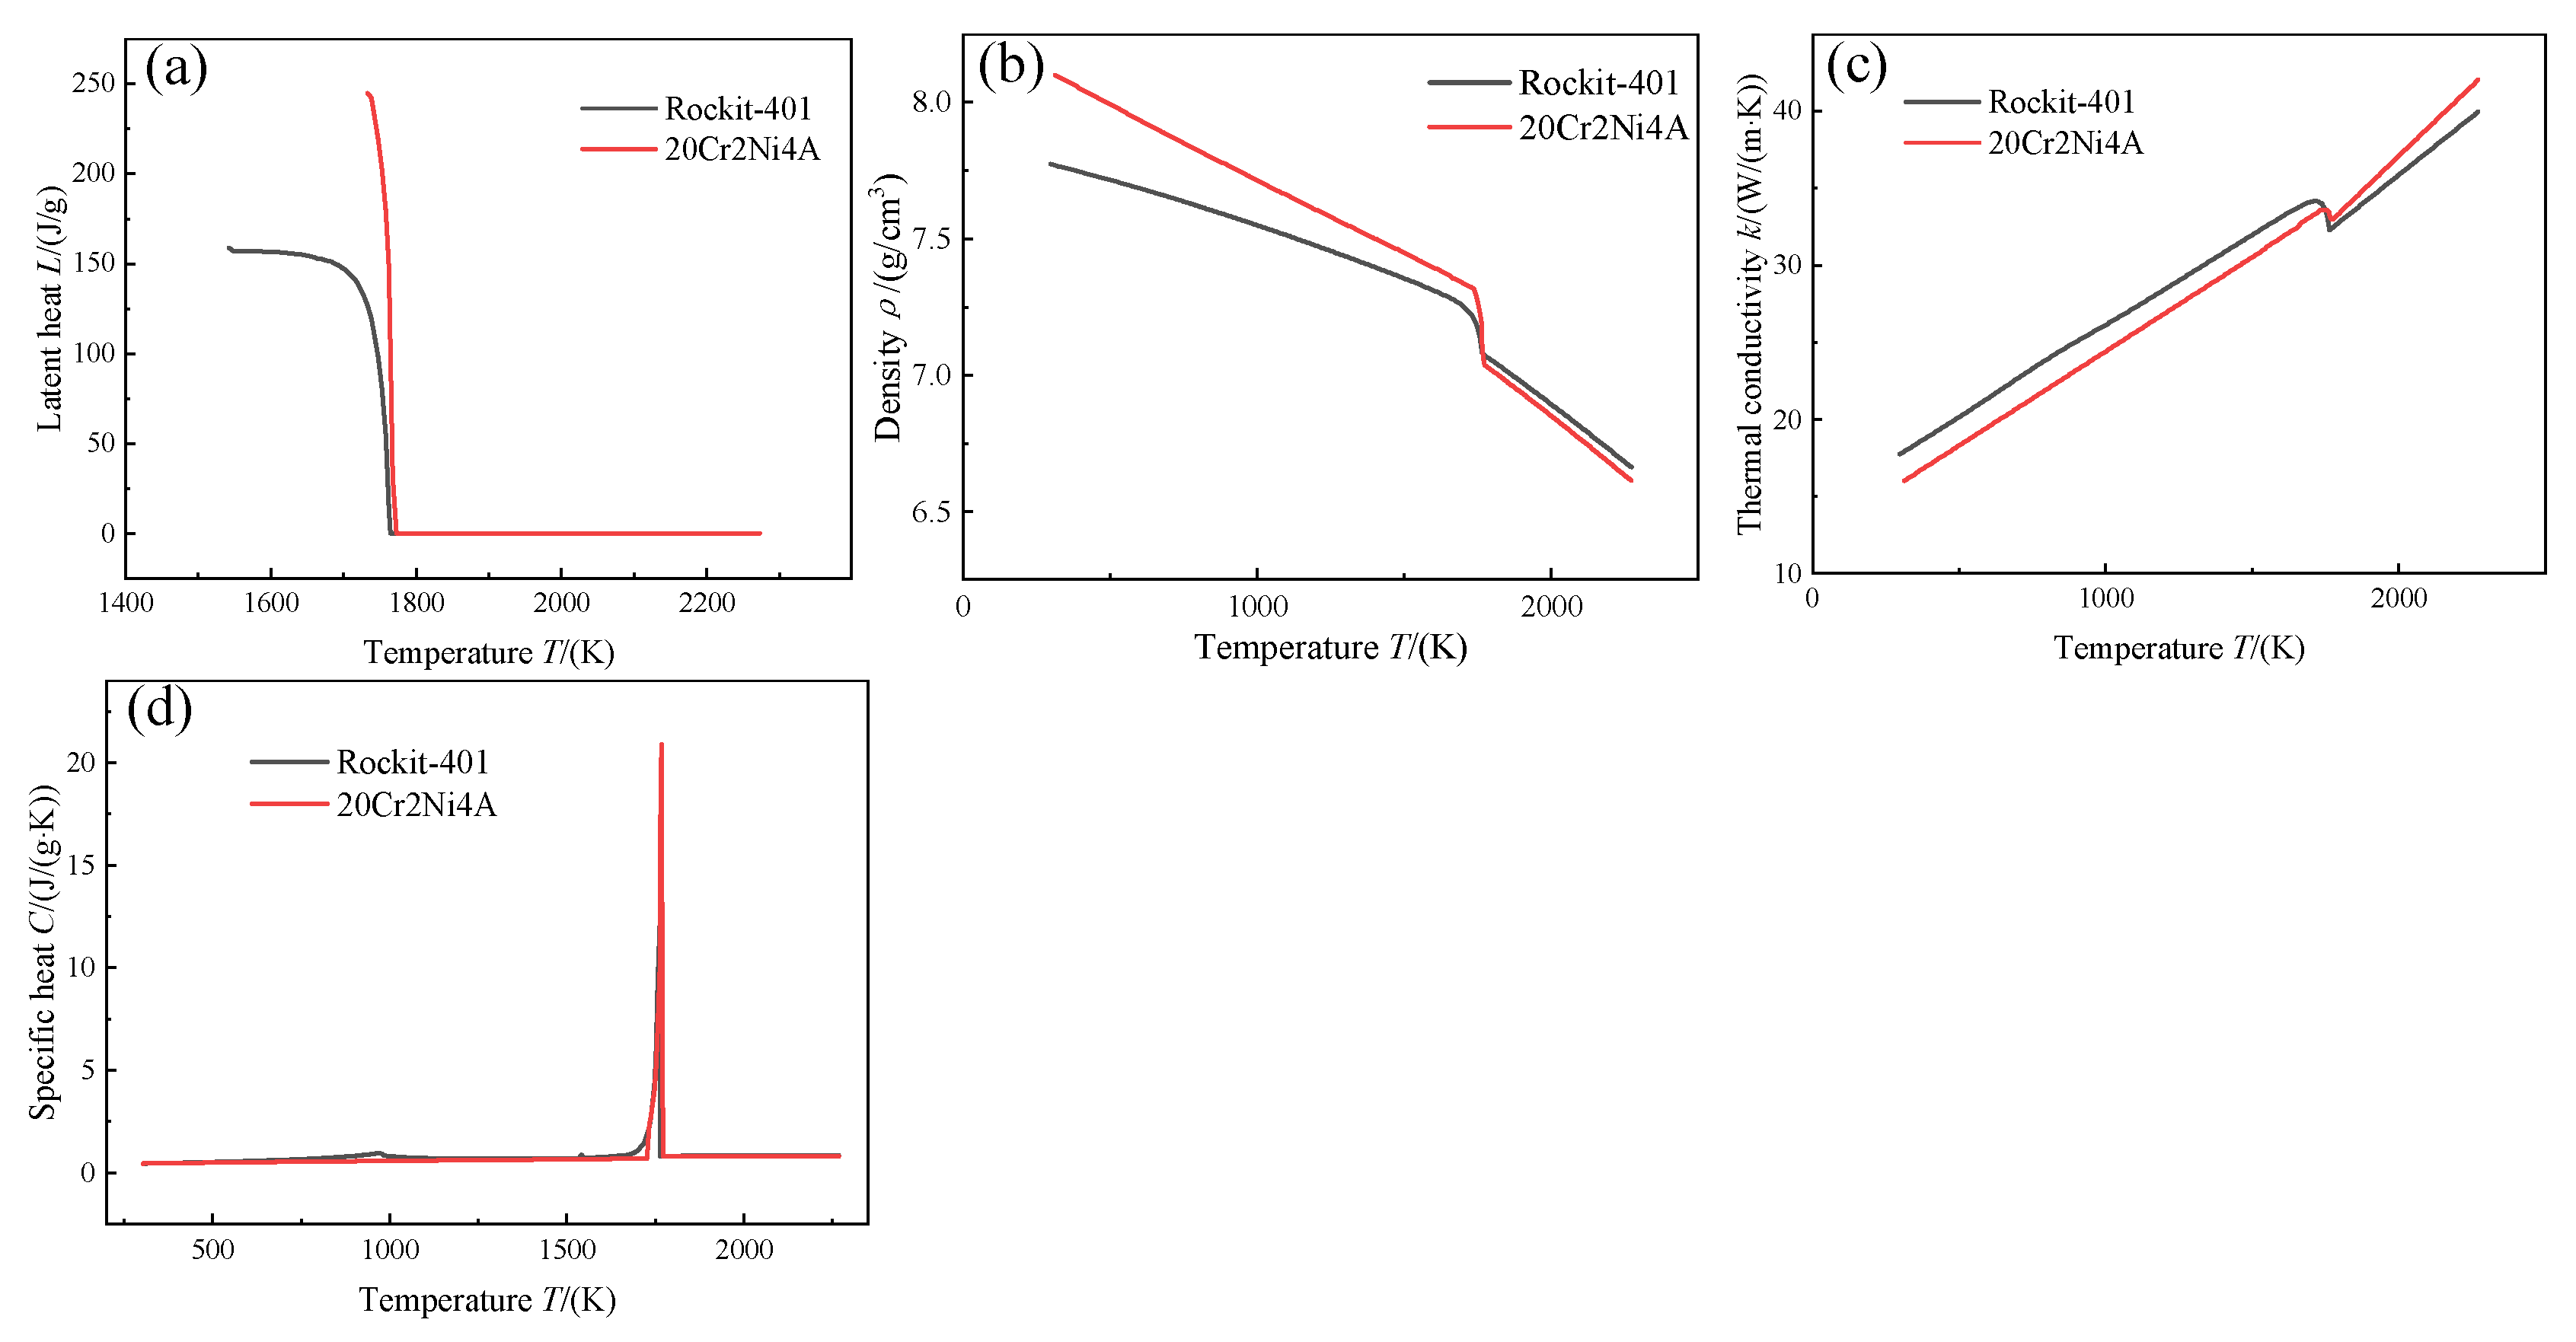
Figure 2.
Relationship between rotating speed of powder tray and powder feeding rate.
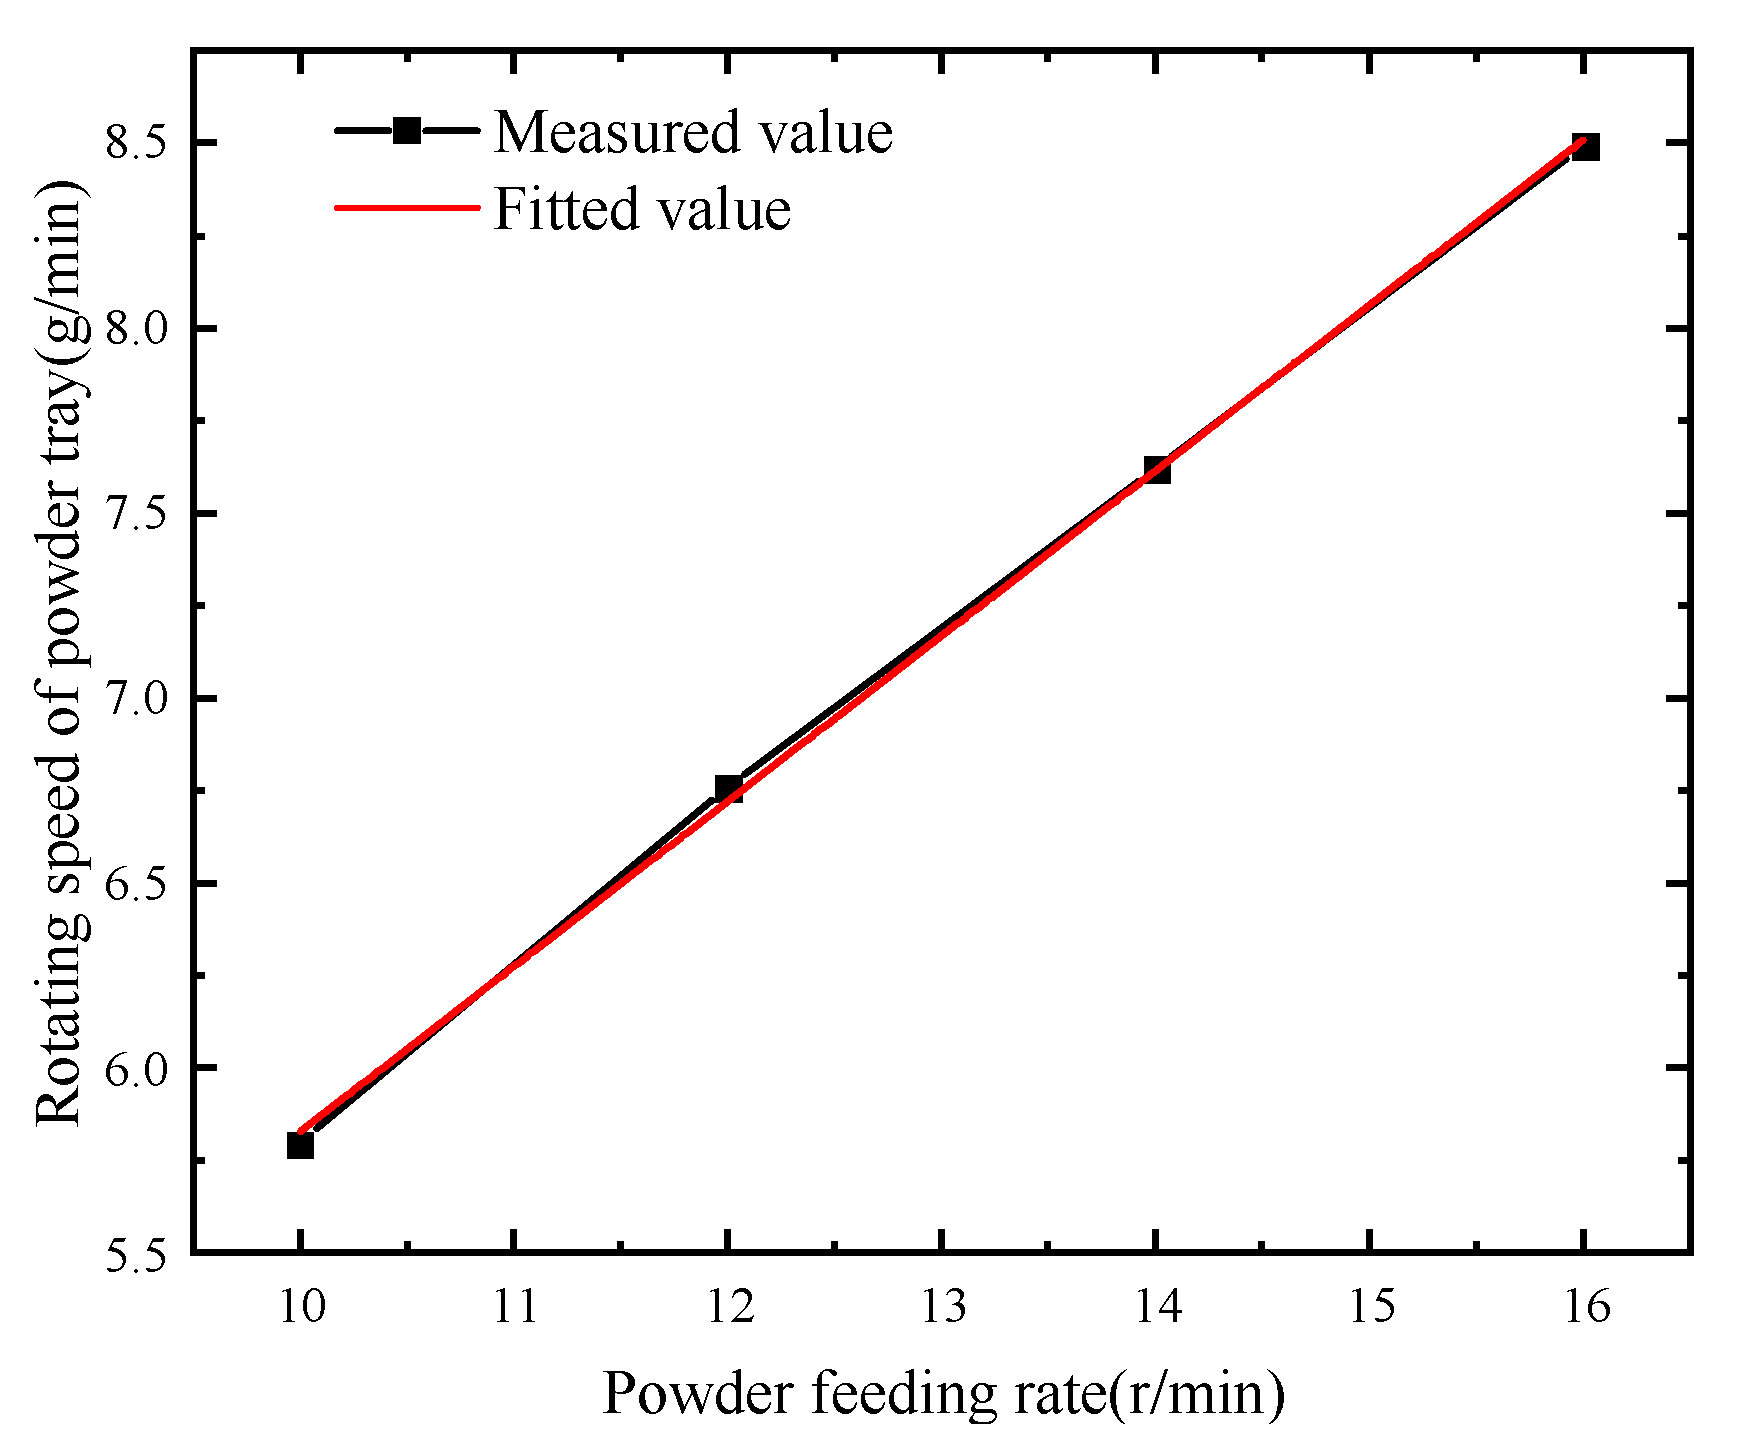
Figure 3.
Schematic diagram of interaction between powder flow and laser beam.

Figure 4.
Attenuation curve of process parameters on laser energy.

Figure 5.
Schematic diagram of laser cladding t on inclined substrate.

Figure 6.
Energy density distribution on substrate surface. (a) Laser energy density distribution. (b) Peak value and offset.
Figure 6.
Energy density distribution on substrate surface. (a) Laser energy density distribution. (b) Peak value and offset.

Figure 7.
Temperature field of molten pool at the scanning time of 1.5 s: (a) 0°; (b) 10°; (c) 20°; (d) 30°; and (e) 40°.
Figure 7.
Temperature field of molten pool at the scanning time of 1.5 s: (a) 0°; (b) 10°; (c) 20°; (d) 30°; and (e) 40°.
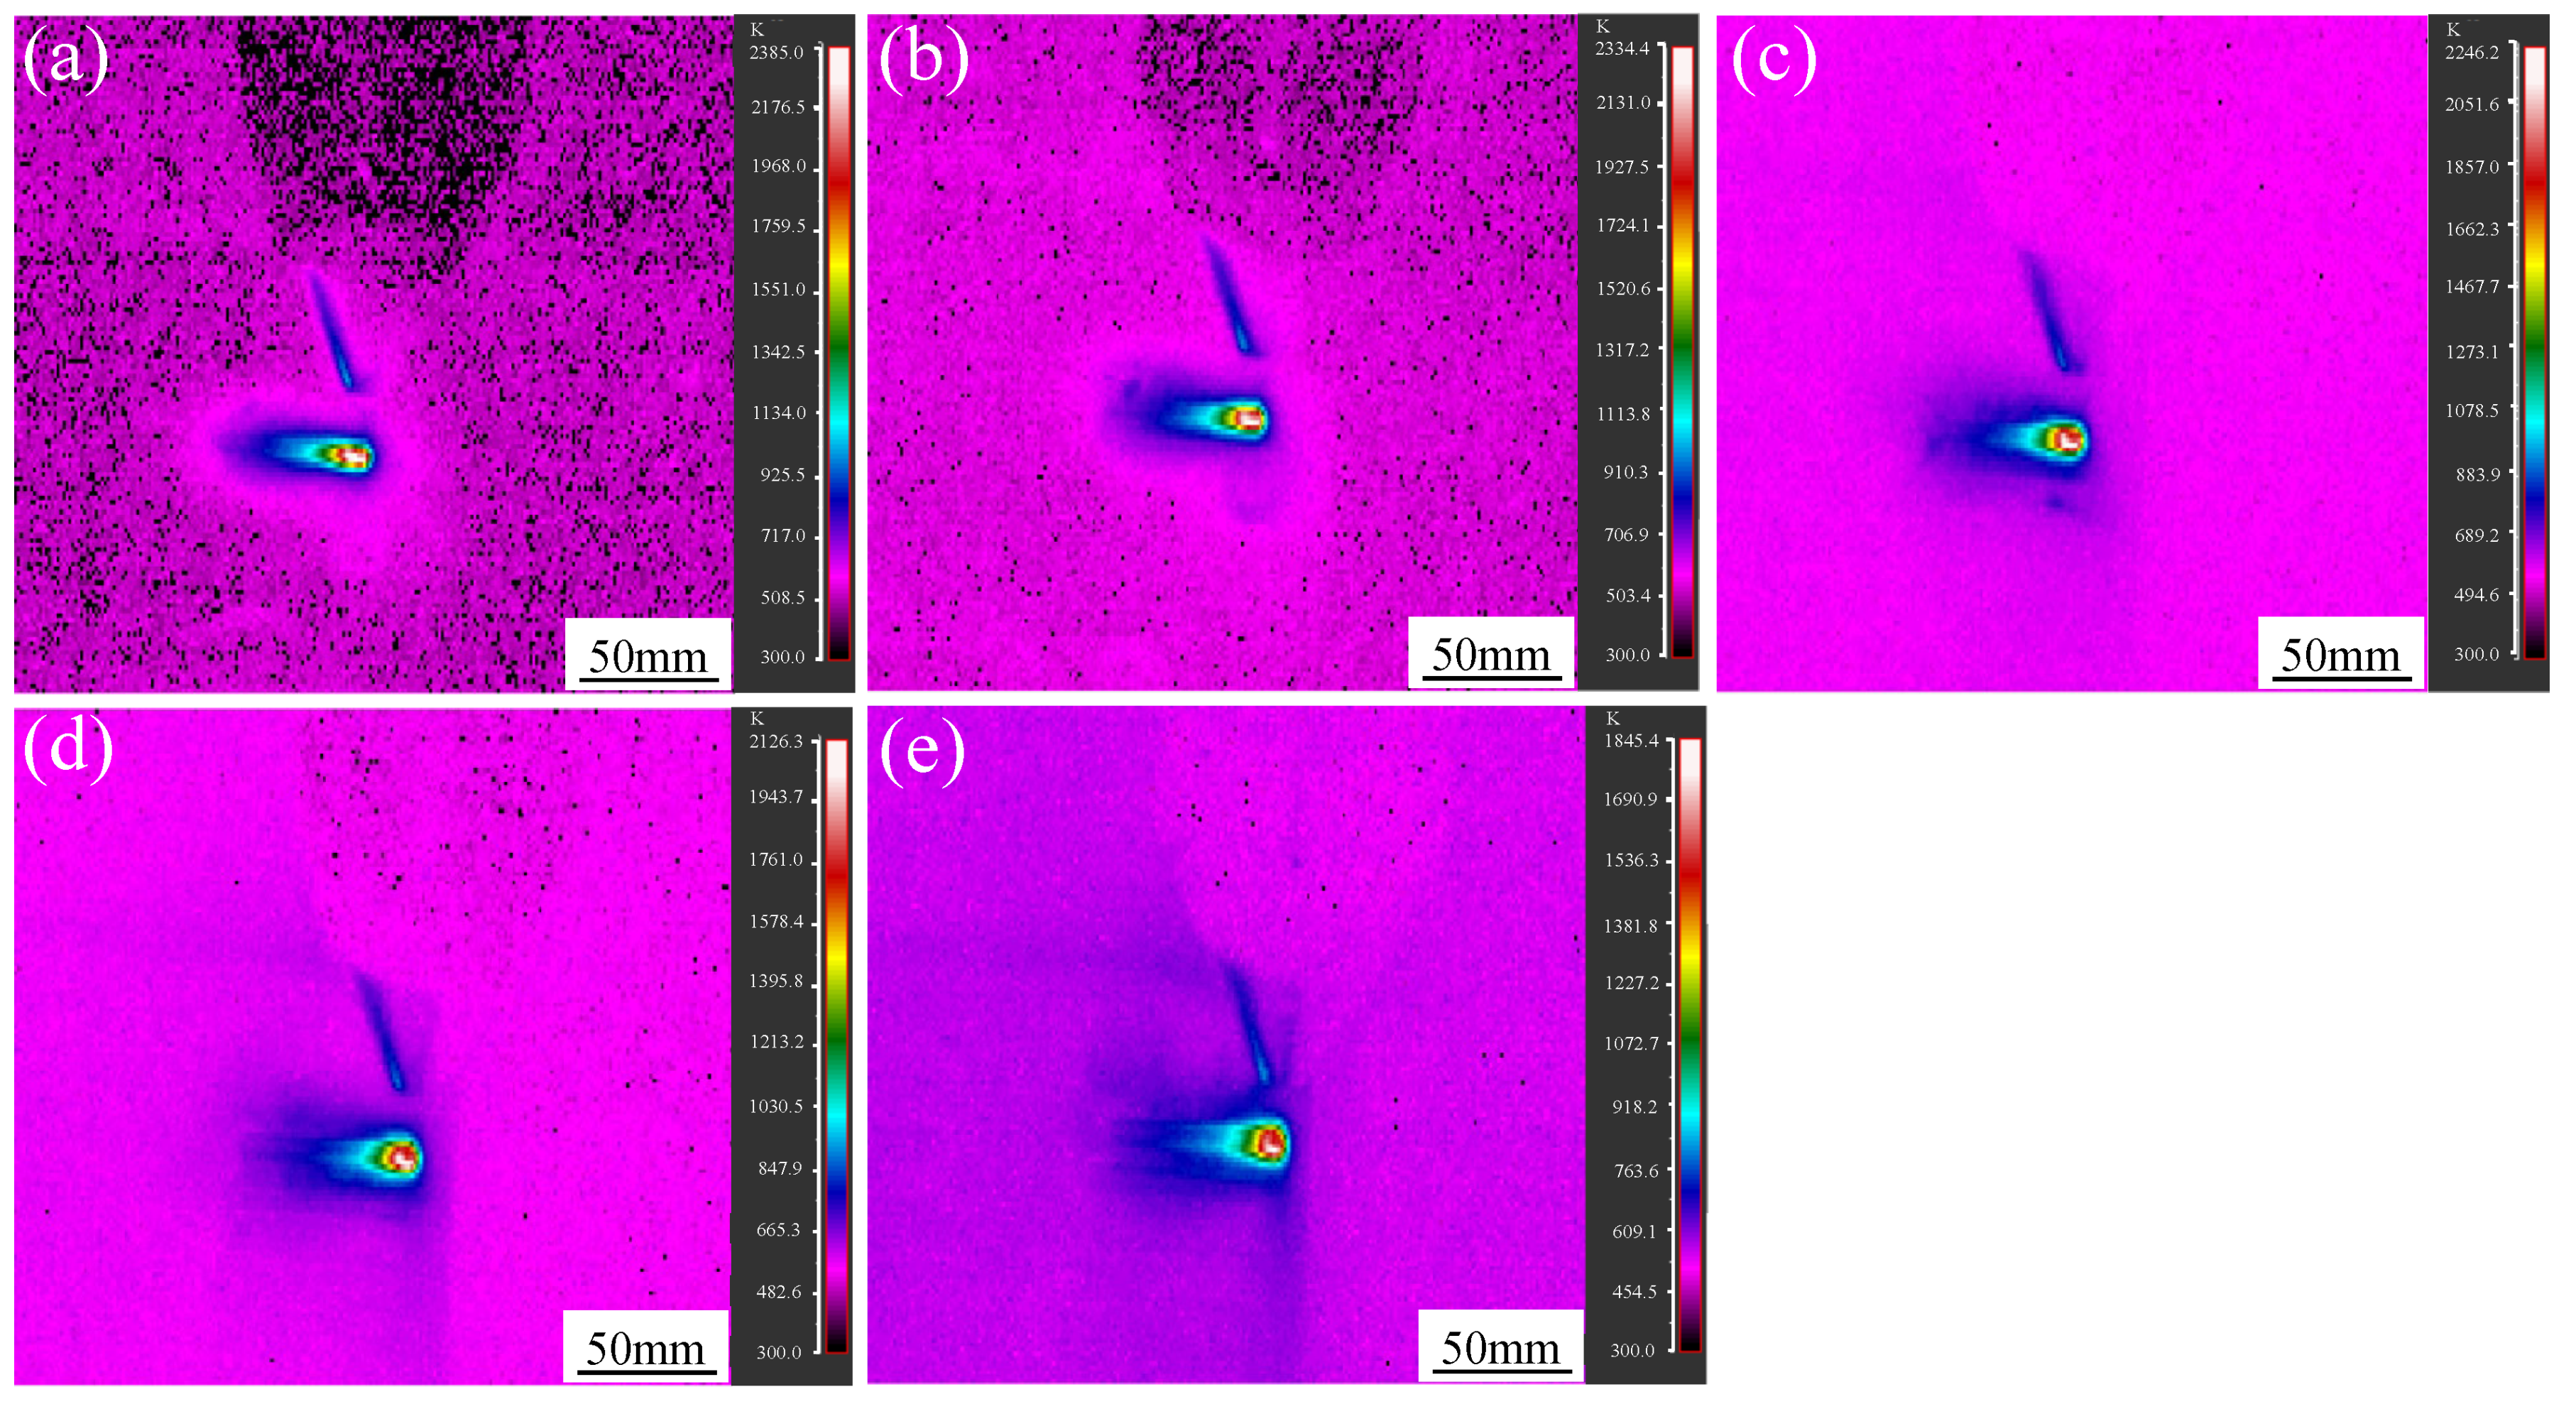
Figure 8.
Curves of maximum temperature of molten pool with time under different inclined angles.
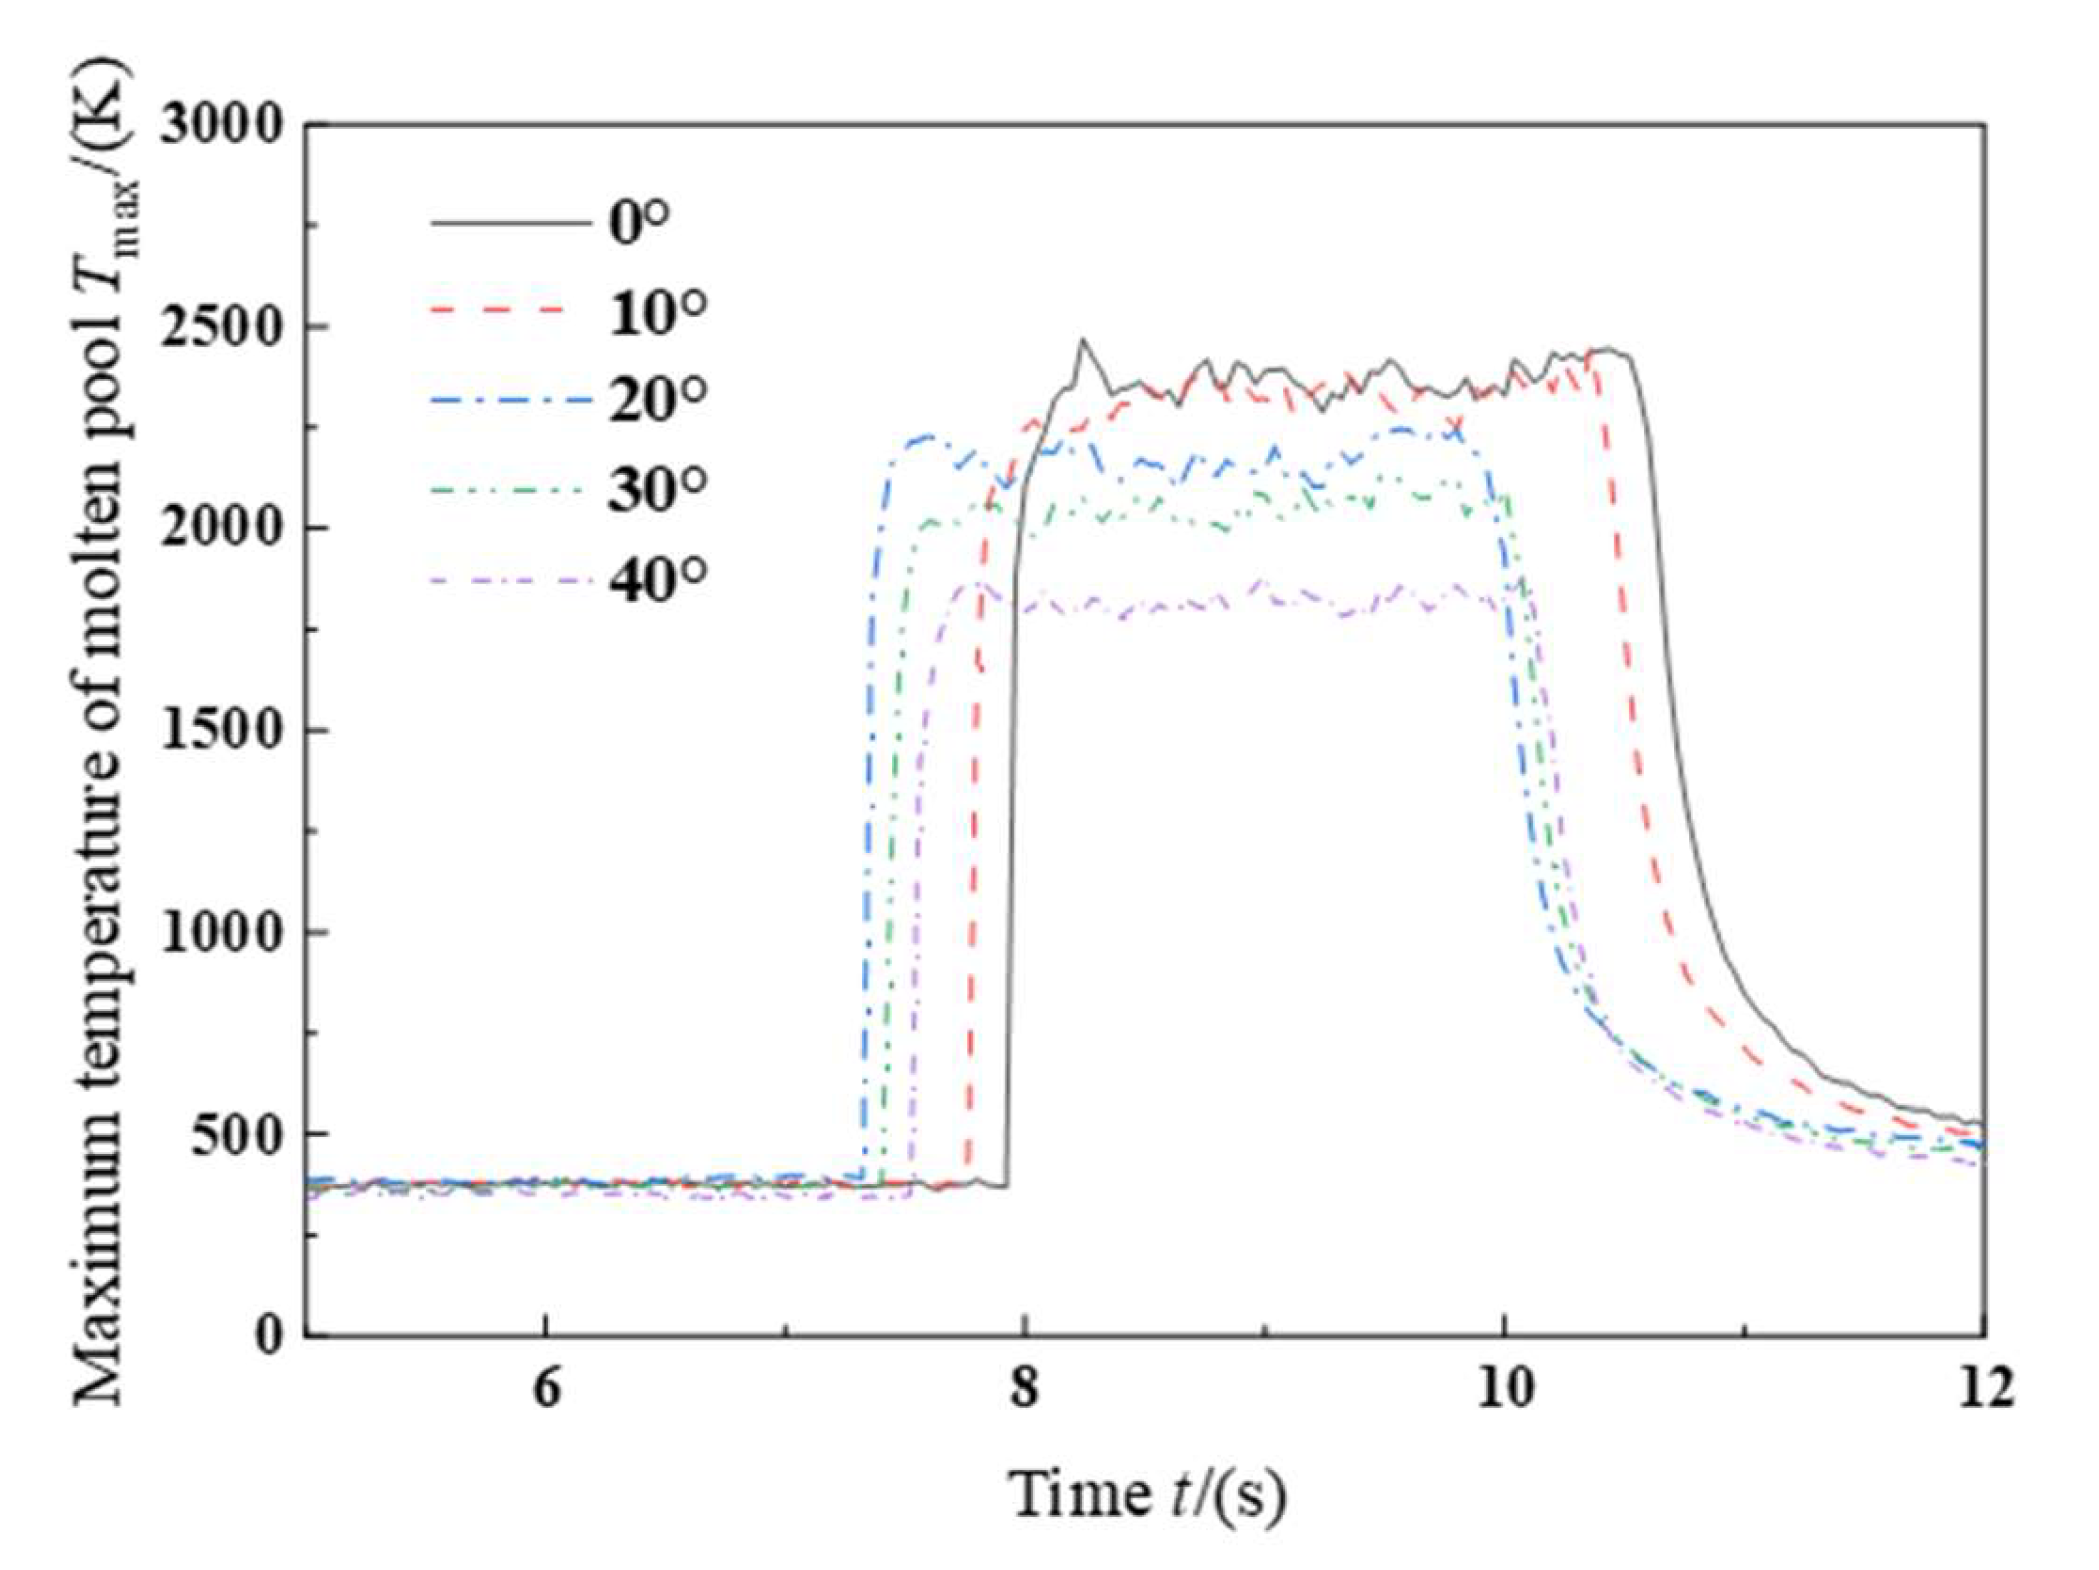
Figure 9.
Powder catchment efficiency at different scanning modes.

Figure 10.
Schematic diagram of the cladding process at longitudinal scanning modes.
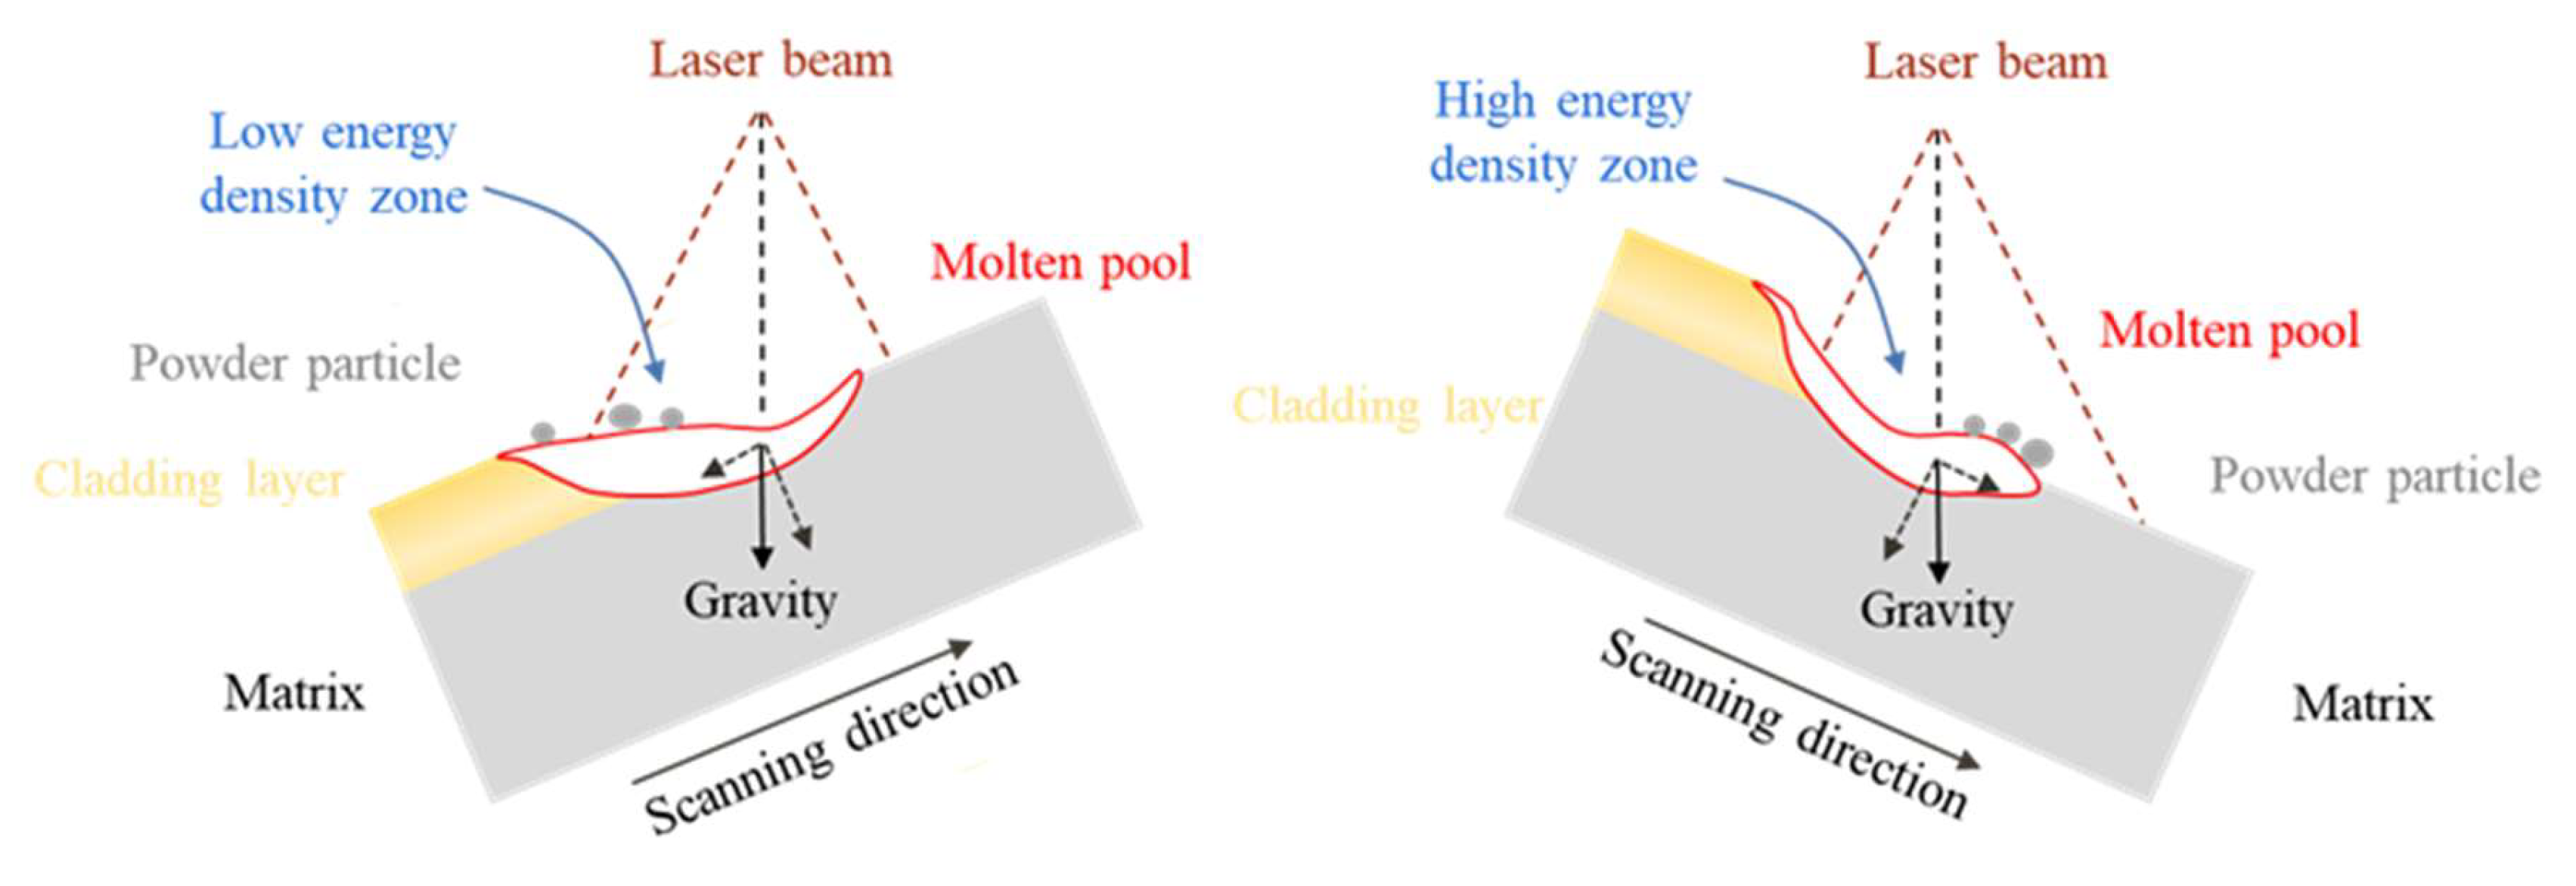
Figure 11.
The cross-sectional morphology of cladding layer at different inclined angles: (a) 0°; (b) 10°; (c) 20°; (d) 30°; and (e) 40°.
Figure 11.
The cross-sectional morphology of cladding layer at different inclined angles: (a) 0°; (b) 10°; (c) 20°; (d) 30°; and (e) 40°.

Figure 12.
Relation between cross-sectional morphology parameter and inclined angle: (a) Cladding width; (b) Cladding height and cladding depth; (c) Cladding section areas; (d) Peak shift.
Figure 12.
Relation between cross-sectional morphology parameter and inclined angle: (a) Cladding width; (b) Cladding height and cladding depth; (c) Cladding section areas; (d) Peak shift.
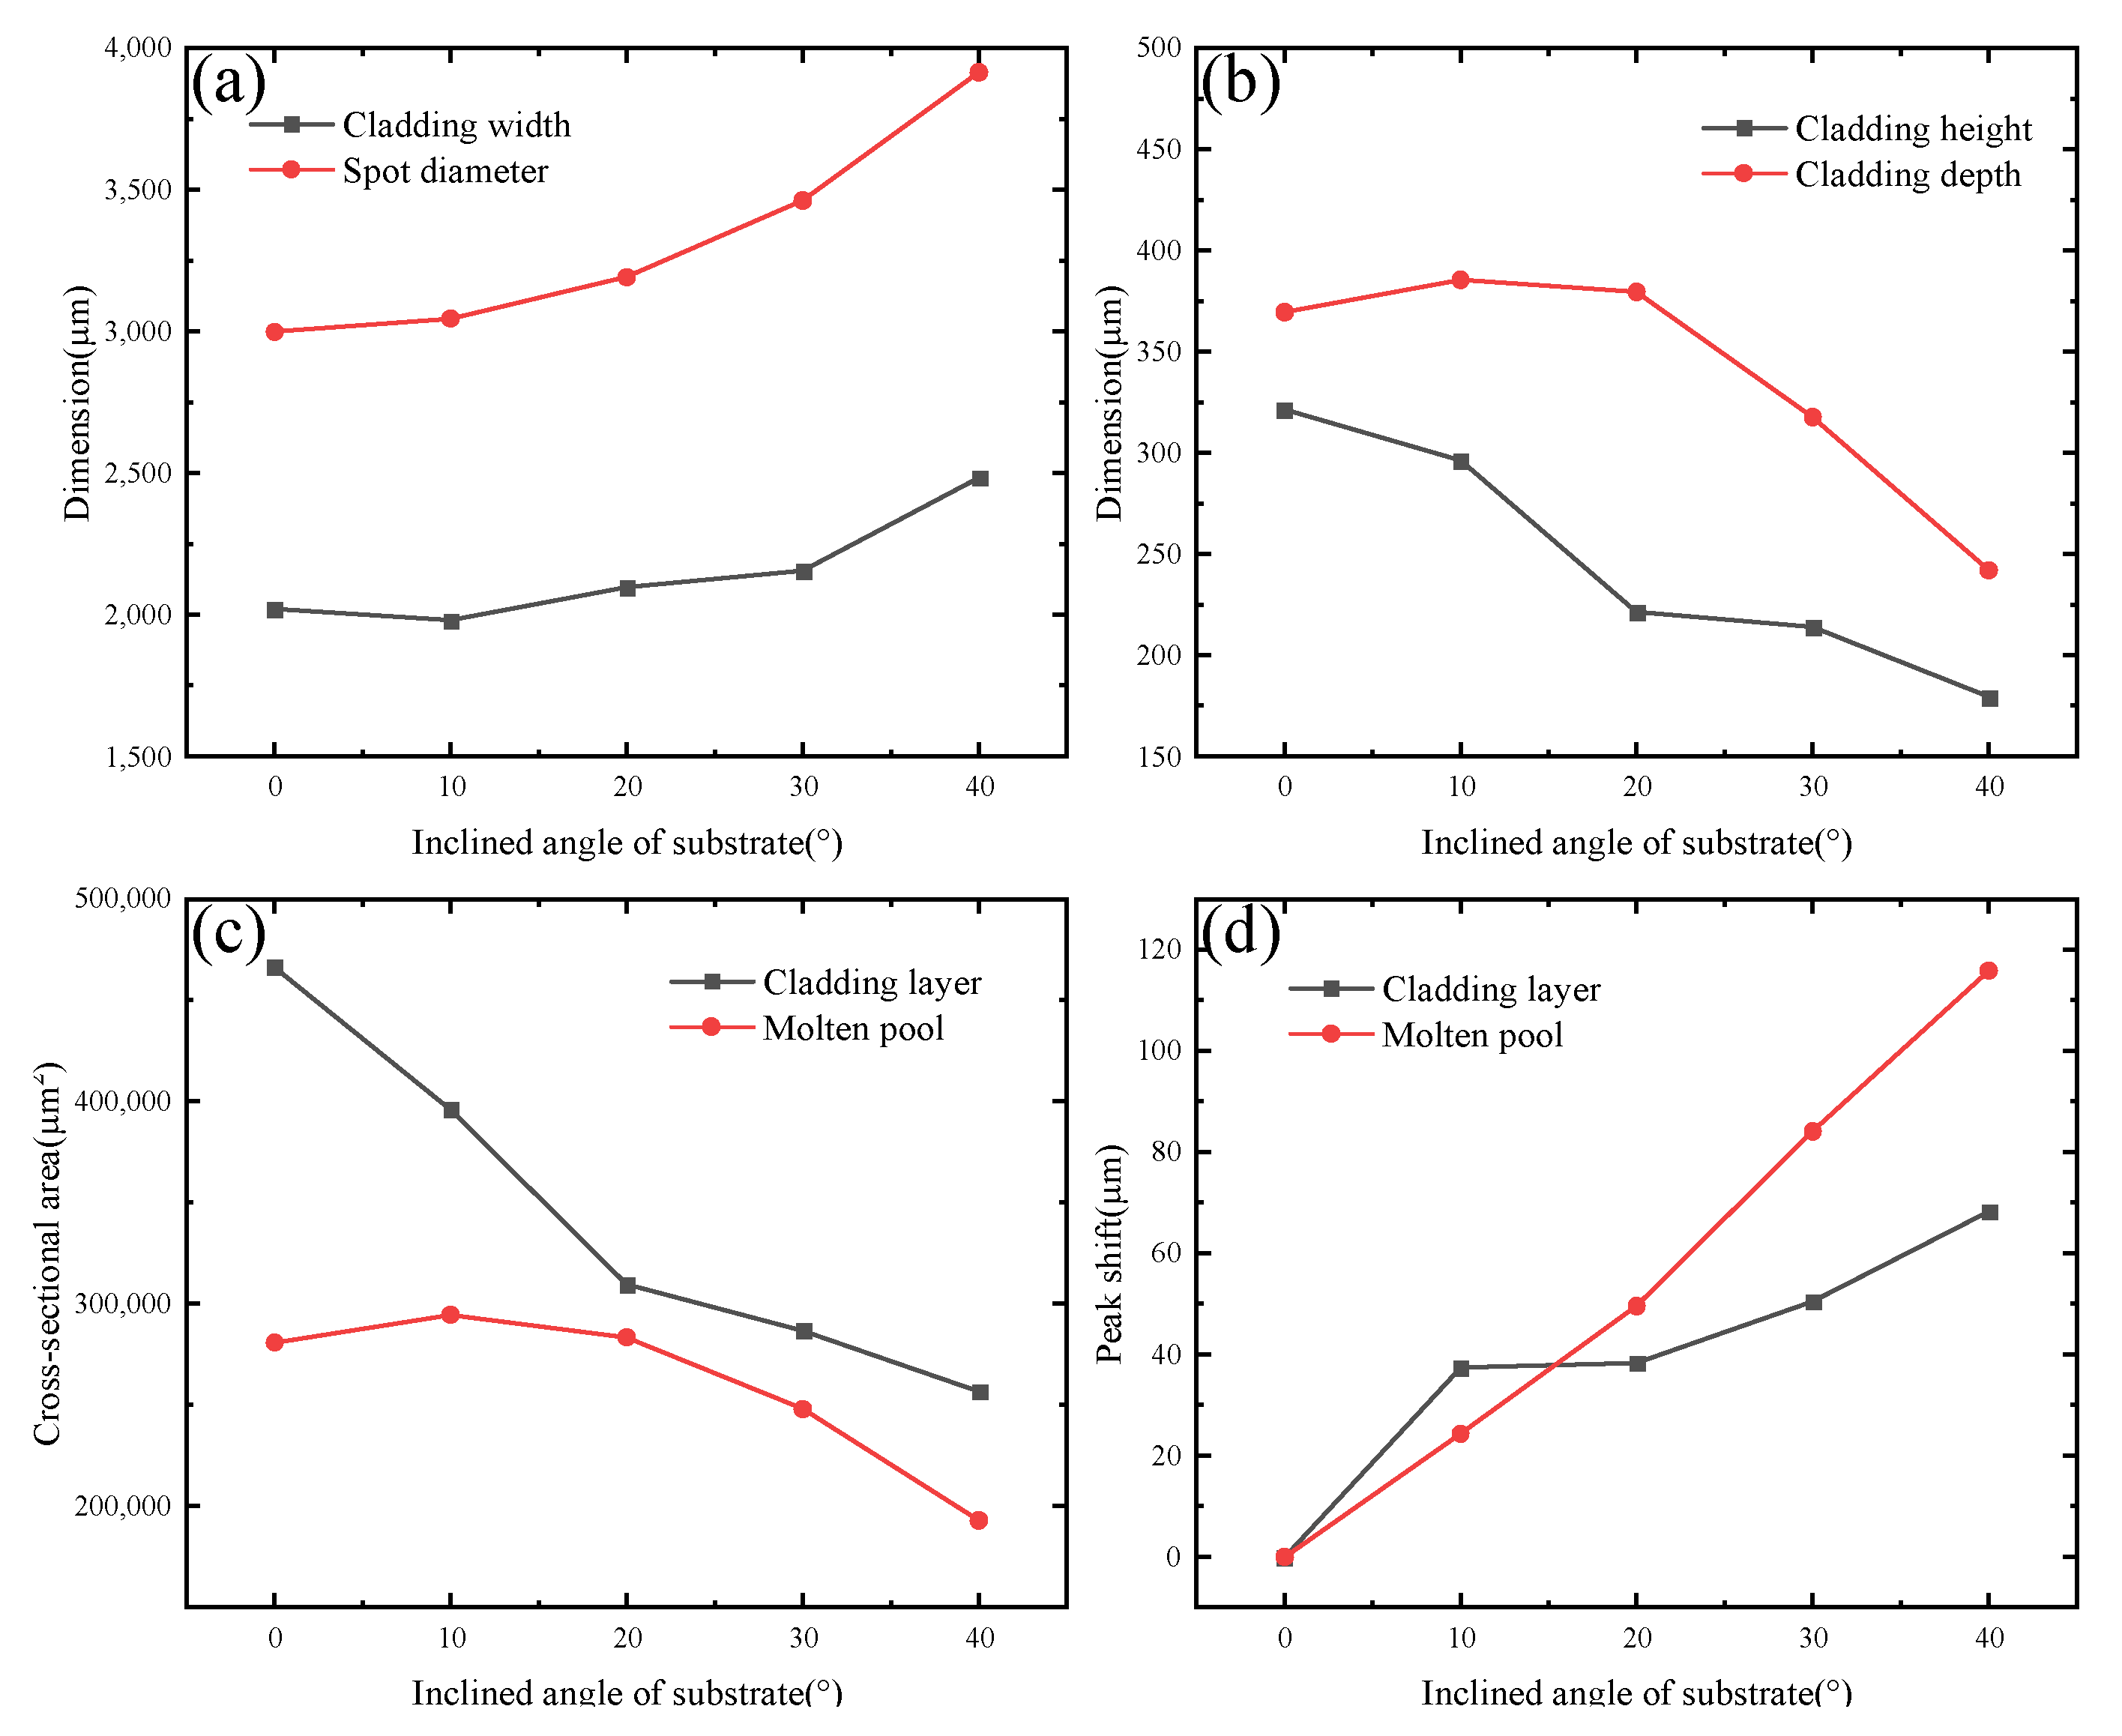
Figure 13.
Microstructure of the middle of the cladding layer with different angles: (a) 0°; (b) 10°; (c) 20°; (d) 30°; and (e) 40°.
Figure 13.
Microstructure of the middle of the cladding layer with different angles: (a) 0°; (b) 10°; (c) 20°; (d) 30°; and (e) 40°.
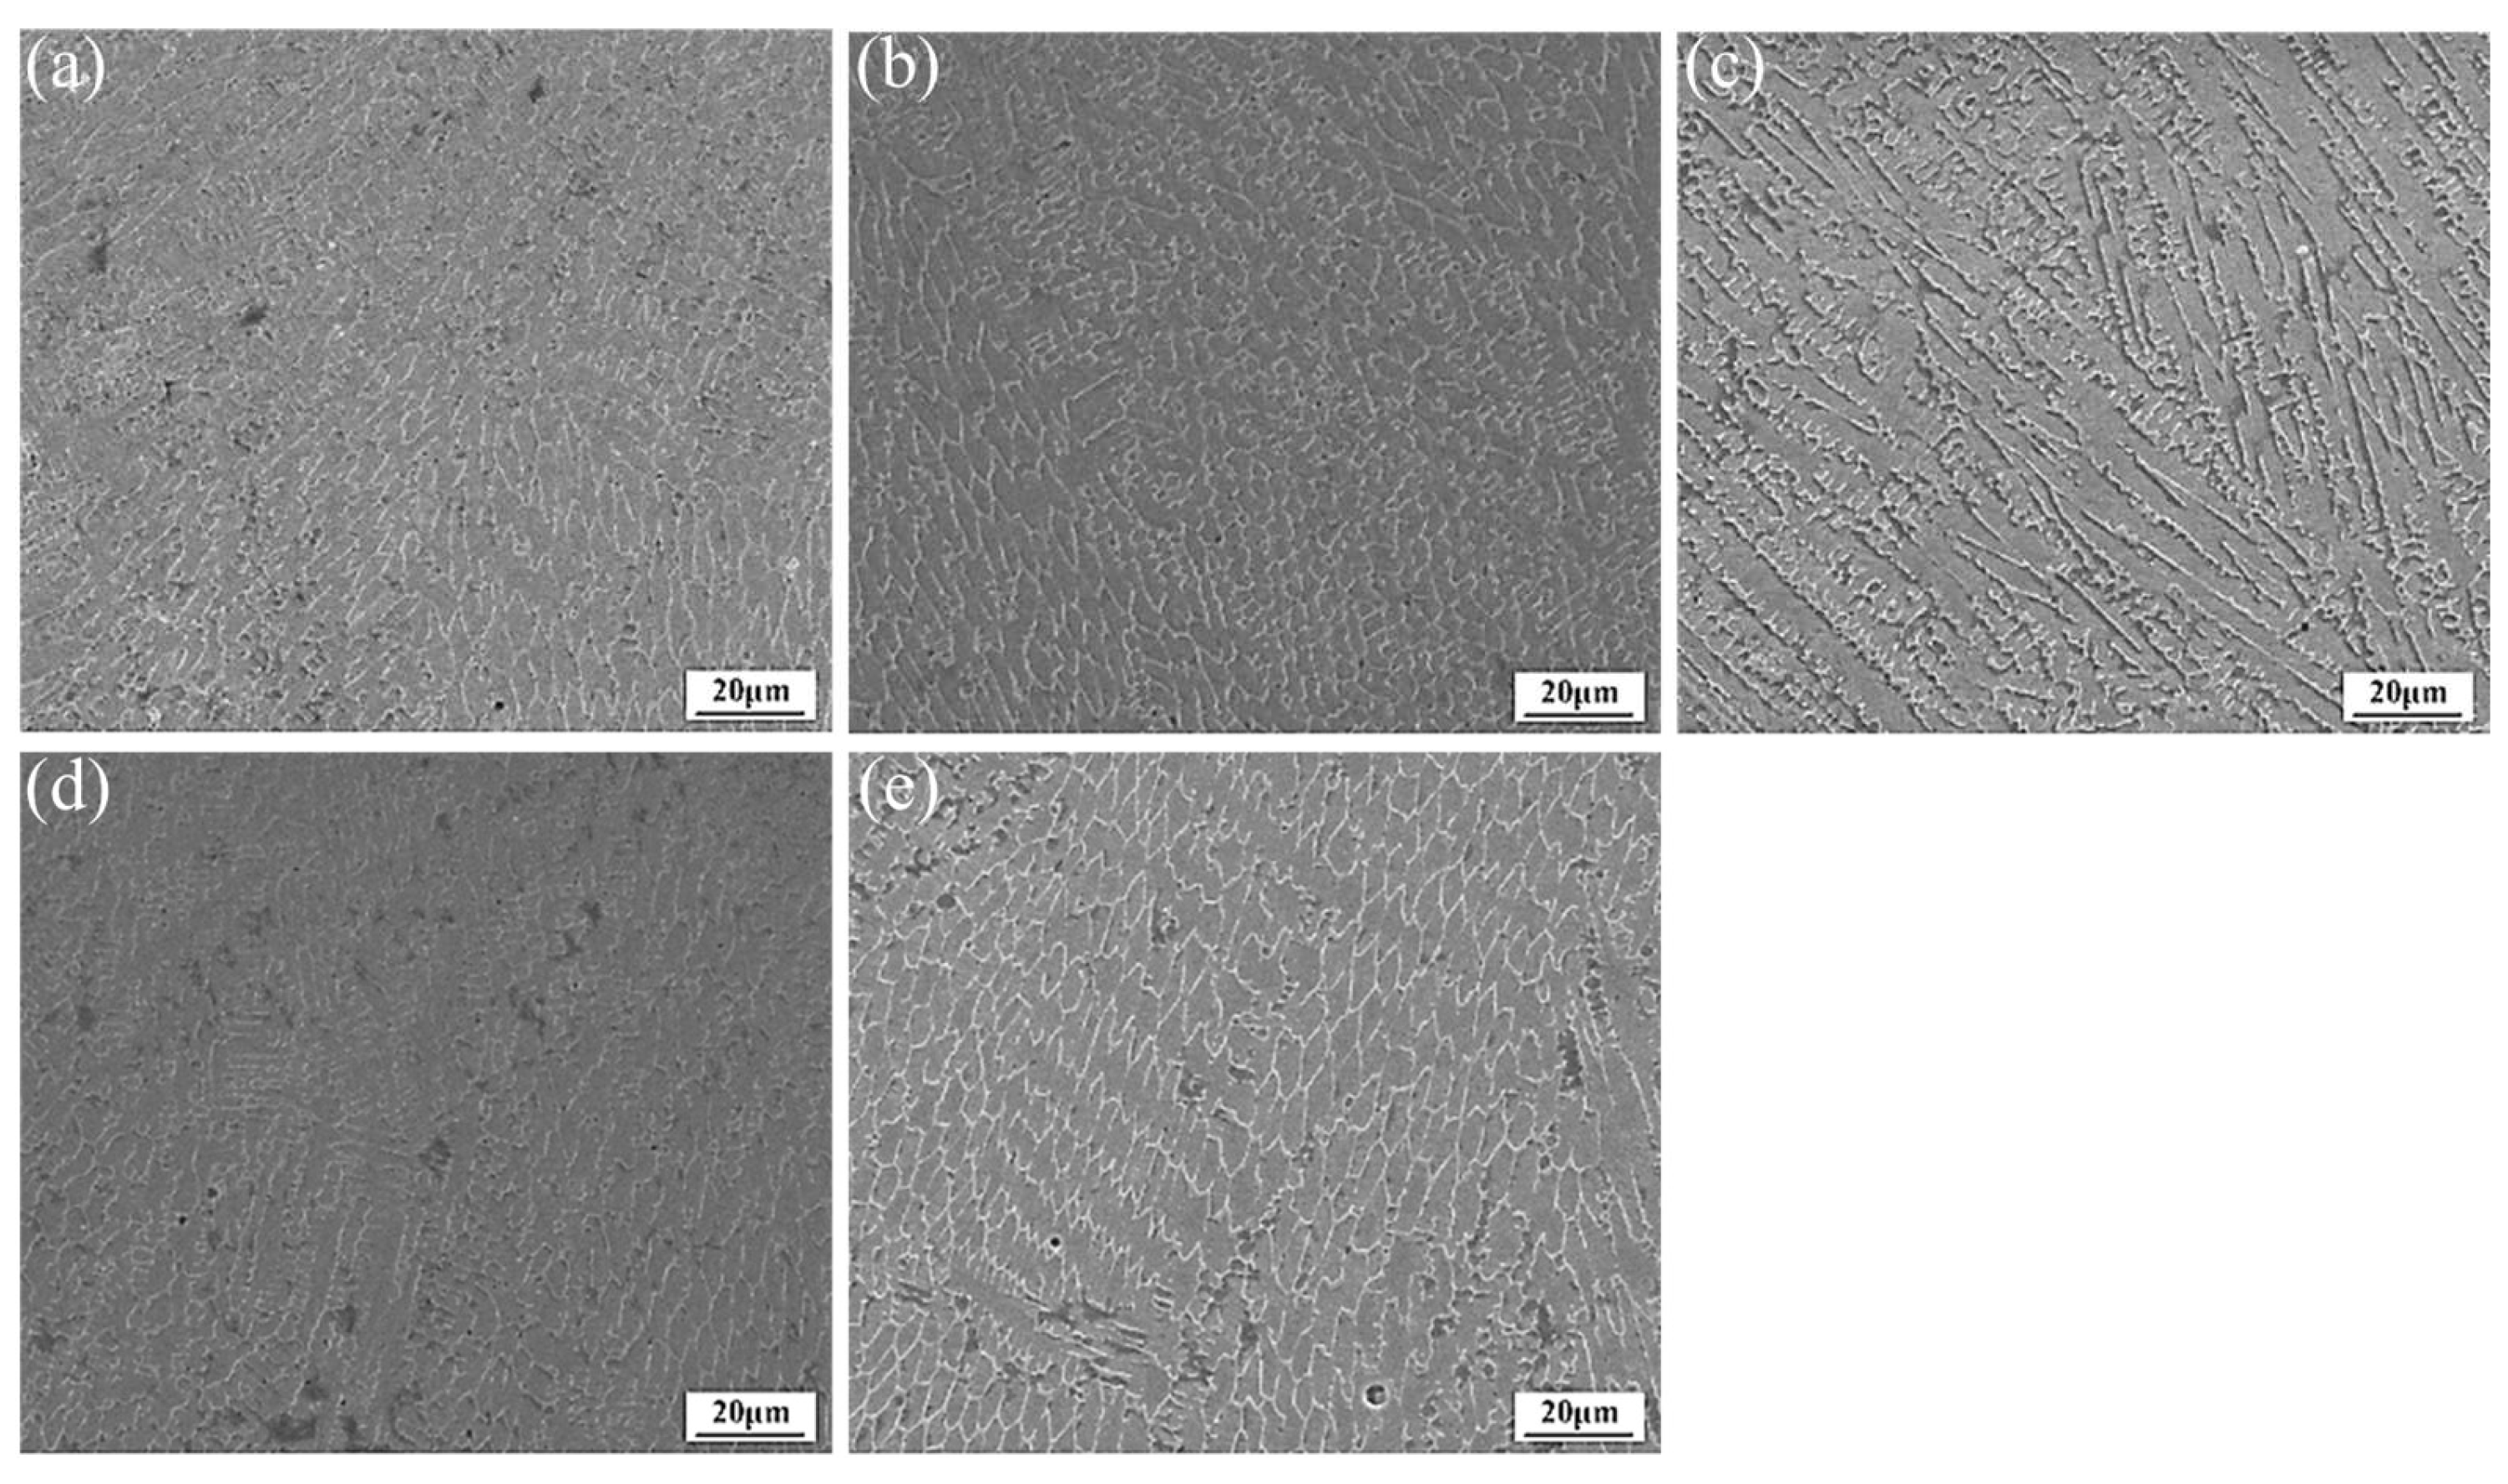
Figure 14.
Microstructure of molten pool at different positions when inclined angle is 40°. (a) Top of the lower half zone. (b) Bottom of the lower half zone. (c) Middle of the lower half zone. (d) Top of the upper half zone. (e) Bottom of the upper half zone. (f) Middle of the upper half zone.
Figure 14.
Microstructure of molten pool at different positions when inclined angle is 40°. (a) Top of the lower half zone. (b) Bottom of the lower half zone. (c) Middle of the lower half zone. (d) Top of the upper half zone. (e) Bottom of the upper half zone. (f) Middle of the upper half zone.


| Material | C | Si | Cr | Ni | Mo | Mn | Fe |
|---|---|---|---|---|---|---|---|
| Powder | 0.13 | - | 18 | 2.5 | 0.5 | - | Bal. |
| Substrate | 0.21 | 0.25 | 1.45 | 3.55 | - | 0.48 | Bal. |
Table 2.
Cladding process parameters.
| Parameter | Power P/(kW) | Scanning Velocity v/(mm/s) | Powder Feeding Rate Qp(g/min) | Inclined Angle θ/(°) |
|---|---|---|---|---|
| Value | 1.4 | 25 | 12.4 | 0, 10, 20, 30, 40 |
Disclaimer/Publisher’s Note: The statements, opinions and data contained in all publications are solely those of the individual author(s) and contributor(s) and not of MDPI and/or the editor(s). MDPI and/or the editor(s) disclaim responsibility for any injury to people or property resulting from any ideas, methods, instructions or products referred to in the content. |
© 2023 by the authors. Licensee MDPI, Basel, Switzerland. This article is an open access article distributed under the terms and conditions of the Creative Commons Attribution (CC BY) license (https://creativecommons.org/licenses/by/4.0/).
Share and Cite
MDPI and ACS Style
Wang, H.; Zhang, X.; Wang, Y.; Zhou, J.; Ma, K.; Ma, F.; Cheng, Y.; Gao, C. Forming and Microstructure Evolution Mechanism of Asymmetric Molten Pool in Laser Cladding. Metals 2023, 13, 1970. https://doi.org/10.3390/met13121970
AMA Style
Wang H, Zhang X, Wang Y, Zhou J, Ma K, Ma F, Cheng Y, Gao C. Forming and Microstructure Evolution Mechanism of Asymmetric Molten Pool in Laser Cladding. Metals. 2023; 13(12):1970. https://doi.org/10.3390/met13121970
Chicago/Turabian StyleWang, Hong, Xiaofeng Zhang, Yunfei Wang, Jiali Zhou, Kai Ma, Fuwen Ma, Yanhai Cheng, and Chuwei Gao. 2023. "Forming and Microstructure Evolution Mechanism of Asymmetric Molten Pool in Laser Cladding" Metals 13, no. 12: 1970. https://doi.org/10.3390/met13121970
Note that from the first issue of 2016, this journal uses article numbers instead of page numbers. See further details here.