Article

Effects of Quenching Temperature on the Microstructure and Mechanical Properties of a Strip-Cast Medium-Mn Steel Processed by Quenching and Partitioning

1
State Key Laboratory of Vanadium and Titanium Resources Comprehensive Utilization, Panzhihua 617000, China
2
The State Key Laboratory of Rolling and Automation, Northeastern University, Shenyang 110819, China
*
Author to whom correspondence should be addressed.
Metals 2023, 13(10), 1772; https://doi.org/10.3390/met13101772
Submission received: 21 September 2023 / Revised: 14 October 2023 / Accepted: 17 October 2023 / Published: 19 October 2023

Abstract

:
Twin-roll strip casting (TRSC), which is a low-energy and short process to produce strip steel, is a potential approach to produce advanced high-strength steels. Herein, a medium-Mn steel containing 4 wt% Mn was processed using a novel route involving TRSC, hot rolling and quenching and partitioning (QP) to explore the possibility of medium-Mn steel produced by TRSC plus QP process. The effects of quenching temperature on the microstructure and mechanical properties were studied. It was found that primary martensite and retained austenite (RA) were obtained at the quenching temperature of 140–180 °C, while primary martensite, RA and secondary martensite were obtained when the quenching temperature was 220–300 °C. With an increase in quenching temperature from 140 to 260 and to 300 °C, the RA fraction first increased from 15.4% to 31.8% and then decreased to 16.6%. The sample at a quenching temperature of 220 °C yielded mechanical properties with a yield strength of 992 MPa, tensile strength of 1159 MPa and total elongation of 20.4%. The superior mechanical properties were achieved by an optimum combination of high RA fraction (26.5%), appropriate mechanical stability of RA and a small number of the islands of secondary martensite and RA. Hence, the present study provides a viable processing route for medium-Mn steel.

1. Introduction

Weight reduction and improved crashworthiness properties are urgent demands in the modern automotive industry [1]. The application of advanced high-strength steels (AHSSs) to automobiles is one of the most effective ways to reduce weight and improve passenger safety [2,3]. In recent years, medium-Mn steels (4–12 wt% Mn) have received significant attention as typical third-generation AHSSs because of their excellent combination of strength and ductility. A high volume fraction (~20–60%) of retained austenite (RA) can be obtained in medium-Mn steels, leading to a superior PSE (product of tensile strength (TS) and total elongation (TE)) of ~20–60 GPa% through transformation-induced plasticity (TRIP) effect (or TRIP effect + twinning induced plasticity effect) [4,5,6,7,8]. Therefore, medium-Mn steels are potential materials for the manufacture of structural parts (A/B/C pillars, front bumpers, etc.) on automobile bodies. However, medium-Mn steel has not been widely used in the automobile industry because its alloy and manufacturing costs are still high. The essential problem is that the Mn content in medium-Mn steels is high in comparison with the hot-stamped steels, QP steels, TRIP steels, etc. It is necessary to develop a low-cost process to produce medium-Mn steel.
It is well known that intercritical annealing (IA) is generally adopted as the main heat treatment to obtain an ultrafine-grained structure in medium-Mn steels [6,7,8]. The effects of IA conditions, such as IA temperature [9,10], IA time [11,12], heating rate [13,14] and cooling rate [15], on the microstructure and mechanical properties of medium-Mn steels have been widely studied. Besides the IA process, the QP process has also been attempted as an important processing route for medium-Mn steels. Seo et al. applied the QP process to a cold-rolled Fe–0.21C–4.0Mn–1.6Si–1.0Cr (wt%) medium-Mn steel [16]. It was found that RA with a volume fraction of 33% was achieved at optimal quenching temperature and a PSE of ~24.5 GPa% with a high TS was obtained [16]. Zhao et al. explored the effect of austenitizing temperature on the mechanical properties of a cold-rolled Fe–0.28C–4.08Mn–1.42Si (wt%) medium-Mn steel [17]. The small size of prior austenite under the low austenitizing temperature resulted in a large volume fraction of RA and uniform microstructure [17]. De Moor et al. explored a cold-rolled Fe–0.3C–5Mn–1.6Si (wt%) medium-Mn steel processed by QP process following IA, which exhibited TS of 1110–1175 MPa with TE of 7–15% [18]. Cai et al. explored a cold-rolled Fe–0.16C–6.5Mn–1.1Al–0.05Nb–0.22Mo–0.03N medium-Mn steel processed by the QP process and compared it with the IA process [19]. The QP-processed sample showed relatively higher strength with relatively lower ductility than the IA-processed sample [19]. Although these previous studies on the QP process of medium-Mn steels have been carried out, the microstructure and mechanical properties of medium-Mn steels containing different compositions processed by the QP process are still not clear because of limited studies.
In the present study, a medium-Mn steel containing 4 wt% Mn was designed, which was lower than the Mn content of most previously studied medium-Mn steels. The relatively low Mn content can reduce the alloy cost. The designed medium-Mn steel was attempted to be processed by a novel route involving TRSC, hot rolling and the QP process. Molten steel can be directly processed into thin strip steel with a thickness of ~2.5 mm using TRSC, which can reduce the process of high-temperature reheating, rough rolling and finish rolling in the traditional production line of strip steel [20]. Hence, TRSC is a low-energy and short process to produce medium-Mn steel. The effects of quenching temperature on the microstructure and mechanical properties were studied in detail. The relationship between microstructure and mechanical properties was also discussed. The aim of this study is to explore the possibility of medium-Mn steel produced by the TRSC plus QP process.

2. Materials and Methods

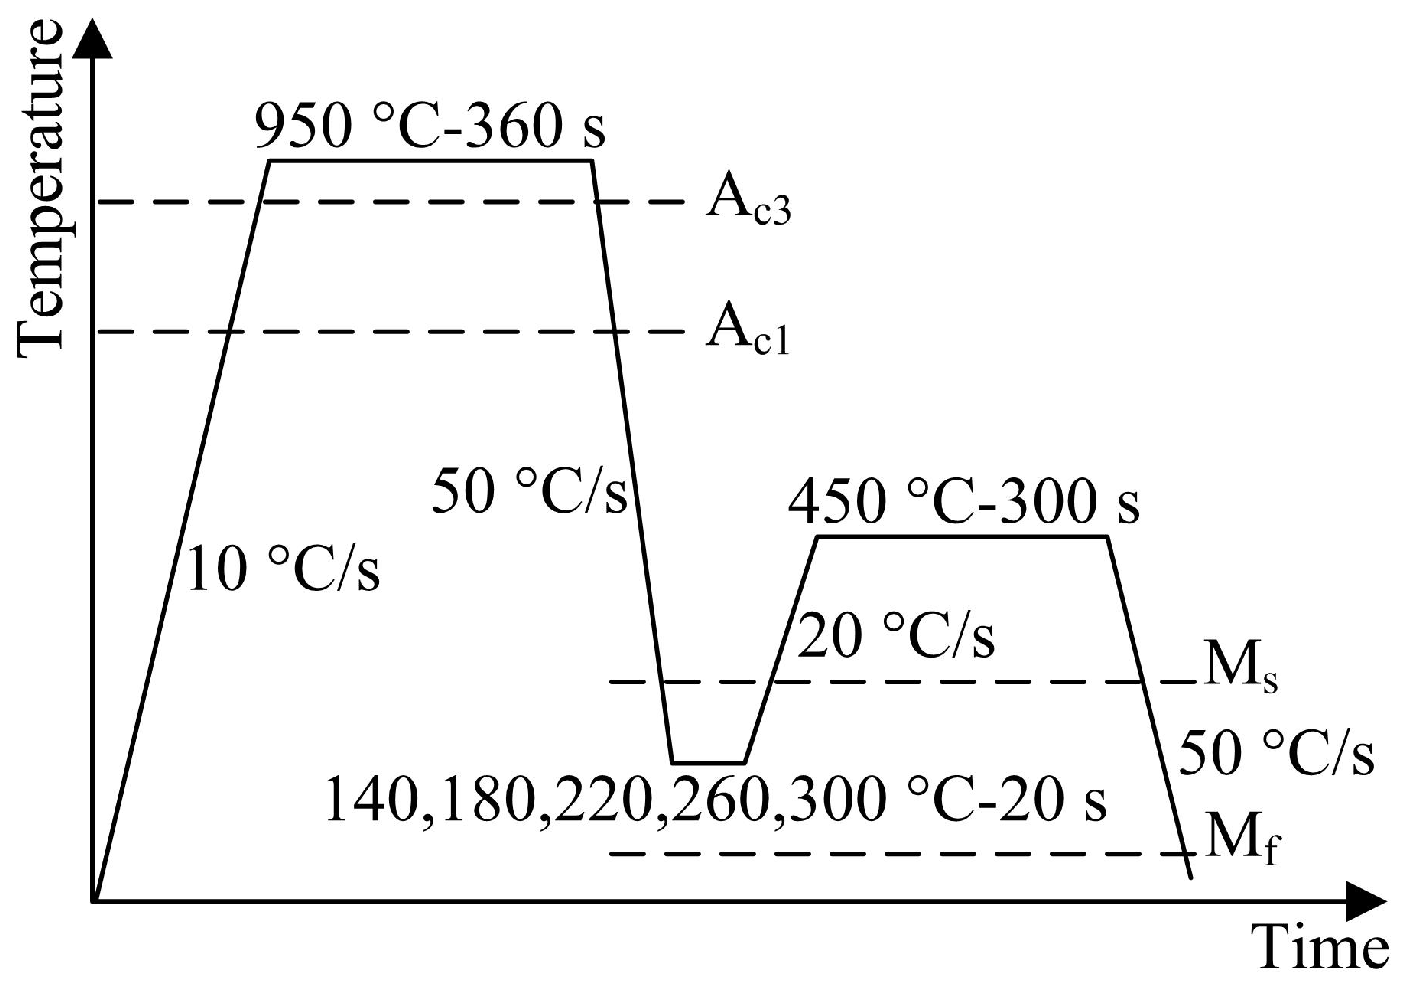
2.1. Materials Processing

A ~2.5 mm thick as-cast strip of Fe–0.3C–4Mn–1.82Al–0.6Si (wt%) medium-Mn steel was produced by a vertical-type twin-roll strip caster and then the as-cast strip was hot-rolled to ~1 mm at 1000 °C. The detailed TRSC and hot rolling parameters were reported in our previous study [20]. The microstructures of the as-cast strip and hot-rolled sheet consisted of martensite together with a small number of RA [20]. Macrosegregation of Mn was absent in the as-cast strip [20]. Finally, the hot-rolled sheet was subjected to the QP process. The Ac3, Ms and Mf temperatures were measured by a dilatometer (DIL 805A/D), which were 880, 340 and 101 °C, respectively. In order to confirm the optimum austenitizing temperature, the hot-rolled sheet was first heated to 800, 850, 900 and 950 °C for 360 s and then quenched to room temperature (preliminary experiment). Based on the result of the preliminary experiment (see next section), the hot-rolled sheets were austenitized at 950 °C for 360 s in a tube-type resistance furnace, quenched in a low-temperature salt bath furnace (initial quenching) of 140, 180, 220, 260 and 300 °C (quenching temperature) for 20 s, and then put in a middle-temperature salt bath furnace (partitioning process) of 450 °C (partitioning temperature) for 300 s followed by quenching to room temperature (final quenching). For convenience, the QP-processed samples subjected to different quenching temperatures were referred to as Q140, Q180, Q220, Q260 and Q300, respectively.

2.2. Microstructure Characterization

The phase transformation behavior during the QP process was studied using a DIL 805 A/D dilatometer. The detailed QP process for the dilatometry study is shown in Figure 1. Rectangular dilatometry specimens (length 10 mm, width 4 mm, thickness 1 mm) were prepared from the hot-rolled sheets. The microstructure was characterized by a Zeiss Ultra-55 field emission scanning electron microscope (SEM) equipped with an electron backscattered diffractometer (EBSD), a JXA-8530F electron probe microanalyzer (EPMA) and a Tecnai G2 F20 transmission electron microscope (TEM). EPMA specimens were first mechanically polished and then etched with 4 vol% nital solution (time 22 s). EBSD specimens were electropolished (current 0.7 A, time 20 s) using an electrolyte consisting of alcohol and perchloric acid in the proportion of 7:1 to remove the mechanically damaged layer. TEM specimen (diameter 3 mm, thickness ~45 μm) was twin-jet electropolished (voltage 32 V, temperature −22 °C) in a solution containing alcohol and perchloric acid in the proportion of 23:2.
The volume fraction of RA was measured by a Rigaku SmartLab X-ray diffractometer (XRD) (step rate 0.04 °/s, Cu Kα radiation). XRD samples were electropolished using the same method as EBSD specimens. Integrated intensities of (200)α, (211)α, (200)γ, (220)γ and (311)γ peaks were used to calculate the volume fraction of RA ( V γ ) using the following equation [21]:
V γ = 1.4 I γ / I α + 1.4 I γ
where I γ and I α are the average integral intensities of austenite and ferrite peaks, respectively. In addition, the carbon content of RA ( x C ) was calculated using the following equation [22]:
a γ = 3.556 + 0.0453 x C + 0.00095 x Mn + 0.0056 x Al
where a γ is the lattice parameter of RA in Angstroms, x C , x Mn and x Al are the concentration of carbon, manganese and aluminum in RA in wt%, respectively. The (200)γ, (220)γ and (311)γ peaks were selected to calculate a γ using the equation in reference [22].

2.3. Tensile Properties Examination

Dog-bone-shaped tensile specimens of dimensions 10 mm (gauge length) × 5 mm (width) were machined with a longitudinal axis parallel to the hot rolling direction. The tensile tests were conducted using a SHIMADZU AG-X plus 100 kN testing machine (room temperature, crosshead speed 1 mm/min).

3. Results and Discussion

3.1. Microstructure of the Samples under Different Austenitizing Conditions

Figure 2 shows secondary electron images of the samples under different austenitizing conditions. Lath ferrite was obtained in the samples quenched at 800 and 850 °C. This is because the two heat treatment temperatures are in the temperature range between Ae1 and Ae3 temperatures [20], such that austenite reversion from martensite occurred, leading to the formation of lath ferrite. When the sample was quenched at 900 °C, although the heat treatment temperature was higher than the Ac3 temperature, there was still some blocky ferrite present at the prior austenite grain boundary. This may be related to the short holding time (360 s), which was not enough for ferrite to completely transform into austenite. No ferrite was observed in the sample quenched at 950 °C, such that 950 °C was selected as the austenitizing temperature of the QP process.

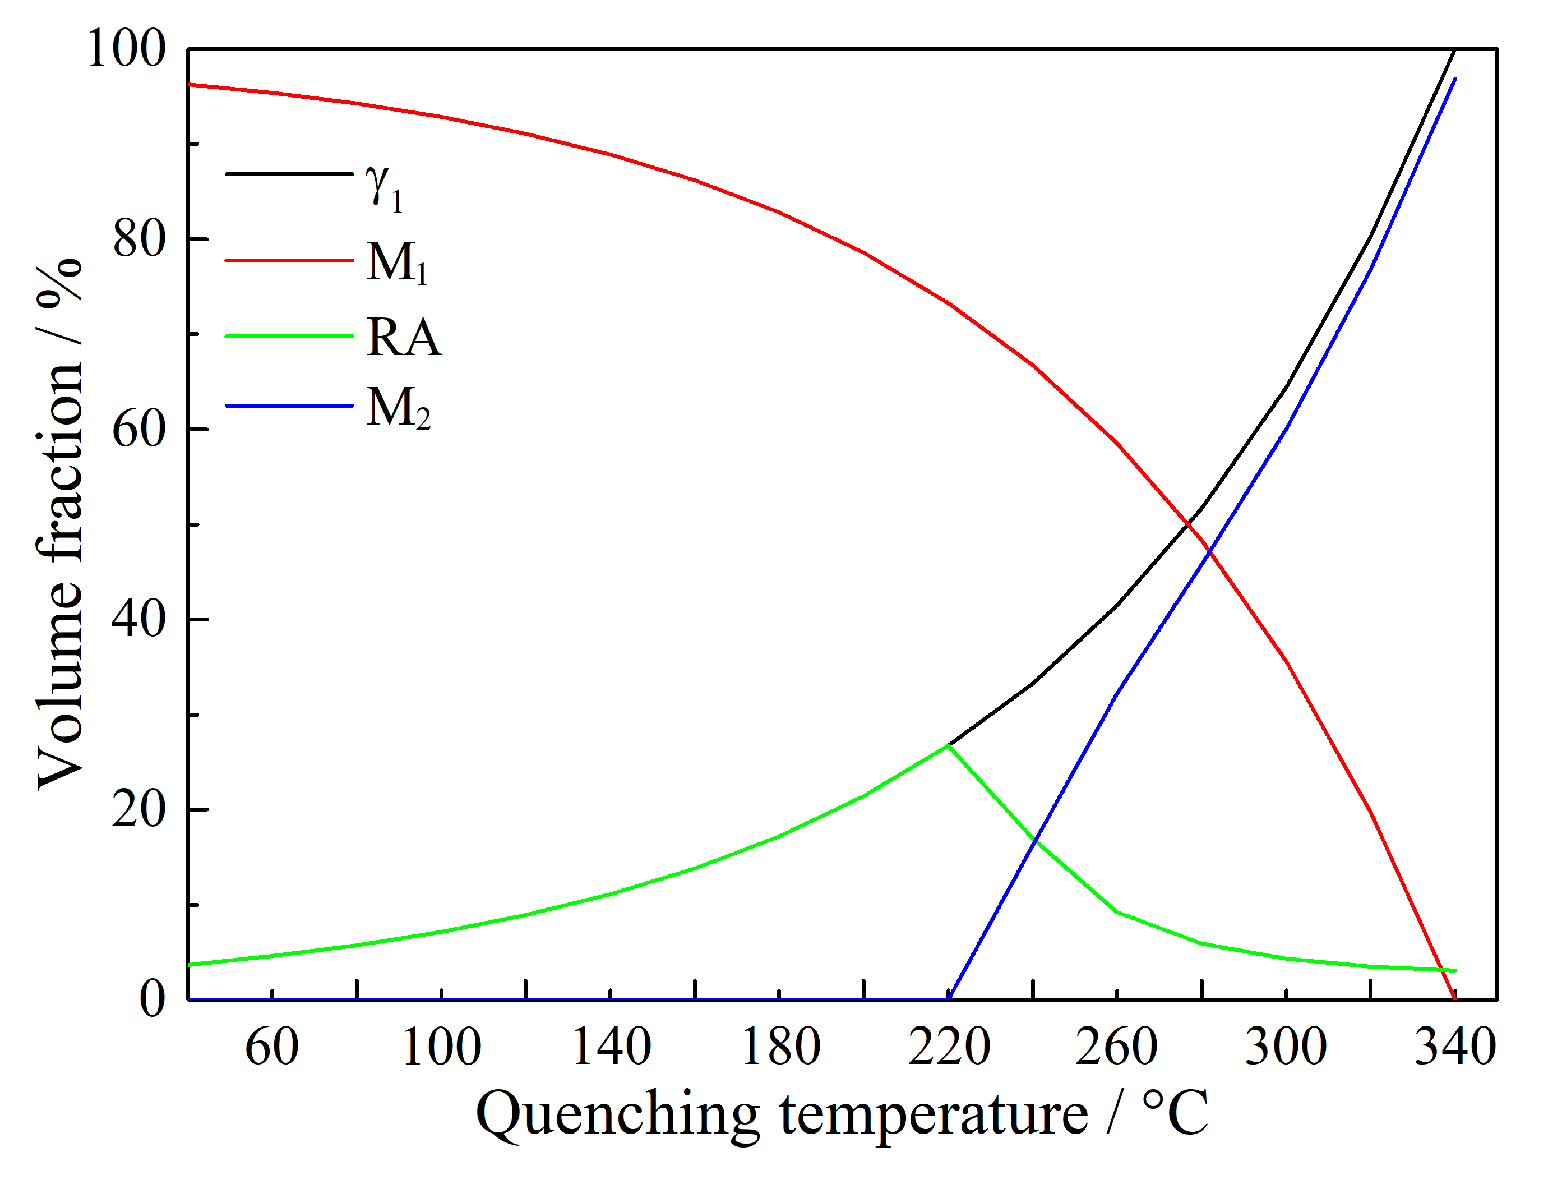
3.2. Predicted Phase Fraction Basing on CCE Model

The CCE (constrained carbon equilibrium) model was considered as a good description for the thermodynamics of the carbon partitioning process, which assumed that full carbon partitioned into untransformed austenite prior to the final quenching [23,24,25]. In the present study, different phase fractions in QP-processed samples were predicted based on this model. The volume fractions of primary martensite (martensite formed during initial quenching), initial austenite (austenite retained after initial quenching and prior to partitioning), secondary martensite (martensite formed during final quenching) and RA under the CCE model were determined by the Koistinen–Marburger equation [26]:
f m = 1 exp 0.011 × M s T q
where T q is the quenching media temperature and f m is the fraction of martensite formed at T q . The predicted result is shown in Figure 3. With the increase in quenching temperature, the volume fraction of RA first increased when the temperature was lower than 220 °C, followed by a decrease when the temperature was higher than 220 °C, i.e., the highest volume fraction (26.7%) of RA was present at the quenching temperature of 220 °C. In addition, no secondary martensite was formed when the quenching temperature was less than or equal to 220 °C, while secondary martensite started to appear when the quenching temperature was higher than 220 °C and its volume fraction increased with increasing temperature. This is related to the fact that the initial austenite fraction increased with increasing quenching temperature. The amount of carbon partitioned into per unit volume of austenite was lower for the higher volume fraction of initial austenite, such that lower thermal stability of partitioned austenite (initial austenite after partitioning and prior to final quenching) was obtained at higher quenching temperature, leading to a higher fraction of partitioned austenite transformed to secondary martensite during final quenching.

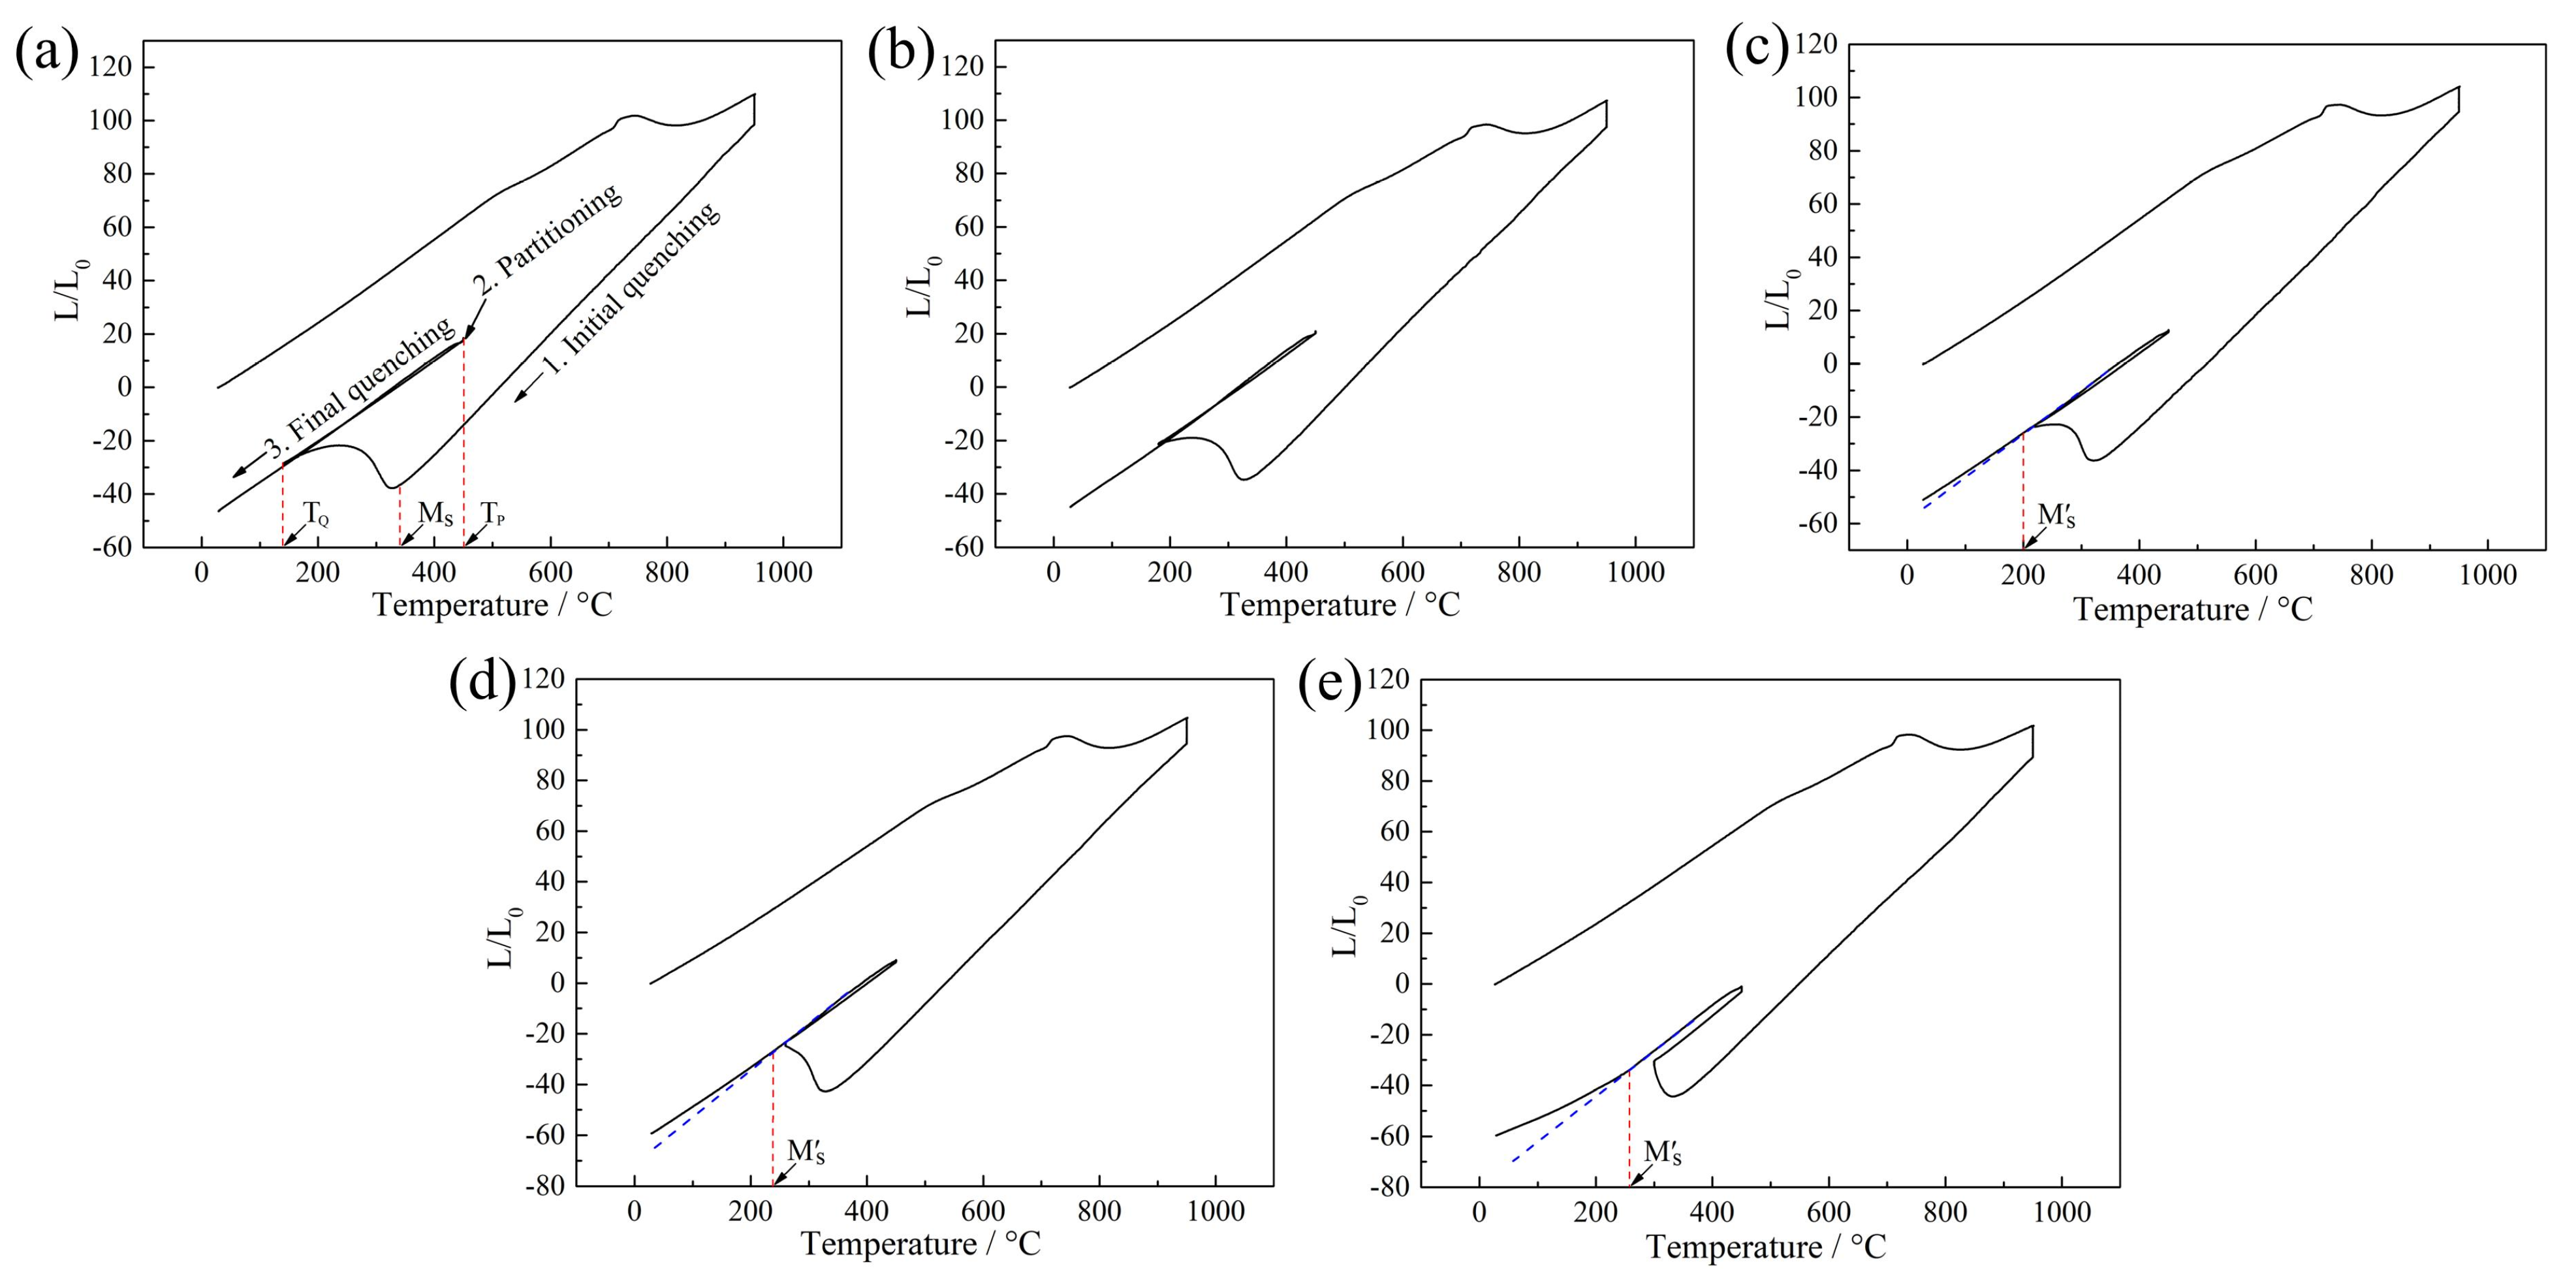
3.3. Dilatometric Curves and Microstructure of QP-Processed Samples

Figure 4 shows dilatometric curves of QP-processed samples subjected to different quenching temperatures. When the quenching temperatures were 140 and 180 °C, no volume expansion was present during the final quenching, i.e., no secondary martensite transformation occurred. This indicated adequate carbon diffused into initial austenite during the partitioning process, such that the carbon-enriched partitioned austenite remained stable during the final quenching [27]. When the quenching temperature was in the range of 220 to 300 °C, an obvious volume expansion was observed during the final quenching because of the transformation of partitioned austenite to secondary martensite. In addition, the secondary martensite start temperature and the volume expansion were increased with increasing quenching temperature, which was the same as the previous study [27]. This indicated the thermal stability of partitioned austenite decreased with increasing quenching temperature, leading to more secondary martensite formed in the sample subjected to higher quenching temperature, corresponding to the predicted result based on the CCE model (Figure 3).
Figure 5 shows secondary electron images and Figure 6 shows EBSD phase maps of QP-processed samples subjected to different quenching temperatures. In Q140 steel, the microstructure consisted of primary martensite, blocky RA and lath RA. Carbides were also observed in the primary martensite. Q180 steel had a similar microstructure to Q140 steel, while the amount of blocky RA was higher than Q140 steel. When the quenching temperature was increased to 220 °C, blocky RA and lath RA were also observed in the primary martensite matrix. The blocky RA and lath RA in Q220 steel were also observed using TEM, as shown in Figure 7. In addition, the size of some blocky structures was ~3.5 μm, as shown in the red circle in Figure 5c. Based on the dilatometric curve (Figure 4c), it can be inferred that this blocky structure was an island of secondary martensite and RA (M2/RA island). Similarly, blocky RA, lath RA and M2/RA island were observed in the primary martensite matrix in Q260 steel. In addition, the secondary martensite with a large size of ~6 μm was observed in Q260 steel, as shown in the red circle in Figure 5d. This is because the quenching temperature was relatively high, leading to the presence of the partitioned austenite with a large size. The large-size partitioned austenite had low thermal stability because of its large grain size and insufficient carbon content obtained from adjacent primary martensite [28], such that it was transformed into secondary martensite during final quenching. In Q300 steel, the fraction of secondary martensite was higher than that in Q260 steel, corresponding to the predicted result based on the CCE model (Figure 3) and the dilatometric curves (Figure 4).
Figure 8a shows XRD patterns of QP-processed samples subjected to different quenching temperatures. Both austenite and ferrite peaks were observed in the XRD patterns. Based on the XRD results, the volume fractions of RA in Q140, Q180, Q220, Q260 and Q300 steels were 15.4%, 19.8%, 26.5%, 31.8% and 16.6%, respectively, i.e., the RA fraction first increased when the quenching temperature increased from 140 to 260 °C, followed by a decrease on further increasing the quenching temperature to 300 °C, as shown in Figure 8b. It was noted that the variation of RA fraction calculated by the XRD result was the same as the predicted result based on the CCE model, i.e., first increase followed by a decrease. However, the highest volume fractions of RA were present at different quenching temperatures, which were 220 °C under the CCE model and 260 °C by XRD, respectively. In addition, under the CCE model, secondary martensite started to disappear when the quenching temperature was less than or equal to 220 °C. This was different from the result of dilatometric curves (Figure 4) and secondary electron images (Figure 5) that secondary martensite was present when the quenching temperature was 220 °C. Thus, there was some deviation between the predicted result under the CCE model and the actual experimental result. The deviation was related to the fact that the CCE model assumed full carbon partitioning into untransformed austenite prior to the final quenching [23,24,25]. In effect, carbides were formed in the primary martensite, consuming carbon atom, as shown in Figure 5. Figure 9 shows the carbon content of RA in QP-processed samples subjected to different quenching temperatures. It was seen that the carbon content of RA decreased with increasing quenching temperature. This variation corresponded to the previous discussion based on the CCE model, i.e., the carbon content of partitioned austenite decreased with increasing quenching temperature because of a higher fraction of initial austenite. The lower carbon content of partitioned austenite led to the lower carbon content of RA in the final microstructure.

3.4. Mechanical Properties and Transformation of RA

The engineering stress–strain plots and the detailed properties of QP-processed samples are shown in Figure 10 and Table 1, respectively. With an increase in quenching temperature, the TS first decreased when the quenching temperature increased from 140 to 220 °C, followed by an increase in further increasing the quenching temperature to 300 °C, while the variation of TE was opposite to the variation of TS. In addition, the variation of yield strength (YS) first increased in the quenching temperature range of 140 to 260 °C, followed by a decrease in the range of 260 to 300 °C. Moreover, it should be noted that Q220 steel had optimum mechanical properties with YS of 992 MPa, TS of 1159 MPa, TE of 20.4% and PSE of 23.64 GPa%. Compared with the strip-cast medium-Mn steel processed by the IA process in our previous study [20], the strip-cast medium-Mn steel processed by the QP process had higher YS together with lower TE and lower PSE than the IA process when they had similar TS (Table 1). This is related to the different microstructures obtained by QP and IA processes. The matrix structure of the QP-processed sample was martensite, which was beneficial to improving YS and was bad for TE. However, the matrix structure of the IA-processed sample was ferrite, leading to lower YS, but the ferrite matrix was good for TE. In addition, the IA-processed sample had a higher volume fraction of RA than the QP-processed sample [20]. Thus, the higher volume fraction of RA resulted in more deformation-induced martensite transformation in the IA-processed sample than the QP-processed sample, which was good for improving TE through the TRIP effect [29,30,31].
Figure 11a shows XRD patterns of fractured samples. The austenite peak of the fractured sample was of lower intensity than the undeformed samples (Figure 8a). In particular, almost no austenite peak was observed in the fractured sample at a quenching temperature of 300 °C. Figure 11b shows the comparison of the volume fraction of RA in undeformed and fractured samples, and the corresponding transformation ratio of RA is shown in Figure 11c. It was observed the transformation ratio of RA increased with increasing quenching temperature. This is because the carbon content of RA in undeformed samples was decreased with increasing quenching temperature (Figure 9). The RA with lower carbon content possessed lower mechanical stability [32,33], leading to lower mechanical stability of RA in the sample subjected to higher quenching temperature. In addition, it should be noted that almost all RA transformed to martensite when the quenching temperature was 300 °C. This is related to the fact that the carbon content of RA in this sample was only 0.75 wt% which was relatively lower than the other samples, leading to an extremely lower mechanical stability of RA.

3.5. Relationship between Microstructure and Mechanical Properties

In the present study, the quenching temperature had an influence on the mechanical properties of QP-processed samples (Figure 10). This is related to the different microstructures and TRIP effects that occurred in Q140, Q180, Q220, Q260 and Q300 steels. Figure 12a shows the variation of RA fraction, YS and TS. The variation of YS was opposite to the variation of RA fraction and the YS had a minimum value in Q260 steel. When the quenching temperature was in the range of 140 to 260 °C, the YS may be mainly related to the volume fraction of RA, resulting in lower YS for the sample containing a higher volume fraction of RA. A similar phenomenon has been reported in previously reported QP-processed medium-Mn steels, i.e., the higher the amount of RA, the lower the YS [16,17]. On the one hand, it is attributed to the particular face-centered cubic (FCC) lattice of austenite containing four close-packed planes [17]. Three close-packed directions were contained in each plane, and dislocation motion is easy in an FCC structure [17]. On the other hand, the TRIP effect may occur before the stress increases to YS, which supports the motion of dislocations in the RA resulting from the martensitic transformation [17]. However, when the quenching temperature was 300 °C, a considerable amount of secondary martensite formed during final quenching (Figure 4e and Figure 5e). The presence of a high fraction of secondary martensite in Q300 steel contributed to the rebound in the YS. In terms of TS, it decreased from 1250 to 1159 MPa when the quenching temperature increased from 140 to 220 °C. This is also because the volume fraction of RA increased with increasing quenching temperature, leading to a lower volume fraction of the hard phase (martensite) at higher quenching temperature. In addition, it should be noted that the TS of Q220 steel was only 14 MPa lower than Q180 steel. On the one hand, this is due to the presence of M2/RA islands in Q220 steel. The hardness of secondary martensite is higher than primary martensite because the former has a higher carbon content and dislocation density than the latter. Thus, M2/RA islands can effectively enhance the TS of Q220 steel. On the other hand, the transformation ratio of RA in Q220 steel was obviously higher than in Q180 steel, which also enhanced the TS of Q220 steel through the TRIP effect. When the quenching temperature was 260 °C, the highest volume fraction of RA was obtained and the secondary martensite fraction was also increased (Figure 5). The higher fraction of secondary martensite and higher transformation ratio of RA in Q260 steel contributed to the higher TS than in Q220 steel. Furthermore, when the quenching temperature was 300 °C, the highest fraction of secondary martensite was present, leading to the highest TS of Q300 steel.
Figure 12b shows the variation of RA fraction, TE and PSE. The variations of TE and PSE were first increased when the quenching temperature increased from 140 to 220 °C, followed by a decrease on further increasing the quenching temperature to 300 °C, i.e., the highest TE and highest PSE were present at the quenching temperature of 220 °C. However, the highest volume fraction of RA was obtained at the quenching temperature of 260 °C. This is because the mechanical property of QP-processed samples was not only related to the volume fraction of RA but was also related to the mechanical stability of RA and the presence of secondary martensite. When the quenching temperature increased from 140 to 220 °C, the volume fraction and transformation ratio of RA were increased, improving TE through the enhanced TRIP effect [34,35,36]. In addition, the presence of a small number of M2/RA islands in Q220 steel could enhance its TS because M2/RA islands acted as a hard phase [37]. Therefore, Q220 steel possessed the highest TE and highest PSE among all steels. For Q260 steel, the carbon content of RA decreased to 0.83 wt%, which was lower than Q220 steel (0.97 wt%). Thus, the mechanical stability of RA in Q260 steel was relatively lower than in Q220 steel. In this condition, although the fraction and transformation ratio of RA in Q260 steel was higher than in Q220 steel, the TRIP effect occurred in Q260 steel may finish at a lower strain than Q220 steel, leading to lower TE and PSE than Q220 steel. In addition, the presence of large-size secondary martensite was also harmful to the TE and PSE of Q260 steel. This is related to the fact that secondary martensite is a high-carbon brittle martensite, which has a poor plastic deformation ability [16]. In contrast, primary martensite contains a low carbon content due to the carbon partitioning into the austenite, such that the plastic deformation ability of secondary martensite is worse than primary martensite. In addition, previous studies also found that the presence of less ductile secondary martensite had a negative effect on the transformation stability of RA owing to its constraining influence on the strain distribution, which was also bad for the TE of Q260 steel [17,38]. When the quenching temperature increased to 300 °C, the carbon content of RA further decreased to 0.75 wt%. In this condition, the volume fraction and mechanical stability of RA in Q300 steel were decreased, contributing to the lower TE and PSE than in Q260 steel. Similarly, the relatively high fraction of secondary martensite also led to the low TE of Q300 steel. Based on the above analysis, it was known that the superior mechanical properties of Q220 steel were achieved by an optimum combination of high RA fraction (26.5%), appropriate mechanical stability of RA and a small number of M2/RA islands.

4. Conclusions

A medium-Mn steel (Fe–0.3C–4Mn–1.82Al–0.6Si wt%) was successfully processed by TRSC, hot rolling and the QP process. The microstructure evolution and the structure–property relationship were studied. The main conclusions are as follows:
(1)
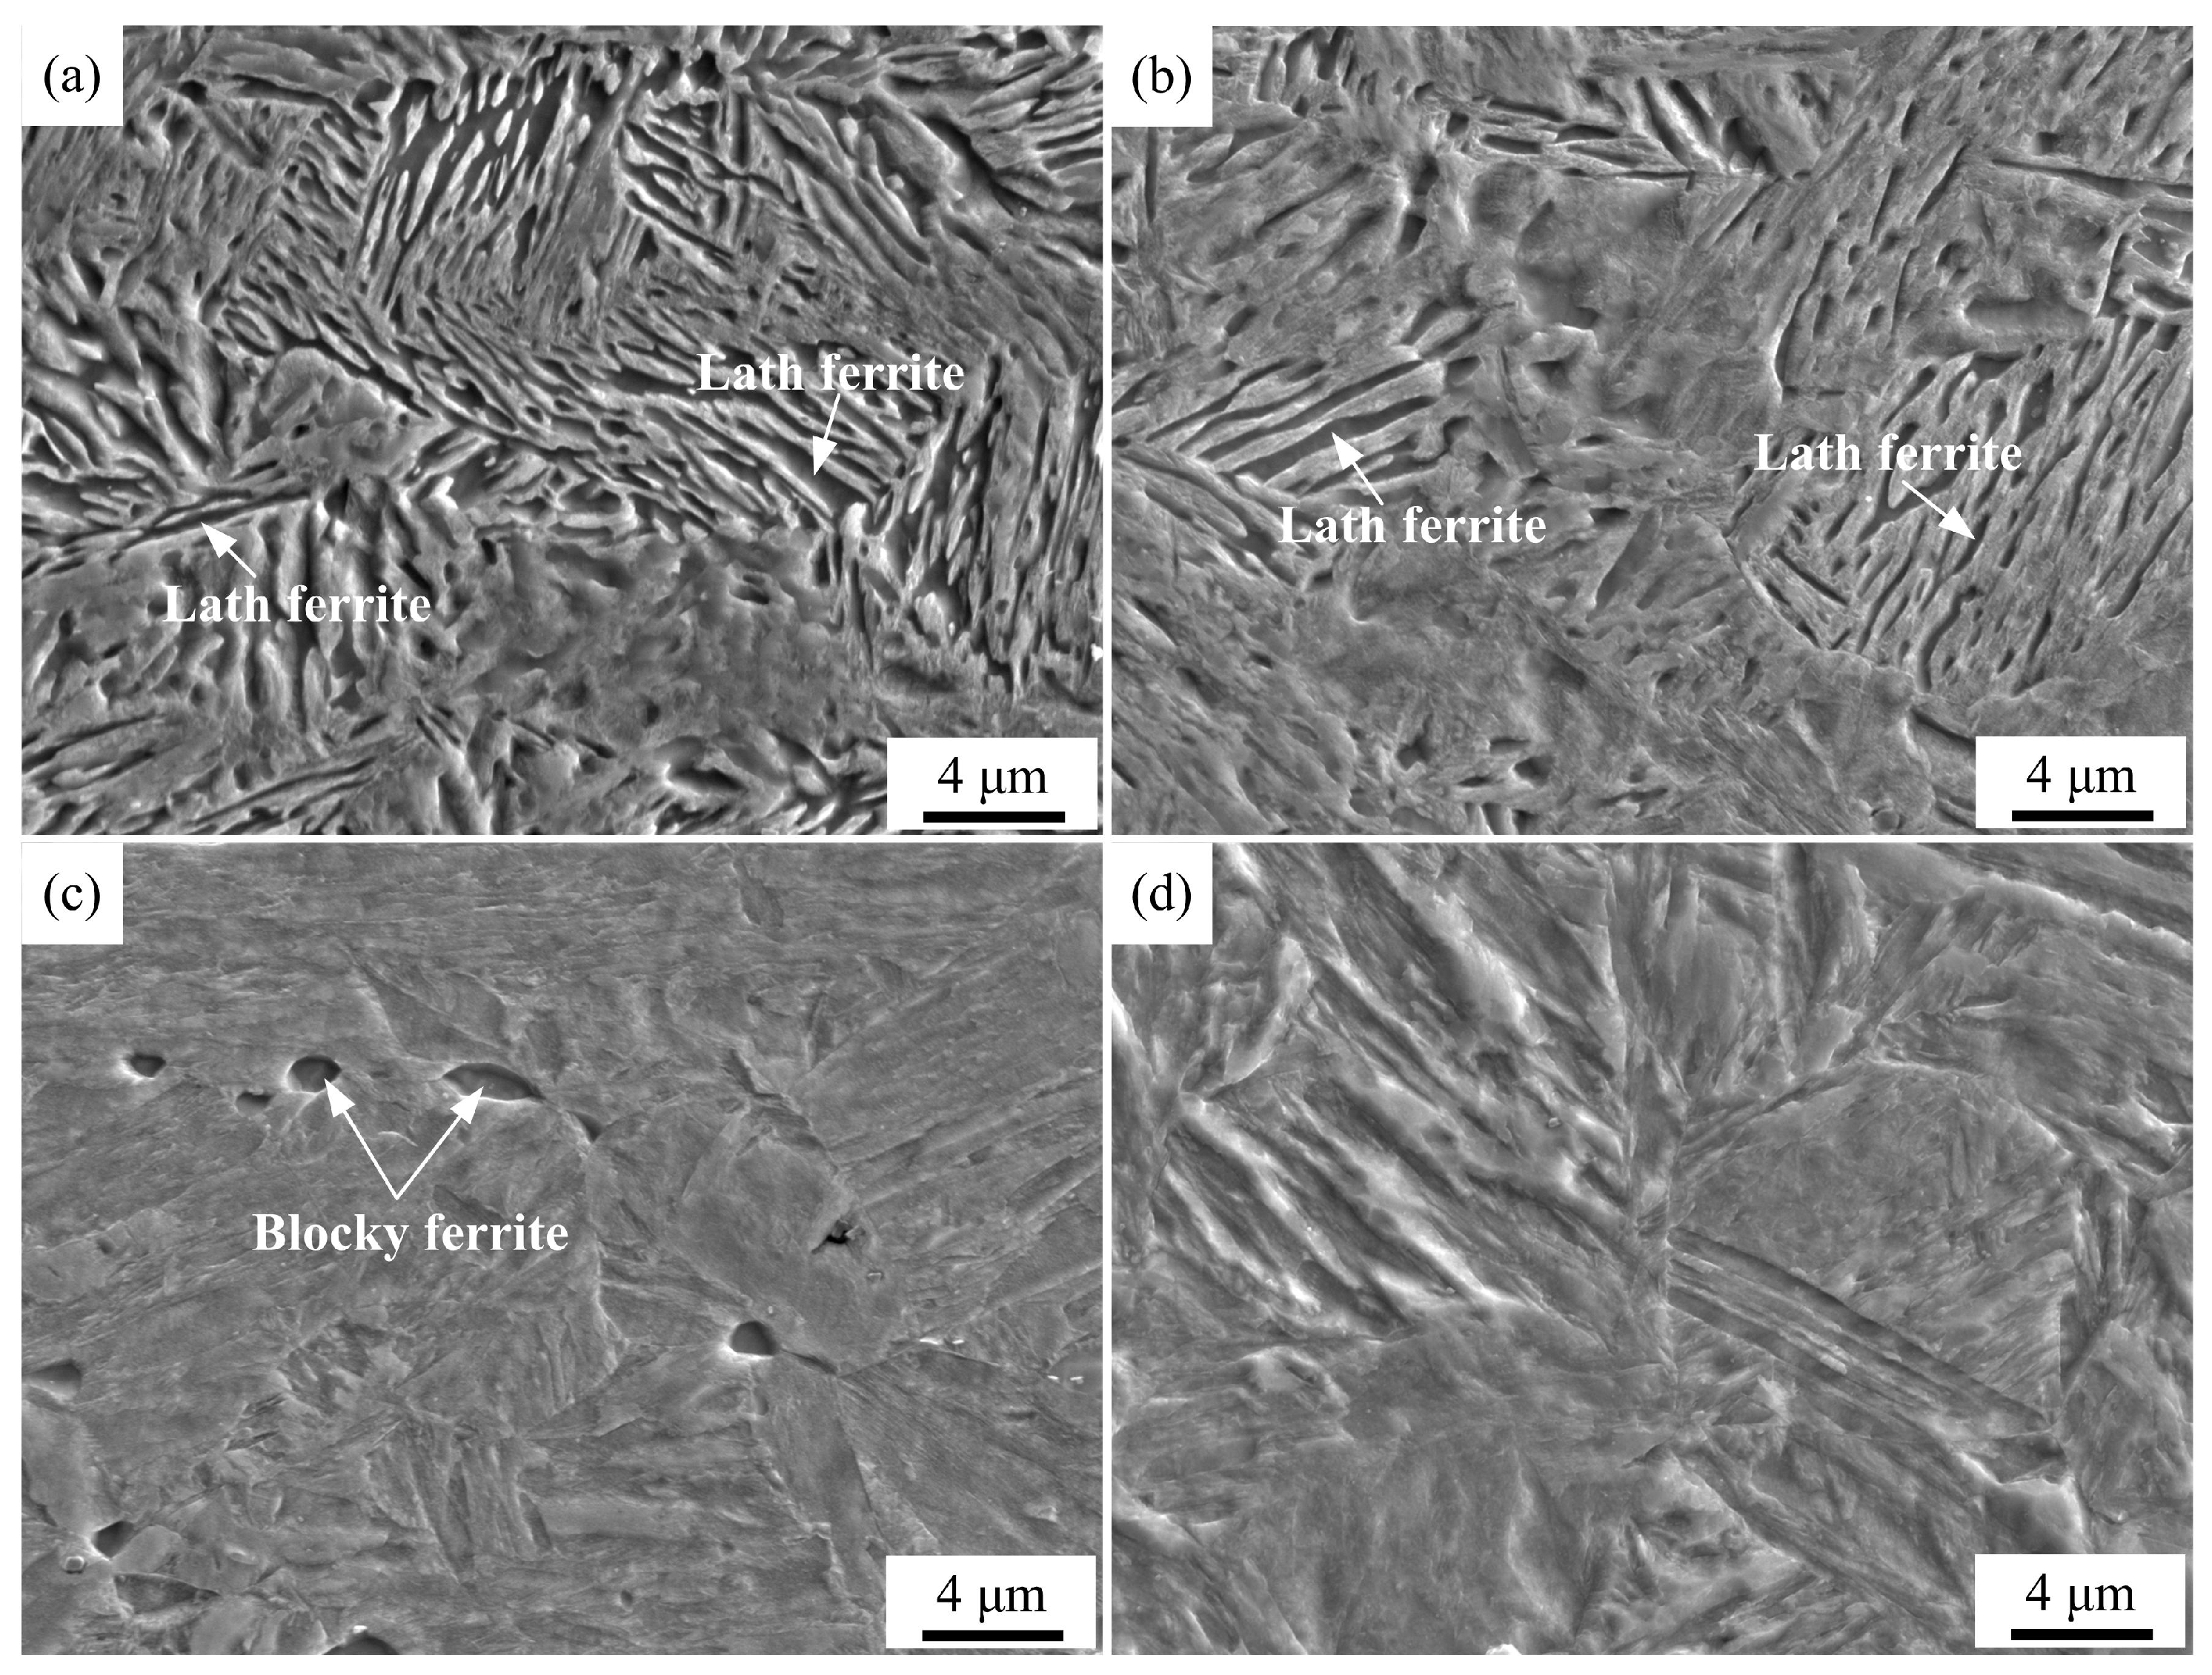
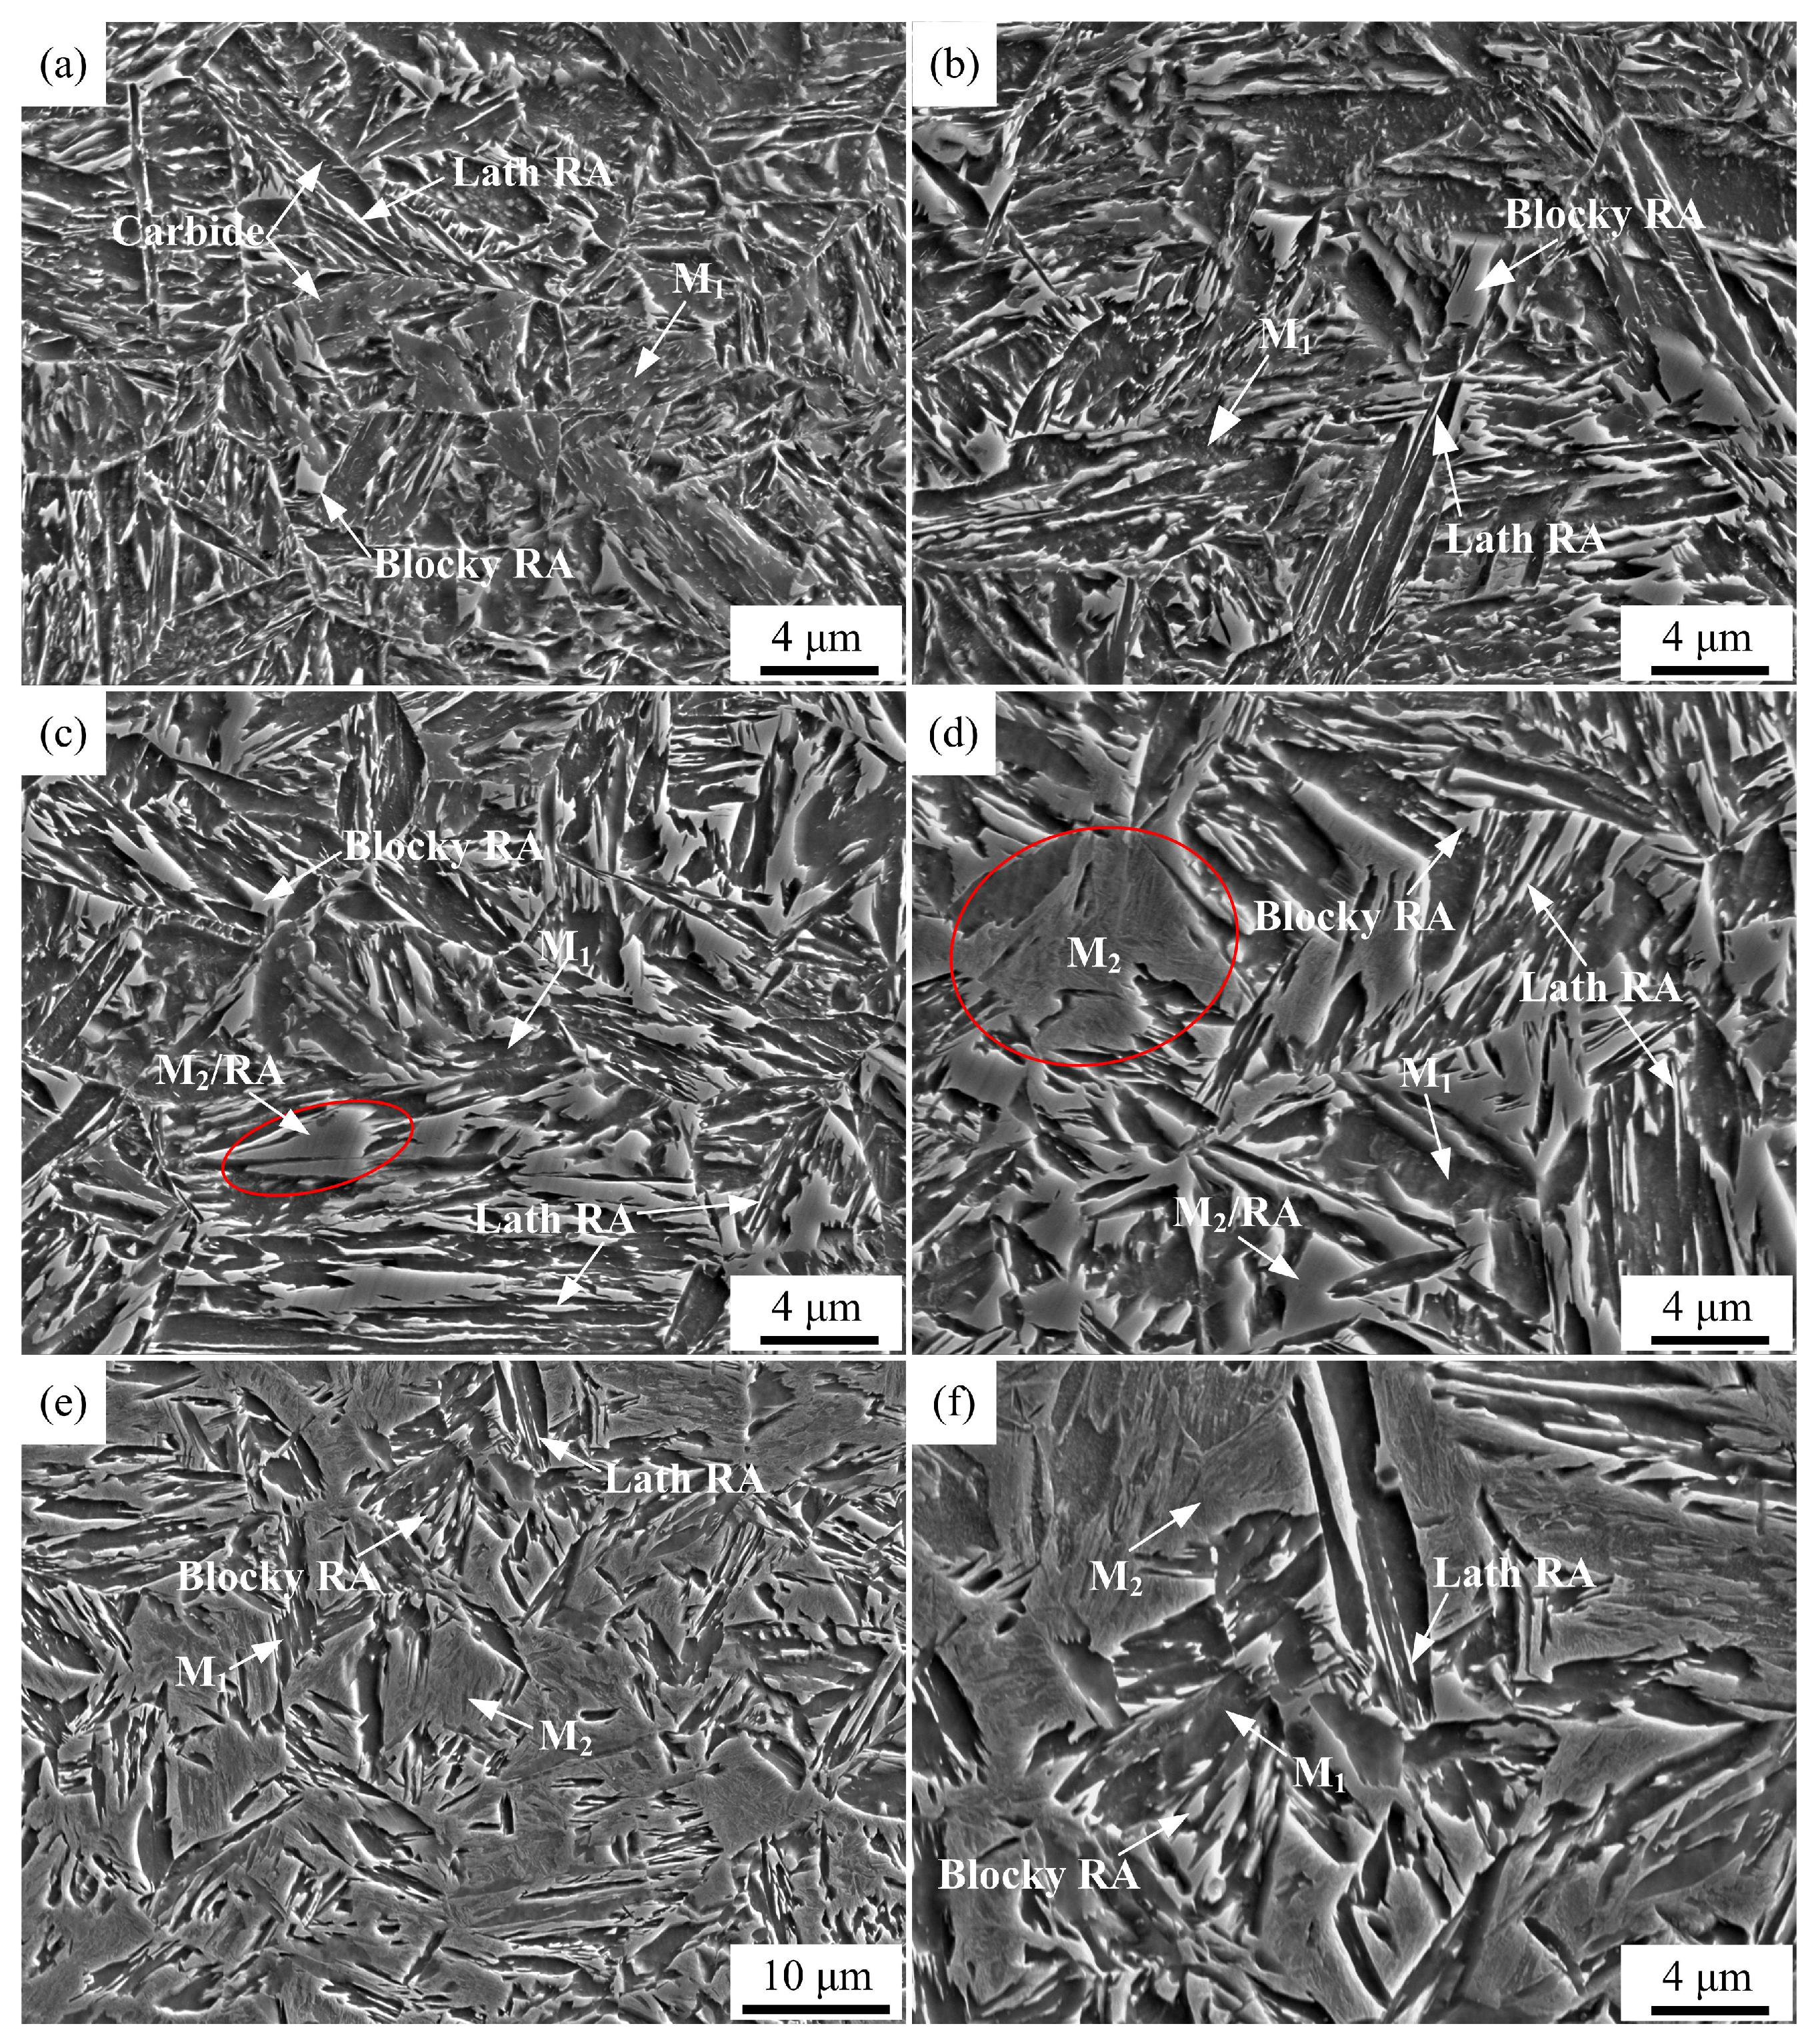
When the quenching temperature was less than or equal to 180 °C, the microstructure of QP-processed samples consisted of primary martensite and RA. However, when the quenching temperature was in the range of 220 to 300 °C, secondary martensite was also obtained in the QP-processed samples besides primary martensite and RA. This is related to the lower carbon content of partitioned austenite at higher quenching temperatures, decreasing the thermal stability of partitioned austenite.
(2)
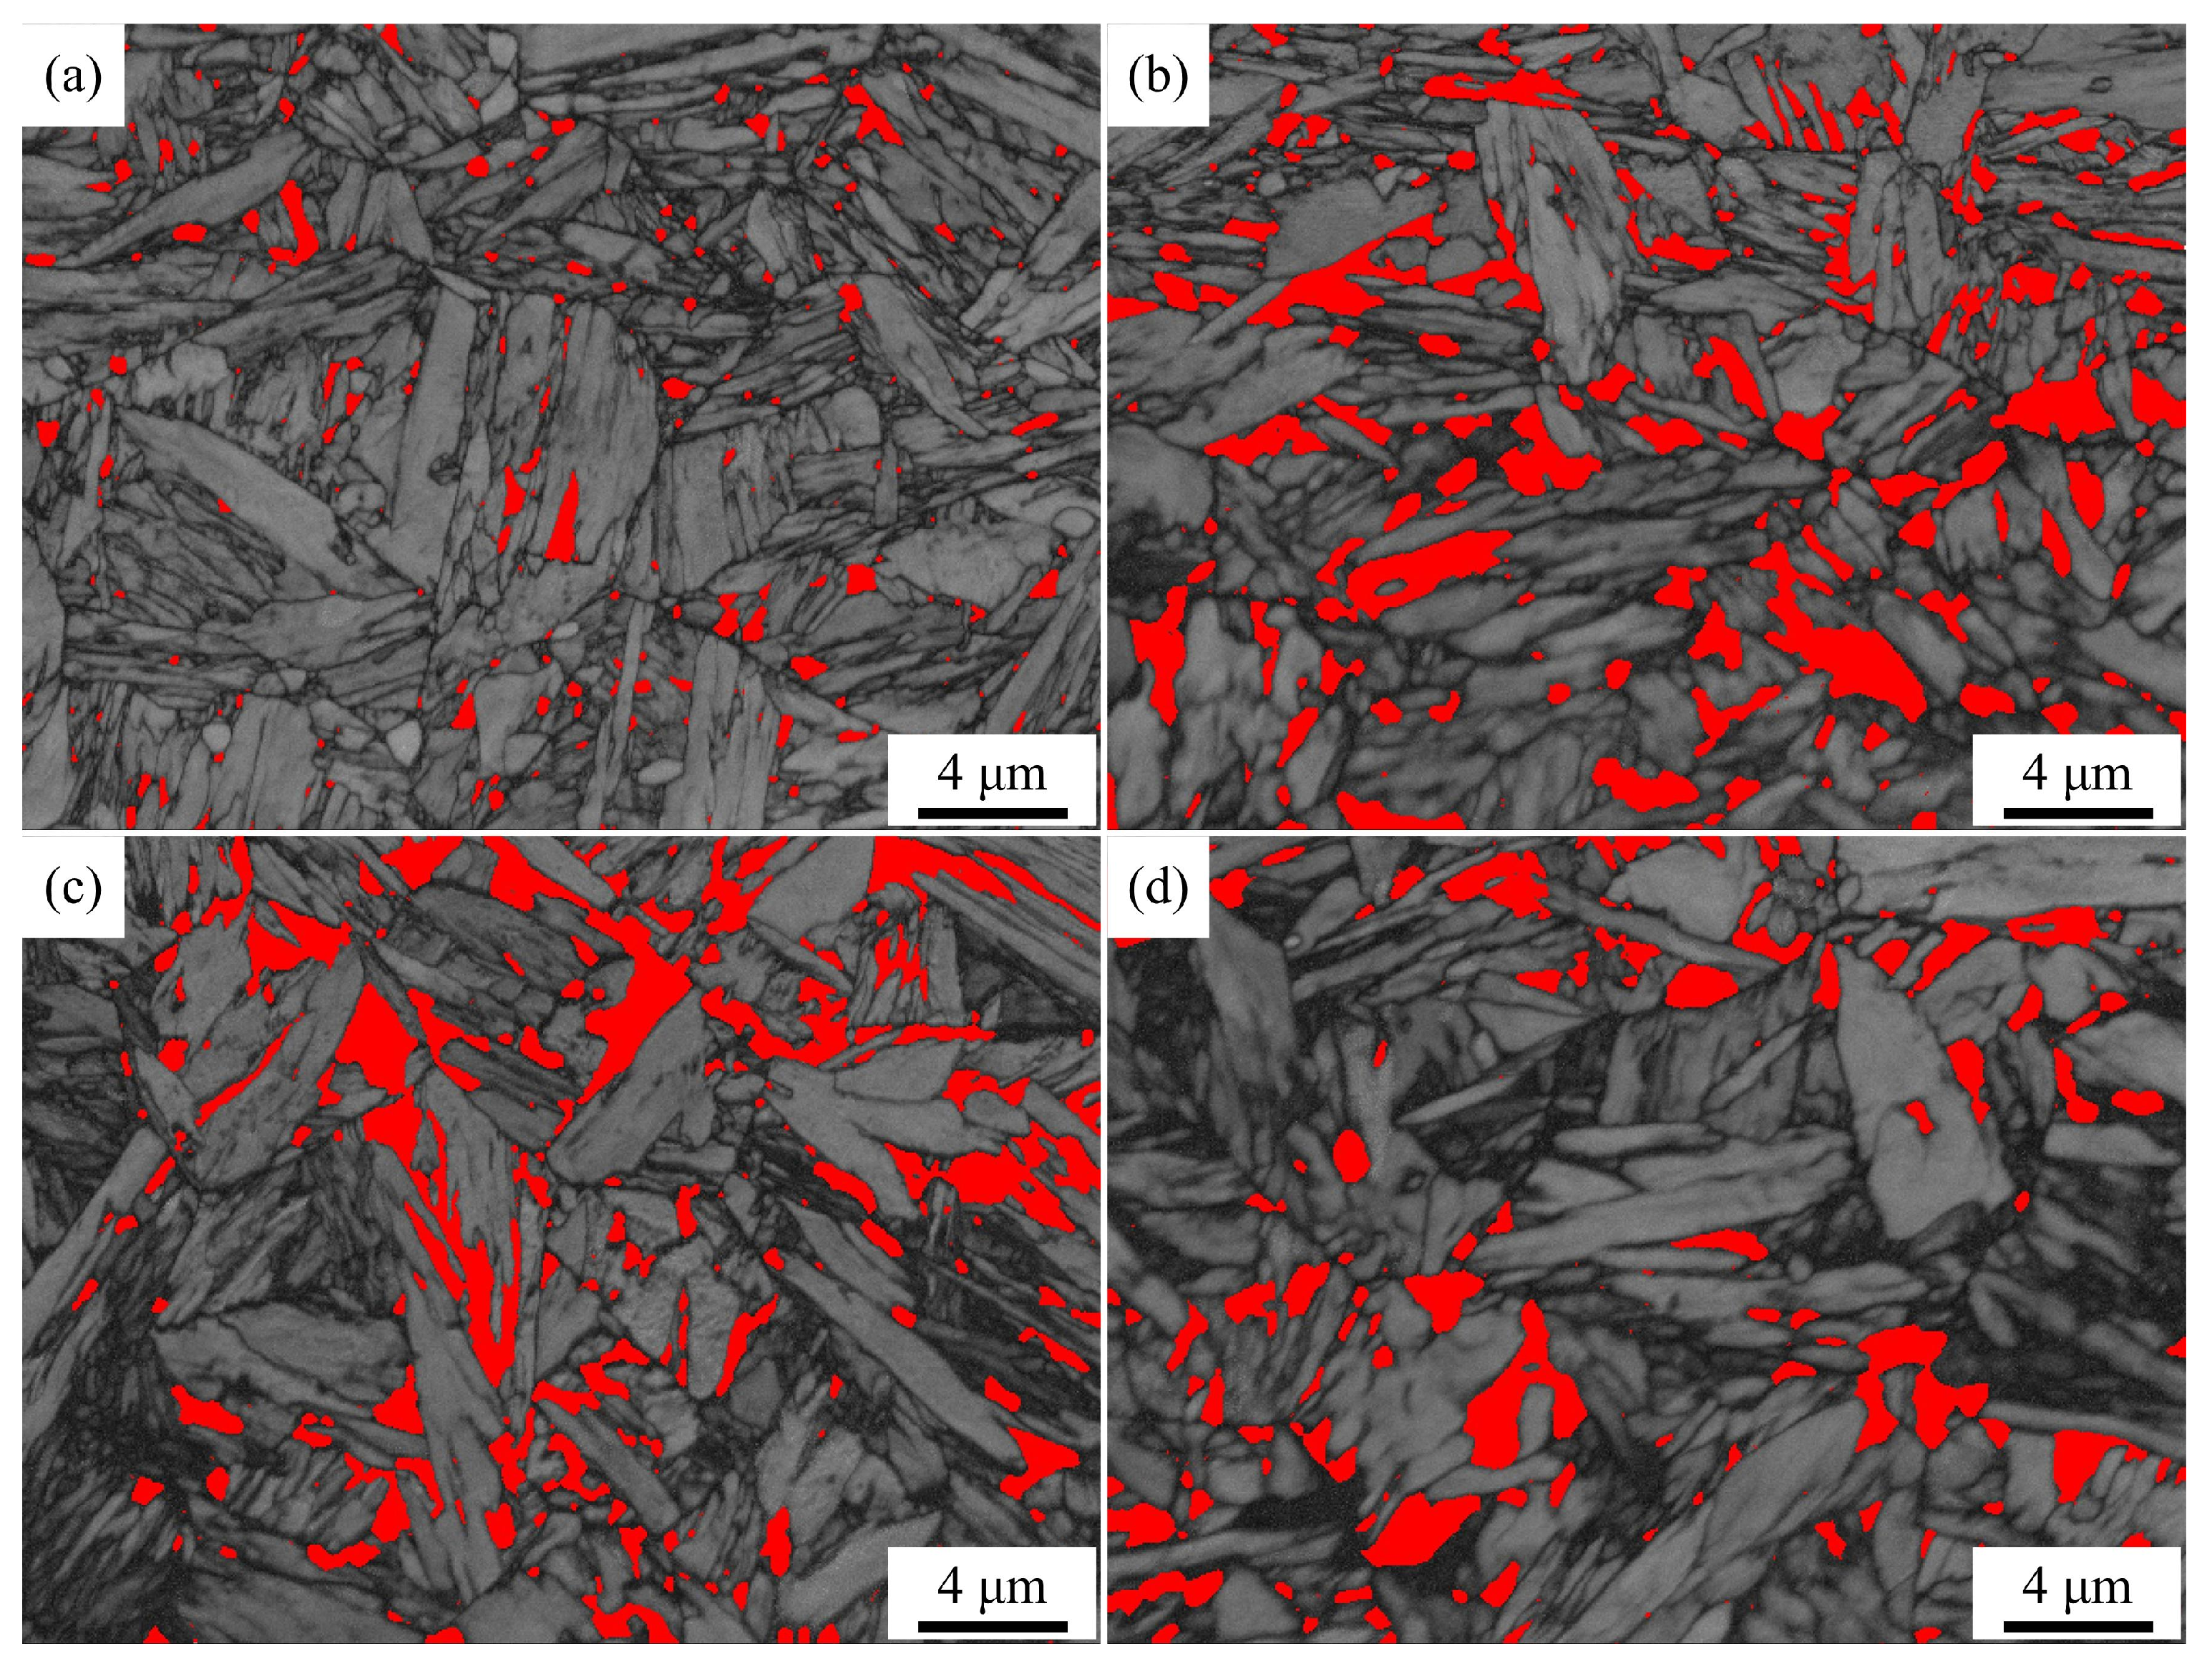
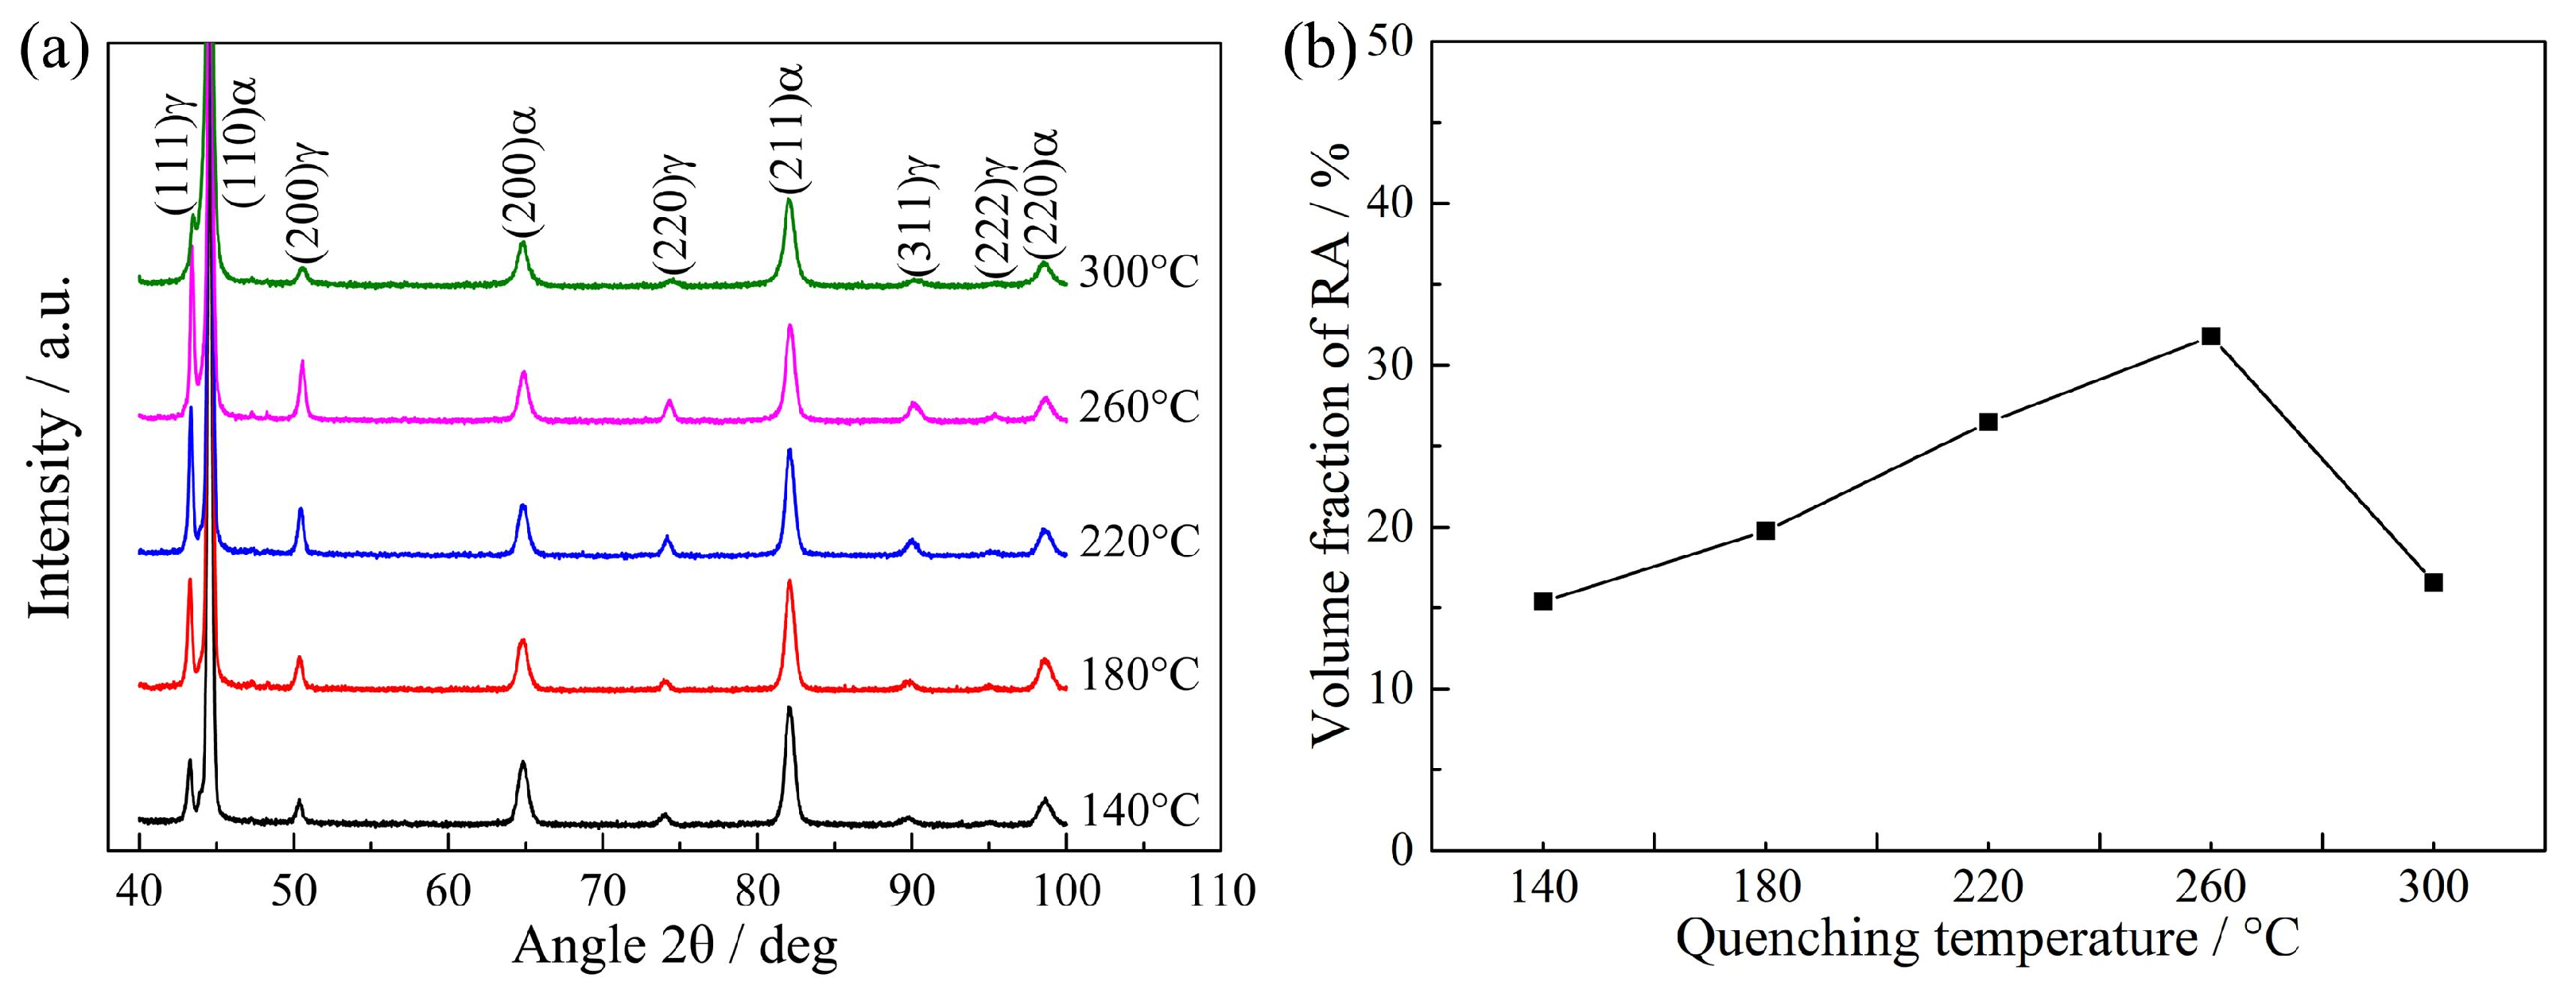
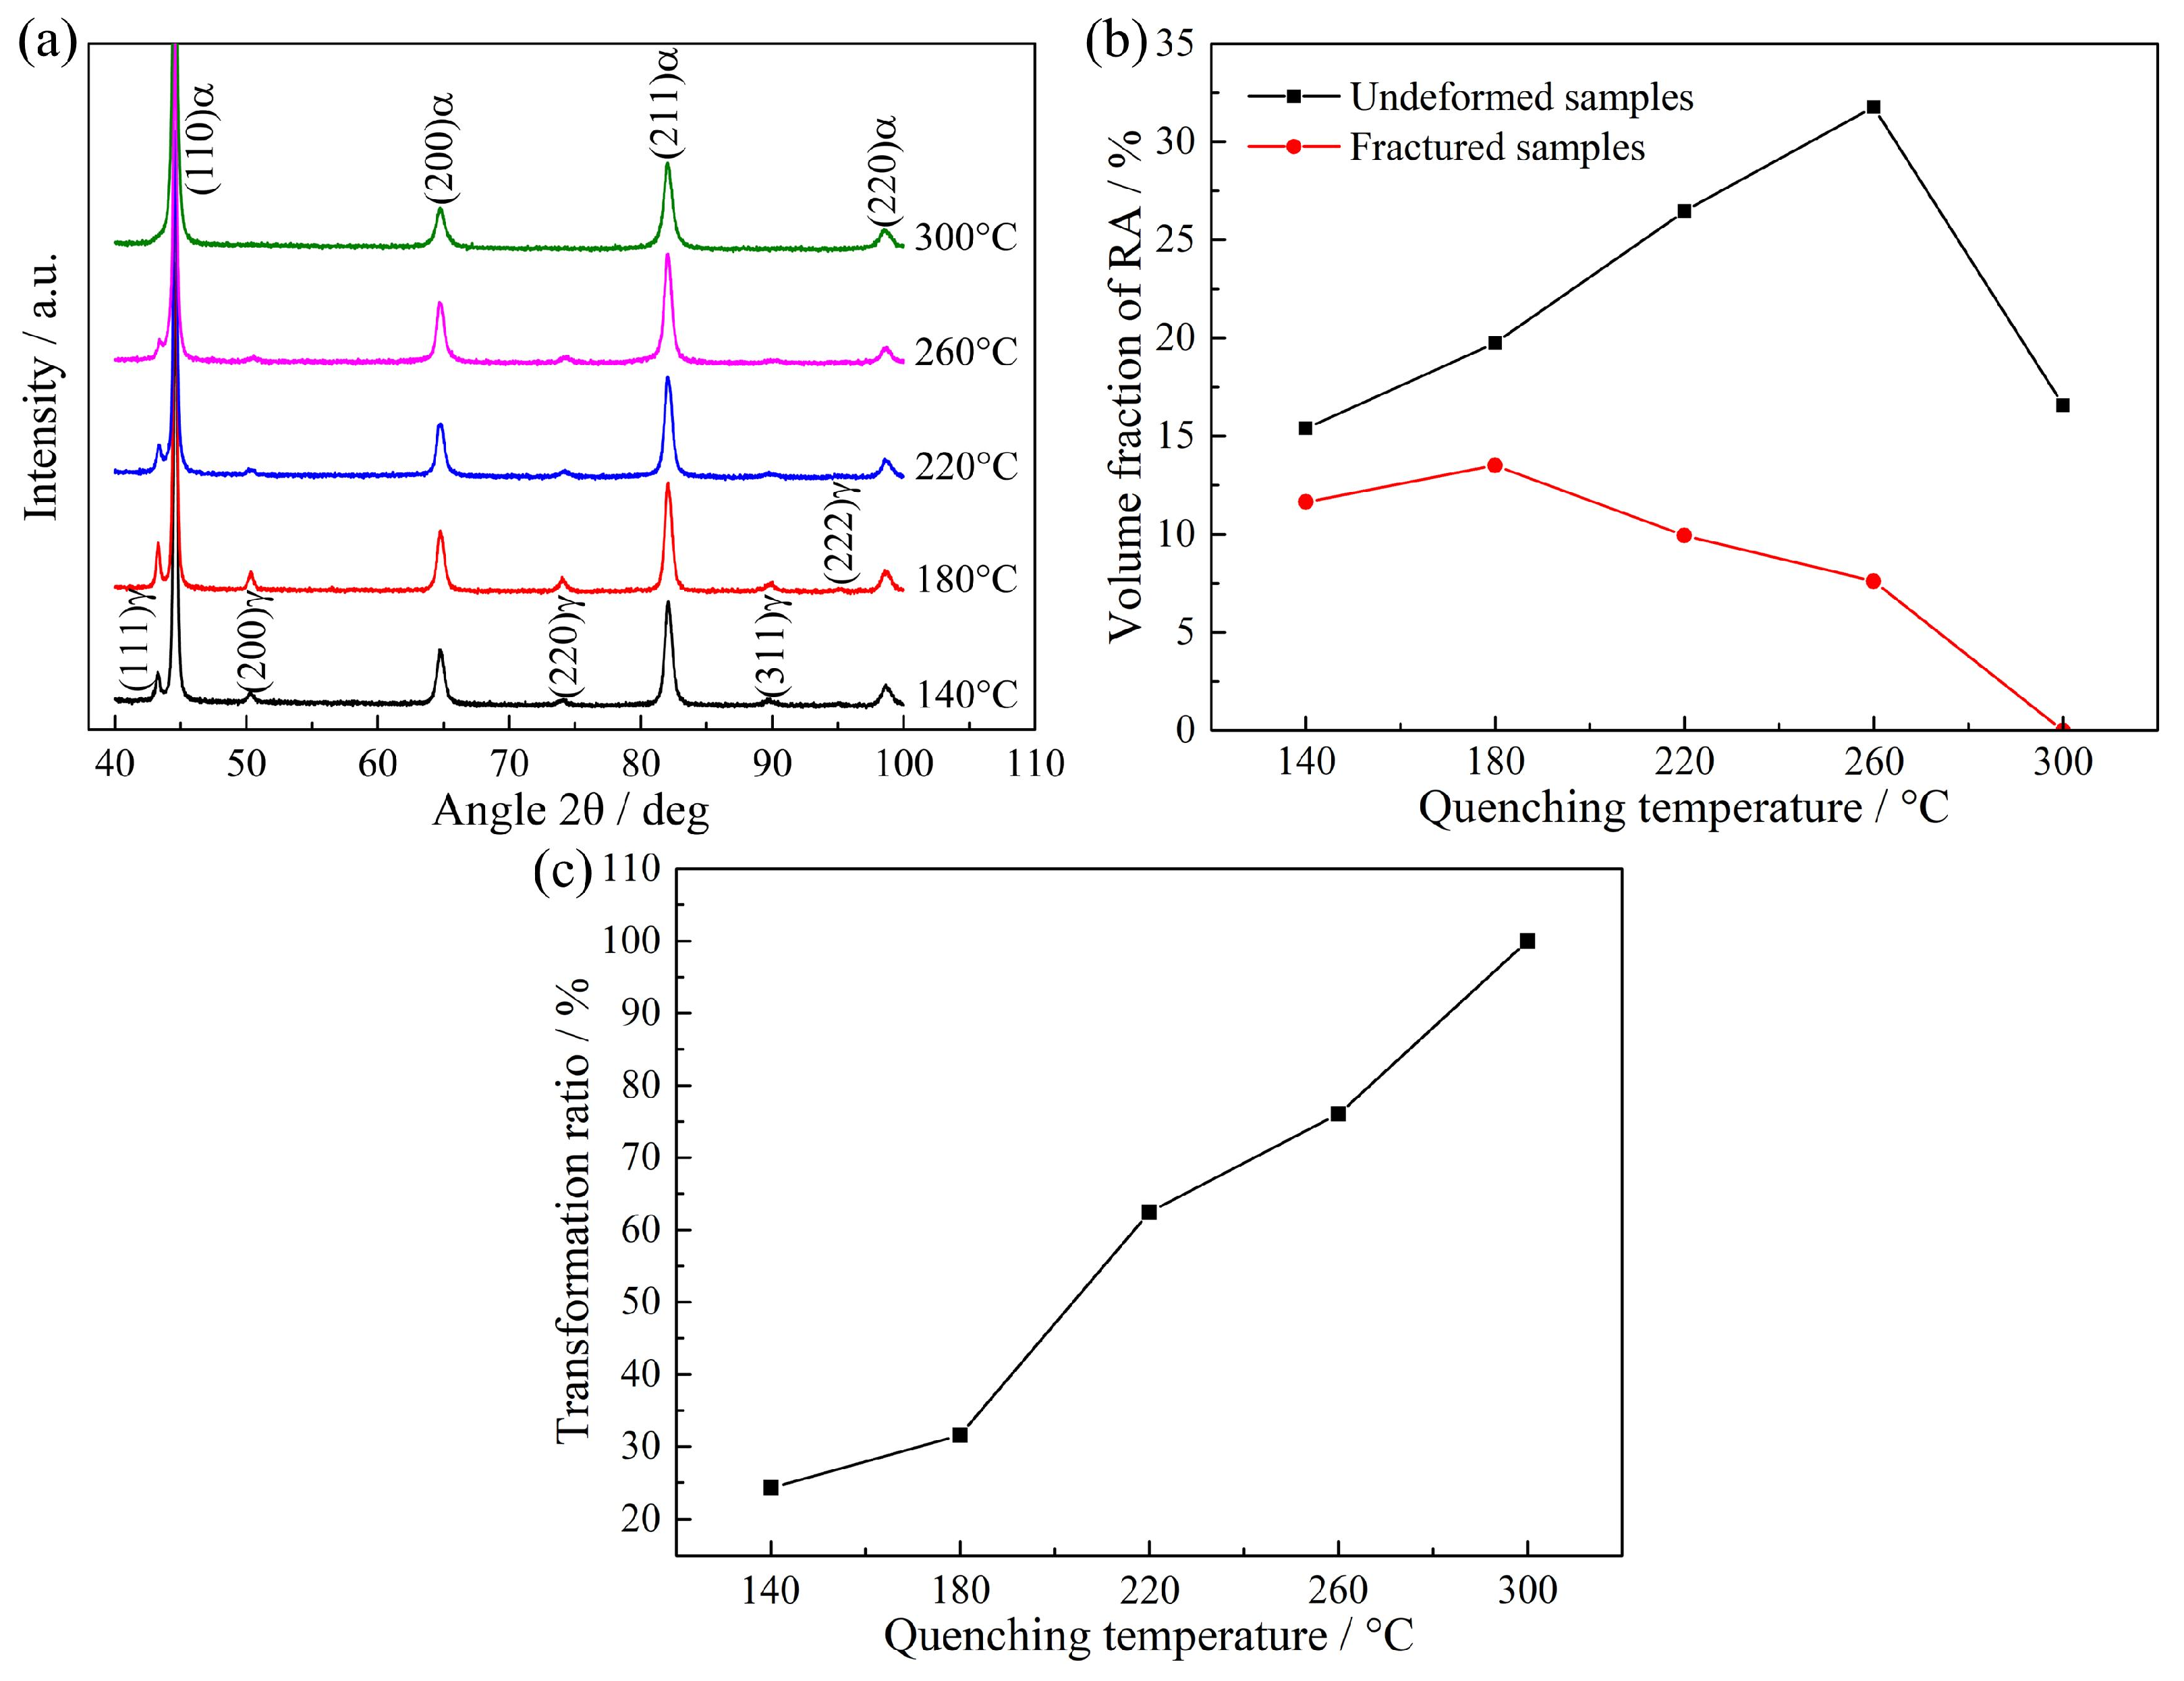
Because of the carbon partitioning during the QP process, the RA with a volume fraction of ~ 15.4–31.8% was obtained in the QP-processed samples. The volume fraction of RA first increased from 15.4% to 31.8% when the quenching temperature increased from 140 to 260 °C, followed by a decrease to 16.6% on further increasing the quenching temperature to 300 °C.
(3)
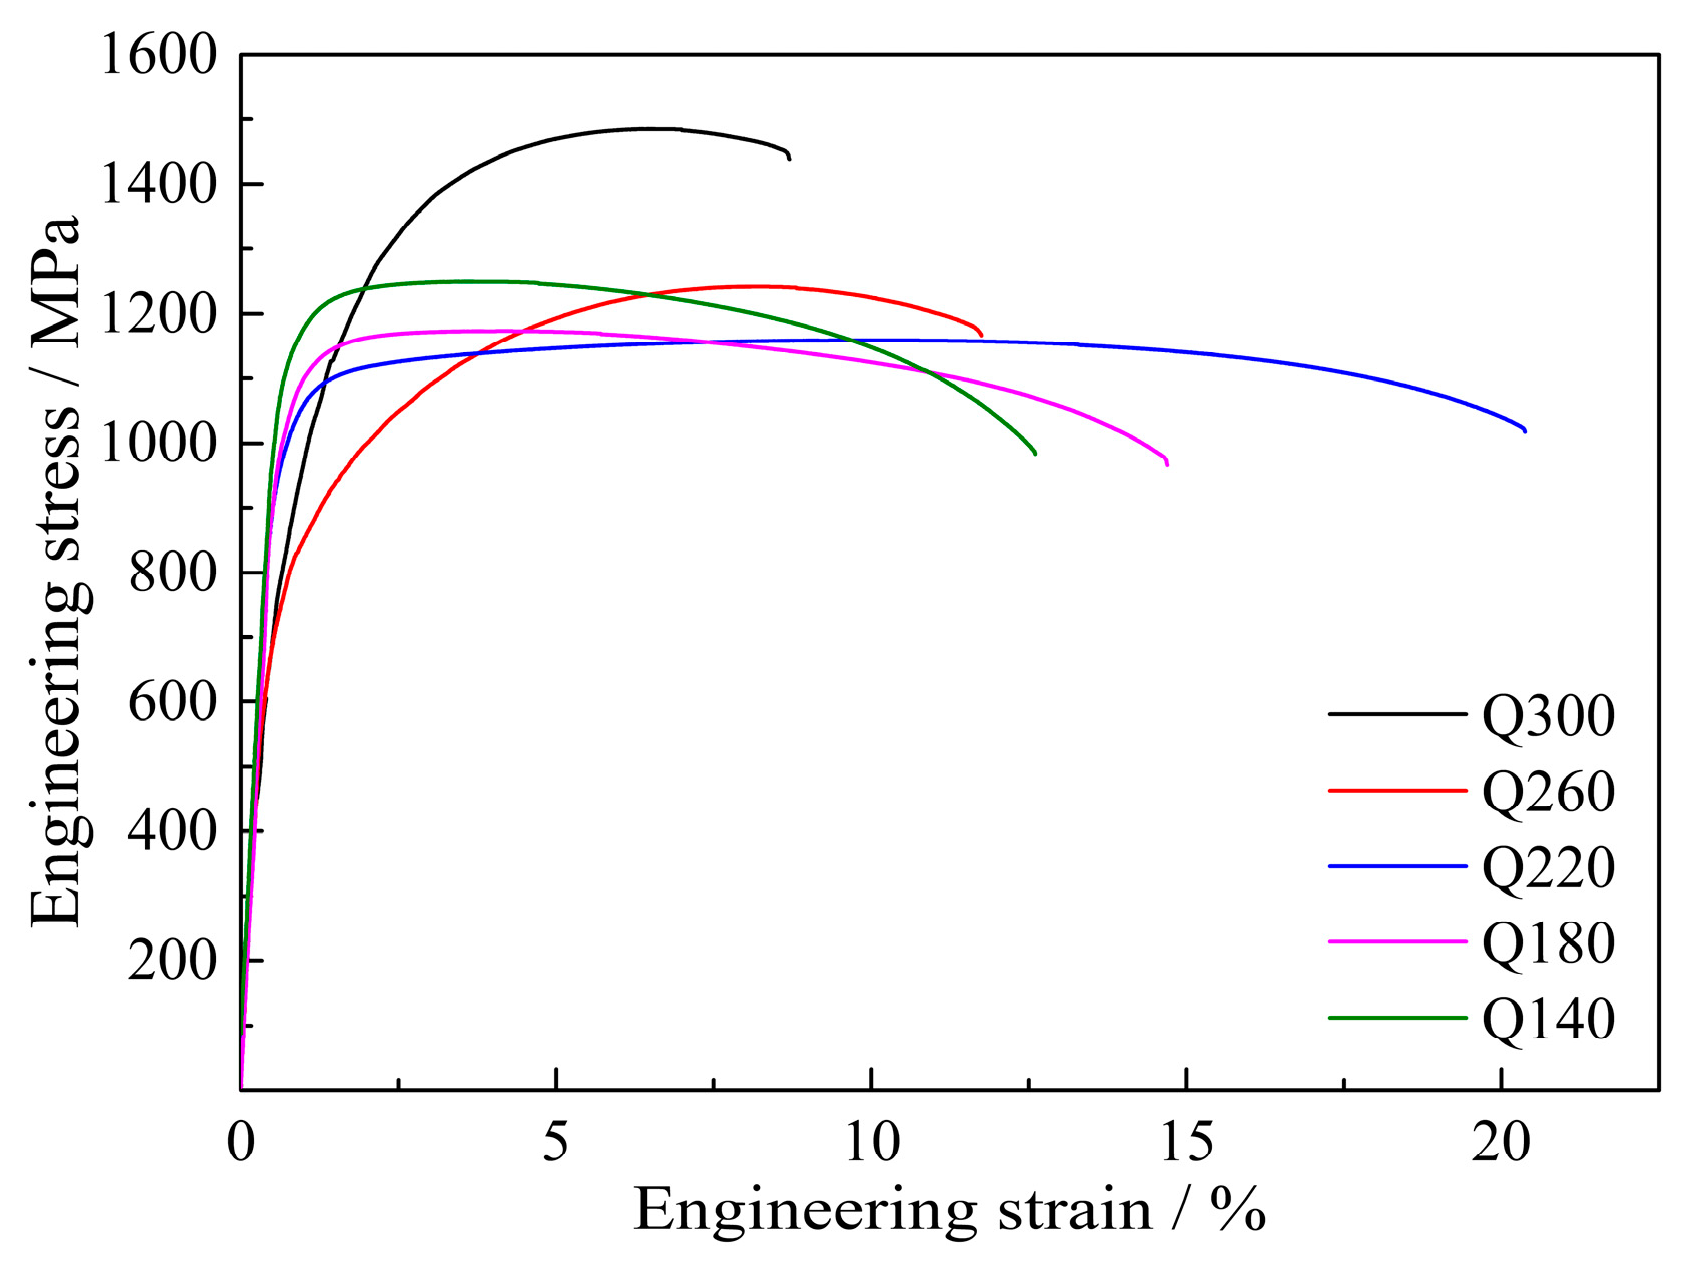
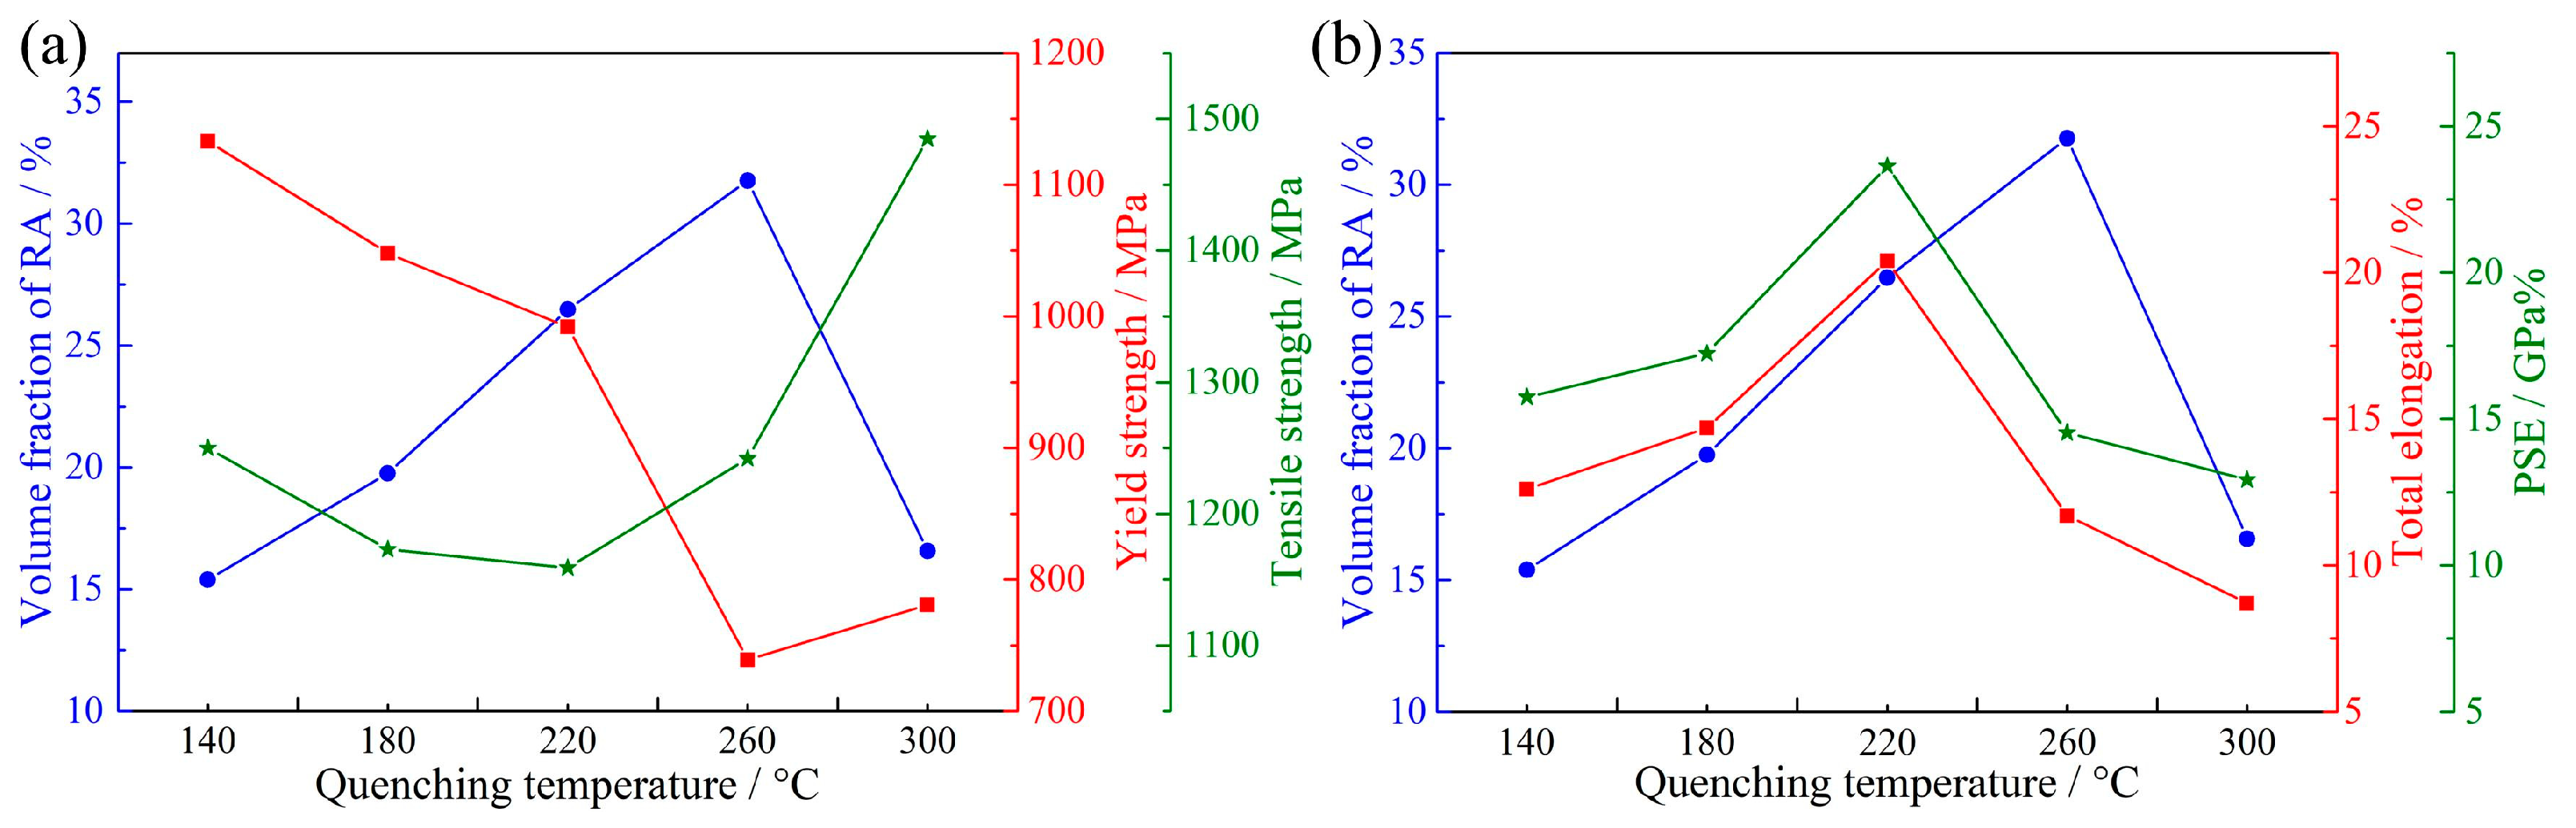
The mechanical property with YS of 992 MPa, TS of 1159 MPa, TE of 20.4% and PSE of 23.64 GPa% was obtained in the QP-processed sample at a quenching temperature of 220 °C. Compared with the strip-cast medium-Mn steel processed by the IA process, the QP-processed sample had higher YS but lower TE than the IA-processed sample under the condition of similar TS.
(4)
The mechanical properties of QP-processed samples were related to the RA fraction, mechanical stability of RA and the presence of secondary martensite (or M2/RA island). The superior mechanical properties of Q220 steel were achieved by an optimum combination of high RA fraction (26.5 vol%), the appropriate mechanical stability of RA and a small number of M2/RA islands.

Author Contributions

C.Y. participated in the research and analyzed the data. H.W. conceived of the study, designed the study, performed the research and wrote the paper. Y.Z. performed the TRSC experiment. Y.L. analyzed the data. J.K. developed the idea for the study and collected the data. Z.C. reviewed the paper. All authors have read and agreed to the published version of the manuscript.

Funding

This research was funded by the Open Fund Project of State Key Laboratory of Vanadium and Titanium Resources Comprehensive Utilization (2021P4FZG07A).

Data Availability Statement

Data presented in this article are available at request from the corresponding author.

Acknowledgments

The authors acknowledge support from the Open Fund Project of State Key Laboratory of Vanadium and Titanium Resources Comprehensive Utilization (2021P4FZG07A).

Conflicts of Interest

The authors declare no conflict of interest.

References

  1. Zou, Y.; Ding, H.; Tang, Z. Effect of carbon content on deformation behavior and partitioning of manganese in medium-Mn steels. Metals 2021, 11, 667. [Google Scholar] [CrossRef]
  2. Ma, L.; Tang, Z.; You, Z.; Guan, G.; Ding, H.; Misra, D. Microstructure, mechanical properties and deformation behavior of Fe-28.7Mn-10.2Al-1.06C high specific strength steel. Metals 2022, 12, 602. [Google Scholar] [CrossRef]
  3. Yi, H.L.; Sun, L.; Xiong, X.C. Challenges in the formability of the next generation of automotive steel sheets. Mater. Sci. Technol. 2018, 34, 1112–1117. [Google Scholar] [CrossRef]
  4. Xu, Z.; Li, J.; Shen, X.; Allam, T.; Richter, S.; Song, W.; Bleck, W. Tailoring the austenite fraction of a Cu and Ni containing medium-Mn steel via warm rolling. Metals 2021, 11, 1888. [Google Scholar] [CrossRef]
  5. Suh, D.W.; Kim, S.J. Medium Mn transformation-induced plasticity steels: Recent progress and challenges. Scripta Mater. 2017, 126, 63–67. [Google Scholar] [CrossRef]
  6. Lee, Y.K.; Han, J. Current opinion in medium manganese steel. Mater. Sci. Technol. 2015, 31, 843–856. [Google Scholar] [CrossRef]
  7. Rana, R. Special issue on ‘Medium manganese steels’. Mater. Sci. Technol. 2019, 35, 2039–2044. [Google Scholar] [CrossRef]
  8. Hu, B.; Luo, H.; Yang, F.; Dong, H. Recent progress in medium-Mn steels made with new designing strategies, a review. J. Mater. Sci. Technol. 2017, 33, 1457–1464. [Google Scholar] [CrossRef]
  9. Wang, H.S.; Yuan, G.; Lan, M.F.; Kang, J.; Zhang, Y.X.; Cao, G.M.; Misra, R.D.K.; Wang, G.D. Microstructure and mechanical properties of a novel hot-rolled 4% Mn steel processed by intercritical annealing. J. Mater. Sci. 2018, 53, 12570–12582. [Google Scholar] [CrossRef]
  10. Suh, D.W.; Ryu, J.H.; Joo, M.S.; Yang, H.S.; Lee, K.; Bhadeshia, H.K.D.H. Medium-alloy manganese-rich transformation-induced plasticity steels. Metall. Mater. Trans. A 2013, 44, 286–293. [Google Scholar] [CrossRef]
  11. Cao, W.Q.; Wang, C.; Shi, J.; Wang, M.Q.; Hui, W.J.; Dong, H. Microstructure and mechanical properties of Fe–0.2C–5Mn steel processed by ART-annealing. Mater. Sci. Eng. A 2011, 528, 6661–6666. [Google Scholar] [CrossRef]
  12. Arlazarov, A.; Gouné, M.; Bouaziz, O.; Hazotte, A.; Petitgand, G.; Barges, P. Evolution of microstructure and mechanical properties of medium Mn steels during double annealing. Mater. Sci. Eng. A 2012, 542, 31–39. [Google Scholar] [CrossRef]
  13. Hu, Z.P.; Xu, Y.B.; Tan, X.D.; Peng, F.; Gu, X.L.; Zou, Y.; Yu, S.C. Effect of rapid heating on a cold-rolled Mn–Al transformation-induced plasticity steel with coarse delta-ferrite. Sci. Adv. Mater. 2017, 9, 1953–1959. [Google Scholar] [CrossRef]
  14. Han, J.; Lee, Y.K. The effects of the heating rate on the reverse transformation mechanism and the phase stability of reverted austenite in medium Mn steels. Acta Mater. 2014, 67, 354–361. [Google Scholar] [CrossRef]
  15. Furukawa, T.; Huang, H.; Matsumura, O. Effects of carbon content on mechanical properties of 5%Mn steels exhibiting transformation induced plasticity. Mater. Sci. Technol. 1994, 10, 964–970. [Google Scholar] [CrossRef]
  16. Seo, E.J.; Cho, L.; De Cooman, B.C. Application of quenching and partitioning processing to medium Mn steel. Metall. Mater. Trans. A 2015, 46, 27–31. [Google Scholar] [CrossRef]
  17. Zhao, Z.Z.; Liang, J.H.; Zhao, A.M.; Liang, J.T.; Tang, D.; Gao, Y.P. Effects of the austenitizing temperature on the mechanical properties of cold-rolled medium-Mn steel system. J. Alloy Compd. 2017, 691, 51–59. [Google Scholar] [CrossRef]
  18. De Moor, E.; Speer, J.G.; Matlock, D.K.; Kwak, J.H.; Lee, S.B. Quenching and partitioning of CMnSi steels containing elevated manganese levels. Steel Res. Int. 2012, 83, 322–327. [Google Scholar] [CrossRef]
  19. Cai, M.H.; Huang, H.S.; Pan, H.J.; Sun, S.H.; Ding, H.; Hodgson, P. Microstructure and tensile properties of a Nb–Mo microalloyed 6.5Mn alloy processed by intercritical annealing and quenching and partitioning. Acta Metall. Sin. 2017, 30, 665–674. [Google Scholar] [CrossRef]
  20. Wang, H.; Zhang, Y.; Ran, R.; Wang, Y.; Kang, J.; Li, Y.; Misra, R.D.K.; Wang, G. A medium-Mn steel processed by novel twin-roll strip casting route. Mater. Sci. Technol. 2019, 35, 1227–1238. [Google Scholar] [CrossRef]
  21. Sugimoto, K.I.; Usui, N.; Kobayashi, M.; Hashimoto, S.I. Effects of volume fraction and stability of retained austenite on ductility of TRIP-aided dual-phase steels. ISIJ Int. 1992, 32, 1311–1318. [Google Scholar] [CrossRef]
  22. van Dijk, N.H.; Butt, A.M.; Zhao, L.; Sietsma, J.; Offerman, S.E.; Wright, J.P.; van der Zwaag, S. Thermal stability of retained austenite in TRIP steels studied by synchrotron X-ray diffraction during cooling. Acta Mater. 2005, 53, 5439–5447. [Google Scholar] [CrossRef]
  23. Speer, J.G.; Rizzo Assunção, F.C.; Matlock, D.K.; Edmonds, D.V. The “quenching and partitioning” process: Background and recent progress. Mater. Res. 2005, 8, 417–423. [Google Scholar] [CrossRef]
  24. Edmonds, D.V.; He, K.; Rizzo, F.C.; De Cooman, B.C.; Matlock, D.K.; Speer, J.G. Quenching and partitioning martensite—A novel steel heat treatment. Mater. Sci. Eng. A 2006, 438–440, 25–34. [Google Scholar] [CrossRef]
  25. Speer, J.; Matlock, D.K.; De Cooman, B.C.; Schroth, J.G. Carbon partitioning into austenite after martensite transformation. Acta Mater. 2003, 51, 2611–2622. [Google Scholar] [CrossRef]
  26. Koistinen, D.P.; Marburger, R.E. A general equation prescribing the extent of the austenite-martensite transformation in pure iron-carbon alloys and plain carbon steels. Acta Metall. 1959, 7, 59–60. [Google Scholar] [CrossRef]
  27. Seo, E.J.; Cho, L.; Estrin, Y.; De Cooman, B.C. Microstructure-mechanical properties relationships for quenching and partitioning (Q&P) processed steel. Acta Mater. 2016, 113, 124–139. [Google Scholar]
  28. Sohn, S.S.; Lee, B.J.; Lee, S.; Kim, N.J.; Kwak, J.H. Effect of annealing temperature on microstructural modification and tensile properties in 0.35 C-3.5 Mn-5.8 Al lightweight steel. Acta Mater. 2013, 61, 5050–5066. [Google Scholar] [CrossRef]
  29. Wang, H.S.; Yuan, G.; Zhang, Y.X.; Cao, G.M.; Li, C.G.; Kang, J.; Misra, R.D.K.; Wang, G.D. Microstructural evolution and mechanical properties of duplex TRIP steel produced by strip casting. Mater. Sci. Eng. A 2017, 692, 43–52. [Google Scholar] [CrossRef]
  30. Qi, X.; Du, L.; Hu, J.; Misra, R.D.K. Effect of austenite stability on toughness, ductility, and work-hardening of medium-Mn steel. Mater. Sci. Technol. 2019, 35, 2134–2142. [Google Scholar] [CrossRef]
  31. Li, X.; Song, R.; Zhou, N.; Li, J. An ultrahigh strength and enhanced ductility cold-rolled medium-Mn steel treated by intercritical annealing. Scripta Mater. 2018, 154, 30–33. [Google Scholar] [CrossRef]
  32. Xiong, Z.P.; Saleh, A.A.; Marceau, R.K.W.; Taylor, A.S.; Stanford, N.E.; Kostryzhev, A.G.; Pereloma, E.V. Site-specific atomic-scale characterisation of retained austenite in a strip cast TRIP steel. Acta Mater. 2017, 134, 1–15. [Google Scholar] [CrossRef]
  33. Cai, Z.H.; Ding, H.; Misra, R.D.K.; Ying, Z.Y. Austenite stability and deformation behavior in a cold-rolled transformation-induced plasticity steel with medium manganese content. Acta Mater. 2015, 84, 229–236. [Google Scholar] [CrossRef]
  34. Hu, J.; Li, X.; Meng, Q.; Wang, L.; Li, Y.; Xu, W. Tailoring retained austenite and mechanical property improvement in Al-Si-V containing medium Mn steel via direct intercritical rolling. Mater. Sci. Eng. A 2022, 855, 143904. [Google Scholar] [CrossRef]
  35. Kang, J.; Li, Y.J.; Wang, X.H.; Wang, H.S.; Yuan, G.; Misra, R.D.K.; Wang, G.D. Design of a low density Fe-Mn-Al-C steel with high strength-high ductility combination involving TRIP effect and dynamic carbon partitioning. Mater. Sci. Eng. A 2019, 742, 464–477. [Google Scholar] [CrossRef]
  36. Hu, J.; Du, L.X.; Dong, Y.; Meng, Q.W.; Misra, R.D.K. Effect of Ti variation on microstructure evolution and mechanical properties of low carbon medium Mn heavy plate steel. Mater. Charact. 2019, 152, 21–35. [Google Scholar] [CrossRef]
  37. Li, J.; Xu, Y.; Lu, B.; Yu, Y.; Jing, Y.; Sun, W. Improvement of strength-ductility combination in ultra-high-strength medium-Mn Q&P steel by tailoring the characteristics of martensite/retained austenite constituents. J. Mater. Res. Technol. 2022, 18, 352–369. [Google Scholar]
  38. De Knijf, D.; Petrov, R.; Föjer, C.; Kestens, L.A.I. Effect of fresh martensite on the stability of retained austenite in quenching and partitioning steel. Mater. Sci. Eng. A 2014, 615, 107–115. [Google Scholar] [CrossRef]
Figure 1. Schematic diagram of the detailed QP process for dilatometry study.
Metals 13 01772 g001
Figure 2. Secondary electron images of the samples under different austenitizing conditions, quenched from (a) 800 °C, (b) 850 °C, (c) 900 °C and (d) 950 °C.
Metals 13 01772 g002
Figure 3. Predicted phase fractions after QP process based on CCE model. M1 is primary martensite, M2 is secondary martensite and γ 1 is initial austenite.
Metals 13 01772 g003
Figure 4. Dilatometric curves of QP-processed samples subjected to quenching temperatures of (a) 140 °C, (b) 180 °C, (c) 220 °C, (d) 260 °C and (e) 300 °C. TQ is quenching temperature, TP is partitioning temperature and Mʹs is secondary martensite start temperature.
Metals 13 01772 g004
Figure 5. Secondary electron images of (a) Q140, (b) Q180, (c) Q220, (d) Q260 and (e,f) Q300 steels.
Metals 13 01772 g005
Figure 6. EBSD phase maps of (a) Q140, (b) Q220, (c) Q260 and (d) Q300 steels. Phases in red correspond to RA.
Metals 13 01772 g006
Figure 7. TEM micrographs of Q220 steel: (a) lath RA bright field, (b) lath RA dark field, (c) SAED pattern of RA in (a), (d) blocky RA bright field, (e) blocky RA dark field and (f) SAED pattern of RA in (d). SAED is selected area electron diffraction.
Metals 13 01772 g007
Figure 8. (a) XRD patterns of QP-processed samples subjected to different quenching temperatures and (b) the corresponding volume fraction of RA calculated by XRD result.
Metals 13 01772 g008
Figure 9. Carbon content of RA in QP-processed samples subjected to different quenching temperatures.
Metals 13 01772 g009
Figure 10. Engineering stress–strain plots of QP-processed samples.
Metals 13 01772 g010
Figure 11. (a) XRD patterns of fractured samples, (b) comparison of the volume fraction of RA in the undeformed and fractured samples and (c) transformation ratio of RA in the QP-processed samples subjected to different quenching temperatures.
Metals 13 01772 g011
Figure 12. (a) Variation of RA fraction, YS and TS and (b) variation of RA fraction, TE and PSE.
Metals 13 01772 g012
Table 1. Mechanical properties of QP-processed samples and IA-processed samples.
SampleYS/MPaTS/MPaTE/%PSE/GPa%
Q1401133125012.615.75
Q1801048117314.717.24
Q220992115920.423.64
Q260739124211.714.53
Q30078114858.712.92
IA at 725 °C for 30 min [20]60911263337.16
IA at 740 °C for 30 min [20]361123123.228.56
Disclaimer/Publisher’s Note: The statements, opinions and data contained in all publications are solely those of the individual author(s) and contributor(s) and not of MDPI and/or the editor(s). MDPI and/or the editor(s) disclaim responsibility for any injury to people or property resulting from any ideas, methods, instructions or products referred to in the content.

