
Local Plastic Deformation and Quality of Cu-Cu Joints Obtained by Ultrasonic Welding
by
 , ,
, ,
Mariya A. Murzinova
,
Elvina R. Shayakhmetova
*,
Aygul A. Mukhametgalina
,
Aygul A. Sarkeeva
and
Ayrat A. Nazarov
* Institute for Metals Superplasticity Problems, Russian Academy of Sciences, 39 Khalturin St., Ufa 450001, Russia
*
Authors to whom correspondence should be addressed.
Metals 2023, 13(10), 1661; https://doi.org/10.3390/met13101661
Submission received: 9 August 2023
/
Revised: 18 September 2023
/
Accepted: 26 September 2023
/
Published: 28 September 2023
(This article belongs to the Special Issue Ultrasonic Welding: Joining of Metals and Multi-Material Structures by Power Ultrasonics)
Abstract
:Joints of copper sheets with a thickness of 0.8 mm were produced by ultrasonic welding. To assess the quality of the joints, tensile lap-shear strength, area fraction of bonding, distributions of normal strains in the cross sections of welded samples, linear weld density at a magnification of ×1000, and the microstructure and microhardness of welded samples were analyzed. It was proved that the arrangement of microbonds and length of gaps in joint zones significantly depended on the local normal strains of welded samples caused by the penetration of tool ridges under the clamping pressure. Joint regions with a linear weld density of more than 70% were observed if the local compression strains of the sample exceeded 15%. The appearance of local tensile strains was accompanied by a drop in the linear weld density of the joints in some regions, down to 5%. The distribution of normal strains depends on the mutual positions of the ridges of the welding tip and anvil. It is concluded that in order to improve the quality of joints obtained by ultrasonic welding and reduce the scatter of their strength values, welding tools should provide sufficiently high normal compression strains in the weld spot area.
1. Introduction
Ultrasonic welding (USW) is one of the methods of solid-phase joining thin workpieces from metal sheets, foils, and wires. During welding, the energy of high-frequency vibrations is spent on the relative motion of parts clamped to each other by a normal force, friction work, heat generation, and high-strain rate shear deformation concentrated mainly near the contacting surfaces [1,2]. USW is an environmentally friendly, energy-saving technology that allows the joining of similar and dissimilar metals and alloys. Accordingly, equipment for USW is continuously improved, and mechanisms and optimal conditions of joint formation are intensively studied. The results achieved in these studies and unresolved problems are considered, for example, in reviews [3,4,5,6,7].
In recent reviews [3,4,5,6], the authors highlighted the necessity of developing methods for online monitoring of welding parameters as well as uniform standards for the quality control of welded joints as one of the most important tasks. Usually, the quality of USW-processed joints is determined by destructive mechanical tests such as T-peel, U-tensile, and lap-shear tests. The latter is the simplest and most commonly used method. In order to optimize welding conditions, numerous attempts are made to establish the relationships between the process parameters (amplitude, compression (clamping) force, welding time, etc.) and the actual weld area (AWA) [8,9,10,11,12], linear weld density (LWD), and the average thickness of the top material after welding [8,13], since both the electrical conductivity and mechanical properties of joints depend on these characteristics [2,8].
However, the measurements of LWD and AWA in different studies are carried out at different magnifications of a microscope using different image processing techniques for fracture surfaces, which significantly complicates the comparison of published results. To compare the strength of joints, the maximum failure load divided by the area of the welding tip (but not by AWA) is estimated in most cases [3,4,6]. This approach is acceptable if the joint failure occurs along a weld interface. If the pull-out failure occurs, the failure load depends not only on the initial thickness of the sheets but also on the sheet thinning along the perimeter of the weld nugget. There is no consensus on what proportion of the shear or tensile strength of the base material should possess high-quality joints. According to Ref. [9], the joint can be considered a high-quality one “…if the shear strength of the interface is equal that of the parent metal”. Such high-quality joints were obtained, for example, by welding 0.5 mm thick titanium sheets [14], 2 mm thick aluminum alloy 5754-O sheets [15], and 0.8 mm thick copper sheets [16].
Most frequently, ultrasonically welded samples exhibit a shear strength that is less than 50% of the shear strength of the parent metal, and its values show a large scatter [1,3,4,6,17,18,19,20]. In addition, as Muller et al. [17] noted, the USW process “is prone to a large number of disturbances, leading to fluctuating joint quality without apparent change of boundary conditions”.
The instability in joint quality can be explained by the multiparameter nature of the USW process. The quality of joints, on the one hand, depends on the power and stability of welding equipment, the design of a tool (including the reliefs of the welding tip and anvil and their wear resistance), vibration amplitude, static pressure (or clamping force), welding time, etc. On the other hand, the quality of joints is affected by the properties of the materials to be welded, such as thermal conductivity, heat capacity, strength, and ductility at room and elevated temperatures, as well as the thickness of the sheets, contamination, and surface roughness, etc. Therefore, USW parameters are determined experimentally. Based on the data obtained, numerous attempts have been made to optimize the USW parameters [3,9,17,18,19,20] so that the temperature and deformation at the interface required for the formation of a metallic bond are achieved in a short time, and a joint with high strength is obtained.
To improve the joint quality and optimize welding conditions, the clamping force and welding time (or energy) are most often varied. An increase in both of these parameters to optimum values leads to an increase in the strength of joints [1,2,3,4,5,6]. However, long-term USW under the action of a large clamping force leads to excessive penetration of the ridges of the tip and anvil into the sheets to be joined and their thinning [8,9,10,11,12,13,20,21,22,23]. In such cases, the failure of joints occurs by the pull-out mode taking place in the thinnest, “weakest” section of a sheet under stress, which is less than the actual strength of the joint. Therefore, the ridge penetration depth or vertical (i.e., normal to the interface) displacement of a sonotrode, as well as the amplitude of oscillations, clamping force (or normal pressure), welding time, and temperature in the contact zone, are often controlled [2,11,23,24,25,26,27,28].
It has been experimentally shown that under an action of constant normal pressure, the vertical displacement rate of a sonotrode changes non-monotonically. Such non-monotonicity was explained by an increase in the contact area of a tool with the workpieces under welding, strain hardening of the metal of sheets at the initial stage of USW, subsequent heating of sheets, mainly at the interface, and the subsequent development of recrystallization accompanied by softening. The authors of Refs. [2,24] concluded that the shape of a displacement-time curve could reflect the joint quality since there was a relationship between this shape and the change in temperature and strain during USW.
It is well known that the distribution of normal and shear strains in welded samples is inhomogeneous. This inhomogeneity is clearly illustrated by images of the macro- and microstructure of samples obtained by USW [13,24,28,29,30,31,32], inhomogeneous change in the microhardness along and across the section of welded samples [13,23,33], and numerous simulation results, e.g., [23,26,34]. An inhomogeneous distribution of normal and shear strains resulted in a complex shape of joint lines and did not allow Lee et al. [13] to quantify the LWD for ultrasonically welded joints of copper and nickel-plated copper using optical images. Nevertheless, qualitative estimation of the relative bond density along with measurements of the post-weld thickness and microhardness allowed them to identify a qualitative relationship between these weld attributes, the formation of joints over time, and the strength of the joints.
In this study, we applied the methodology of Ref. [13] for a comprehensive characterization of the quality of ultrasonically welded joints of copper sheets. The fracture surfaces and the structure of joints were examined at microscope magnifications from ×20 up to ×10,000, and quantitative data on the area fraction of bonding and LWD were obtained. The distribution of local normal strains of joint samples was studied, and the relationships between the lap shear strength of the joints, area fraction of bonding, local sample strains, and linear weld density were determined. The effect of the relative position of the anvil and tip ridges on the joint quality and instability of the mechanical properties of joints (i.e., scatter in their values) was revealed.
2. Materials and Methods
Sheets of commercially pure copper grade M1 (99.90% Cu according to GOST 1173-2006) having a thickness of 0.8 mm and Vickers hardness of 850 ± 60 MPa were used for the welding experiments. Specimens in the shape of plates with 50 mm length and 20 mm width were cut from the sheets. The long sides of the plates were parallel to the sheet-rolling direction. The surfaces of the plates were ground with P240 sandpaper at an angle of 45° to the rolling direction and washed with alcohol. The overlap of plates during USW was 20 mm. USW was carried out by using the experimental ultrasonic welding equipment described in detail in our previous work [35]. An anvil and a welding tip with a serrated surface (Figure 1) were used; the welding spot area was 5.5 mm × 5.5 mm. The vibration frequency and amplitude were equal to 20 kHz and 17–20 μm, respectively. The vibrations were perpendicular to the rolling direction of the sheet. During welding experiments, the clamping force (P) was varied from 2.5 to 3.5 kN (the corresponding normal pressure was changed from 83 to 117 MPa), and the welding time (τ) ranged from 1 to 3 s. These intervals were chosen based on the results of preliminary testing of probe samples welded at different values of P and τ. At each combination of P and τ, 5 to 7 samples were produced, some of which were used for mechanical tests and the rest for structural studies.
The structure of welded samples was examined in a cross-section plane passing through the centers of welding spots parallel to the direction of vibrations. Metallographic samples were mechanically ground with SiC sandpaper and then polished with a suspension of colloidal silicon O.P.S.-MET-DRY with a grain size of 0.05 µm. The microstructures of joints and fracture surfaces were examined using a TESCAN MIRA 3 LMH FEG scanning electron microscope (TESCAN ORSAY HOLDING a.s., Brno-Kochutovice, Czech Republic) equipped with a CHANNEL 5 electron backscattering (EBSD) analyzer (Oxford Instruments HKL, Oxford, UK). The EBSD analysis was carried out in accordance with the recommendations of Humphreys et al. [36,37].
The ITV-1AM microhardness tester (“Metrotest”, Neftekamsk, Russia) was used to measure the Vickers microhardness of the joints under a load force of 0.098 H (10 gf) with a pressure holding time of 10 s. The average value of microhardness was determined from the results of at least six measurements. The standard deviation was taken as the value of the statistical error.
To evaluate the quality of joints produced by USW, the following characteristics were determined:
- Fracture load of welded samples;
- Area fraction of bonding or percentage of the fracture surface occupied by microbonds;
- Relative length of well-bonded (defect-free), un-bonded, and partially bonded regions;
- Distribution of normal strains in the cross sections of welded samples.
To determine the fracture load of welded samples, tensile lap-shear tests were performed in accordance with the recommendations of standard BS EN 1465:2009 [38]. The tests were carried out on an Instron 5982 universal testing machine (Instron Corp., Grove City, PA, USA) at a constant crosshead speed of 1 mm/min. The peak value of the load during these tests was taken as the lap shear failure load. At least three samples obtained under the same conditions as USW were tested. The standard deviation was taken as the value of the statistical error. The shear strength of joints was calculated as a ratio of the lap shear failure load to the area of the welding tip.
The area fraction of bonding Ab (%) was estimated by means of the manual point-count grid technique [39] as Ab (%) = 100 × Nb/NT, where Nb is the number of grid points that fall in a region of the fracture surface with a developed dimple relief indicating microbonds (cyan points in Figure 2a), and NT is the total number of test points (red and cyan points in Figure 2a). A point-count grid with a grid spacing of 50 μm was superimposed over each image of the fracture surface. Nine images located at an equal distance of 2 mm from each other were taken from each fracture surface using secondary electron (SE) detection at a microscope magnification of ×200. This made it possible to analyze 28% of the fracture surface in each case.
The relative length of well-bonded regions, i.e., linear weld density of joints, LWD (%), was determined as LWD (%) = 100 × Lb/L, where L is the total length of a joint region under analysis and Lb is the length of a bonded region [12,13,40]. Similarly, the relative length of un-bonded regions, or relative length of gaps, RLG (%), was defined as RLG (%) = 100 × Lg/L, [41,42], where Lg is the length of gaps (Figure 2b). Regions containing pores with sizes smaller than 1 µm were considered to be partially bonded.
To evaluate LWD and RLG, six images per joint located under the indents of ridges and valleys of the welding tip were obtained (Figure 3). For this, back scattered electron (BSE) imaging at a magnification of 1000× was used. In this way, approximately 20% of the whole length of a joint was analyzed in each case. The measurements were carried out using ImageJ 1.53q image analysis software [43], which provides additional image magnification. This made it possible to account for the presence of microvoids in the junction zone with sizes above 0.5 μm.
To explore the relationship between LWD, RLG, and the value of strain caused by a normal compressive pressure, the sample section thickness, hi, was measured at each point “i” where the microstructure was photographed (Figure 3). Additionally, the smallest and largest thicknesses of the sample section in the nearest neighborhood of a point “i” were measured if they were different than hi. The value of normal strain in the cross-section of a welded sample was determined as eni (%) = 100 × (hi − h0)/h0, where h0 is twice the thickness of the initial sheet. The lengths of segments hi were measured using the ImageJ software, and SE images of the cross sections of the samples were taken at a microscope magnification of 20×.
3. Results
3.1. Lap Shear Strength and Fracture of Joints
The results of lap shear tests of welded samples obtained with various combinations of the values of P and τ are presented in Figure 4 and Table 1. A distinctive feature of these data is their wide scatter. In some series of tests, the coefficient of variation of the failure load exceeded 15% (Table 1). The lowest strength, about 1500 N (50 MPa), was exhibited by samples processed for 1 and 1.5 s. With increasing welding time, there was a tendency toward increasing strength. For example, fracture loads above 2000 N (66 MPa) were demonstrated by some samples processed with the following combinations of welding parameters: P = 2.5 kN and τ = 2.5–3 s, P = 3 kN and τ = 2.25 s, and most of the samples processed at P = 3.5 kN and τ = 1.75–2.75 s (Figure 4). The highest average failure loads of 2193 ± 60 N with the lowest coefficient of variation of their values were demonstrated by samples welded with a clamping force of 3.5 kN for 1.75 s (Figure 4).
Regardless of the chosen value of clamping force, the samples welded for 1 to 2.5 s failed along the weld joint interface. After ultrasonic welding for 2.75 and 3 s, the samples demonstrated a failure of completely pull-out or mixed types. Three main types of relief were observed on the fracture surfaces: areas with a developed dimple-like relief (indicated by the letter “A” in Figure 5a); areas with traces of shear deformation parallel to the vibration direction (indicated by letter the “B” in Figure 5a); and areas with traces of grinding with sandpaper (indicated by letter “C” in Figure 5a). The sizes of areas with a dimple-like relief varied over a very wide range from 20 to 400 µm in the vibration direction and from 20 to 250 µm in the perpendicular direction. In most cases, the areas with dimple-like relief were concentrated in bands that replicated the ridges of the welding tip (Figure 5b). A relatively uniform arrangement of microbonds (Figure 5c) was observed on the fracture surfaces of specimens with lower strength. It was not possible to establish a clear correlation between the welding parameters, the area fraction of bonding Ab (%), and the values of the fracture load and energy. Often, microbonds occupied more than 70% of the area of fracture surfaces for samples that exhibited relatively low values of the failure load and fracture energy, whereas for stronger samples, Ab (%) was in the range of 40 to 60%.
As an example, Figure 6a presents the displacement-load curves recorded during testing of two samples numbered as #1 and #2, which had been welded using the same combination of parameters: P = 3 kN, τ = 2.5 s. As can be seen from the figure, the fracture load and energy of these samples differ significantly. On the fracture surface of the weaker sample #1, the microbonds occupy a larger area, Ab = 68 ± 5% (Figure 6b), as compared with that for the stronger sample #2, for which Ab = 51 ± 8% (Figure 6c). Probably, the joint strength is affected not only by the area occupied by microbonds but also by their ability to resist the shear load.
3.2. Macro- and Microstructure
Typical images of cross-sections of samples obtained by welding with various combinations of welding parameters are presented in Figure 7. At any value of the clamping force, an increase in the welding time from 1 to 3 s led to an increase in the depth of penetration of the ridges of the tool into the sheets to be joined on average from 0.15 to 0.35 mm (Figure 8). The penetration of ridges was the largest in the middle of the weld spot and decreased towards its periphery (Figure 7). The maximum penetration depths of tool ridges did not exceed their height, which was equal to 0.4 mm (Figure 1); therefore, no complete filling of the valleys was observed in any of the cases studied.
The penetration of tool ridges into the sheets was accompanied by the flow of metal into the valleys of the welding tip and anvil. Therefore, the thickness of welded samples, and hence, their deformation in the direction normal to the joint surface (hereinafter referred to as normal strain and denoted as en), changed periodically. Depending on the relative position of the ridges of the welding tip and anvil, the normal strain changed not only in its absolute value but also in sign.
Compressive (negative) normal strains of samples along the entire joint line occurred only if the ridges of the welding tip were located directly above the valleys of the anvil. The absolute values of the compression strain were about 10% under the imprints of the ridges of the welding tip, and in the same segments of the joint, the LWD was the highest and amounted to 35–50% (Figure 9a). Under valleys of the welding tip, compression strains were about 5% and the LWD was 20–30%. Images of joint structure in regions with the highest and lowest LWD are shown in Figure 9b,c, respectively. On fracture surfaces of samples with such a relative position of tool ridges, the microbonds occupied a significant area, Ab = 65–75%, and were arranged relatively uniformly, as illustrated in Figure 5c and Figure 6b (to verify this, the counterpart half of the sample was peeled off by hand using a clamp and pliers).
If the ridges of the welding tip were located directly above those of the anvil, the local strain en changed from 15–20% compression under the indents of tool ridges to 8–17% tension under the valleys (Figure 10a).
In most cases, the LWD in the regions of compression and tension was about 65 and 25%, respectively. In some segments of the joint, however, the LWD reached 85% in compression zones and dropped to 5% in tension ones. Compressive strains reached the highest values under the indentations of the tool ridges, tensile strains were highest under tool valleys, and the sizes of the tensile and compression zones were similar. In this case, the microbonds were localized in bands, between which unbonded zones with traces of preliminary grinding of the plates were clearly visible (Figure 5b and Figure 6c). The images of the structure (Figure 10b,c) illustrate a high quality of the joint in the compression region “A” and almost no bonding in the region of tension “B”.
If the ridges of the welding tip were located in intermediate positions between the ridges and valleys of the anvil, normal strains en measured under the indentations of the ridges and valleys of the welding tip varied from –15 to +6% (see the blue curve and filled blue squares in Figure 11a). LWD values often exceeded 75% in the compression regions but decreased to 6% in the tension regions of the sample. Unlike the previous case, the largest compressive (–21%) and tensile (+12%) strains occurred in regions intermediate between the ridges and valleys (empty squares on the blue curve, Figure 11a), and the sizes of compression regions were larger than those of tension ones. The image of the joint structure in the tension region of the sample was similar to the one shown in Figure 10c and is not presented in Figure 11. In regions where compressive strains exceeded 15%, no voids were found at a magnification of 1000× (Figure 11b). At higher magnifications of the microscope, the size of the revealed defects was significantly less than 0.5 μm (Figure 11c).
In all BSE images of the microstructure obtained from the interface zone of welded sheets (Figure 9b,c, Figure 10b,c and Figure 11b,c), it is clearly seen that in this zone, refinement of initial grains occurred in both the bonded and unbonded regions.
Bonded and partially bonded regions of the joints were examined by EBSD analysis. The clean-up procedure of the maps (removal of non-indexed points) included three steps of iteration that eliminated the wrong indexing of voids in the joint zones. It can be seen that new equiaxed grains with sizes of 0.5–3 μm and internal misorientations of 2–5° were formed in the joint zone (Figure 12). Consequently, the formation of the joint was accompanied by the development of dynamic recrystallization, which is consistent with the conclusions of previously published works [7,24,44,45,46,47]. In adjacent areas, there are relatively large (10–20 μm) deformed grains elongated in the direction of metal flow. A developed substructure was formed in these grains, which is evidenced by numerous low-angle boundaries with misorientations of 2–15°, as shown by the white lines in Figure 12a.
In accordance with the theories of substructural [48] and grain-boundary strengthening [49,50], the formation of low-angle boundaries inside deformed grains in the bulks of sheets and grain refinement in the joint zone led to an increase in the microhardness in these areas by 5–15% and 30–40%, respectively, as compared with the initial sheet (Figure 13). A similar change in the microhardness of ultrasonically welded samples was observed, for example, in Refs. [44,51].
4. Discussion
The shear strength of joints of copper sheets with a thickness of 0.8 mm was processed by USW in this work using the combinations of welding parameters P = 2.5–3.5 kN and τ = 1.5–3 s varied in the range from 42 to 76 MPa (Figure 4). The values of the failure load detected vary considerably; the coefficient of variation of values of the failure load reached 15% (Table 1), and therefore it is difficult to recommend parameters of USW that would consistently provide an acceptable strength of the joints. It should be noted that the strength of the obtained joints was higher than most of the values given in the literature (Table 2) and was significantly lower only in comparison with the data reported by Yang et al. [16].
The analysis performed in the present work has proved that there is a relationship between the local weld density of joints and the normal strain of samples caused by a penetration of the tool during USW.
The use of a welding tip and an anvil with a relatively deep knurl relief (Figure 1) made it possible to avoid excessive thinning of the welded sheets even after a large welding time (2.75 s) under the action of a large clamping force (3.5 kN) (Figure 7). At the same time, the use of this type of tool caused a periodic change in the thickness of the welded samples and, consequently, a periodic change in the strain of samples en in the direction normal to the contact surface of the sheets.
With the selected USW parameters, the valleys between the tool ridges were not completely filled with metal (Figure 8), and the relative position of the tip and anvil ridges was not controlled (Figure 7). Therefore, in most cases, an alternation of compression and tension regions was observed in the cross-section of the welded samples.
It should be noted that the distribution of strains along the height of ultrasonically welded samples is very uneven. This unevenness occurs not only due to the penetration of tool ridges into the sheets under joining but is observed even when the welding tip and anvil have flat surfaces [57]. In the latter case, as demonstrated in [57], “the maximum plastic deformation area is located at the edge of the joint”, and compressive strains decrease towards the center of the joint and towards the sheet surfaces in contact with the tool. The presence of ridges on the surface of the welding tip and anvil leads to the appearance of compressive and tensile regions in welded samples. According to simulation results [23,26,34,58], the largest compressive and tensile deformations are experienced by layers of material in contact with the tool and the smallest ones at the contact interface of sheets. That is, the magnitude of a compressive or tensile strain eni of the sample significantly exceeds the corresponding strain at point “i” on the contact interface of sheets. For example, according to simulations reported in [26,58], compression strains in the surface layers of sheets in contact with a tool were 3 to 5 times higher than in a joint zone. Along the interface, the compressive strains changed periodically, while tensile strains were absent. Chen et al. [23] and Shen et al. [34] revealed that tensile plastic strains could remain near the surfaces to be joined, and they are located under the valleys of the welding tip.
The appearance of tension regions is most probable in the initial period of USW [30]. Thin layers of metal can be extruded into such tension regions [10], and approximately parallel extended double gaps can remain near the metal layers (Figure 14a). An increase in compression strains in combination with oscillating shear strains during welding leads to the healing of such defects; however, after the end of the welding process, small voids arranged in two rows are often observed (Figure 14b). At magnifications of the optical microscope, the LWD of such regions is close to 100%.
Local measurements of en and LWD revealed that joints with LWD of more than 70% were formed only in those regions where the compression strain of the sample exceeded 15%. When the compression strain was less than 10%, the LWD did not exceed 50%. The appearance of the local tensile strain of the sample had an extremely negative effect on the quality of joints, since in such tension regions, LWD did not exceed 25% and, in some cases, dropped to 5%.
The average value of LWD cannot correctly characterize the quality of a joint due to a large difference in LWD values in different regions of one and the same joint (Figure 9, Figure 10 and Figure 11). However, some correlation between the average LWD and the average joint strength exists. For example, if the joint strength was 60–70 MPa or about 45% of the shear strength of copper sheets, the average LWD was in the range of 42–48%. The area fraction of bonding is also not a reliable characteristic of the strength of joints. This can be explained by the fact that a developed dimple-like relief was formed during the fracture of both well-bonded and partially bonded regions, but the shear strength of partially bonded regions was lower.
To obtain joints with high strength, it is necessary to ensure not only an increase in the area fraction of bonding but also a sufficient compression strain at each interface point. Under the studied conditions of USW, the “sufficient” compression strain of samples was at least 15%. However, a change in the conditions of USW or the roughness of sheet surfaces and, consequently, the temperature of the interface will lead to a change in the value of the “sufficient” compression strain.
The necessary compression strains can be achieved when the metal of a sheet completely fills the valleys between tool ridges (i.e., the tool ridges penetrate to their full depth). This condition was realized in Ref. [16], and joints with a strength of 120–123 MPa (about 80% of the shear strength of copper sheets) were produced at weld energies of 1600–2400 J. Additional opportunities to achieve the required compression strains appear if the ridges of the welding tip are located directly above the anvil valleys. Moreover, the restricted (controlled) mutual arrangement (relative position) of the ridges and valleys of the welding tool will increase the stability of the properties of the ultrasonically welded joints.
5. Conclusions
In the present work, single overlap joints of copper sheets with a thickness of 0.8 mm were produced by ultrasonic welding. An experimental ultrasonic welder equipped with a tip and anvil with a serrated relief was used. The vibration frequency and amplitude were equal to 20 kHz and 17–20 μm, respectively. The clamping force varied from 2.5 to 3.5 kN, and the welding time ranged from 1 to 3 s. A comprehensive characterization of the quality of welded joints included tensile lap-shear tests, measurements of normal strains in the cross sections of welded samples, quantitative analysis of the area fraction of bonding, and the linear weld density at high microscope magnifications, which made it possible to take account for the presence of gaps with sizes of 0.5 μm and more.
- The main finding of the work is that the arrangement of microbonds and the sizes of gaps in joint zones significantly depend on the local strains of the sheets caused by the penetration of tool ridges under the clamping pressure. Joint regions with a linear weld density of more than 70% were observed if the compression strains of the sample exceeded 15%. Tensile strains led to significant degradation of the quality of local bonding; the linear weld density of the joints in certain regions decreased to 5% if the tensile strains of the sample were 5–10%.
- The local normal strains of the samples change periodically. Their values and distribution depend on the mutual positions of ridges of the welding tip and anvil. When the ridges of the welding tip were located directly above the valleys of the anvil, only compression strains of the samples with absolute values of 5–10% were observed. For any other relative arrangement of tool ridges, both the compressive and tensile strains were observed. Their absolute values reached 20 and 17%, respectively, when the ridges of the welding tip were located directly above the ridges of the anvil.
- Normal strains of samples affect the formation of microbonds and their ability to resist the shear load. In the experiments carried out many variants of strain distribution were detected. Therefore, no unambiguous relationship has been found between the shear strength of the joints and average values of the area fraction of bonding and linear weld density.
- It has been concluded that the monitoring of the relative position of the ridges of the welding tip and anvil, as well as the depth of their penetration, is necessary to improve the quality of joints obtained by ultrasonic welding and to reduce the scatter of their strength values.
Author Contributions
Conceptualization, A.A.N.; methodology, A.A.N., E.R.S. and M.A.M.; data collection, A.A.N., M.A.M., E.R.S., A.A.M. and A.A.S.; writing—original draft preparation, E.R.S. and M.A.M.; writing—review and editing, A.A.N.; visualization, E.R.S., A.A.M. and A.A.S.; supervision, A.A.N.; project administration, A.A.N. All authors have read and agreed to the published version of the manuscript.
Funding
This research was funded by the Russian Science Foundation, grant # 22-19-00617.
Data Availability Statement
Not applicable.
Acknowledgments
Electron microscopic studies and mechanical tests were carried out on the facilities of shared services center of IMSP RAS “Structural and Physical-Mechanical Studies of Materials”.
Conflicts of Interest
The authors declare no conflict of interest.
References
- Matheny, M.P.; Graff, K.F. Ultrasonic welding of metals. In Power Ultrasonics-Applications of High-Intensity Ultrasound; Gallego Juárez, J.A., Graff, K.F., Eds.; Woodhead: Cambridge, UK, 2015; pp. 259–293. [Google Scholar]
- Lee, S.S.; Shao, C.; Kim, T.H.; Hu, S.J.; Kannatey-Asibu, E.; Cai, W.W.; Spicer, J.P.; Abell, J.A. Characterization of Ultrasonic Metal Welding by Correlating Online Sensor Signals with Weld Attributes. J. Manuf. Sci. Eng. 2014, 136, 051019. [Google Scholar] [CrossRef]
- Cheng, X.M.; Yang, K.; Wanga, J.; Xiao, W.T.; Huang, S.S. Ultrasonic system and ultrasonic metal welding performance: A status review. J. Manuf. Process. 2022, 84, 1196–1216. [Google Scholar] [CrossRef]
- De Leon, M.; Shin, H.-S. Review of the advancements in aluminum and copper ultrasonic welding in electric vehicles and superconductor applications. J. Mater. Process. Technol. 2022, 307, 117691. [Google Scholar] [CrossRef]
- Ni, Z.L.; Yang, J.J.; Hao, Y.X.; Chen, L.F.; Li, S.; Wang, X.X.; Ye, F.X. Ultrasonic spot welding of aluminum to copper: A review. Int. J. Adv. Manuf. Technol. 2020, 107, 585–606. [Google Scholar] [CrossRef]
- Zhang, C.; Li, H.; Liu, Q.; Huang, C.; Zhou, K. Ultrasonic Welding of Aluminum to Steel: A Review. Metals 2023, 13, 29. [Google Scholar] [CrossRef]
- Sanga, B.; Wattal, R.; Nagesh, D.S. Mechanism of Joint Formation and Characteristics of Interface in Ultrasonic Welding: Literature review. Period. Eng. Nat. Sci. 2018, 6, 107–119. [Google Scholar] [CrossRef]
- Xi, L.; Banu, M.; Hu, S.J.; Cai, W.; Abell, J. Performance Prediction for Ultrasonically Welded Dissimilar Materials Joints. J. Manuf. Sci. Eng. 2017, 139, 011008. [Google Scholar] [CrossRef]
- Ward, A.A.; Zhang, Y.; Cordero, Z.C. Junction growth in ultrasonic spot welding and ultrasonic additive manufacturing. Acta Mater. 2018, 158, 393–406. [Google Scholar] [CrossRef]
- Sanga, B.; Wattal, R.; Nagesh, D.S. An FEA based study of thermal behaviour of ultrasonically welded phosphor bronze sheets. J. Mech. Eng. Sci. 2021, 15, 8057–8071. [Google Scholar] [CrossRef]
- Li, J.; Zillner, J.; Balle, F. In-Depth Evaluation of Ultrasonically Welded Al/Cu Joint: Plastic Deformation, Microstructural Evolution, and Correlation with Mechanical Properties. Materials 2023, 16, 3033. [Google Scholar] [CrossRef]
- Hopkins, C.D.; Wolcott, P.J.; Dapino, M.J.; Truog, A.G.; Babu, S.S.; Fernandez, S.A. Optimizing Uitrasonic Additive Manufactured Al 3003 Properties with Statisticai Modeiing. J. Eng. Mater. Technol. 2012, 134, 011004. [Google Scholar] [CrossRef]
- Lee, S.S.; Kim, T.H.; Hu, S.J.; Cai, W.W.; Li, J.; Abell, J.A. Characterization of Joint Quality in Ultrasonic Welding of Battery Tabs. J. Manuf. Sci. Eng. 2013, 135, 021004. [Google Scholar] [CrossRef]
- Mukhametgalina, A.A.; Murzinova, M.A.; Nazarov, A.A. Weld Quality and Microstructure Development in Ultrasonically Welded Titanium Joints. Metall. Mater. Trans. A 2022, 53, 1119–1131. [Google Scholar] [CrossRef]
- Zhang, C.Y.; Chen, D.L.; Luo, A.A. Joining 5754 automotive aluminum alloy 2-mm-thick sheets using ultrasonic spot welding. Weld. J. 2014, 93, 131–138. [Google Scholar]
- Yang, J.; Cao, B.; Lu, Q. The Effect of Welding Energy on the Microstructural and Mechanical Properties of Ultrasonic-Welded Copper Joints. Materials 2017, 10, 193. [Google Scholar] [CrossRef]
- Müller, F.W.; Schiebahn, A.; Reisgen, U. Quality prediction of disturbed ultrasonic metal welds. J. Adv. Join. Process. 2022, 5, 100086. [Google Scholar] [CrossRef]
- Satpathy, M.P.; Moharana, B.R.; Dewangan, S.; Sahoo, S.K. Modeling and optimization of ultrasonic metal welding on dissimilar sheets using fuzzy based genetic algorithm approach. Eng. Sci. Technol. Int. J. 2015, 18, 634–647. [Google Scholar] [CrossRef]
- Müller, F.W.; Chen, C.Y.; Schiebahn, A.; Reisgen, U. Application of electrical power measurements for process monitoring in ultrasonic metal welding. Weld World 2023, 67, 395–415. [Google Scholar] [CrossRef]
- Faes, K.; Nunes, R.; De Meester, S.; De Waele, W.; Rubino, F.; Carlone, P. Influence of the Process Parameters on the Properties of Cu-Cu Ultrasonic Welds. J. Manuf. Mater. Process. 2023, 7, 19. [Google Scholar] [CrossRef]
- De Leon, M.; Shin, H.-S. Weldability assessment of Mg alloy (AZ31B) sheets by an ultrasonic spot welding method. J. Mater. Process. Technol. 2017, 243, 1–8. [Google Scholar] [CrossRef]
- Peng, H.; Chen, D.; Jiang, X. Microstructure and Mechanical Properties of an Ultrasonic Spot Welded Aluminum Alloy: The Effect of Welding Energy. Materials 2017, 10, 449. [Google Scholar] [CrossRef] [PubMed]
- Chen, K.K.; Zhang, Y.S.; Wang, H.Z. Study of plastic deformation and interface friction process for ultrasonic welding. Sci. Technol. Weld. Join. 2016, 22, 208–216. [Google Scholar] [CrossRef]
- Ma, Z.; Zhang, Y. Characterization of multilayer ultrasonic welding based on the online monitoring of sonotrode displacement. J. Manuf. Process. 2020, 54, 138–147. [Google Scholar] [CrossRef]
- Lu, Y.; Song, H.; Taber, G.A.; Foster, D.R.; Daehn, G.S.; Zhang, W. In-situ measurement of relative motion during ultrasonic spot welding of aluminum alloy using Photonic Doppler Velocimetry. J. Mater. Process. Technol. 2016, 231, 431–440. [Google Scholar] [CrossRef]
- Li, H.; Cao, B.; Liu, J.; Yang, J. Modeling of high-power ultrasonic welding of Cu/Al joint. Int. J. Adv. Manuf. Technol. 2018, 97, 833–844. [Google Scholar] [CrossRef]
- Balz, I.; Abi Raad, E.; Rosenthal, E.; Lohoff, R.; Schiebahn, A.; Reisgen, U.; Vorlander, M. Process monitoring of ultrasonic metal welding of battery tabs using external sensor data. J. Adv. Join. Process. 2020, 1, 10005. [Google Scholar] [CrossRef]
- Arimoto, K.; Sasaki, T.; Doi, Y.; Kim, T. Ultrasonic Bonding of Multi-Layered Foil Using a Cylindrical Surface Tool. Metals 2019, 9, 505. [Google Scholar] [CrossRef]
- Shin, S.; Nam, S.; Yu, J.; Park, J.; Kim, D. Ultrasonic Metal Welding of Multilayered Copper Foils to Nickel-Plated Copper Sheet in Lithium-Ion Battery Cell. Metals 2021, 11, 1195. [Google Scholar] [CrossRef]
- Ye, F.; Wang, Y.; Lu, H.; Guo, Y. Study on the bonding mechanism of multilayer copper with nickel sheet in ultrasonic welding process. Mater. Res. Express 2022, 9, 026527. [Google Scholar] [CrossRef]
- Qi, H.; Ye, F.; Lu, H. Visualization of plastic flow in metal ultrasonic welding by adding interlayer. J. Manuf. Process. 2022, 83, 571–575. [Google Scholar] [CrossRef]
- Bakavos, D.; Prangnell, P.B. Mechanisms of joint and microstructure formation in high power ultrasonic spot welding 6111 aluminium automotive sheet. Mater. Sci. Eng. A 2010, 527, 6320–6334. [Google Scholar] [CrossRef]
- Dhara, S.; Das, A. Impact of ultrasonic welding on multi-layered Al–Cu joint for electric vehicle battery applications: A layer-wise microstructural analysis. Mater. Sci. Eng. A 2020, 791, 139795. [Google Scholar] [CrossRef]
- Shen, N.; Samanta, A.; Cai, W.W.; Rinker, T.; Carlson, B.; Ding, H. 3D finite element model of dynamic material behaviors for multilayer ultrasonic metal welding. J. Manuf. Process. 2021, 62, 302–312. [Google Scholar] [CrossRef]
- Shayakhmetova, E.R.; Murzinova, M.A.; Zadorozhniy, V.S.; Nazarov, A.A. Microstructure of samples processed by ultrasonic consolidation of nickel sheets. Metals 2022, 12, 1865. [Google Scholar] [CrossRef]
- Humphreys, F.J. Characterisation of fine-scale microstructures by electron backscatter diffraction (EBSD). Scr. Mater. 2004, 51, 771–776. [Google Scholar] [CrossRef]
- Humphreys, F.J. Review Grain and subgrain characterisation by electron backscatter diffraction. J. Mater. Sci. 2001, 36, 3833–3854. [Google Scholar] [CrossRef]
- BS EN 1465:2009; Adhesives - Determination of Tensile Lap-Shear Strength of Bonded Assemblies. International Organization for Standardization (IS0): Brussels, Belgium, 2009.
- Ervin, E. Quantitative metallography. In ASM Handbook: Metallography and Microstructures; ASM International: Materials Park, OH, USA, 1998; Volume 9, pp. 187–220. [Google Scholar]
- Friel, R.J.; Johnson, K.E.; Dickens, P.M.; Harris, R.A. The effect of interface topography for Ultrasonic Consolidation of aluminium. Mater. Sci. Eng. A 2010, 527, 4474–4483. [Google Scholar] [CrossRef]
- Kaibyshev, O.A.; Lutfullin, R.Y.; Berdin, V.K. The effect of superplasticity on the solid state weldability of the titanium alloy Ti-4.5A1-3Mo-1V. Acta Metall. Mater. 1994, 42, 2609–2615. [Google Scholar] [CrossRef]
- Zhu, X.; Byrne, J.G. Effect of Interface Defects on the Mechanical Properties of Autogenous Diffusion Bonded Joints. J. Mater. Eng. 1991, 13, 207–211. [Google Scholar] [CrossRef]
- Abramoff, M.; Magelhaes, P.J.; Ram, S.J. Image Processing with ImageJ. Biophotonics Int. 2004, 11, 36–42. [Google Scholar]
- Su, Z.; Zhu, Z.; Zhang, Y.; Zhang, H.; Xiao, Q. Recrystallization Behavior of a Pure Cu Connection Interface with Ultrasonic Welding. Metals 2021, 11, 61. [Google Scholar] [CrossRef]
- Ma, Q.; Ma, J.; Zhou, J.; Zheng, X.; Ji, H. Dislocation behavior in Cu single crystal joints under the ultrasonically excited high-strain-rate deformation. J. Mater. Sci. Technol. 2023, 141, 66–77. [Google Scholar] [CrossRef]
- Ma, Q.; Cao, Y.; Zhang, W.; Zhao, W.; Chen, H.; Li, M.; Liang, Z.; Xiao, Y.; Ji, H. Low energy ultrasonic welding for Cu-Cu joining accelerated via Cu nanoparticles. J. Mater. Process. Technol. 2021, 296, 117210. [Google Scholar] [CrossRef]
- Shen, N.; Samanta, A.; Ding, H.; Ding, H.; Cai, W.W. Simulating microstructure evolution of battery tabs during ultrasonic welding. J. Manuf. Process. 2016, 23, 306–314. [Google Scholar] [CrossRef]
- Thompson, A.W. Substructure Strengthening Mechanisms. Metall. Trans. A 1977, 8, 833–842. [Google Scholar] [CrossRef]
- Hall, E.O. Deformation and ageing of mild steel: III Discussion of Results. Proc. Phys. Soc. 1951, 64, 747–753. [Google Scholar] [CrossRef]
- Petch, N.J. The cleavage strength of polycrystals. J. Iron Steel Inst. 1953, 174, 25–28. [Google Scholar]
- Ni, Z.L.; Ma, J.S.; Liu, Y.; Li, B.H.; Wang, X.X.; Ye, F.X. Microstructure evolution and mechanical property strengthening mechanisms of Cu/Cu NPs/Cu joint fabricated by ultrasonic spot welding. Mater. Sci. Eng. A 2023, 866, 144656. [Google Scholar] [CrossRef]
- Al-Sarraf, Z.S. A Study of Ultrasonic Metal Welding. Ph.D. Thesis, University of Glasgow, Glasgow, UK, 2013. Available online: http://theses.gla.ac.uk/4375/ (accessed on 1 August 2023).
- Shayakhmetova, E.R.; Mukhametgalina, A.A.; Murzinova, M.A.; Nazarov, A.A. Study of solid state joints of copper processed by ultrasonic welding. Mater. Phys. Mech. 2021, 47, 569–576. [Google Scholar] [CrossRef]
- Ni, Z.L.; Liu, Y.; Wang, Y.H.; He, B.Y. Interfacial bonding mechanism and fracture behavior in ultrasonic spot welding of copper sheets. Mater. Sci. Eng. A 2022, 833, 142536. [Google Scholar] [CrossRef]
- Ma, Q.; Ma, J.; Zhou, J.; Ji, H. Intrinsic dependence of welding quality and recrystallization on the surface-contacted micro-asperity scale during ultrasonic welding of Cu–Cu joints. J. Mater. Res. Technol. 2022, 17, 353–364. [Google Scholar] [CrossRef]
- Yang, J.; Ni, Z.; Nazarov, A.A.; Ye, F. Effect of Alcohol on the Mechanical and Electrical Properties of Ultrasonic Spot Welded Cu/Cu Joints. Metals 2023, 13, 21. [Google Scholar] [CrossRef]
- Zhao, D.; Jiang, C.; Zhao, K. Ultrasonic welding of AZ31B magnesium alloy and pure copper: Microstructure, mechanical properties and finite element analysis. J. Mater. Res. Technol. 2023, 23, 1273–1284. [Google Scholar] [CrossRef]
- Chen, K.; Zhang, Y. Mechanical analysis of ultrasonic welding considering knurl pattern of sonotrode tip. Mater. Des. 2015, 87, 393–404. [Google Scholar] [CrossRef]
Figure 1.
Surface appearance of the serrated pattern of welding tip and a schematic rendering of its dimensions.
Figure 1.
Surface appearance of the serrated pattern of welding tip and a schematic rendering of its dimensions.
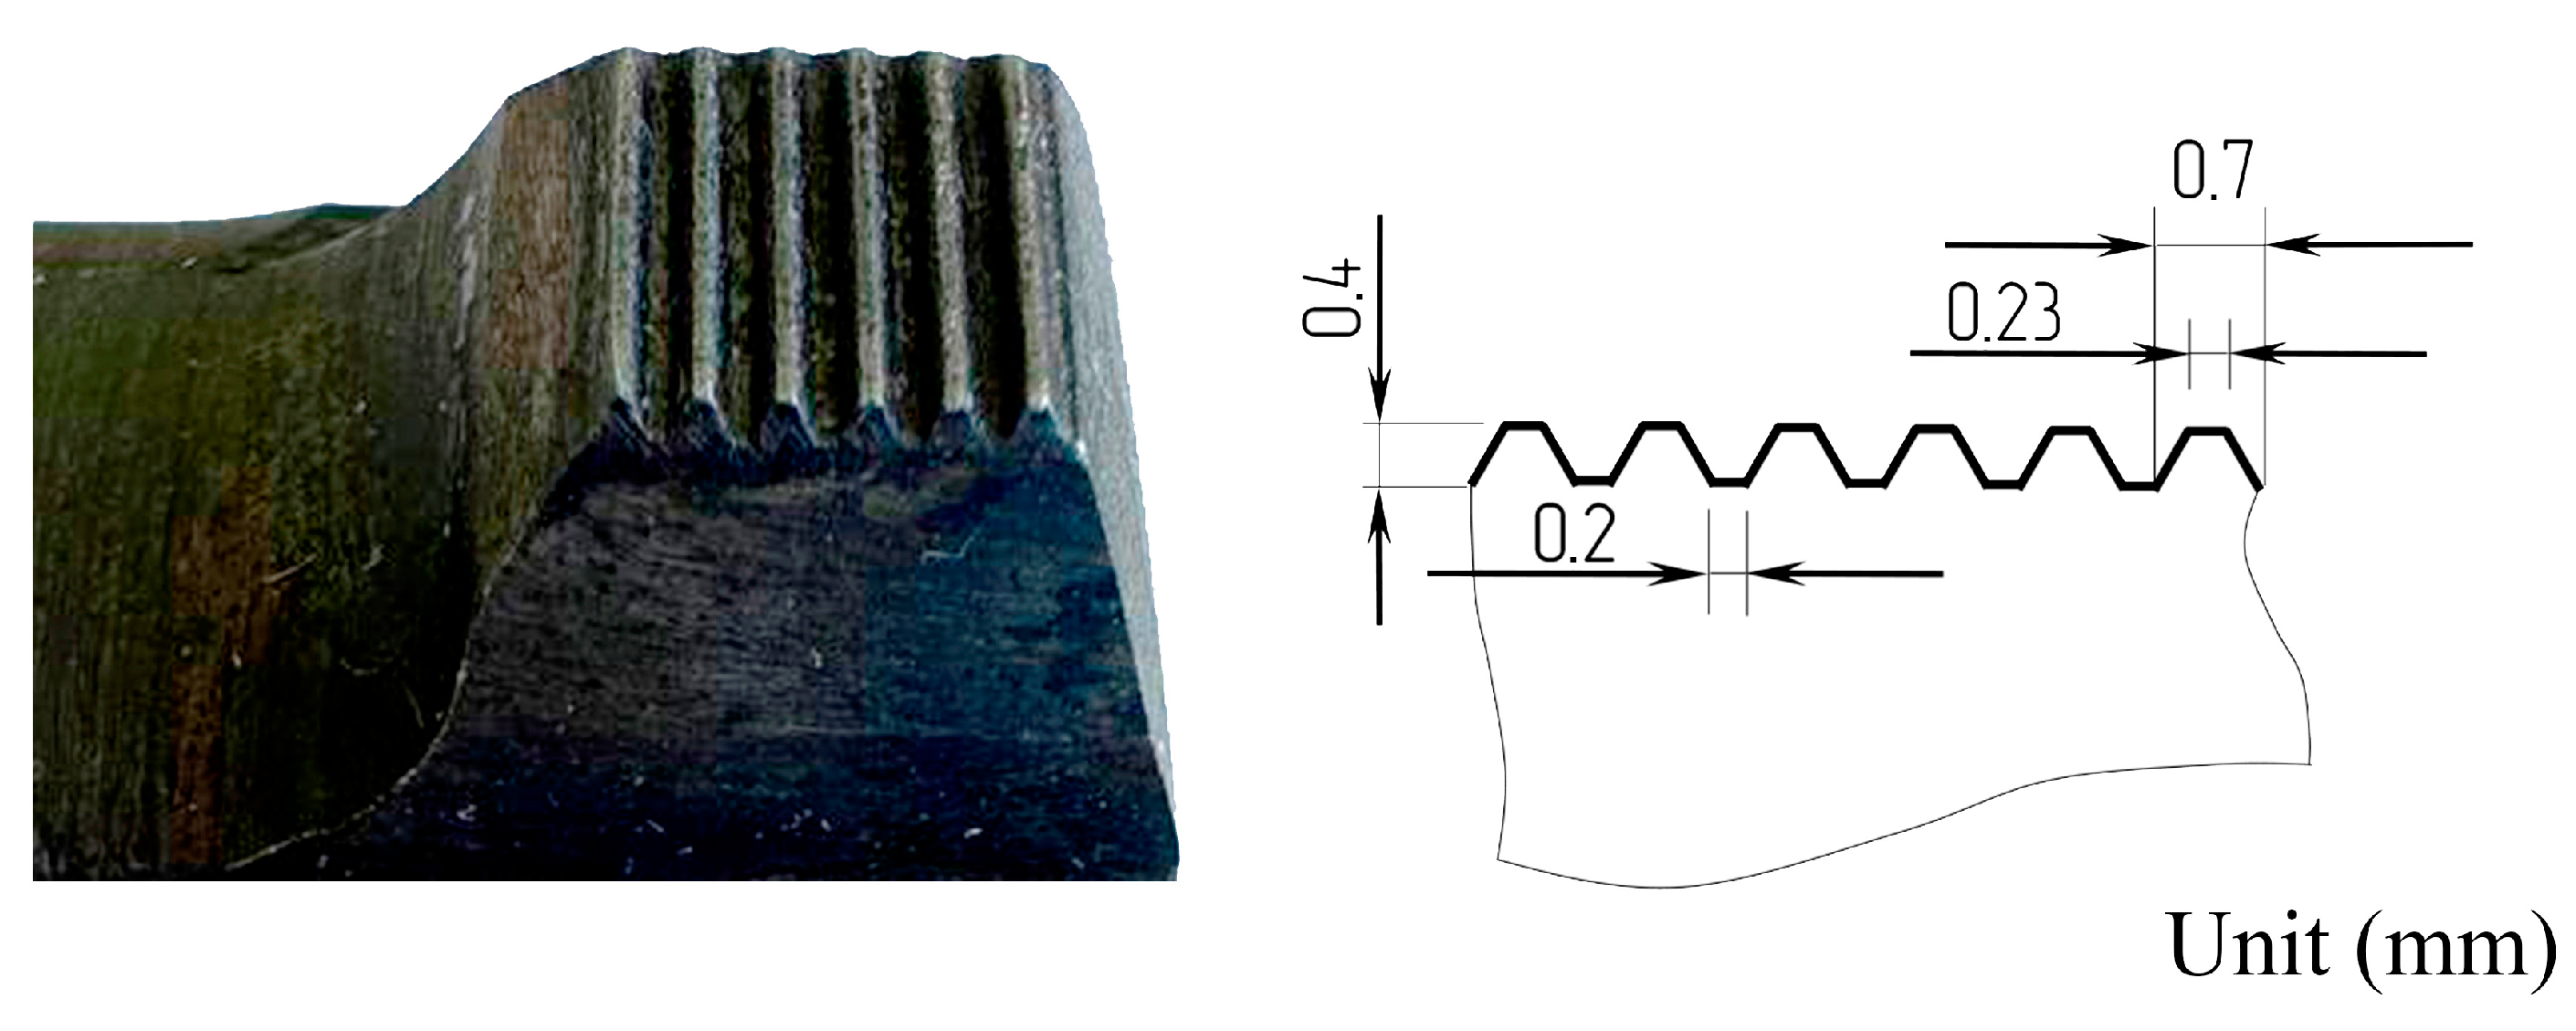
Figure 2.
Schematic illustration of the measurements taken to calculate (a) area fraction of bonding Ab (%); (b) linear weld density LWD (%) and relative length of gaps RLG (%).
Figure 2.
Schematic illustration of the measurements taken to calculate (a) area fraction of bonding Ab (%); (b) linear weld density LWD (%) and relative length of gaps RLG (%).

Figure 3.
A scheme of selection of positions for microstructure imaging and measuring the thickness of a specimen, which was used to evaluate the linear weld density and the normal strain of samples at the same point of a joint.
Figure 3.
A scheme of selection of positions for microstructure imaging and measuring the thickness of a specimen, which was used to evaluate the linear weld density and the normal strain of samples at the same point of a joint.
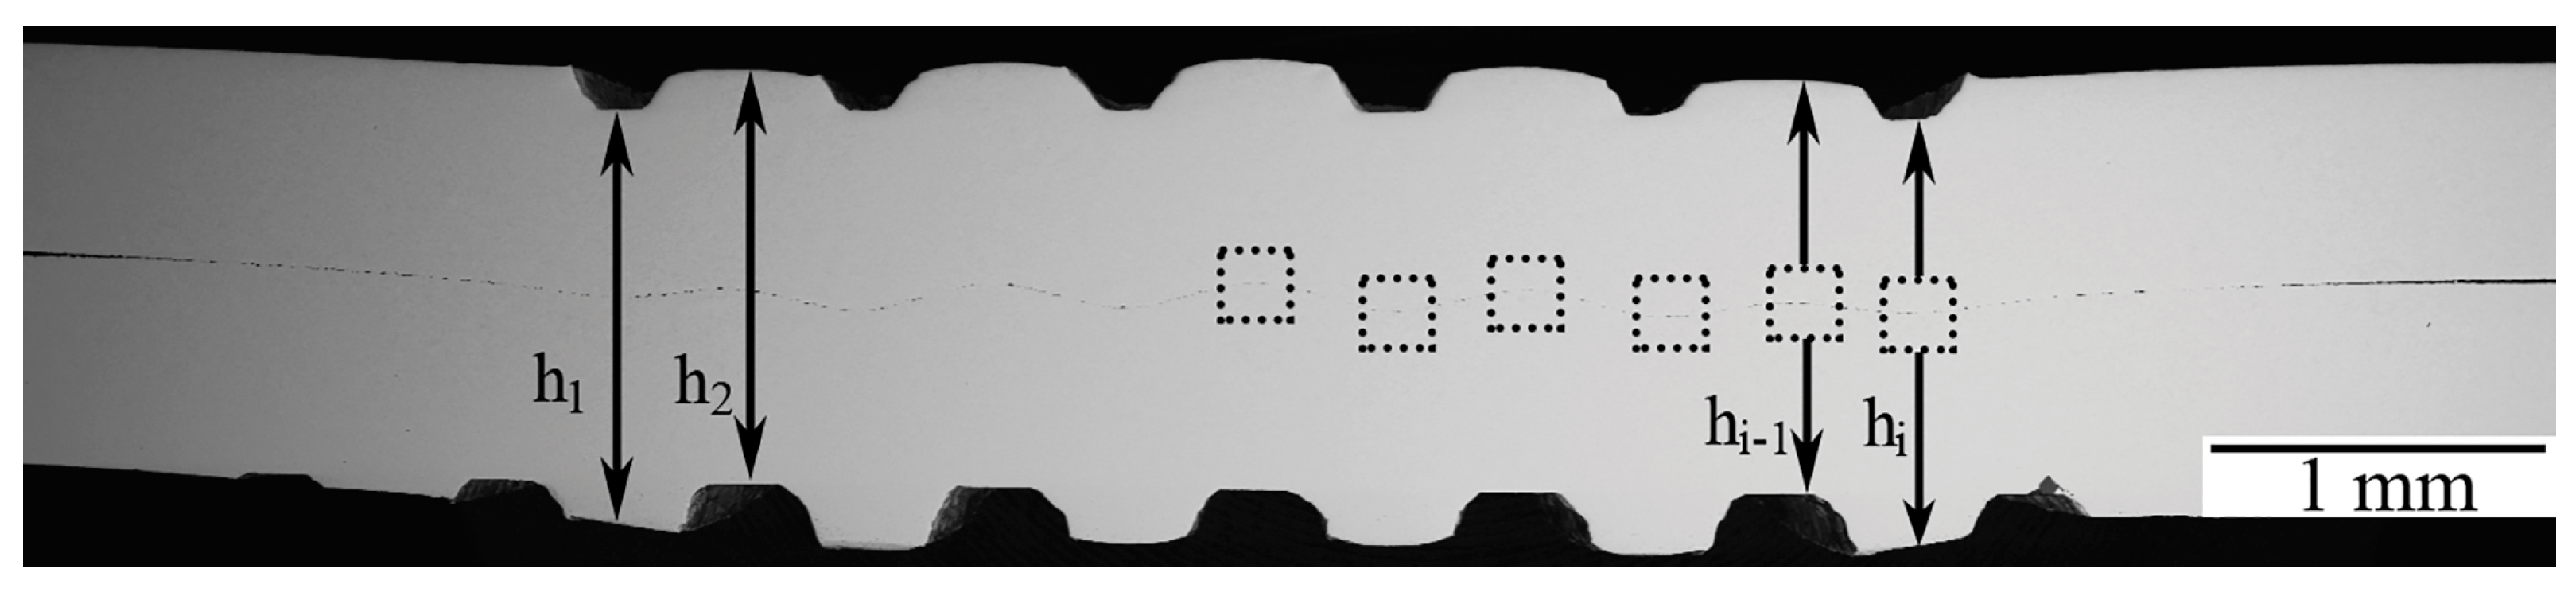
Figure 4.
Effect of clamping force and welding time on the strength characteristics of joints made by USW.
Figure 4.
Effect of clamping force and welding time on the strength characteristics of joints made by USW.
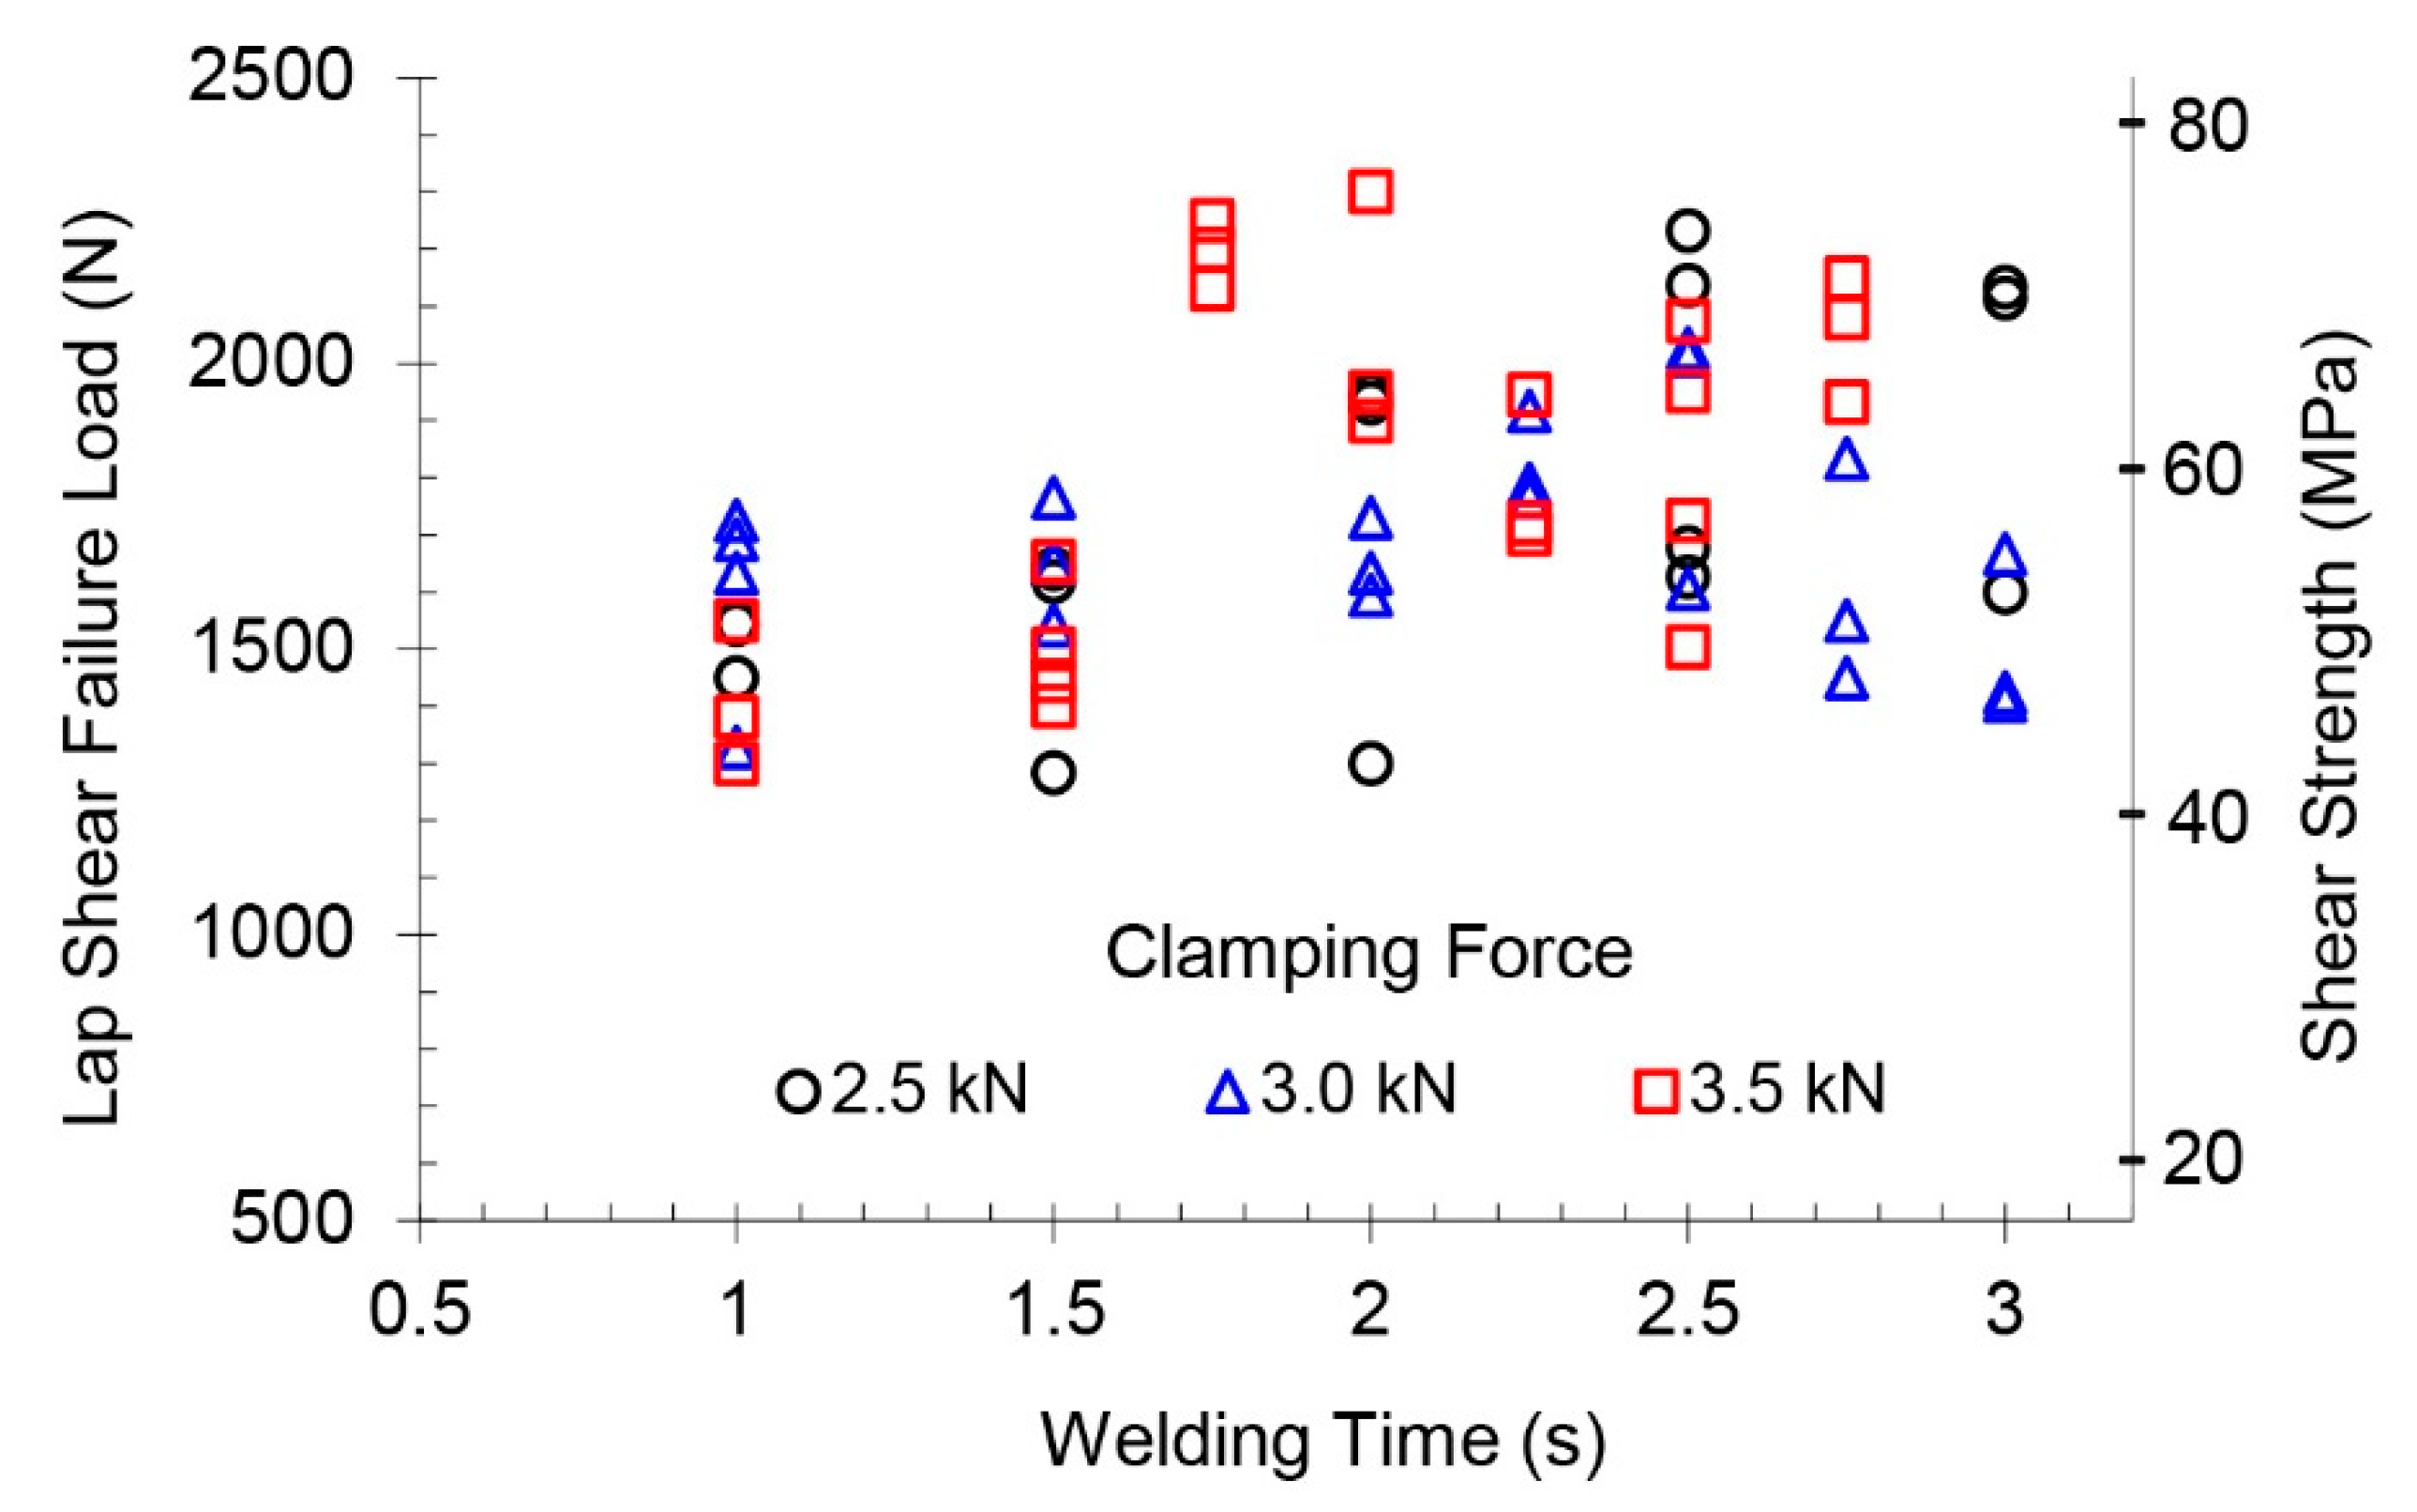
Figure 5.
(a) A typical images of fracture surfaces of samples after tensile lap shear tests: “A”—dimple-like relief; “B”—traces of shear deformation; “C”—traces of preliminary grinding. Localization of areas with dimple-like relief on fracture surfaces: (b) microbonds concentrated in the bands repeating the location of the ridges of the welding tip, (c) evenly spaced microbonds. Vibration direction is horizontal.
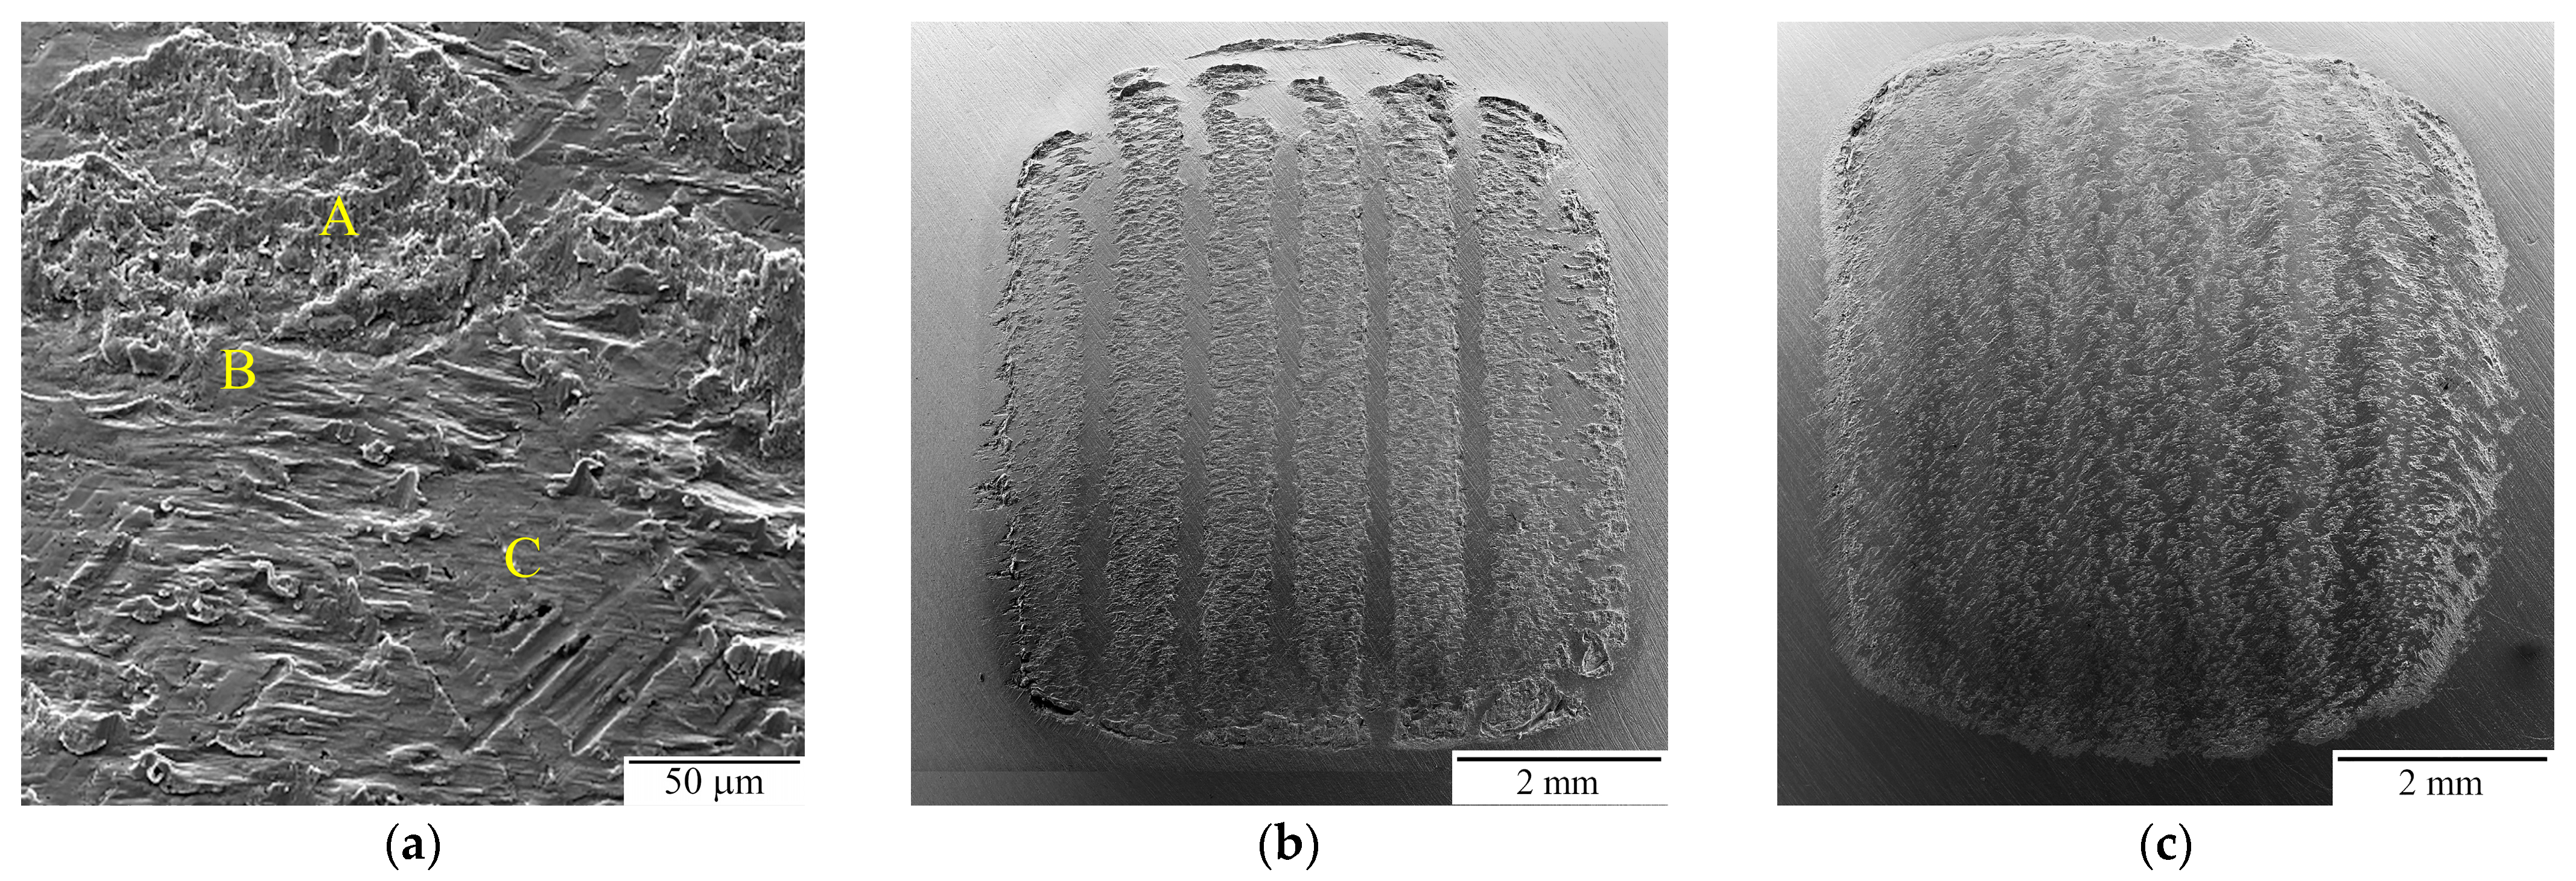
Figure 6.
(a) Load–displacement curves recorded during lap shear tests of two samples welded using the same combination of welding parameters and typical images of fracture surfaces of the tested samples: (b) #1 (Fmax = 1606 N, A = 0.9 J) and (c) #2 (Fmax = 2027 N, A = 3.2 J).
Figure 6.
(a) Load–displacement curves recorded during lap shear tests of two samples welded using the same combination of welding parameters and typical images of fracture surfaces of the tested samples: (b) #1 (Fmax = 1606 N, A = 0.9 J) and (c) #2 (Fmax = 2027 N, A = 3.2 J).

Figure 7.
Typical images of the cross sections of samples obtained by USW under different clamping forces: (a) P = 2.5 kN, (b) P = 3 kN, (c) P = 3.5 kN. The colored lines indicate different cases of the relative position of imprints of the ridges of welding tip and anvil: blue—ridges of the welding tip were located directly above the valleys of the anvil; green—ridges of the welding tip were located directly above the ridges of the anvil; red—ridges of the welding tip were located between the ridges and valleys of the anvil.
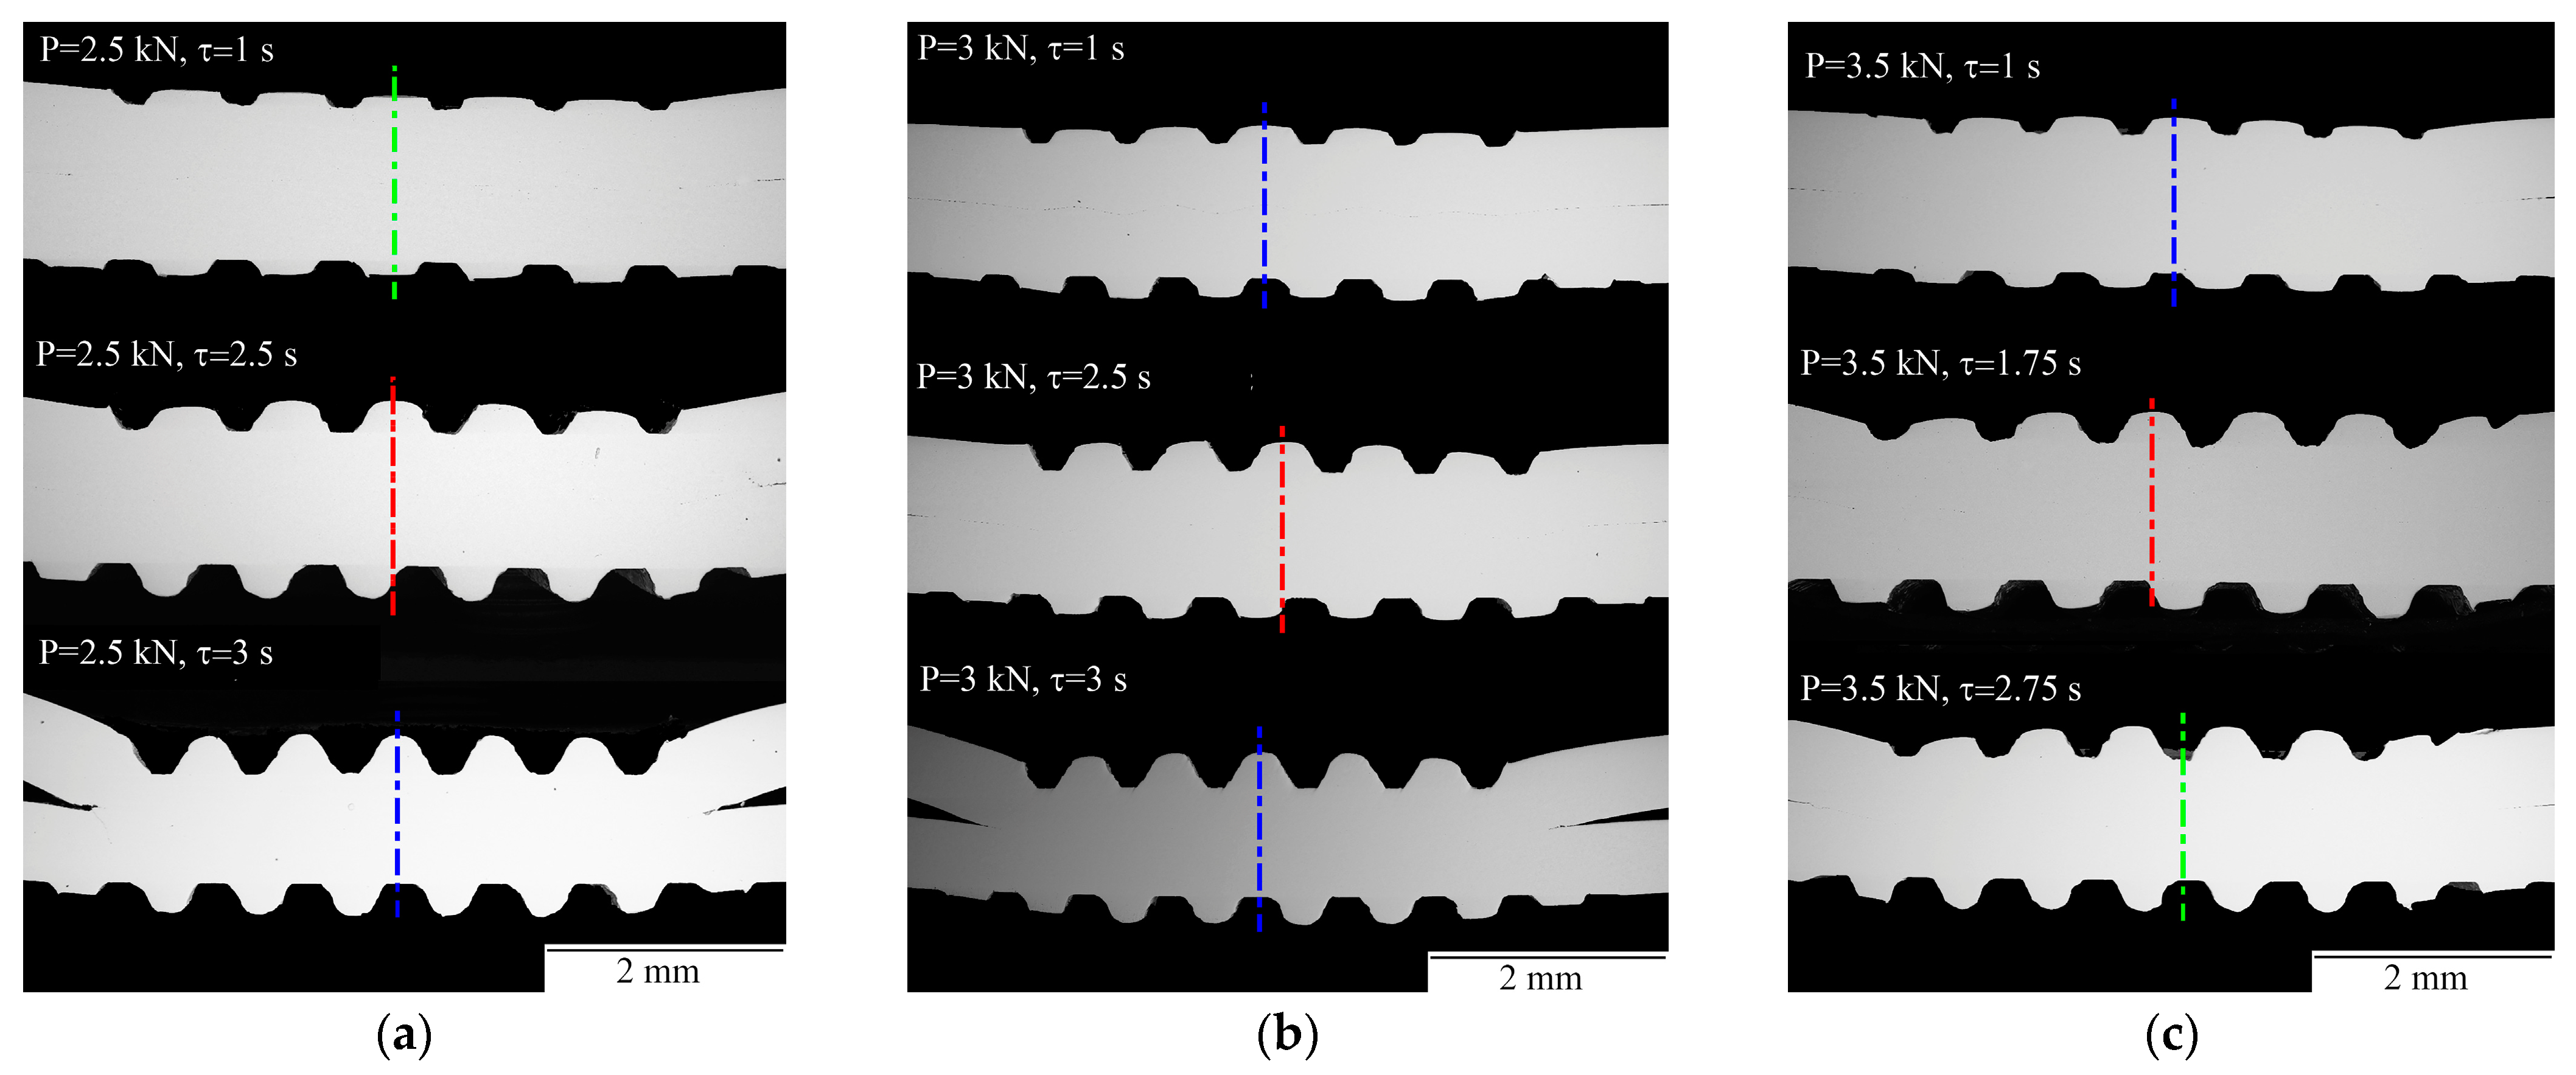
Figure 8.
The maximum depth penetration of the tool ridges into the sheets to be joined.

Figure 9.
(a) Distribution of normal strains (blue squares and line) and LWD values (red triangles and line) along a joint, when the ridges of the welding tip were located directly above the valleys of the anvil; the structure of joint in the boxed regions: (b) “A” and (c) “B”.
Figure 9.
(a) Distribution of normal strains (blue squares and line) and LWD values (red triangles and line) along a joint, when the ridges of the welding tip were located directly above the valleys of the anvil; the structure of joint in the boxed regions: (b) “A” and (c) “B”.

Figure 10.
(a) Distribution of normal strains (blue squares and line) and LWD values (red triangles and line) along a joint processed with the positions of the ridges of welding tip directly above those of the anvil; the structure of joint in boxed regions: (b) “A” and (c) “B”.
Figure 10.
(a) Distribution of normal strains (blue squares and line) and LWD values (red triangles and line) along a joint processed with the positions of the ridges of welding tip directly above those of the anvil; the structure of joint in boxed regions: (b) “A” and (c) “B”.

Figure 11.
(a) Distribution of normal strains (blue line and blue filled and empty squares) and LWD values (red line and triangles) along a joint processed with the positions of ridges of the welding tip intermediate between the ridges and valleys of the anvil; (b,c) the structure of joint in boxed region “A” at different magnifications.

Figure 12.
(a) Crystal orientation map and (b) grain average misorientation map obtained from a well-bonded region of a joint. Color codes are shown in the upper right corner of each card. High angle boundaries with misorientations more than 15° are shown as black lines and low angle ones with misorientations of 2–15° are shown as white lines. Welding parameters used for processing this joint were P = 2.5 kN and τ = 3 s.

Figure 13.
Change in the microhardness along the height of a cross section of a welded sample.
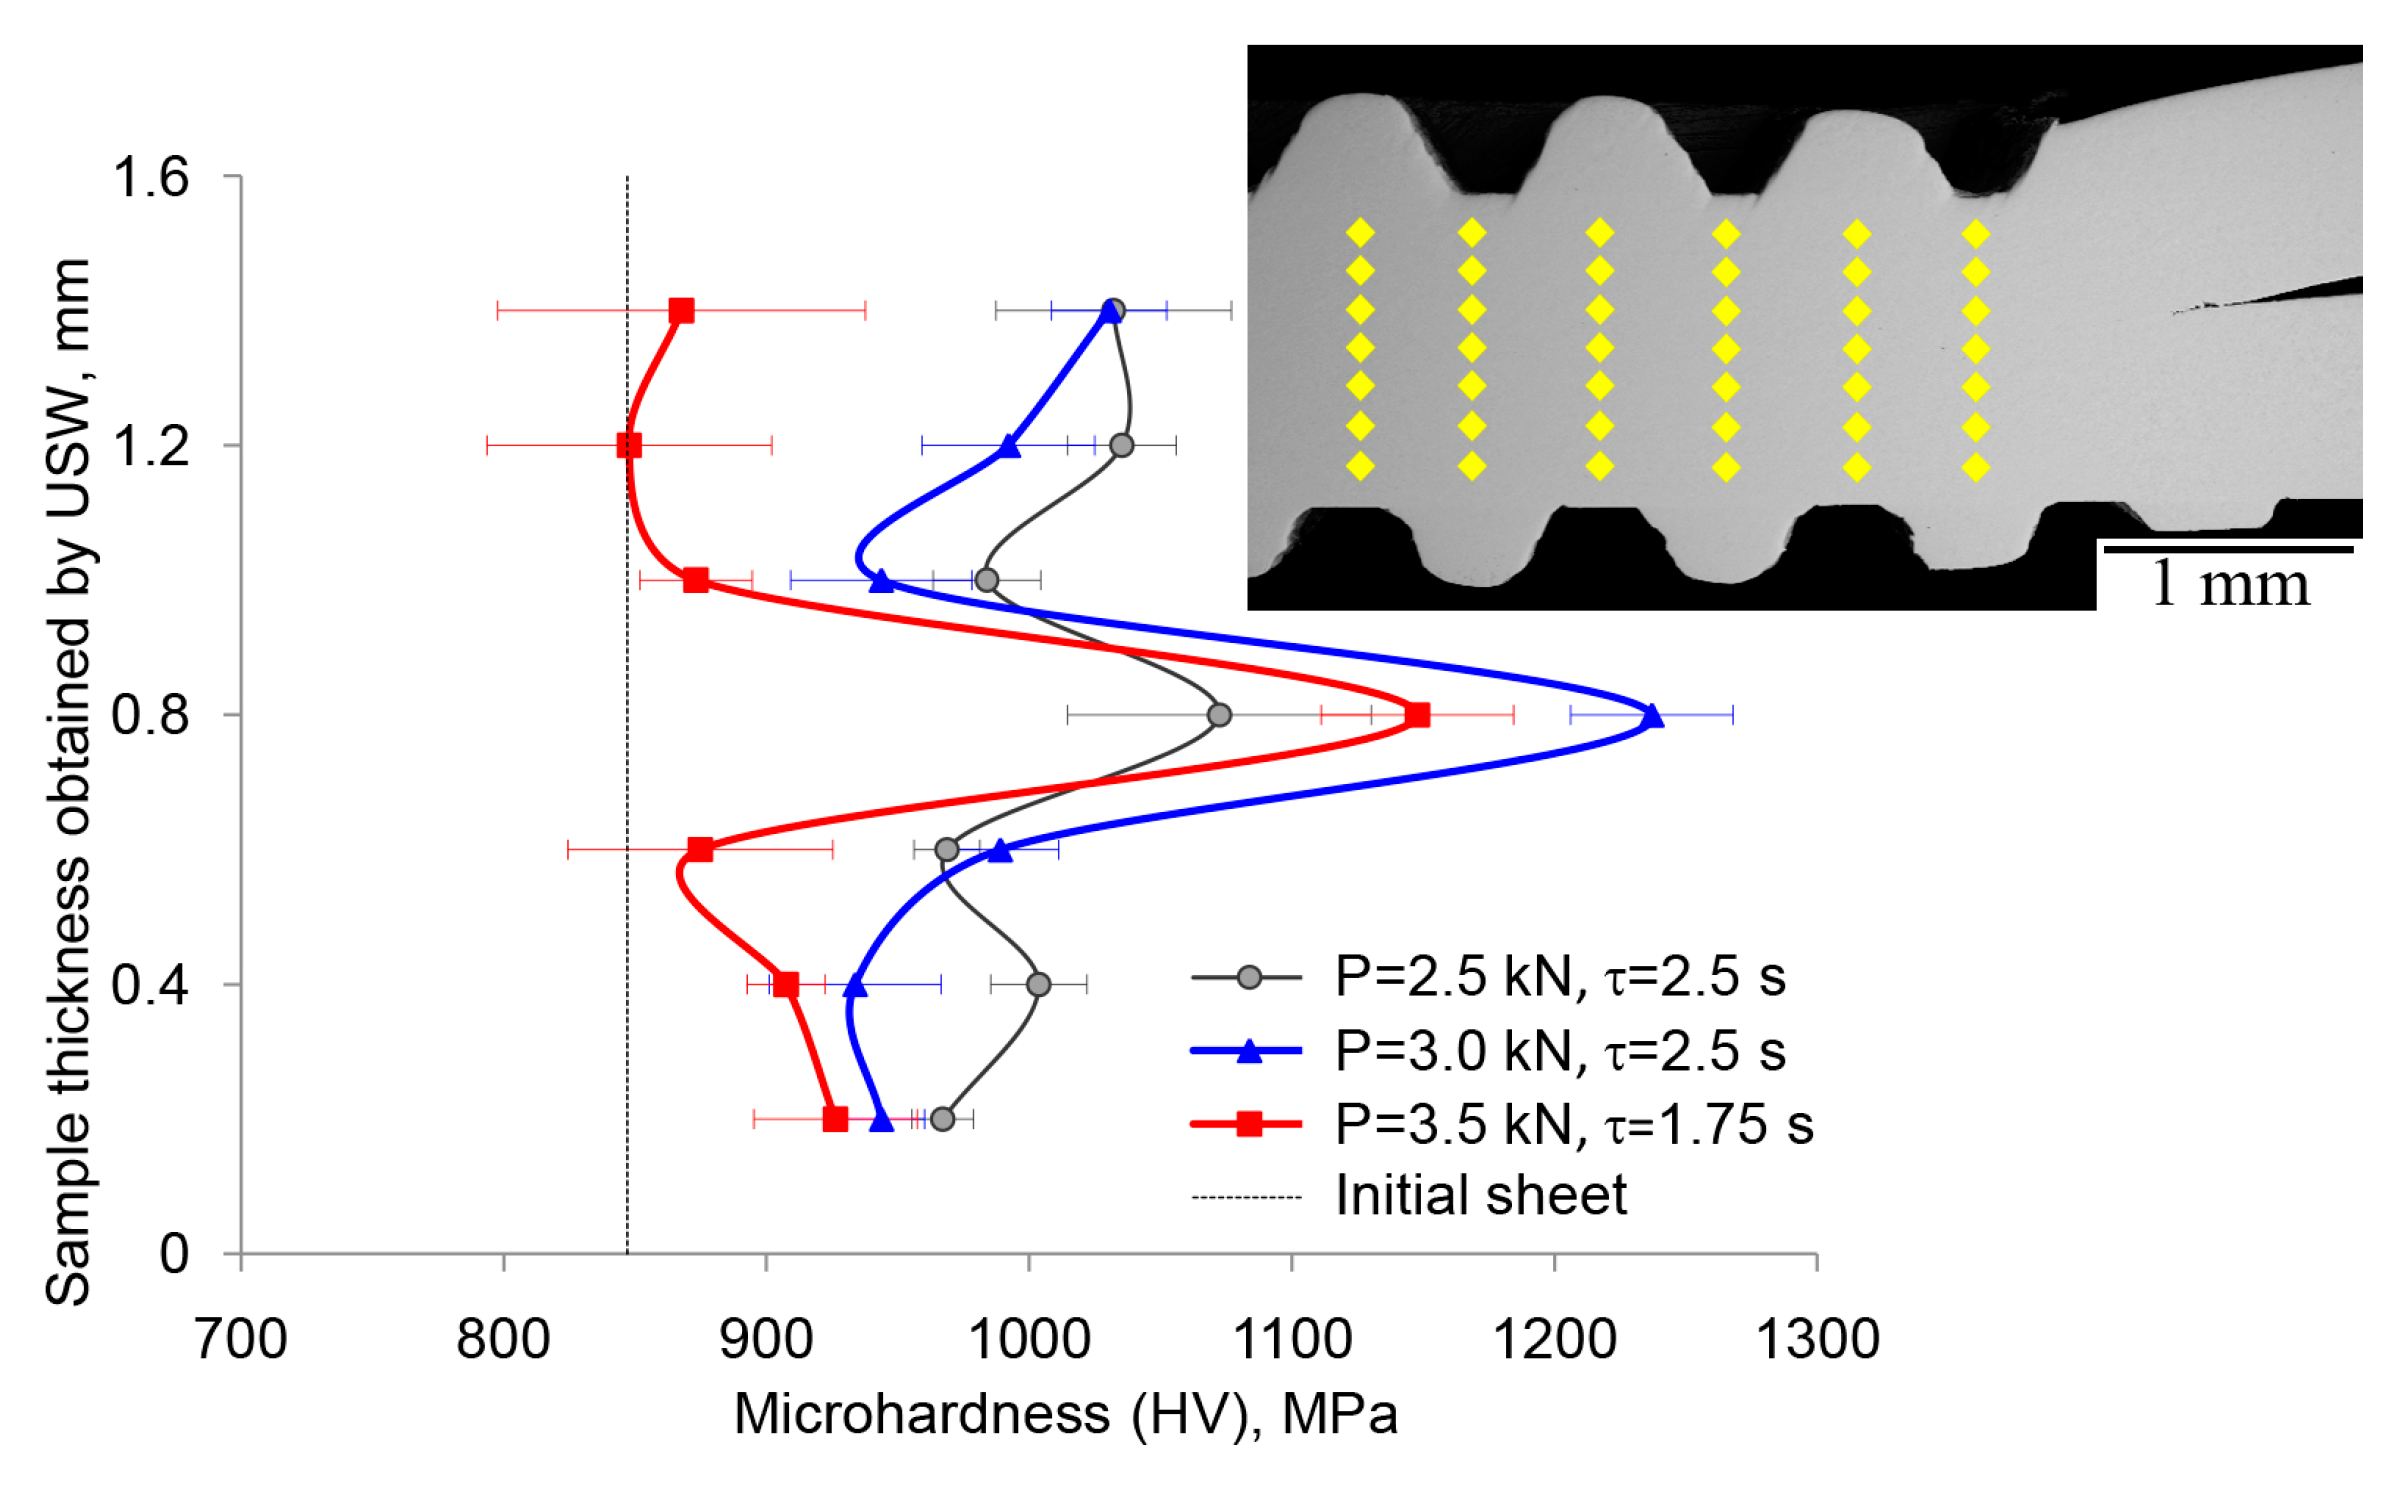
Figure 14.
(a) Double gaps at the interface of a sample welded at P = 3.5 kN, τ = 1 s and (b) rows of small voids at the interface of a sample welded at P = 3.5 kN, τ = 2.25 s.
Figure 14.
(a) Double gaps at the interface of a sample welded at P = 3.5 kN, τ = 1 s and (b) rows of small voids at the interface of a sample welded at P = 3.5 kN, τ = 2.25 s.


Table 1.
Average failure load of copper sheets joints processed with different combinations of USW parameters.
Table 1.
Average failure load of copper sheets joints processed with different combinations of USW parameters.
| Clamping Force, kN | 2.5 | 3.0 | 3.5 | ||||||
| Welding Time, s | 1 | 2.5 | 3 | 1 | 2.5 | 3 | 1 | 1.75 | 2.75 |
| Average Failure Load, N | 1512 ± 55 | 1918 ± 311 | 1950 ± 303 | 1594 ± 181 | 1824 ± 80 | 1500 ± 145 | 1410 ± 128 | 2193 ± 60 | 2054 ± 111 |
| Coefficient of variation, % | 3.6 | 16.2 | 15.5 | 11.4 | 4.4 | 9.6 | 9.0 | 2.7 | 5.4 |
Table 2.
Mechanical properties of joints of copper sheets processed by USW reported in different works.
Table 2.
Mechanical properties of joints of copper sheets processed by USW reported in different works.
| Sheet Thickness, mm | Time, s/Energy, J | Clamping Force, N | The Highest Tensile Shear Force, N | * Shear Strength, MPa | Failure Mode | Ref. |
|---|---|---|---|---|---|---|
| 0.8/0.8 | 1.75 s | 3500 | 2300 | 76 | Interface mode | This work |
| 0.1/0.1 0.5/0.5 | - - | 700 750 | 870 700 | 30 25 | Interface mode Nugget pull-out | [52] |
| 0.8/0.8 | 1600 J 2000 J | 2350 | 4200 4300 | 120 123 | Interface mode Nugget pull-out | [16] |
| 0.5/0.5 | 700 J 1000 J | - | 1900 2200 | 48 55 | Interface mode Nugget pull-out | [46] |
| 0.8/0.8 | 2 s | 3500 | 700 | 36 | Interface mode | [53] |
| 0.5/1 | 0.7 s 0.8 s | 1813 1813 | 2100 2370 | 34 38.5 | Interface mode Nugget pull-out | [54] |
| 1/1 | 0.8/2000 | - | 2200 | 55 | Interface mode | [55] |
| 0.5/1 | 0.6 s | 2040 2490 | 1478 1724 | 24 28 | Interface mode Nugget pull-out | [56] |
| 1/1 | 1.2/2500 | 2500 | 5500 | 86 | - | [17] |
* The shear strength of the joints was evaluated as the ratio of the maximum failure load to the area of the welding tip.
Disclaimer/Publisher’s Note: The statements, opinions and data contained in all publications are solely those of the individual author(s) and contributor(s) and not of MDPI and/or the editor(s). MDPI and/or the editor(s) disclaim responsibility for any injury to people or property resulting from any ideas, methods, instructions or products referred to in the content. |
© 2023 by the authors. Licensee MDPI, Basel, Switzerland. This article is an open access article distributed under the terms and conditions of the Creative Commons Attribution (CC BY) license (https://creativecommons.org/licenses/by/4.0/).
Share and Cite
MDPI and ACS Style
Murzinova, M.A.; Shayakhmetova, E.R.; Mukhametgalina, A.A.; Sarkeeva, A.A.; Nazarov, A.A. Local Plastic Deformation and Quality of Cu-Cu Joints Obtained by Ultrasonic Welding. Metals 2023, 13, 1661. https://doi.org/10.3390/met13101661
AMA Style
Murzinova MA, Shayakhmetova ER, Mukhametgalina AA, Sarkeeva AA, Nazarov AA. Local Plastic Deformation and Quality of Cu-Cu Joints Obtained by Ultrasonic Welding. Metals. 2023; 13(10):1661. https://doi.org/10.3390/met13101661
Chicago/Turabian StyleMurzinova, Mariya A., Elvina R. Shayakhmetova, Aygul A. Mukhametgalina, Aygul A. Sarkeeva, and Ayrat A. Nazarov. 2023. "Local Plastic Deformation and Quality of Cu-Cu Joints Obtained by Ultrasonic Welding" Metals 13, no. 10: 1661. https://doi.org/10.3390/met13101661
Note that from the first issue of 2016, this journal uses article numbers instead of page numbers. See further details here.