
Interface Formation and Bonding Mechanisms of Laser Welding of PMMA Plastic and 304 Austenitic Stainless Steel


Guangdong Provincial Welding Engineering Technology Research Center, Guangdong University of Technology, Guangzhou 510006, China
*
Author to whom correspondence should be addressed.
Metals 2021, 11(9), 1495; https://doi.org/10.3390/met11091495
Submission received: 18 August 2021
/
Revised: 17 September 2021
/
Accepted: 18 September 2021
/
Published: 21 September 2021
(This article belongs to the Special Issue Laser Welding Technology)
Abstract
:Laser welding experiments involving amorphous thermoplastic polymer (PMMA) and 304 austenitic stainless steel plates were conducted to explore the influence of laser welding process parameters on plastic–metal joints. A high-speed camera was applied to record the dynamics of the molten pool and the formation of bubbles to reveal the bonding mechanisms of the hybrid joints. The influence of process parameters on the joints was analyzed using temperature measurements performed with thermocouples. The microstructure morphology of joints was observed using SEM. The mechanical characterization of the hybrid joints was carried out to understand the effect of the welding conditions on the weld morphology, flaws and shear stress. Different interface temperatures resulted in two types of bubbles and led to different weld morphology characteristics. A stable hybrid joint with the best shear stress was produced with a laser line energy of 20.16 J/mm2, a temperature of 305 °C and small bubbles. The shear stress of the effective joint under the maximum mechanical resistance was 4.17 MPa. The chemical bonds (M-O, M-C) and mechanical anchoring that formed on the steel’s surface contributed to the joint bonding. Range analysis provided guidance for identifying the impact of individual factors in the shear stress for the laser welding of plastic–metal.
1. Introduction
Recent developments regarding the connection of dissimilar materials, especially in the aerospace, automotive and medical industries, have drawn attention from various areas [1]. As using only a single particular material cannot meet the multi-functional demand of various products, it becomes necessary to join different materials to obtain the advantages of the different materials. In particular, plastics have partly replaced metals in some fields because of their light-weight, anti-corrosion and electronic-shielding characteristics. Plastic–metal hybrids (PMHs) can be widely applied and acquire the multi-functional requirements of high strength, high corrosion resistance, high conductivity, high toughness and light weight [2].
PMMA (polymethyl methacrylate) is an amorphous thermoplastic polymer with a light transmission of 92%; it has seen rapid growth in the number of applications in agriculture, aviation, construction, optical instruments and lighting decoration due to its excellent transparency, better formability than thermosetting resins, recyclability, good machinability and low cost [3]. Metals, such as 304 austenitic stainless steel, which have good formability, a combination of low yield strength with high elongation, excellent corrosion resistance and good weldability, are commonly used in manufacturing [4]. PMMA plastic is often connected with metal components. However, it is hard to form a sound weld, as the melting point of polymers is generally lower than 400 °C, far below the melting point of metal materials, and the physical properties, such as the plastic transformation interval and thermal expansion coefficient, are very different [5]. Haddadi and Abu-Farha reported that reactions at the interface and material incompatibilities were the most challenging issues regarding joining dissimilar materials [6]. At present, the universal methods that are used for joining PMMA and metals are mechanical joining and adhesive bonding [7]. Mechanical joining may result in severe stress concentration and material damage, produce additional weight and is unsuitable for achieving sealing. Adhesive joining needs a long curing time, it is costly and sometimes does not meet biocompatibility requirements [8]. These joining technologies cannot be applied to microelectromechanical systems or manufacturing processes that require preparation steps [9]. In addition, traditional welding joints are prone to large defects, which result in low connection strength. For example, resistance spot welding needs to overcome the difficulty of material conductivity, and the connection interface is not continuous, which makes it difficult to realize large-area connections [10]. There are many inclusions in the brazing interface. Therefore, it is necessary to solve the problem of solder wettability for plastics [11]. Ultrasonic welding would destroy the internal structure of the composite material and reduce the connection strength of joints [12]. Friction stir welding relies on a more rigid stirring head and produces defects, such as holes [13]. These joining methods have many inherent drawbacks. As a solid-phase joining process, laser welding was shown to be a new technology with high prospects regarding creating plastic–metal hybrids due to its non-contact, high-precision, high-efficiency and high-flexibility properties. Furthermore, the heat input of laser welding can be controlled and applied to a variety of joint forms [14].
Laser beam welding of plastic–metal hybrids can be divided into transmission joining and heat-conduction joining. Laser transmission welding can only join high-transmittance plastic [15], where the plastic is directly heated by the laser beam and welded to the metal [16]. For laser-conduction welding, not only can it be used for joining thermoplastics or thermosetting low-transmittance plastics but it can also be used for high-transmittance plastics. In the case of AZ91D magnesium alloy and PET joints via transmission joining and heat-conduction joining reported by Wahba et al, the joint strength of the laser-conduction welds with discrete pores was 73% higher than that of the laser-transmission welds with networked wormhole pores [17]. Scholars thus began to explore the related bubble morphology and its suppression methods. In [18], the AZ31 magnesium alloy was annealed and then laser welded to CFRP. Since thermal oxidation suppressed the formation of bubbles, the resulting joint strength was improved. Chen et al. developed a novel ultrasound-assisted laser-bonding method (ULAMP) that used the combined action of a laser and ultrasound to join plastics to metals [19]. This method can produce high-quality joints with high shear strength [20] and a high fatigue life [21]. The reason is that ultrasonic vibration produces a close surface contact between the molten plastic and metal parts, which promotes the formation of chemical bonds at the joint interface. Furthermore, the migration path of bubbles in the molten pool was studied using a high-speed camera and compared with the simulated path that was predicted using pressure field and temperature field analysis [22]. Based upon this speculation, the effect of the surface texture and ultrasound on the laser welding of 316 L to PET were reported by Liu et al [23]. They confirmed that the texture and ultrasound had positive effects on the properties of a dissimilar joint. For the laser welding of steel–polymer, Tan et al. studied the mechanism of pore formation during the laser welding of steel to CFRP, where the distribution and morphology of pore types varied with the process parameters [24]. Lambiase et al. conducted laser welding of AISI304 to PC and found that the joint strength was decreased due to the high laser energy input and the size of the bubble in the weld center [25]. Jung et al. joined AISI 304 steel to PA6 via laser transmission welding; when the laser energy was excessive, the weld morphology presented an uneven thermoplastic polymer distribution and produced a combustion zone or polymer degradation in the joint [26]. Later, it was found that pre-oxidation treatments could improve the joint strength of laser welding zinc-coated steel to ABS [27]. Jiao et al. applied laser welding to join stainless steel and CFRTP, where the melting width and melting depth were predicted using a numerical method and the shear strength reached 17.5 MPa [28]. Hussein et al. used laser welding to join PMMA plastic and stainless steel 304 and obtained a shear force of 925 N [29]. Furthermore, finite element modeling was used to provide theoretical support for the experimental research [30]. Huang et al. obtained strong joints consisting of stainless steel 304 and PMMA plates using laser-conducting welding, where tensile load tests showed that a failure mode occurred in the PMMA base location rather than the joint interface. This implied that there was a chemical bond in the interface [31]. However, the amount of investigation into the laser welding of PMMA and 304 stainless steel is still insufficient. The detailed research on the relationship between the bubble formation in the melt zone and the interface temperature, as well as their behavior during the welding process, remains unknown. At present, there is no clear explanation for the mechanism of strong bonding under tensile shear test results and the formation of chemical bonds at the joint interface. It is worthwhile mentioning that the bonding mechanisms could effectively achieve reliable PMMA–steel hybrid joints.
In this study, the welding of PMMA and steel was conducted using laser welding using different input parameters. A PMMA–steel integrated connection is the heterogeneous material connection technology that is independent of the middle layer. Through the control of the laser welding process parameters, the morphology of the plastic–metal hybrid and the performances of specimens were investigated. The relationship between the bubble formation in the melt zone and the interface temperature, as well as their behavior during welding, were studied. The effect of the laser welding parameters was explored and analyzed by means of a Taguchi L25 orthogonal sequence. The surface morphology, cross-section and elemental composition on the surface of the PMMA–steel after shearing or stripping were characterized using scanning electron microscopy (SEM). The objective was to evaluate the characteristics and tensile shear properties of the PMMA–steel hybrid joints.
2. Materials and Experimental Methods
2.1. Preparation of Specimens
The materials were 1 mm thick 304 austenitic stainless steel and PMMA plastic with a size of 80 × 30 mm2, which conformed to the development trend of integrated neutrino detectors. Before welding, the surface of each 304 austenitic stainless steel sample was cleaned and polished using acetone and 800# silicon carbide sandpaper, then dried in an oven. The physical and mechanical properties of the PMMA and 304 austenitic stainless steel that was used for the hybrid joining [3,4,5] are shown in Table 1. The melting point and the thermal conductivity of the two materials were quite different. The great distinction in material properties makes the laser welding of the two materials challenging.
2.2. Experimental Procedure
The laser welding of the dissimilar 304 austenitic stainless steel and PMMA materials was carried out with a WF300 YAG laser (wavelength: 1064 nm, focal length: 15 mm, pulse duration range: 0.1–50 ms, incident beam diameter: 40 mm and laser defocus: 100 mm). Figure 1a shows the experimental apparatus of the laser that was used to join the PMMA and steel.
A high-speed camera was used to obtain the melting and bubble formation features in the joining zone, which were recorded using a computer. The sampling frequency of the camera was 2000 fps with a 640 × 480 pixel image resolution. An LED light source was used to illuminate the molten pool. The PMMA plastic was placed under the 304 austenitic stainless steel panel, with an overlap area of 35 × 30 mm2. A moveable transparent glass plate (5 mm) was pressed toward the bottom of the lapping joining partner as a fence for the hybrid joints. Meanwhile, the pneumatic clamping pressure was 0.3 MPa, which was adopted to minimize the gap between the workpieces. A mirror was placed below the transparent glass plate. Using the specular reflection principle enabled the position to be within the focus of the high-speed camera such that the joining zone could be recorded by the high-speed camera.
This study analyzed the influence of process parameters on the temperature of the plates during laser welding, where the temperature was measured using a K-type thermocouple sensor (MS6514) with a resolution of 0.1 °C for temperatures <1000 °C and an accuracy of ±(0.2% + 0.5 °C). These tests were performed without the PMMA plastic because the wire of the thermocouple would have directly bonded to the molten plastic during welding. Therefore, the absorbed heat during laser irradiation could be measured in a semiquantitative way in terms of the temperature produced when using different processing parameters. To measure the interface temperature of the heat-conduction welding, the wire of the thermocouple was positioned on the 304 austenitic stainless steel’s bottom side, as shown in Figure 1a. The diagram of the temperature vs. time during the laser-joining process was recorded by the computer. It must be noted that the temperature measured during the resulting direct welding process (covering 304 austenitic stainless steel with PMMA plastic) was lower than measured in the performed tests (without PMMA plastic). This is a semiquantitative evaluation method because the bonding quality could be indirectly evaluated by the temperature under different production conditions, and the optimal temperature could be obtained in combination with the optimization method.
The heat input can be adjusted to control the size of the energy density, which is mainly related to the size of the spot. In this study, the large defocus was used to increase the beam diameter and reduce the energy density. Figure 1b is a schematic diagram of a laser light path, and the focus point was adjusted to the interface between the 304 austenitic stainless steel and the PMMA plastic. The beam diameter Φ = 0.4h, where h is in millimeters. Argon (Ar) shielding gas was selected to protect the laser-irradiated zone. For the first stage of the experiment, six factors were selected for consideration: peak power, welding speed (platform moving speed), diameter or beam diameter, pulse frequency, pulse duration and argon flow rate. Each factor was given five levels and a Taguchi L25 orthogonal sequence was selected, which are shown in Table 2 and Table 3, respectively.
2.3. Mechanical and Morphological Characterization of the Joints
A universal testing machine was used for the mechanical shear force (F) testing, which was carried out at least two times for each set of process parameters. The PMMA–steel hybrid joints were pulled with a constant velocity of 1 mm/min at room temperature and the maximum breaking force was calculated as the mechanical shear force (F). The shear force (F) and the effective joint area (Se) were used as response variables, and the shear stress (σ) of the hybrid joints was quantitatively determined using the following Equation (1):
where σ is the shear stress (MPa), F is the shear force (N) and Se is the effective joint area (mm2). The surface morphologies of the joints were acquired using a camera. The joint area was measured using the ImageJ tool. Optical microscopy (OM) and scanning electron microscopy (SEM) with energy-dispersive X-ray spectroscopy (EDS) were used to observe the macroscopic morphology of the PMMA–steel hybrid joints.
σ = F/Se
3. Results and Discussions
3.1. Bubble Formation Mechanism in the Laser Welding Process
In the laser welding of a plastic–metal hybrid, one of the most important features is the formation of bubbles within the molten zone [25]. First, the 304 austenitic stainless steel sheet was warmed up by the absorbed beam power, where the heat was conducted through the 304 austenitic stainless steel sheets to the PMMA at the boundary layer. The temperature at the boundary layer rose high enough to melt the PMMA plastic. The PMMA was liquified and formed a molten layer, as exhibited in Figure 2a. At t = 2.61 s, a new molten layer was formed. After a short time, the excessive local temperature at the interface promoted the pyrolysis of PMMA. Due to the laser radiation and the movement of the welding platform, a new molten layer covered the original one. Bubbles were formed near the boundary layer and adhered to the 304 austenitic stainless steel surfaces since, in the pyrolysis process, gaseous products could not escape from the molten layer. The gas products produced by the heated PMMA are considered to be the main source of bubble formation at the interface and a small part might also come from the air and water vapor [32]. The amount of such gas products will directly affect the bubbles’ characteristics, such as their size, quantity and distribution. The heat accumulation and the joining pressure caused the diameter of the molten layer to gradually increase, as exhibited in Figure 2b. This illustrates that heat accumulation affected the weld morphologies and the growth of the molten layer to different degrees. The randomly formed bubbles fluctuated due to overlapping effects of the molten layer during the welding time from 2.95 to 4.63 s. The sizes of the bubbles were affected by the surface tension, density and temperature throughout the molten layer. It was found that the larger sizes bubbles were concentrated in the center of the molten layer, and the smaller sizes bubbles were scattered in the whole molten zone in Figure 2c. At t = 6.11 s, the laser beam was stopped. Then, solidification began, where the phase transition from liquid to solid caused the molten layer volume to decrease. The boundary layer moved backward. Under clamping pressure, on the one hand, a positive effect of pushing the molten material onto the 304 austenitic stainless steel surface filled the gaps; on the other hand, a negative influence of the bubbles was the PMMA’s detachment from the metal’s surface. These bubble behaviors are further discussed in this article.
3.2. Effects of Laser Energy Input on the Morphology of the PMMA–Steel Hybrid Joints
PMMA’s melt viscosity is highly sensitive to temperature changes. The initial softening temperature is about 160 °C, the flow temperature is 180 °C and thermal decomposition occurs above 270 °C. The pyrolysis process will cause changes in material properties [33]. Hence, the temperature that may affect the bond quality at the PMMA–stainless sheets interface must be carefully controlled. The temperature at the interface was measured to explain the influence of the welding process on the bubbles, melted depth, bubble formation and other defects of the PMMA plastic. The measured maximum (peak) temperature (Tmax) in each of the 25 sets of coded conditions is shown in Table 3 and the weld macroscopic morphologies of the 25 hybrid joints samples are shown in Figure 3. According to the distribution characteristics of bubbles, the discrete distribution pores were defined as type I bubbles and the network distribution pores were defined as type II bubbles, as shown in Figure 4.
The optimized waveform of the laser with a ramp-up shape was selected based on our previous study [31]. The average laser power (Pa) depends on a function of the peak power (p), pulse frequency (f), and pulse width (t), as shown in Equation (2). The laser line energy (LE) was selected to analyze the morphology of the PMMA–steel hybrid joints, as shown in Equation (3).
where LE is the laser line energy (J/mm), Pa is the laser power (W), v is the laser welding speed (mm/s), p is the peak power (kW), f is the pulse frequency (Hz) and t is the pulse duration (ms).
The LE values of 25 samples joints are shown in Table 3. When the laser line energy (LE) was lower than 22.95 J/mm and the Tmax was below 325.2 °C, only type I bubbles were generated. When LE exceeded 23.10 J/mm and the Tmax was above 426.7 °C, type II bubbles with large sizes were generated. When LE exceeded 30 J/mm and the Tmax was above 502.2 °C, the bonding interface became discolored. Hence, the interface temperature analysis provided guidance for the information regarding polymer melting, bubble formation and discoloration.
Figure 5 depicts the variation in maximum (peak) temperature (Tmax) with varying laser line energy, showing that the maximum (peak) temperature (Tmax) increased with an increase in the laser line energy for the PMMA–steel joints. This trend implied that the temperature at the PMMA–steel interface depended on the laser energy input. In addition, from the results of NO.7’s and NO.17’s surface morphologies, where the welding time was the same (weld dimensions/platform moving speed) but the heat input was different, this also confirmed that the influence on the weld morphology was mainly from the heat input rather than the welding time. As noticed from Figure 5, the slope of the fitting curve line decreased when the laser line energy exceeded 28.00 J/mm. This trend may have been caused by non-linear phenomena during the laser welding process, such as plasma formation, materials evaporation, melt convection between the surface temperature of the 304 austenitic stainless steel and absorbed heat.
Typical surface morphologies and macrostructural cross-sections of the PMMA–steel joints for different laser parameters are shown in Figure 6. There are a large number of bubbles in these melted and solidified zones for the three typical morphologies (the area where the PMMA was melted is marked by the red line). The surface morphology of NO.5 was a sound weld sample, where the bubbles’ sizes were relatively small and they were distributed throughout the bonding interface (type I bubbles) and the PMMA–steel sheets were connected tightly near the boundary of the molten zone. The surface morphology of NO.17 had some mesh bubbles (type II bubbles) concentrated in the central area of the melted zone and discrete large pores were observed in the cross-section. The mesh bubbles in the center of the weld were surrounded by smaller bubbles. Discoloration occurred on the surface morphology of NO.7. A continuous large cavity was formed in the center of the cross-section and the decomposition of PMMA was also observed at the joint interface. Therefore, it could be concluded that type I bubbles were generated under all the laser energy input conditions tested. The mesh bubbles and cavities that were formed, together with the decomposition of PMMA throughout the joint interface, greatly reduced the effective bonding connection area.
In order to discuss the influence of the laser energy input on the weld width (area) and the depth of the melting zone, as well as the size and distribution of the pores, the temperature–time relationship of the typical weld was studied. Figure 7 shows the temperatures that were obtained at the center of the bonding interface for NO.5, NO.7 and NO.17. The welded joints of NO.5, NO.7 and NO.17 were chosen as the typical cases because they represented the relatively optimal pore distributions, network pores and discoloration out of the 25 hybrid joints samples, respectively. It can be seen that the temperature reached the maximum value at the end of the laser radiation; then, the temperature dropped to room temperature. The maximum (peak) temperature (Tmax) of the NO.5, NO.7 and NO.17 samples was higher than the thermal decomposition temperature (270 °C) and the melting point (160 °C) of the PMMA. When the laser welding line energy increased from 22.68 to 32.90 J/mm, the holding time was above the melting point and the thermal decomposition temperature rose from 7.6 to 19.5 s and from 1.4 to 10.3 s, respectively.
It was also found that with an increase in the laser welding line energy, the joining interface experienced an increased maximum (peak) temperature (Tmax) and the holding time (melting point and thermal decomposition temperature) increased for the consequently higher heat conducted toward the overlying PMMA. It can be seen from Figure 6 and Figure 8 that a thin melted zone with small bubbles for a suitable laser energy input could have been the result of reduced holding time for melting and thermal decomposition of PMMA, as exhibited in the typical joint NO.5 of Figure 6. It was also found that the bonding area and melted depth increased with the laser line energy increase. This was because the heat caused the change in bubble distribution and orientation, as well as excessive bubble formation, thereby further affecting the melted zone depth. The bonded area and melted depth increased with the line energy increase, as exhibited in the typical joints NO.17 and NO.7 in Figure 6. Therefore, the maximum (peak) temperature (Tmax) and longer holding time of the hybrid joints resulted in the increase in the bonded area and melted depth. These results suggest that the trend of laser line energy effects on the melted depth and bonded area was also applicable in the 25 hybrid joints samples. Furthermore, it was possible to create chemical bonds at the interface such that the temperature at the interface exceeded the melting point of PMMA. This was because the chemical formula for PMMA is -CH2-C-CH3COOCH3−, which contains ester carbonyl, and the carbon atoms in ester carbonyl are active such that chemical reactions could occur in the PMMA–steel hybrid joints.
3.3. SEM Analyses of the Interface and Fractured Surfaces for a Typical Joint
Cross-sectional SEM images of the joint interface of the NO.5 joint sample are shown in Figure 9. Bubble formations were observed near the joint interface, as shown by the red box in Figure 9a. The sizes of these bubbles varied throughout the joint interface and had sizes in the range of 60–170 μm. The morphologies of the bubbles had a smooth inner wall in Figure 9b. It is well known that the bonding mechanisms of plastic to metal involves chemical and physical bonding or a mechanical interlocking effect. In addition, a mechanical anchor or rough surface morphology also helps to increase the interface connection area [34]. Figure 9c shows a typical example, where it is seen that the PMMA at the joint interface was filled and flowed to a groove (marked by red dotted lines). Generally, the mechanical interlocking effect is closely related to the roughness in the weld zone; this factor has a decisive effect on mechanical anchoring. Nevertheless, this kind of anchor with a small depth and width was only observed in a local area, and the contribution of the anchoring effect to laser welding was very limited due to all the weldments that did not receive surface roughening treatment.
Typical tensile shear fracture surfaces of the PMMA-steel joints are shown in Figure 10. It was found that there were residual materials on the fractured side of the 304 austenitic stainless steel. These residual materials might have been PMMA plastic. To further investigate the residual materials, Figure 10 indicates the typical SEM–EDS analytical results of the 304 austenitic stainless steel fracture surfaces. The SEM–EDS analysis showed that the residual materials contained two modes of morphologies with carbon elements (marked near P2, P3 and P5 in Figure 10a,b). The first mode of residual PMMA on the surface of the 304 austenitic stainless steel side fracture (marked near P5 in Figure 10a presented an irregular shape with deformation characteristics, indicating that this PMMA must have been deformed in the tensile shear test. This shows that the 304 austenitic stainless steel and PMMA must have been combined through a strong bond such that the deformation occurred on the PMMA side close to the interface. The second mode was circular or elliptical, similar to the bubble shape (marked near P2 and P3 in Figure 10a), which indicates that the bubble may have acted as a fracture site. It can be seen from Figure 10a that the fracture morphologies of the PMMA–steel joints demonstrated a mixed failure.
To identify the bonding mechanism, Table 4 shows the EDS mapping of carbon, oxygen, Fe, and Cr near the joint interface, as well as chemical compositions (wt%) of the elements at the points analyzed in P1–P5 of Figure 10a. Comparing P1 (surface of 304 austenitic stainless steel base material) with P2-5 (surface with residues), it can be seen from the chemical compositions of the elements analyzed that all the carbon in the weld area came from the PMMA plastic. The chemical compositions (wt%) of P3 and P5 showed less carbon and oxygen and more M (Fe or Cr) than P2. These results indicate that the physical bonds (van der Waals force) and chemical bonds (M-O, M-C) were likely formed throughout the joint interface. It is worth mentioning that the bonding mechanisms for metal–polymer welded joints involved mechanical anchoring and chemical bonding. However, based on the cross-sectional SEM image, it was found that the contribution of the mechanical anchoring effect was very limited due to all the weldments having no surface roughening treatment. Hence, the formation of chemical bonds within the melted region of the interface was a key strength factor in this study.
3.4. Shear Strength Evaluation
Under the action of an external heat source, the interaction between the materials at the interface will determine the strength of the hybrid joint. Generally, the strength of the joint has a great relationship with the effective joint area between the metal and the plastic. Meanwhile, as discussed above, the pressure of the gas inside the bubble contributes to the flow of the molten plastic, leading to the formation of a compact joint. On the other hand, the fluctuation in the joint width also affects the joint strength. The poor thermal conductivity of steel did not allow for rapid heat dissipation from the edges, and it was difficult to reach heat equilibrium at some process parameters during laser welding, resulting in different joining widths at different travel positions; a similar finding was found by Lambiase [25]. In addition, when the laser line energy increased to 30 J/mm and the temperature was above 502.2 °C, the surface morphology had huge changes and was even discolored after high-temperature processing. According to the above analysis, it is safe to conclude that the discolored zone between the PMMA and steel joints created an area without adhesion at the interface. An example of measuring the total joint area/discolored zone using the ImageJ tool is given in Figure 11. Such a value (effective joint area) was only slightly lower than that measured for adhesive bonds. In addition, as mentioned above, this was a conservative value since it did not take into account the mixing of air. Figure 12 provides the measurement results of the total joint area/discolored zone for the 25different parameter settings of the hybrid joints.
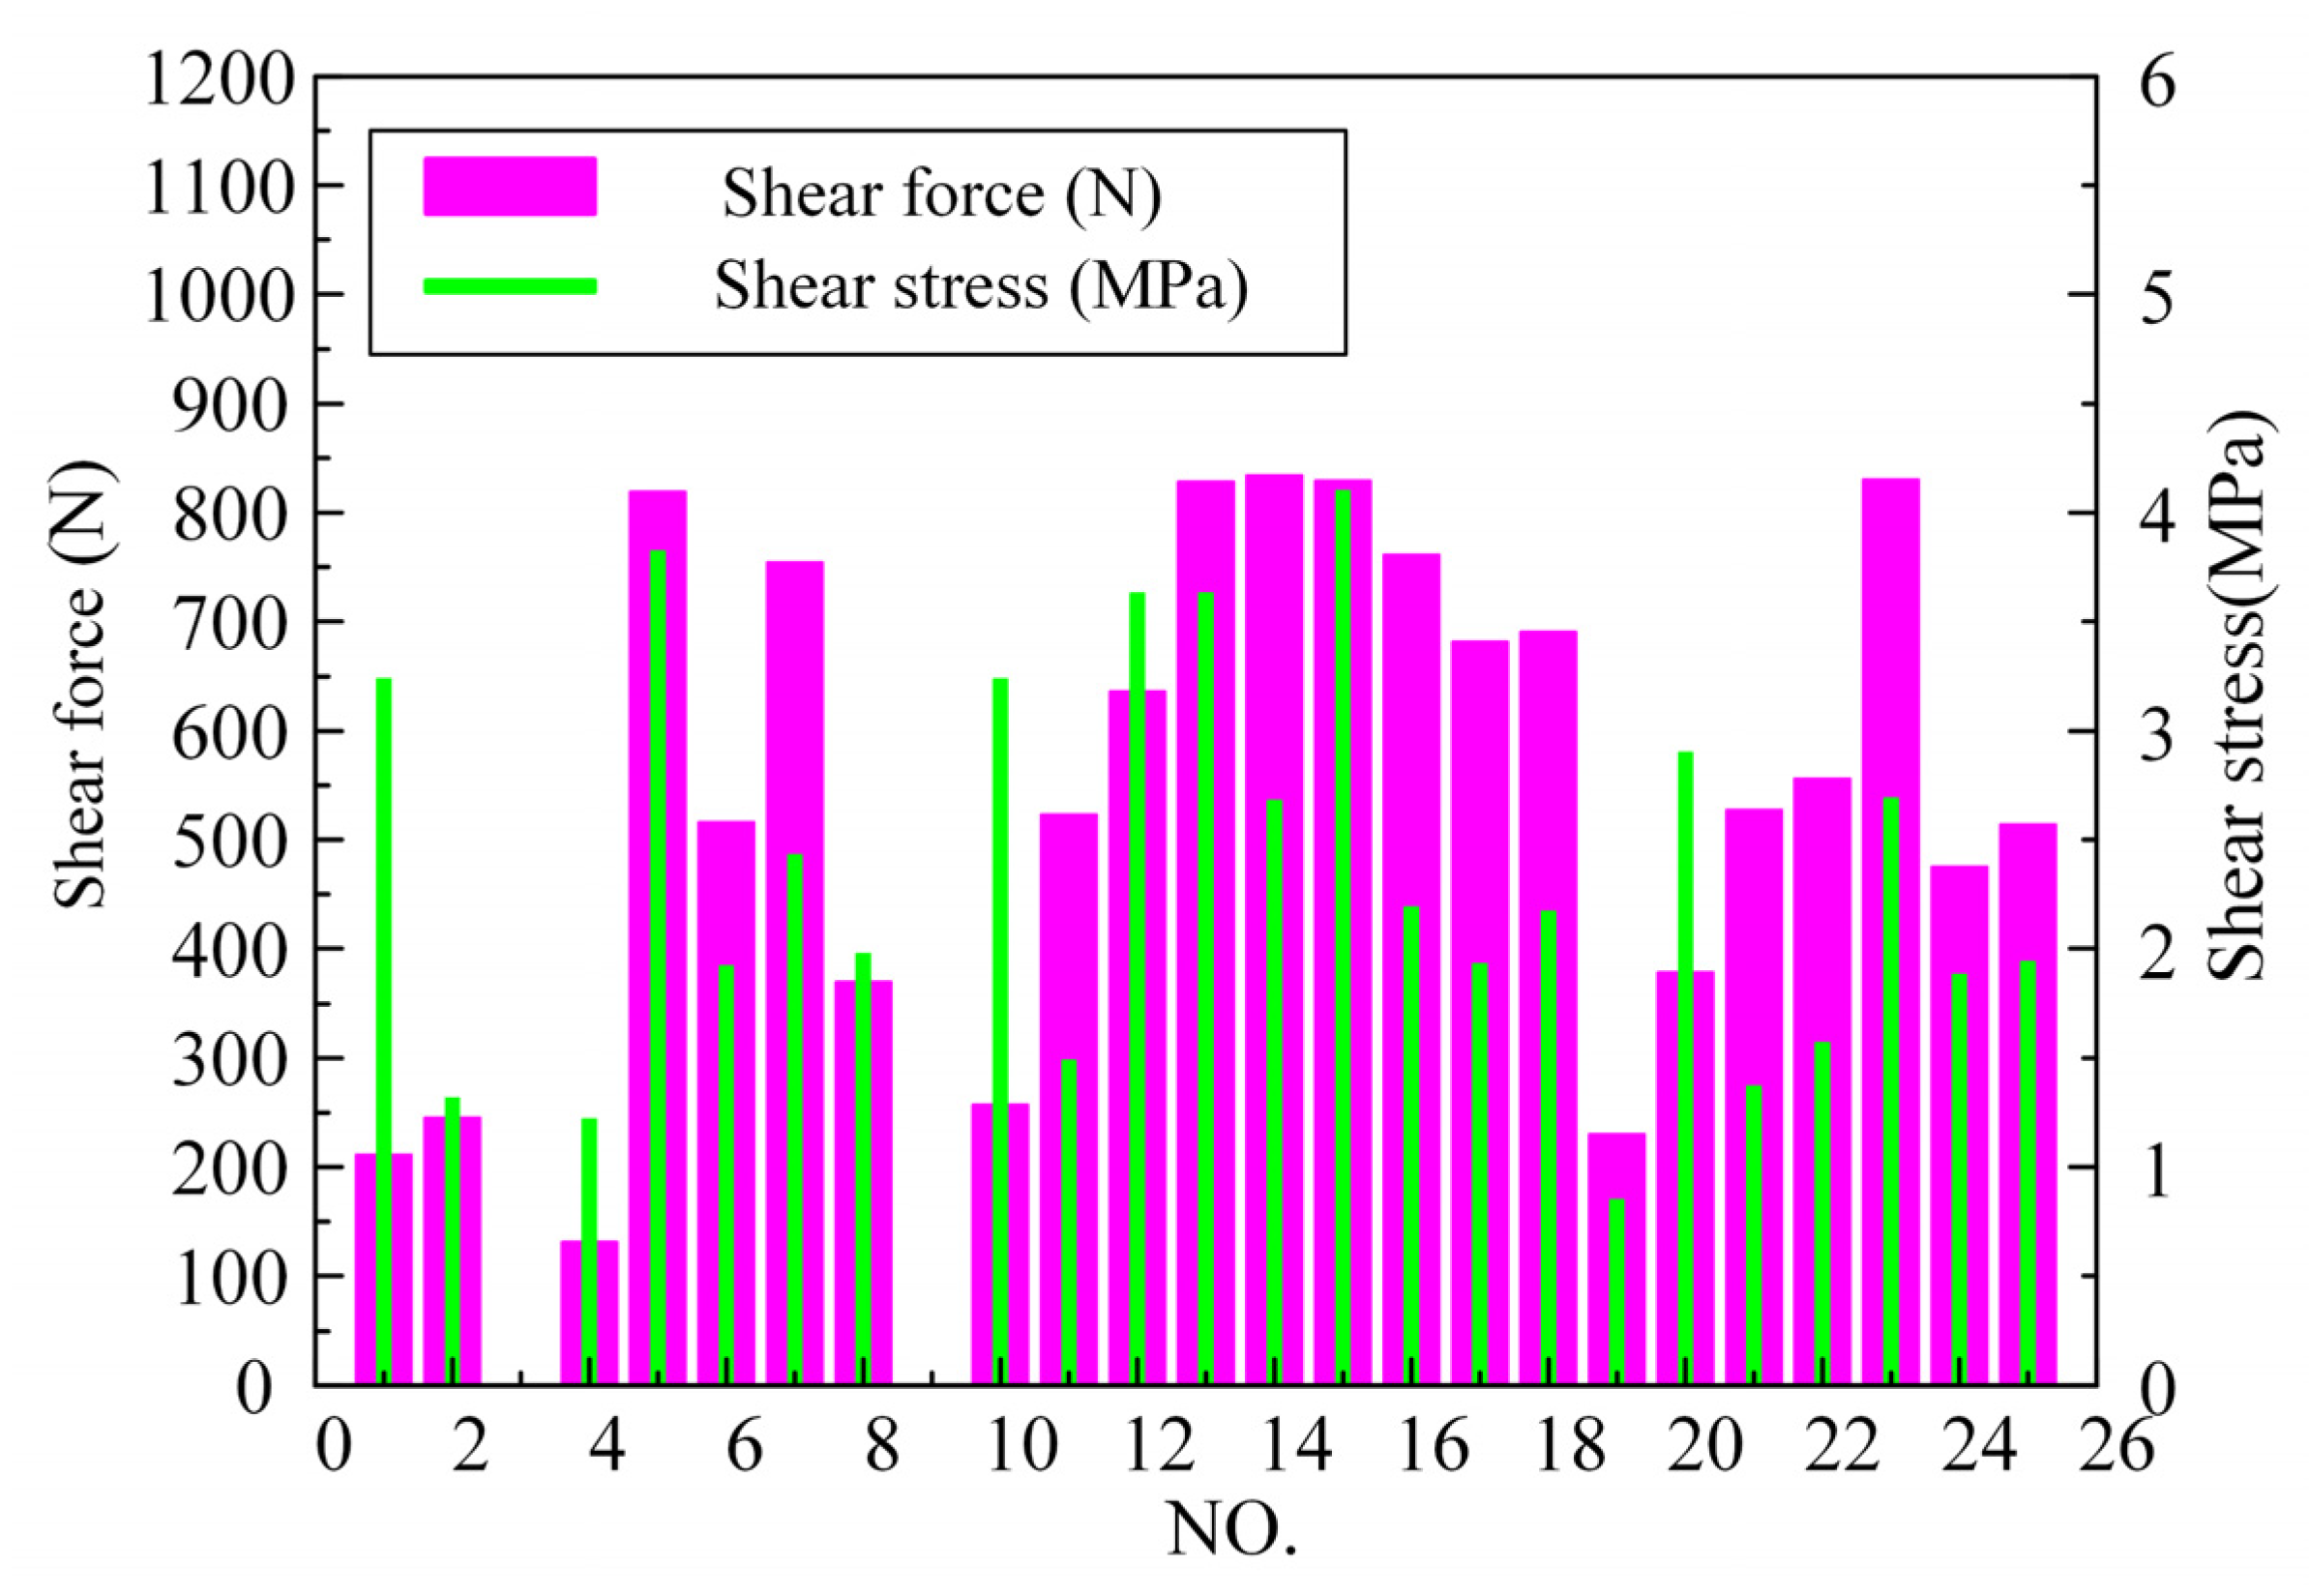
Using a wider tensile specimen will produce greater mechanical resistance, even with the same joint strength. Thus, using the shear force (F) alone for these joints is not a suitable index to reflect the joint’s bearing capacity since it might be enlarged artificially in some cases (Figure 13). The shear stress (σ) was more suitable as the index for comparing the bearing capacity for lap joints than the mechanical resistance in this study. The shear stress (σ) is largely affected by the area of welded joints.
For welds without discoloration, the effective joint area (Se) is the total joint area. The effective joint area (Se) of the discoloration weld is the total joint area minus the discoloration zone. The shear stress (σ) of the PMMA–steel hybrid joints was quantitatively evaluated using Equation (1). Figure 13 provides the measured shear force (F) and the calculated shear stress (σ). The discoloration of the welds reduced the effective joint area (Se) at the joint interface, which led to a decrease in the shear stress (σ) of the hybrid joints. Further investigation found that for the samples with a shear stress (σ) over 3.5 MPa, the laser line energy ranged from 20.16 to 22.95 J/mm, the maximum (peak) temperature ranges from 305.0 to 325.5 °C and the bubble distribution of the weld was type I. Hence, the bonding quality could be indirectly evaluated using the temperature under different production conditions, and the optimal temperature could be obtained in combination with the optimization method. From the above discussion, the conclusion could be reached that small bubbles were beneficial for the joint’s strength.
Furthermore, it is necessary to discuss the influence of laser welding parameters on the shear stress (σ). The specific results are summarized in Table 5, where each laser process parameter is shown to have a certain influence on the shear stress. To further explore the ranks for the laser process parameters’ effects on the shear stress, range analysis was used to identify the impact of individual factors in the shear stress. The results show that the welding velocity was the most significant parameter, followed by the interaction effect of the pulse duration and gas flow value. The two factors of beam diameter and pulse frequency had only slight effects on the shear stress. For the PMMA–steel hybrid joints of NO.5 and NO.7, while the same values of pulse duration and welding velocity with different values for the laser welding parameters resulted in various morphologies and cross-sections from those shown in Figure 6. Thus, the range analysis results also suggest that the welding velocity had a statistically significant effect on the bubble type and discoloration of the welded joint, while the gas flow could protect against the discoloration of the PMMA plastic to a certain extent.
4. Conclusions
The 1 mm thick plates of PMMA and 304 austenitic stainless steel were successfully welded using laser welding technology. The relationship between the temperature distribution of the typical weld in the melting zone and the formation of bubbles, as well as the behavior during the welding process, were explored. The morphology and mechanical performance of the welds were studied by means of optical microscope, EDS, SEM and tensile test observations. The following conclusions were reached based on the obtained results.
- The growth of the molten layer and movement of bubbles in the molten zone were recorded, which revealed the evolution of bubbles. The larger-sized bubbles (type II) were concentrated in the center of the molten layer, and the smaller-sized bubbles (type I) were scattered in the whole molten zone.
- The laser welding line energy had a great impact on the interfacial temperature, as seen through the thermal analysis of the welding process. The higher laser welding line energy, which had the longer holding time at the maximum (peak) temperature, was irradiated onto the hybrid joints, resulting in an increase in the bonded area and melted depth.
- The discrete pores, cavities and other defects in the cross-sectional morphology were found when the laser line energy exceeded 23.1 J/mm. The optimal shear stress of 4.17 MPa was obtained with a laser line energy of 20.16 J/mm2.
- Mechanical anchoring was observed near the joint interface, and the chemical bonding (M-O, M-C) formed on the steel surface mainly contributed to the strength of the PMMA–steel joints.
Author Contributions
Conceptualization, X.G.; data curation, Y.H., B.M. and Y.Z.; funding acquisition, X.G. and Y.Z.; investigation, Y.H. and B.M.; methodology, Y.H., X.G. and Y.Z.; project administration, X.G.; resources, X.G.; supervision, Y.H., B.M., Y.Z. and X.G.; visualization, Y.H.; writing—original draft, Y.H. and X.G.; writing—review and editing, X.G. All authors have read and agreed to the published version of the manuscript.
Funding
This work was partly supported by the Guangzhou Municipal Special Fund Project for Scientific and Technological Innovation and Development (202002020068, 202002030147).
Institutional Review Board Statement
Not applicable.
Informed Consent Statement
Not applicable.
Data Availability Statement
Not applicable.
Conflicts of Interest
No potential conflict of interest are reported by the authors.
References
- Liu, G.Q.; Gao, X.D.; Peng, C.; Liu, X.H.; Huang, Y.J.; Zhang, Y.X.; You, D.Y. Tensile resistance, microstructures of intermetallic compounds, and fracture modes of the welded steel/aluminum joints produced using laser lap welding. Trans. Nonferrous Met. Soc. China 2020, 30, 2639–2649. [Google Scholar] [CrossRef]
- Zou, X.; Huang, L.; Chen, K.; Jiang, M.; Zhang, S.; Wang, M.; Hua, X.; Shan, A. Surface Structuring via Additive Manufacturing to Improve the Performance of Metal and Polymer Joints. Metals 2021, 11, 567. [Google Scholar] [CrossRef]
- Prakash, S.; Kumar, S. Determining the suitable CO2 laser based technique for microchannel fabrication on PMMA. Opt. Laser Technol. 2021, 139, 107017. [Google Scholar] [CrossRef]
- Su, Y.; Zhao, G.Y.; Zhao, Y.G.; Meng, J.B.; Li, C.X. Multi-objective optimization of cutting parameters in turning AISI 304 austenitic stainless steel. Metals 2020, 10, 217. [Google Scholar] [CrossRef] [Green Version]
- Katayama, S.; Kawahito, Y. Laser direct joining of metal and plastic. Scipta Mater. 2008, 59, 1247–1250. [Google Scholar] [CrossRef]
- Haddadi, F.; Abu-Farha, F. Microstructural and Mechanical Performance of Aluminum to Steel High Power Ultrasonic Spot Welding. J. Mater. Process. Technol. 2015, 225, 262–274. [Google Scholar] [CrossRef]
- Wang, Z.; Wang, Y.; Du, X.; Zhou, Y.; Heng, Y.; Zong, L. Experimental research on bearing capacity of joint of acrylic and stainless steel. J. Southeast Univ. 2016, 46, 105–109. [Google Scholar]
- Lindner, T.; Saborowski, E.; Scholze, M.; Zillmann, B.; Lampke, T. Thermal spray coatings as an adhesion promoter in Metal/FRP joints. Metals 2018, 8, 769. [Google Scholar] [CrossRef] [Green Version]
- Pramanik, A.; Basak, A.K.; Dong, Y.; Sarker, P.K.; Uddin, M.S.; Littlefair, G.; Dixit, A.R.; Chattopadhyaya, S. Joining of carbon fibre reinforced polymer (CFRP) composites and aluminium alloys-a review. Compos. Part A-Applien. Sci. Manuf. 2017, 101, 1–29. [Google Scholar] [CrossRef] [Green Version]
- Nagatsuka, K.; Xiao, B.; Wu, L.; Nakata, K.; Saeki, S.; Kitamoto, Y.; Iwamoto, Y. Resistance spot welding of metal/carbon-fibre-reinforced plastics and applying silane coupling treatment. Sci. Technol. Weld. Join. 2018, 23, 181–186. [Google Scholar] [CrossRef]
- Dong, L.; Chen, W.; Hou, L.; Wang, J.; Song, J. Metallurgical and mechanical examinations of molybdenum/graphite joints by vacuum arc pressure brazing using Ti-Zr filler materials. J. Mater. Process. Technol. 2017, 249, 39–45. [Google Scholar] [CrossRef]
- Balle, F.; Eifler, D. Statistical test planning for ultrasonic welding of dissimilar materials using the example of aluminum-carbon fiber reinforced polymers (CFRP) joints. Mater. Und Werkst. 2012, 43, 286–292. [Google Scholar] [CrossRef]
- Derazkola, H.A.; Elyasi, M. The influence of process parameters in friction stir welding of Al-Mg alloy and polycarbonate. J. Manuf. Process. 2018, 35, 88–98. [Google Scholar] [CrossRef]
- You, D.Y.; Gao, X.D.; Katayama, S. Review of laser welding monitoring. Sci. Technol. Weld. Join. 2014, 19, 181–201. [Google Scholar] [CrossRef]
- Gisario, A.; Veniali, F.; Barletta, M.; Tagliaferri, V.; Vesco, S. Laser transmission welding of poly (ethylene terephthalate) and biodegradable poly (ethylene terephthalate)—Based blends. Opt. Lasers Eng. 2017, 90, 110–118. [Google Scholar] [CrossRef]
- Jia, L.; Yang, H.F.; Wang, Y.S.; Zhang, B.C.; Liu, H.; Hao, J.B. Research on temperature assisted laser transmission welding of copper foil and polyethylene terephthalate ScienceDirect. J. Manuf. Process. 2020, 57, 677–690. [Google Scholar] [CrossRef]
- Wahba, M.; Kawahito, Y.; Katayama, S. Laser direct joining of AZ91D thixomolded Mg alloy and amorphous polyethylene terephthalate. J. Mater. Process. Technol. 2011, 211, 1166–1174. [Google Scholar] [CrossRef]
- Arkhurst, B.M.; Seol, J.B.; Lee, Y.S.; Lee, M.; Kim, J.H. Interfacial structure and bonding mechanism of AZ31/carbon-fiber-reinforced plastic composites fabricated by thermal laser joining. Composites 2019, 167, 71–82. [Google Scholar] [CrossRef]
- Chen, Y.J.; Yue, T.M.; Guo, Z.N. A new laser joining technology for direct-bonding of metals and plastics. Mater. Des. 2016, 110, 775–781. [Google Scholar] [CrossRef]
- Chen, Y.J.; Yue, T.M.; Guo, Z.N. Laser joining of metals to plastics with ultrasonic vibration. J. Mater. Process. Technol. 2017, 249, 441–451. [Google Scholar] [CrossRef]
- Chen, Y.J.; Yue, T.M.; Guo, Z.N. Fatigue behavior of titanium/PET joints formed by ultrasound-aided laser welding. J. Manuf. Process. 2018, 31, 356–363. [Google Scholar] [CrossRef]
- Chen, Y.J.; Yue, T.M.; Guo, Z.N. Combined effects of temperature field and ultrasonic vibration on bubble motion in laser joining of plastic to metal. J. Mater. Process. Technol. 2021, 288, 116848. [Google Scholar] [CrossRef]
- Liu, J.; Cui, W.F.; Shi, Y.; Zhu, H.Y.; Li, Z. Effect of surface texture and ultrasonic on tensile property of 316L/PET dissimilar joints. J. Manuf. Process. 2020, 50, 430–439. [Google Scholar] [CrossRef]
- Tan, X.H.; Zhang, J.; Shan, J.G.; Yang, S.L.; Ren, J.L. Characteristics and formation mechanism of porosities in CFRP during laser joining of CFRP and steel. Compos. Part B 2015, 70, 35–43. [Google Scholar] [CrossRef]
- Lambiase, F.; Genna, S. Laser-assisted direct joining of AISI304 stainless steel with polycarbonate sheets: Thermal analysis, mechanical characterization, and bonds morphology. Opt. Laser Technol. 2017, 88, 205–214. [Google Scholar] [CrossRef]
- Jung, K.W.; Kawahito, Y.; Katayama, S. Laser direct joining of carbon fiber reinforced plastic to stainless steel. Sci. Technol. Weld. Join. 2011, 16, 676–680. [Google Scholar] [CrossRef]
- Jung, D.J.; Cheon, J.; Na, S.J. Effect of surface pre-oxidation on laser assisted joining of acrylonitrile butadiene styrene (ABS) and zinc-coated steel. Mater. Des. 2016, 99, 1–9. [Google Scholar] [CrossRef]
- Jiao, J.; Wang, Q.; Wang, F.; Zan, S.; Zhang, W. Numerical and experimental investigation on joining CFRTP and stainless-steel using fiber lasers. J. Mater. Process. Technol. 2017, 240, 362–369. [Google Scholar] [CrossRef]
- Hussein, F.I.; Akman, E.; Oztoprak, B.G.; Gunes, M.; Gundogdu, O.; Kacar, E.; Hajim, K.I.; Demird, A. Evaluation of PMMA joining to stainless steel 304 using pulsed Nd:YAG laser. Opt. Laser Technol. 2013, 49, 143–152. [Google Scholar] [CrossRef]
- Hussein, F.I.; Salloomi, K.N.; Akman, E.; Hajim, K.I.; Demir, A. Finite element thermal analysis for PMMA/st.st.304 laser direct joining. Opt. Laser Technol. 2017, 87, 64–71. [Google Scholar] [CrossRef]
- Huang, Y.J.; Gao, X.D.; Ma, B.; Liu, G.Q.; Zhang, N.F.; Zhang, Y.X.; You, D.Y. Optimization of weld strength for laser welding of steel to PMMA using Taguchi design method. Opt. Laser Technol. 2021, 136, 106726. [Google Scholar] [CrossRef]
- Schricker, K.; Diller, S.; Bergmann, J.P. Bubble formation in thermal joining of plastics with metals. Procedia CIRP 2018, 74, 518–523. [Google Scholar] [CrossRef]
- He, Y.; Jin, X. Vibration Properties of a Steel-PMMA Composite Beam. Shock. Vib. 2015, 6554, 1–7. [Google Scholar] [CrossRef]
- Hao, K.D.; Liao, W.; Zhang, T.D.; Gao, M. Interface formation and bonding mechanisms of laser transmission welded composite structure of PET on austenitic steel via beam oscillation. Compos. Struct. 2020, 235, 111752. [Google Scholar] [CrossRef]
Figure 1.
(a) Experimental apparatus used for laser joining PMMA and steel and (b) schematic diagram of the laser light path. Adapted with permission from ref. [31]. Copyright 2021 Optics and Laser Technology.
Figure 1.
(a) Experimental apparatus used for laser joining PMMA and steel and (b) schematic diagram of the laser light path. Adapted with permission from ref. [31]. Copyright 2021 Optics and Laser Technology.
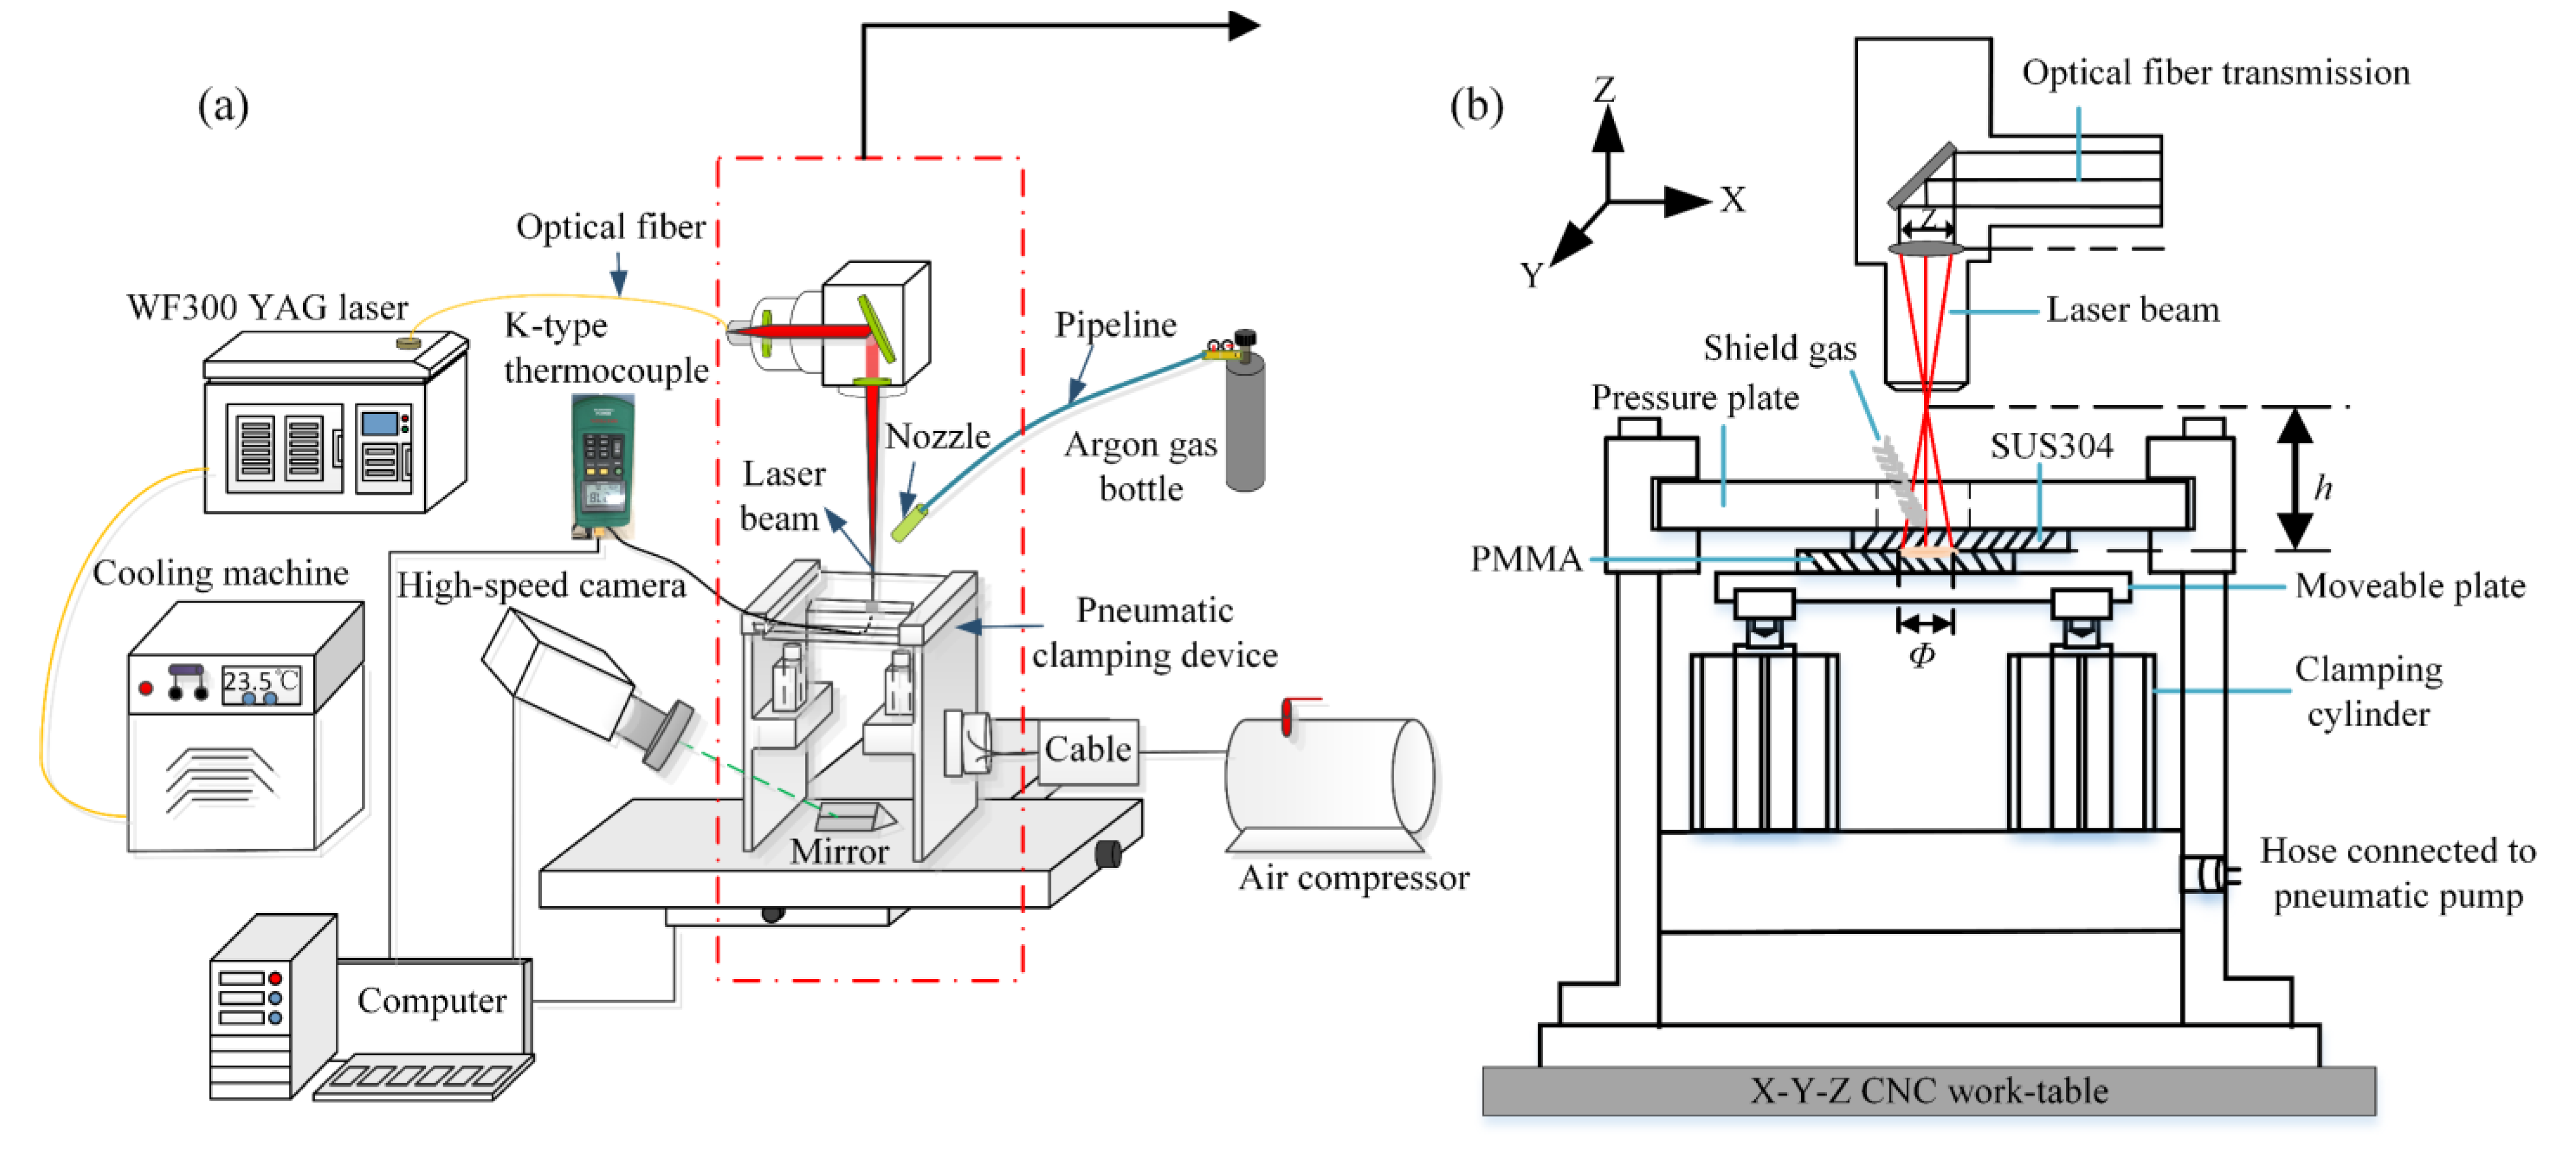
Figure 2.
High-speed camera images of the bubble formation and movement. (a) Formed molten pool and bubbles, (b) Growth of the molten layer and bubbles fluctuated, (c) Solidification process.
Figure 2.
High-speed camera images of the bubble formation and movement. (a) Formed molten pool and bubbles, (b) Growth of the molten layer and bubbles fluctuated, (c) Solidification process.
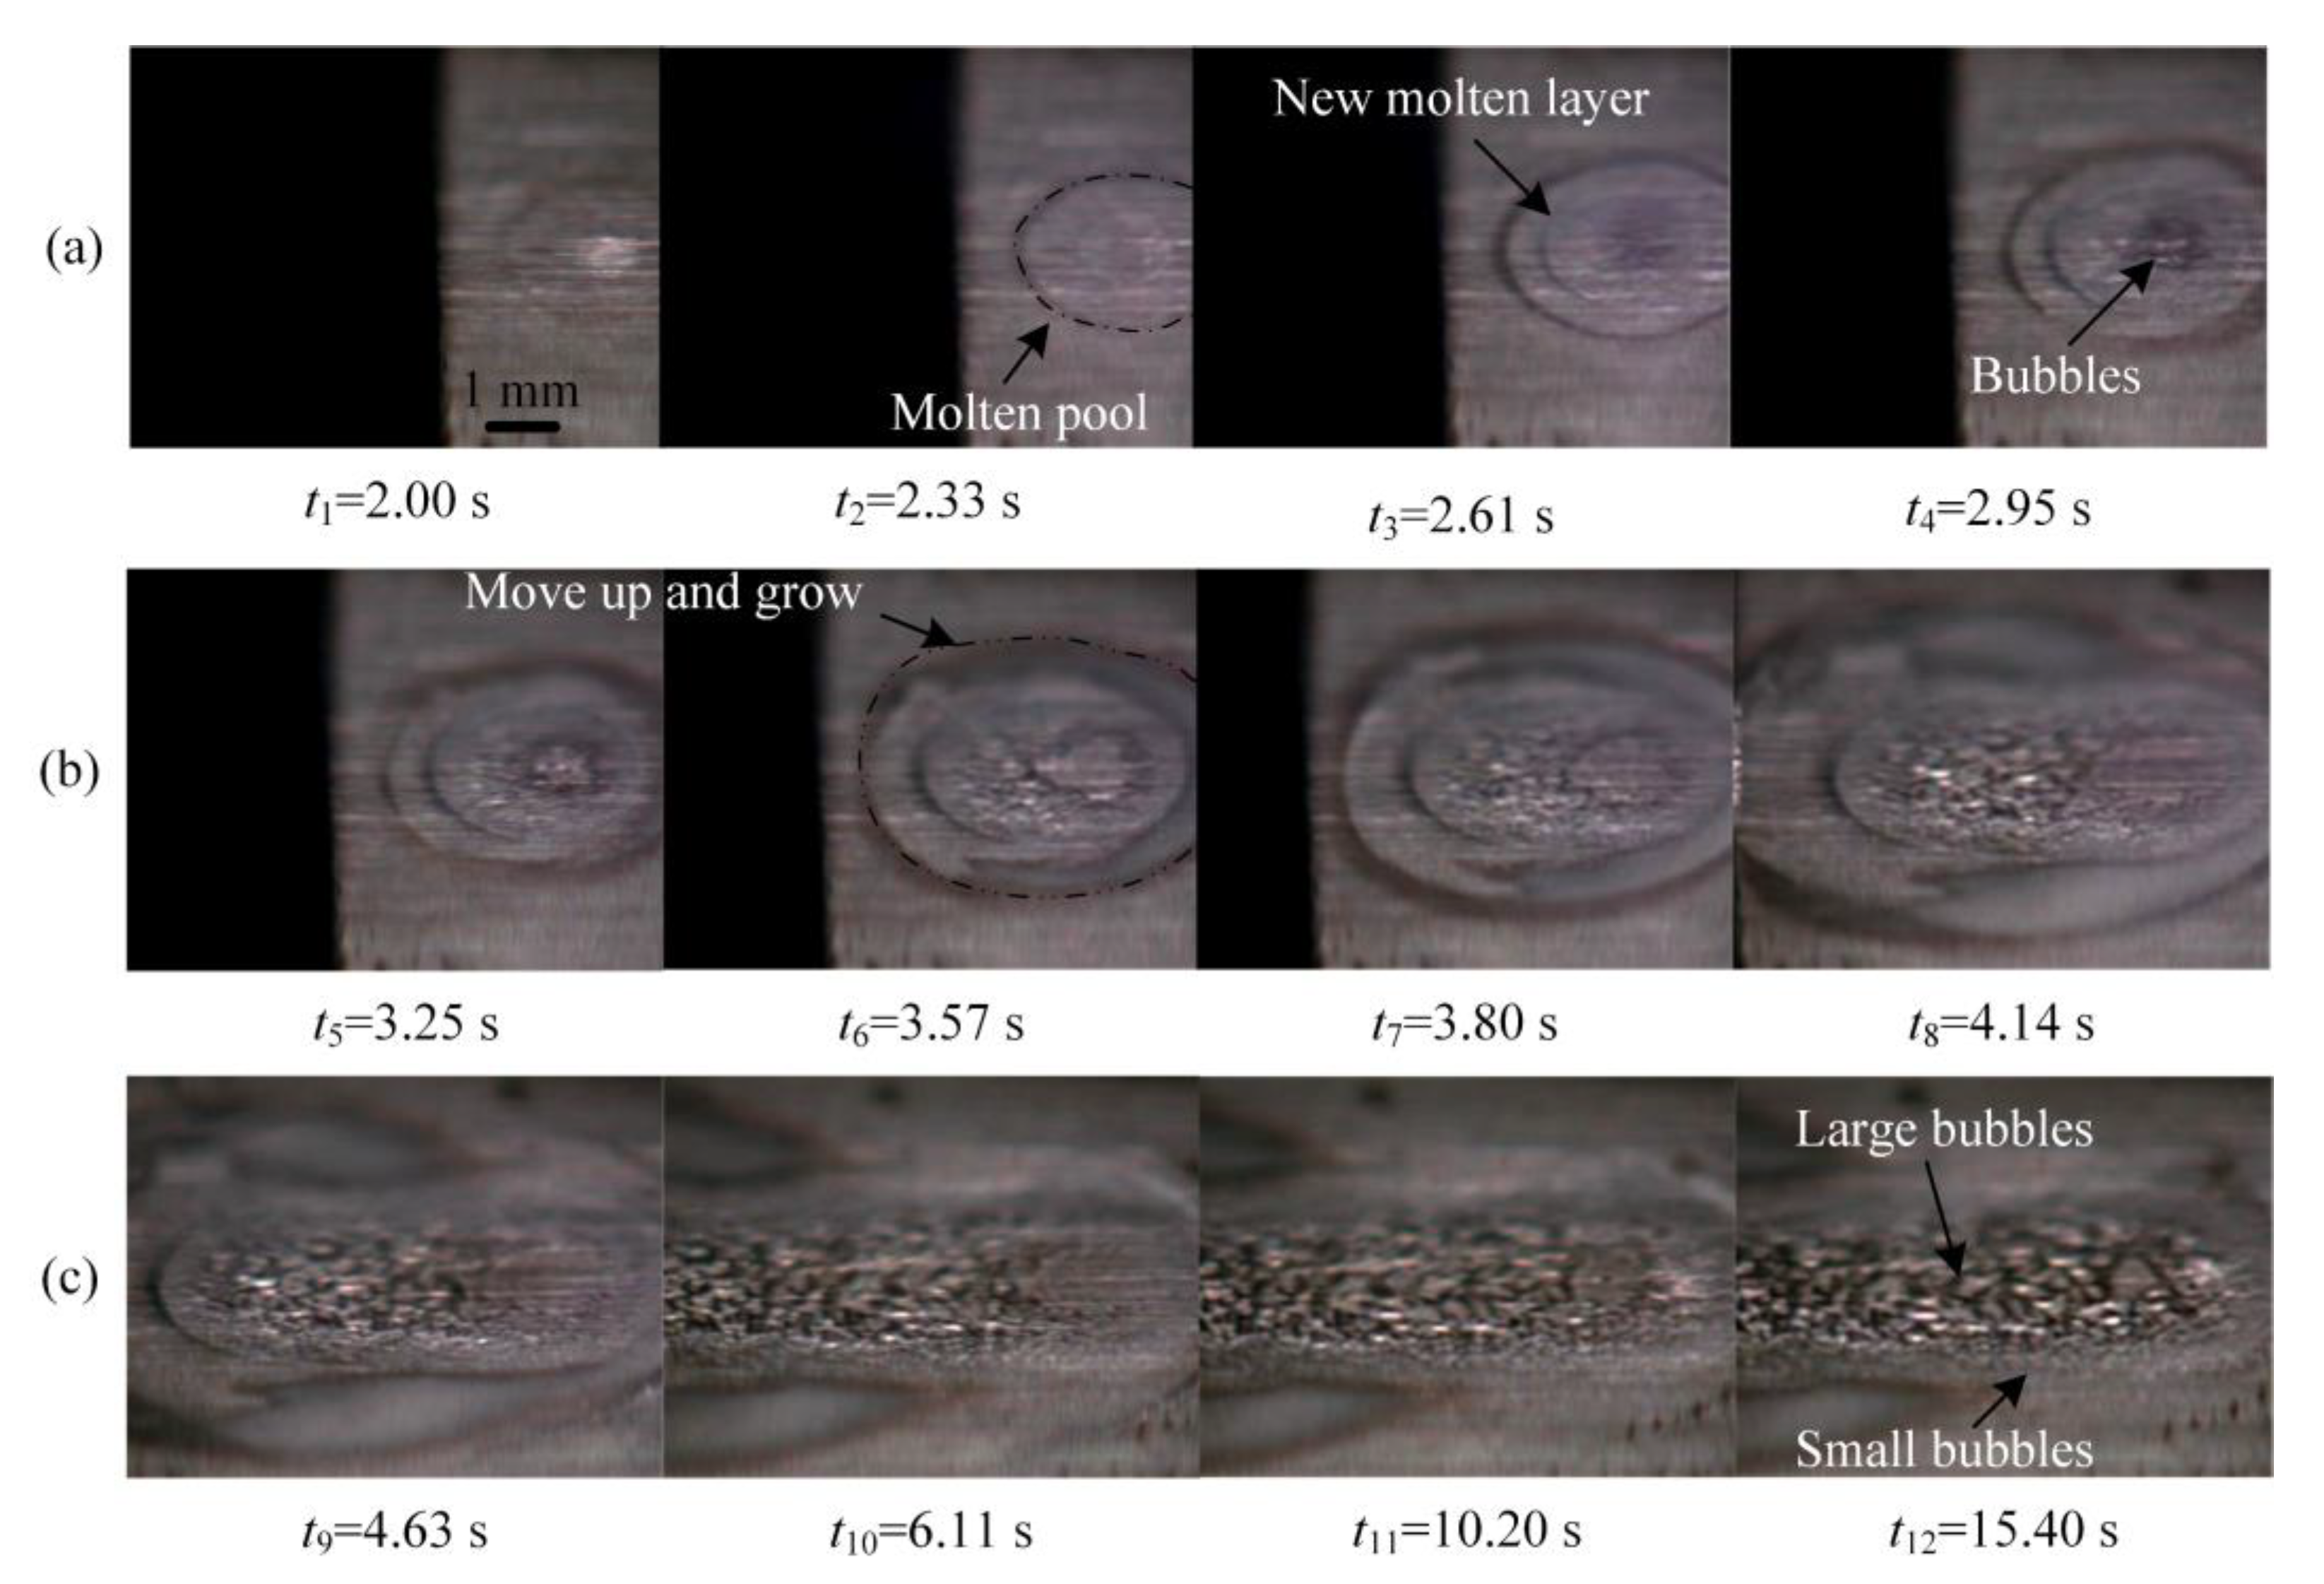
Figure 3.
Macroscopic weld surface morphologies of 25 hybrid joints samples: (a) 304 austenitic stainless sheet side and (b) PMMA side.
Figure 3.
Macroscopic weld surface morphologies of 25 hybrid joints samples: (a) 304 austenitic stainless sheet side and (b) PMMA side.
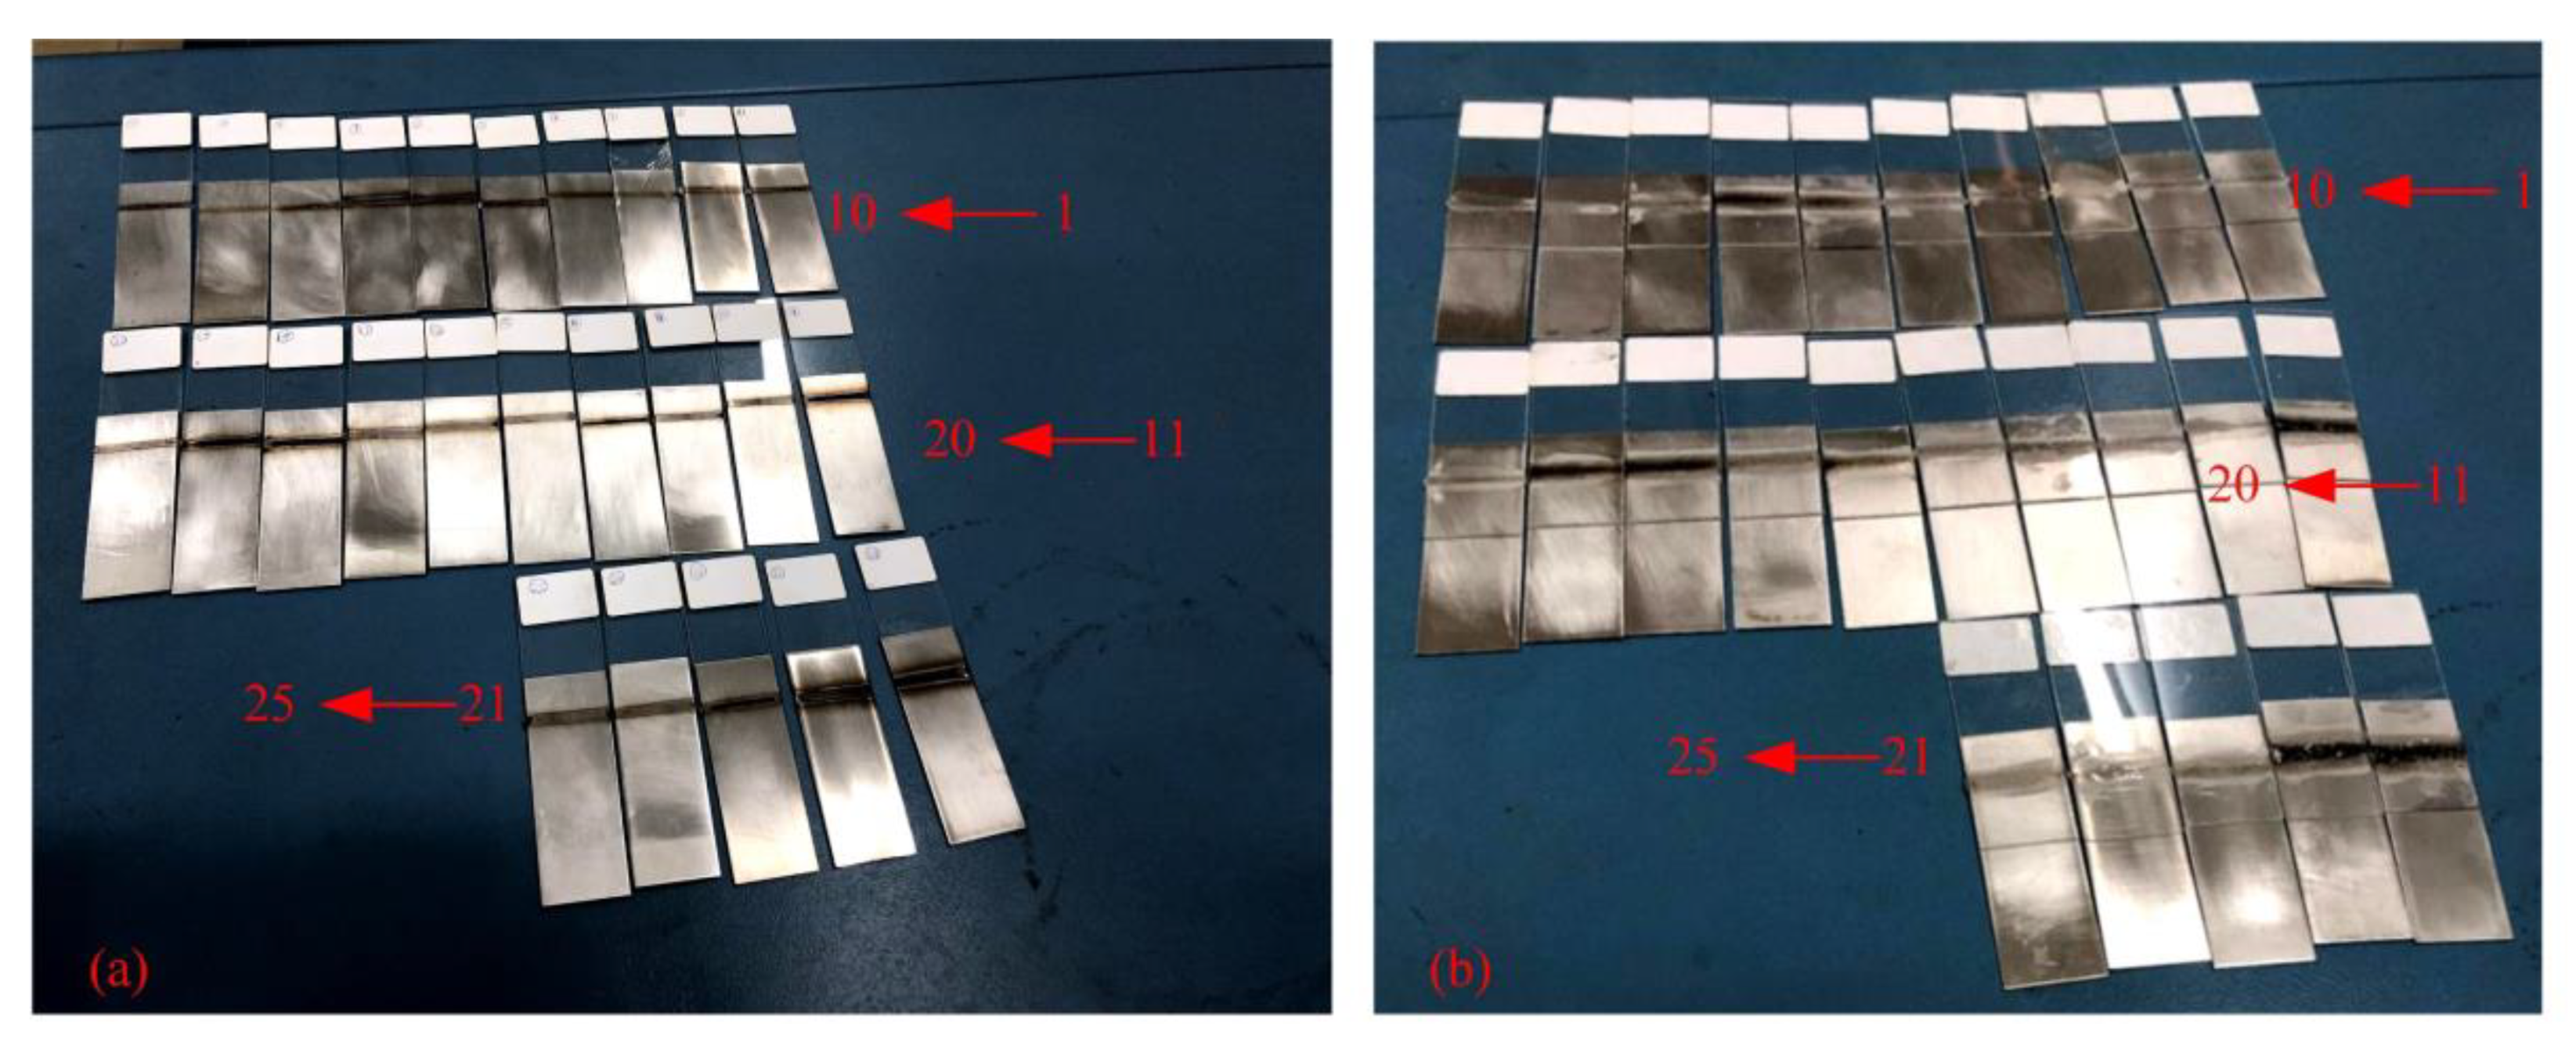
Figure 4.
OM images of the bubbles’ morphologies: (a) type I bubbles and (b) type II bubbles.

Figure 5.
Variation in the maximum temperature of the PMMA–steel joint with varying line energy.

Figure 6.
Optical micrographs of the surface morphologies and cross-sections of typical joints of NO.5, NO.17 and NO.7.
Figure 6.
Optical micrographs of the surface morphologies and cross-sections of typical joints of NO.5, NO.17 and NO.7.

Figure 7.
Relationship between the temperature and time of the typical specimens.
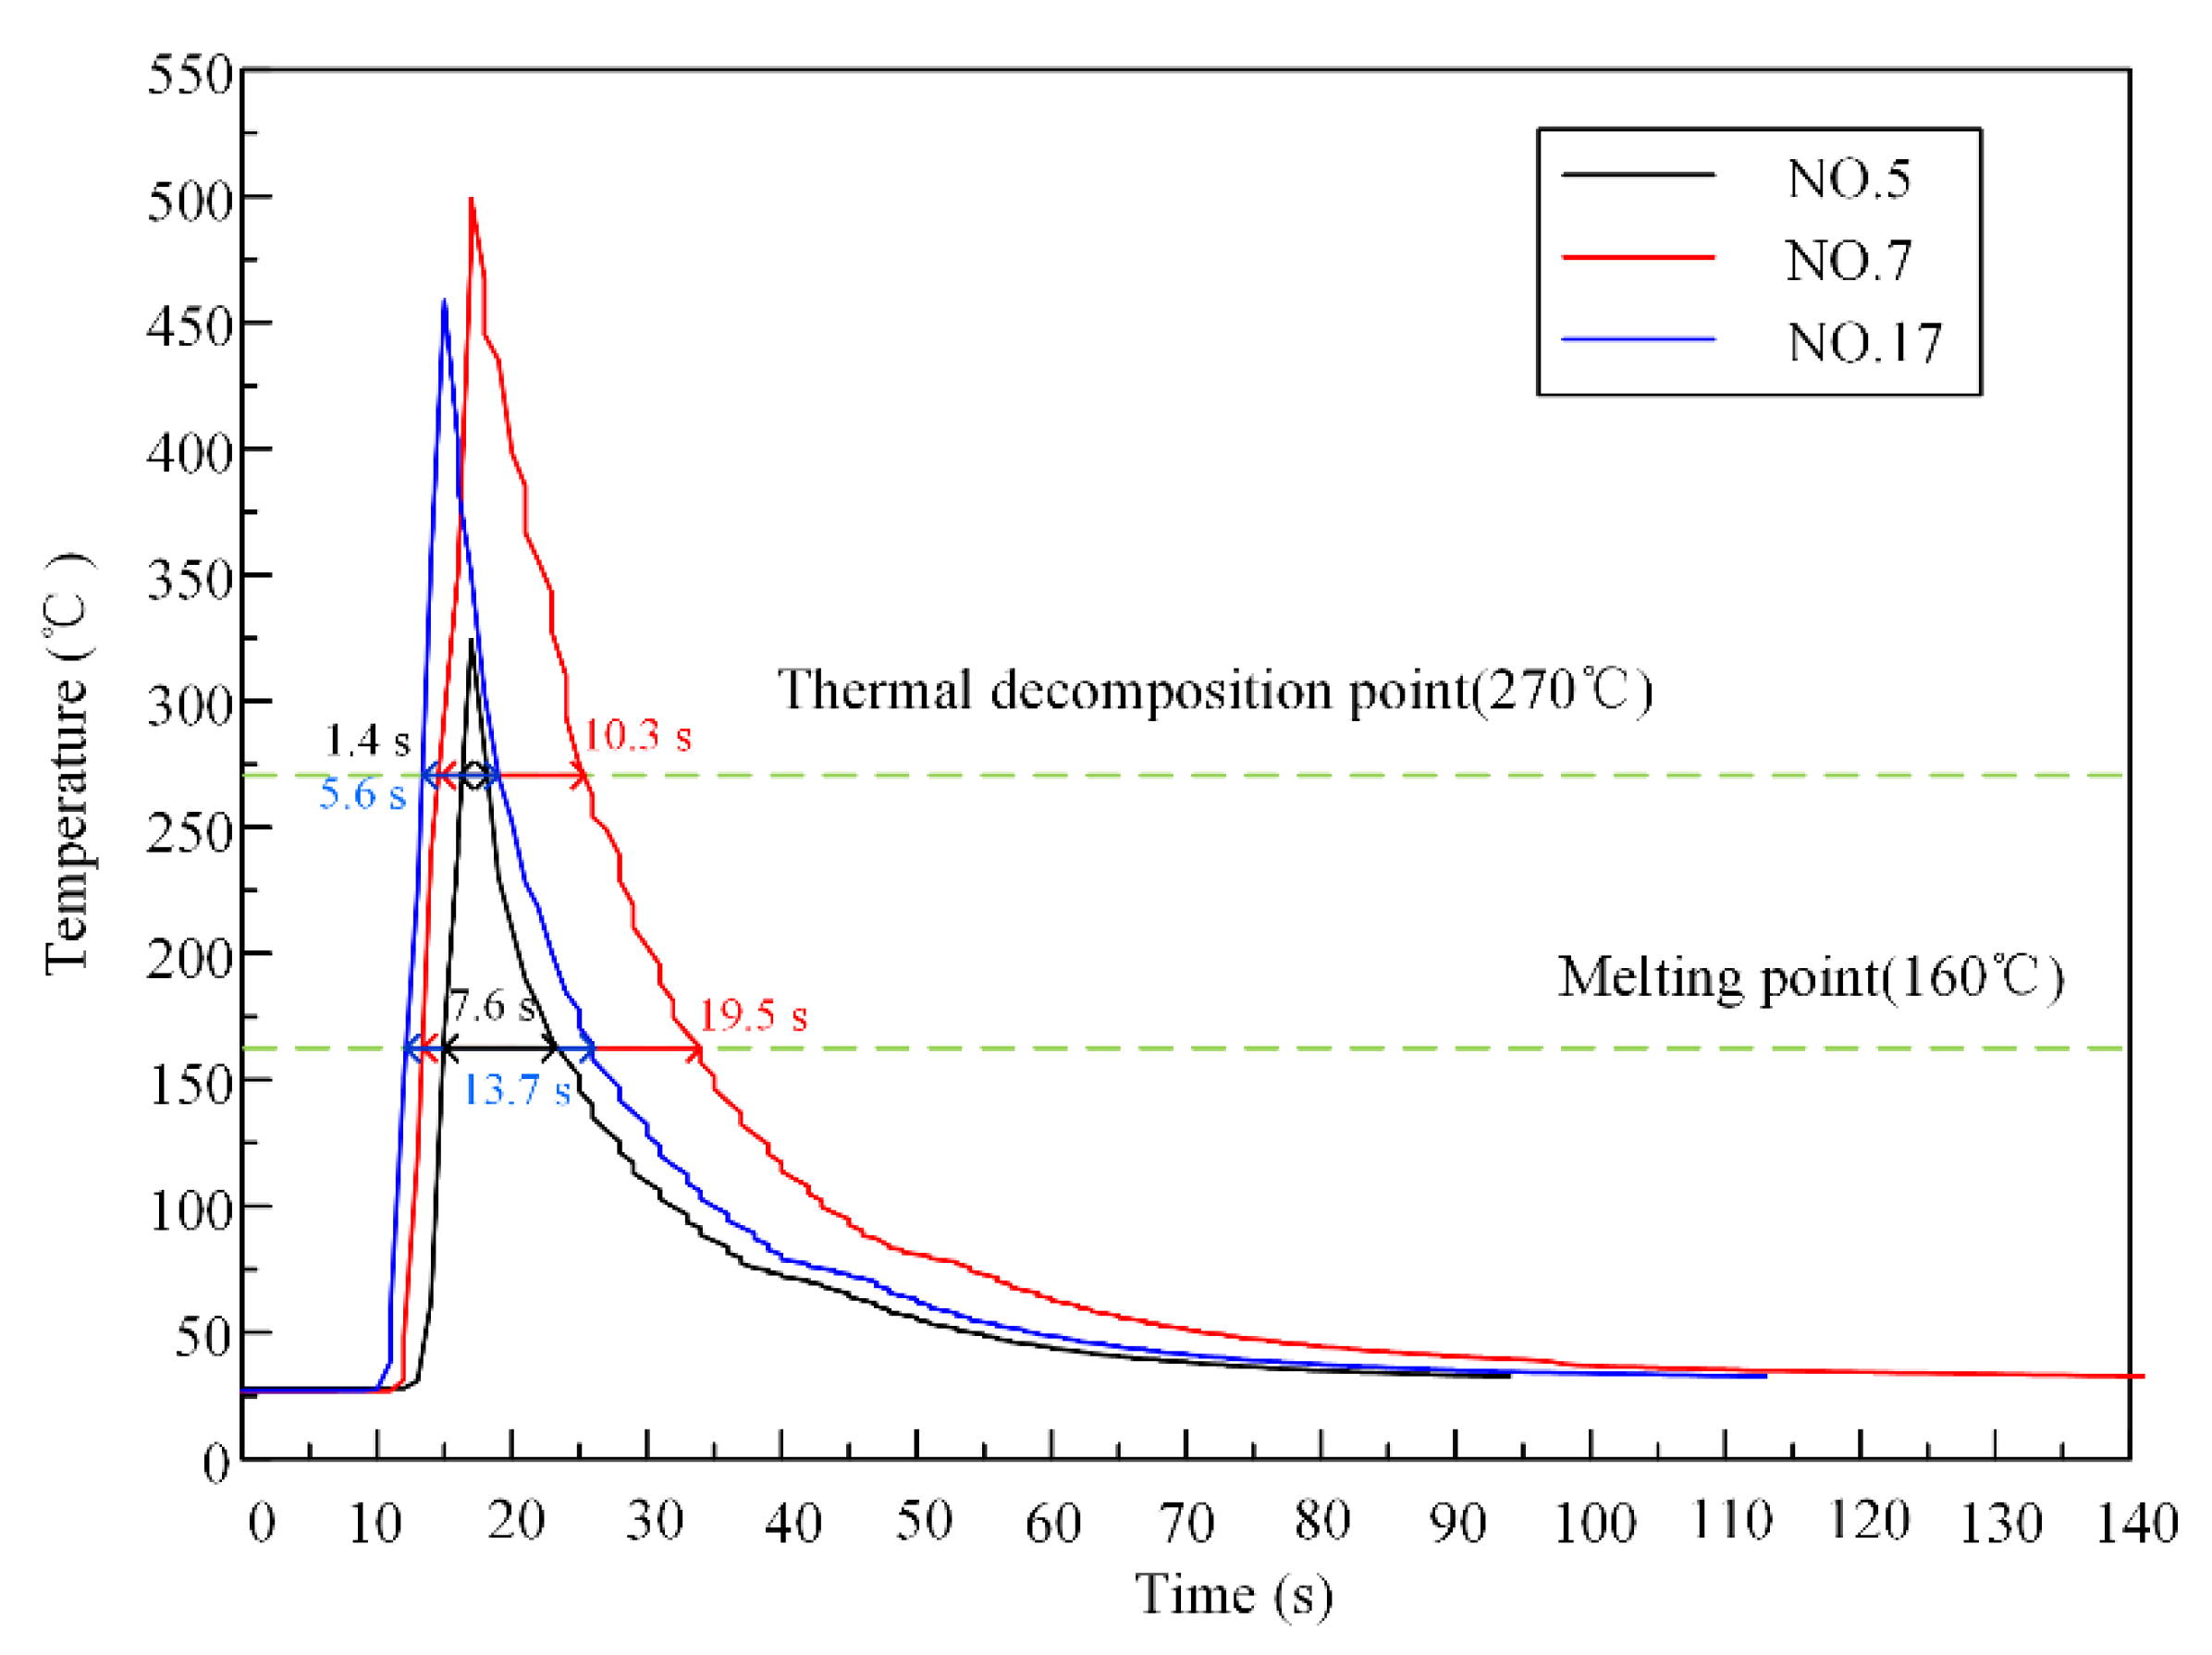
Figure 8.
Relationship between the melted depth and laser line energy for typical samples (NO.5, NO.7, and NO.17).
Figure 8.
Relationship between the melted depth and laser line energy for typical samples (NO.5, NO.7, and NO.17).
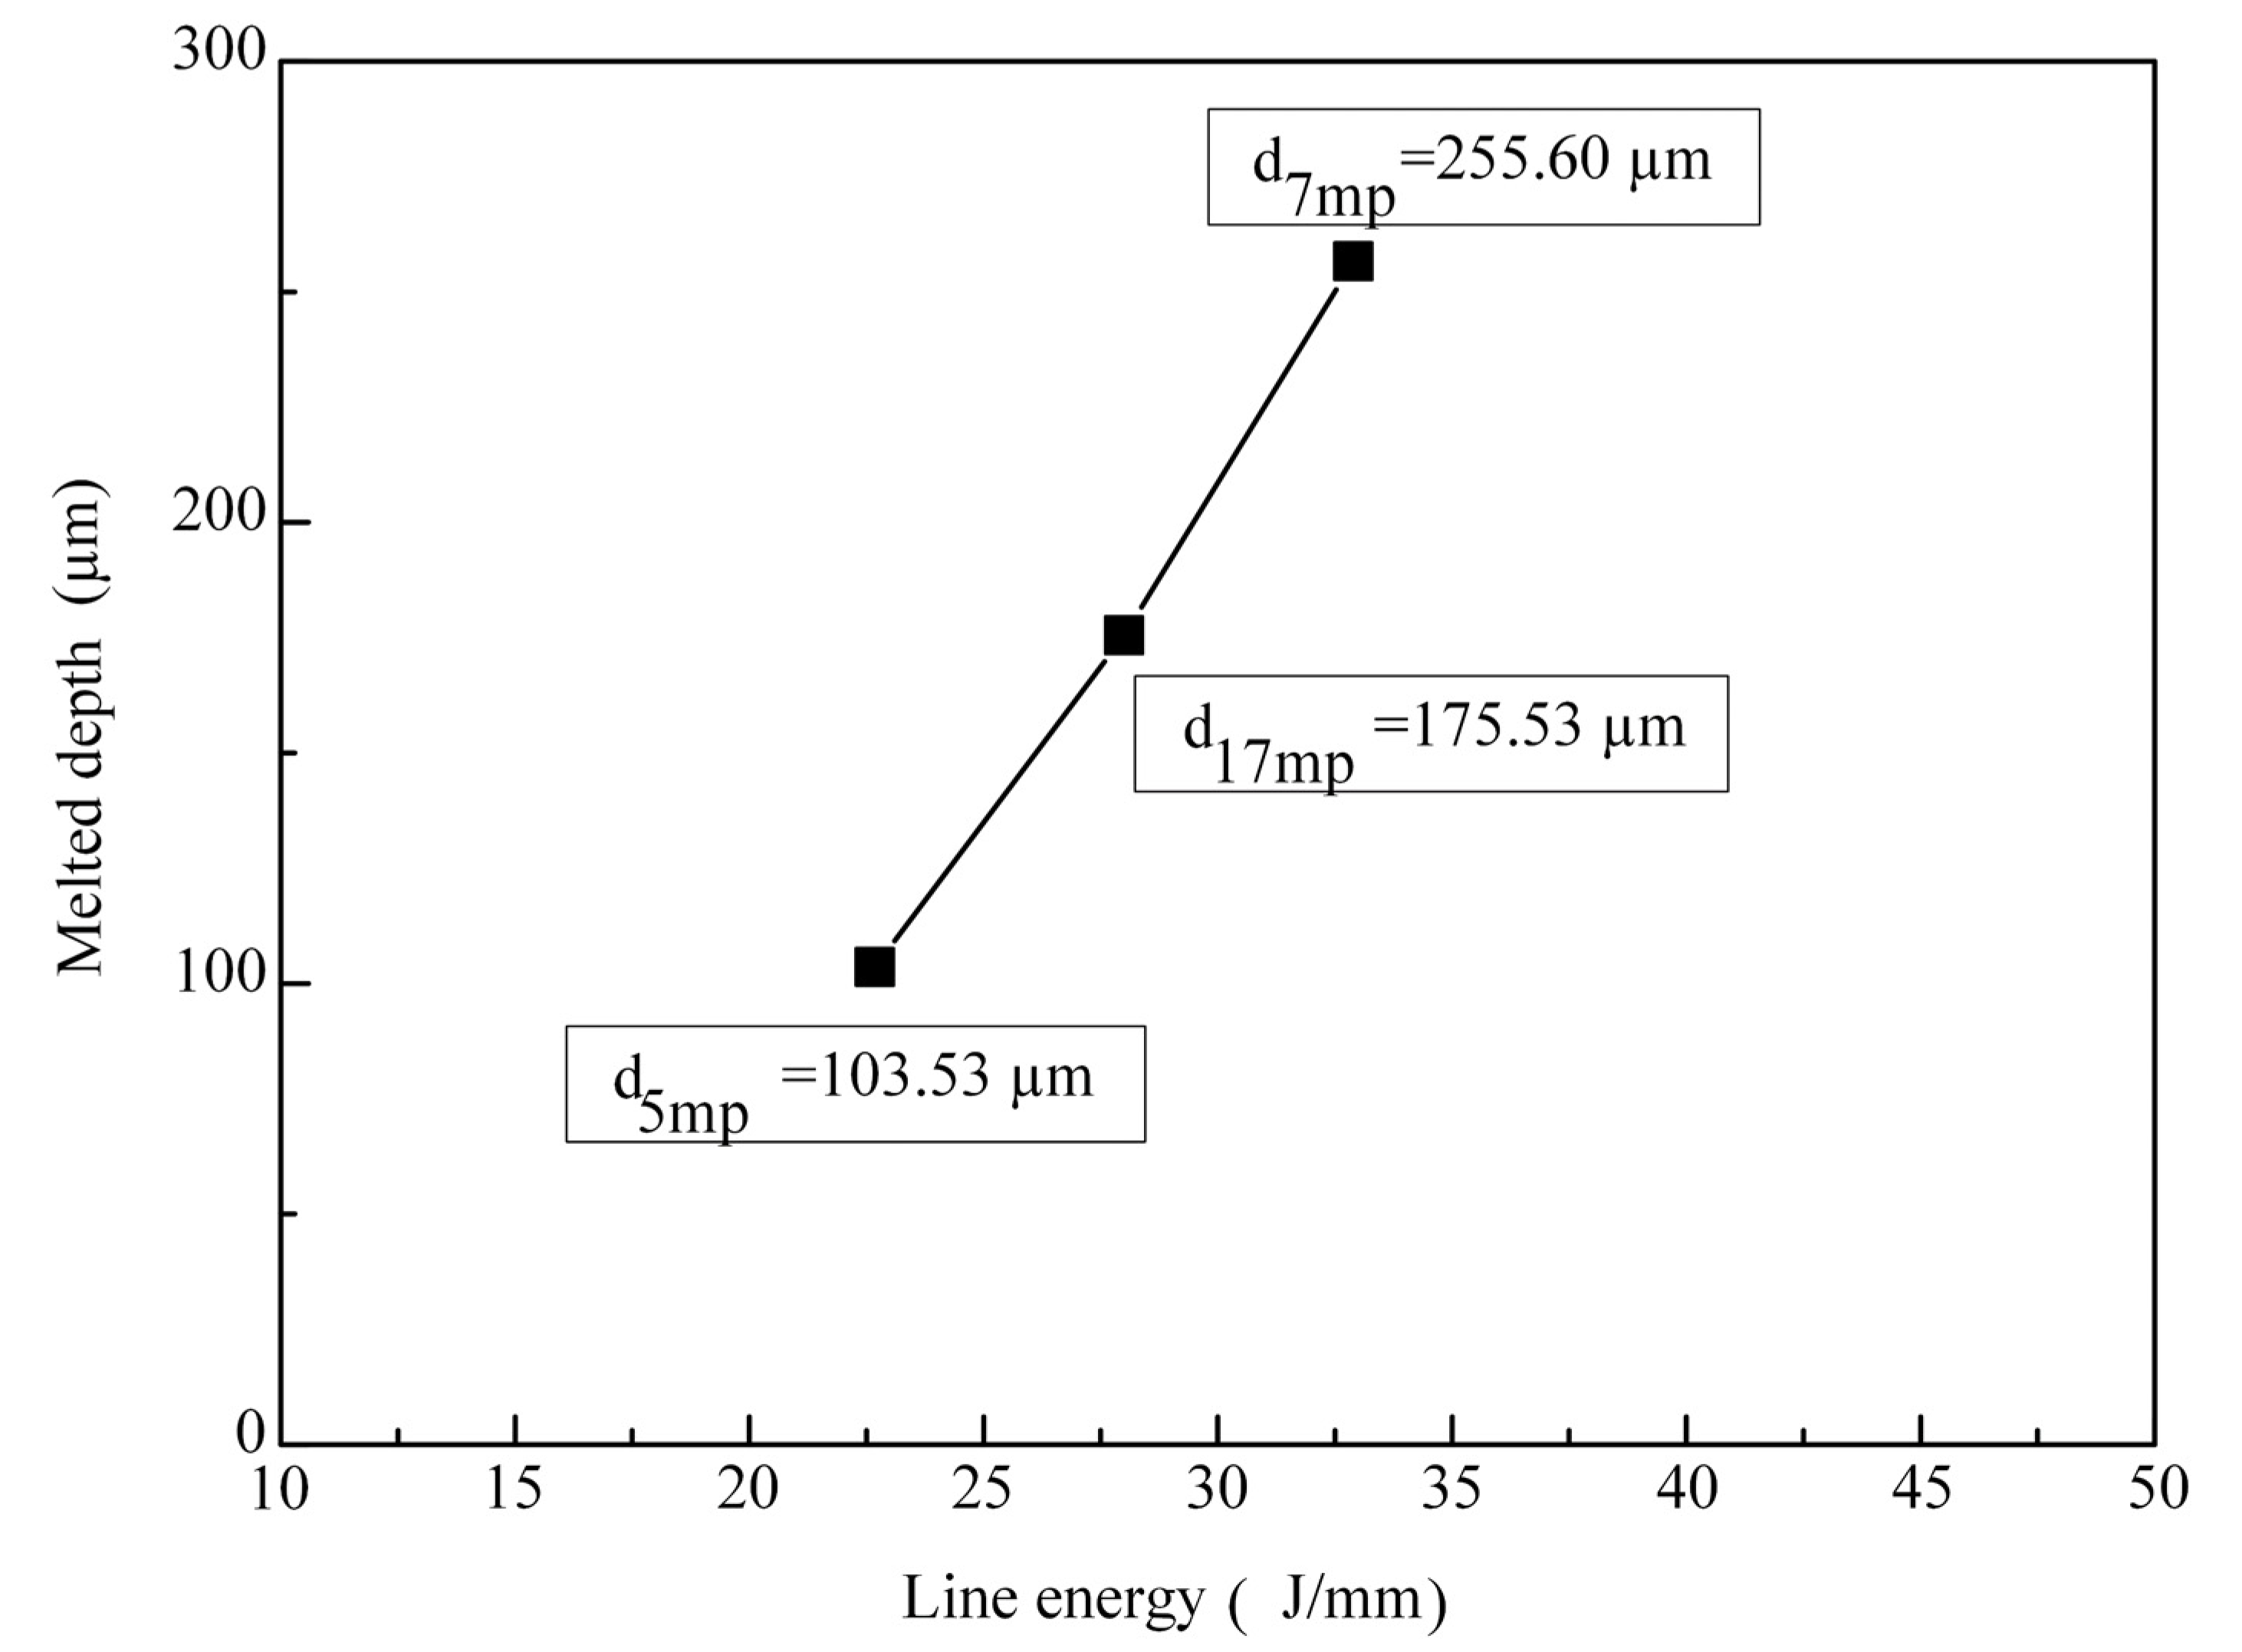
Figure 9.
(a) Cross-sectional SEM image of the joint interface for the NO.5 joint, (b) an enlarged view of the boxed region in (a,c) an enlarged view of the boxed region in (b).
Figure 9.
(a) Cross-sectional SEM image of the joint interface for the NO.5 joint, (b) an enlarged view of the boxed region in (a,c) an enlarged view of the boxed region in (b).

Figure 10.
(a) SEM image and (b) EDS mapping results of the fractured surfaces of the typical sample.
Figure 10.
(a) SEM image and (b) EDS mapping results of the fractured surfaces of the typical sample.
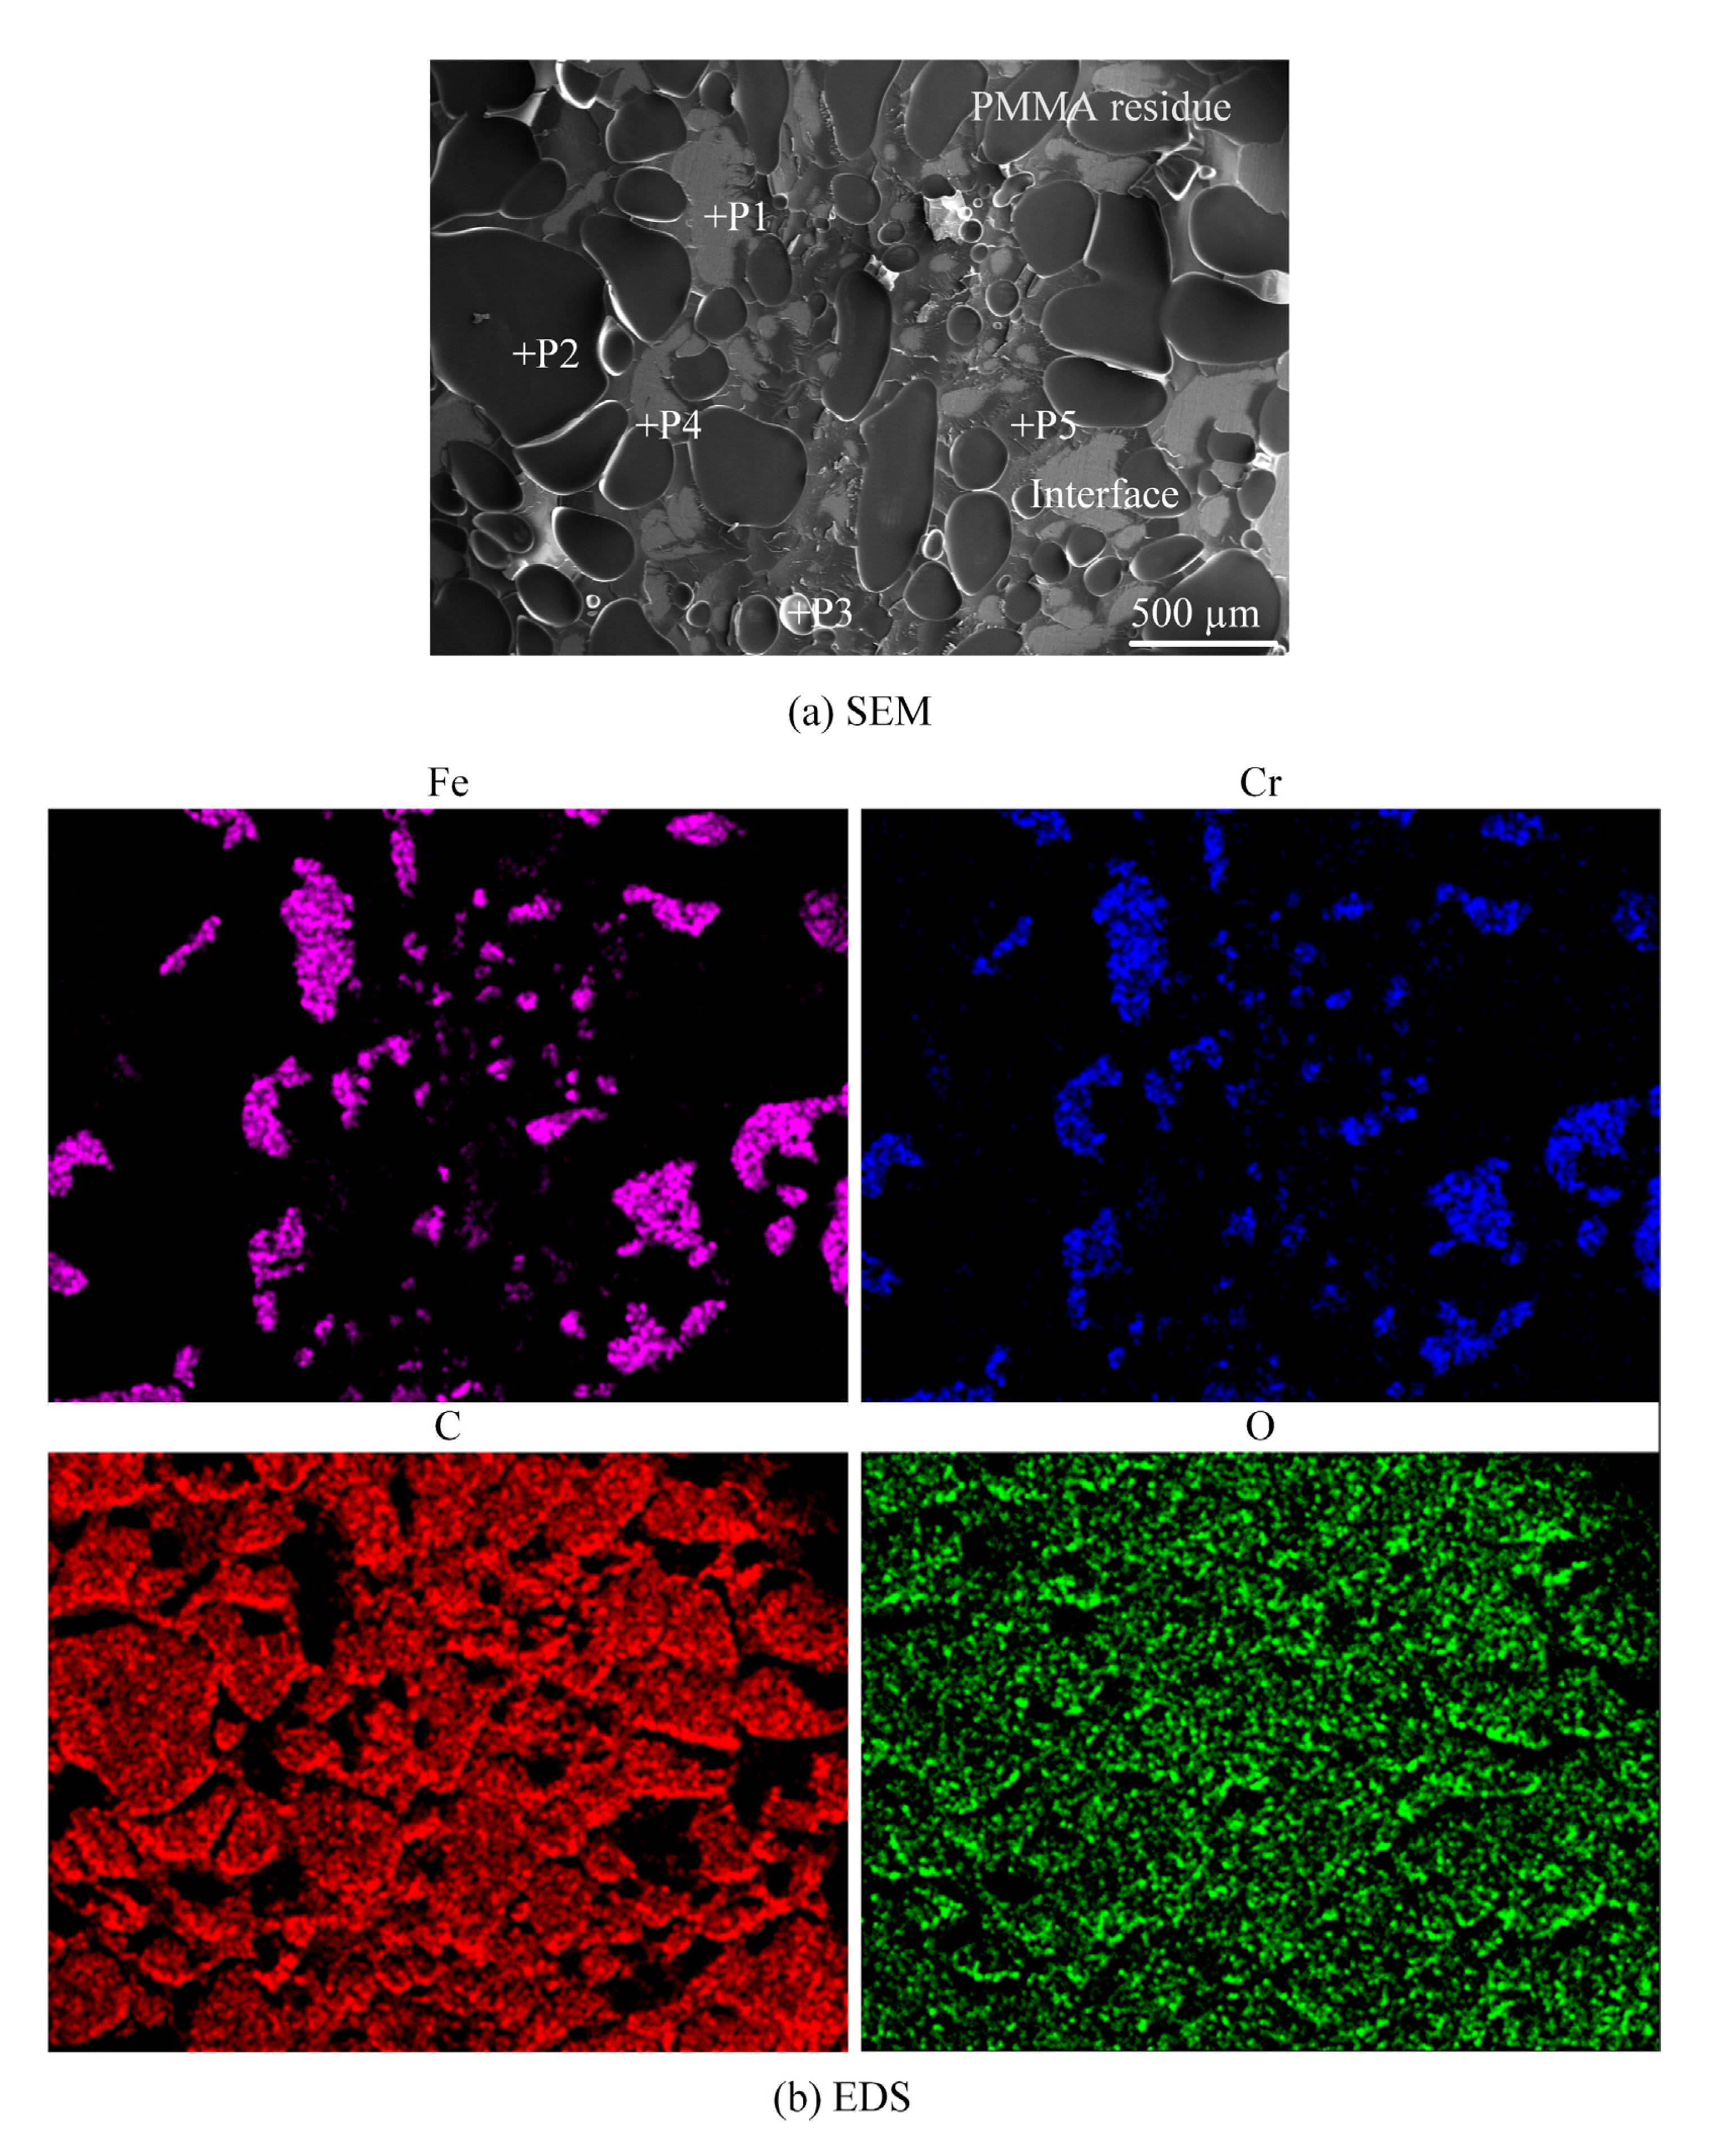
Figure 11.
Example of joint NO.11 to display the ImageJ measurement in the discolored zone: (a) image of joint NO.11 before the ImageJ analysis and (b) image of joint NO.11 after the ImageJ analysis.
Figure 11.
Example of joint NO.11 to display the ImageJ measurement in the discolored zone: (a) image of joint NO.11 before the ImageJ analysis and (b) image of joint NO.11 after the ImageJ analysis.

Figure 12.
Orthogonal experimental design results of the 25 conditions: measured total joint area and discolored zone.
Figure 12.
Orthogonal experimental design results of the 25 conditions: measured total joint area and discolored zone.
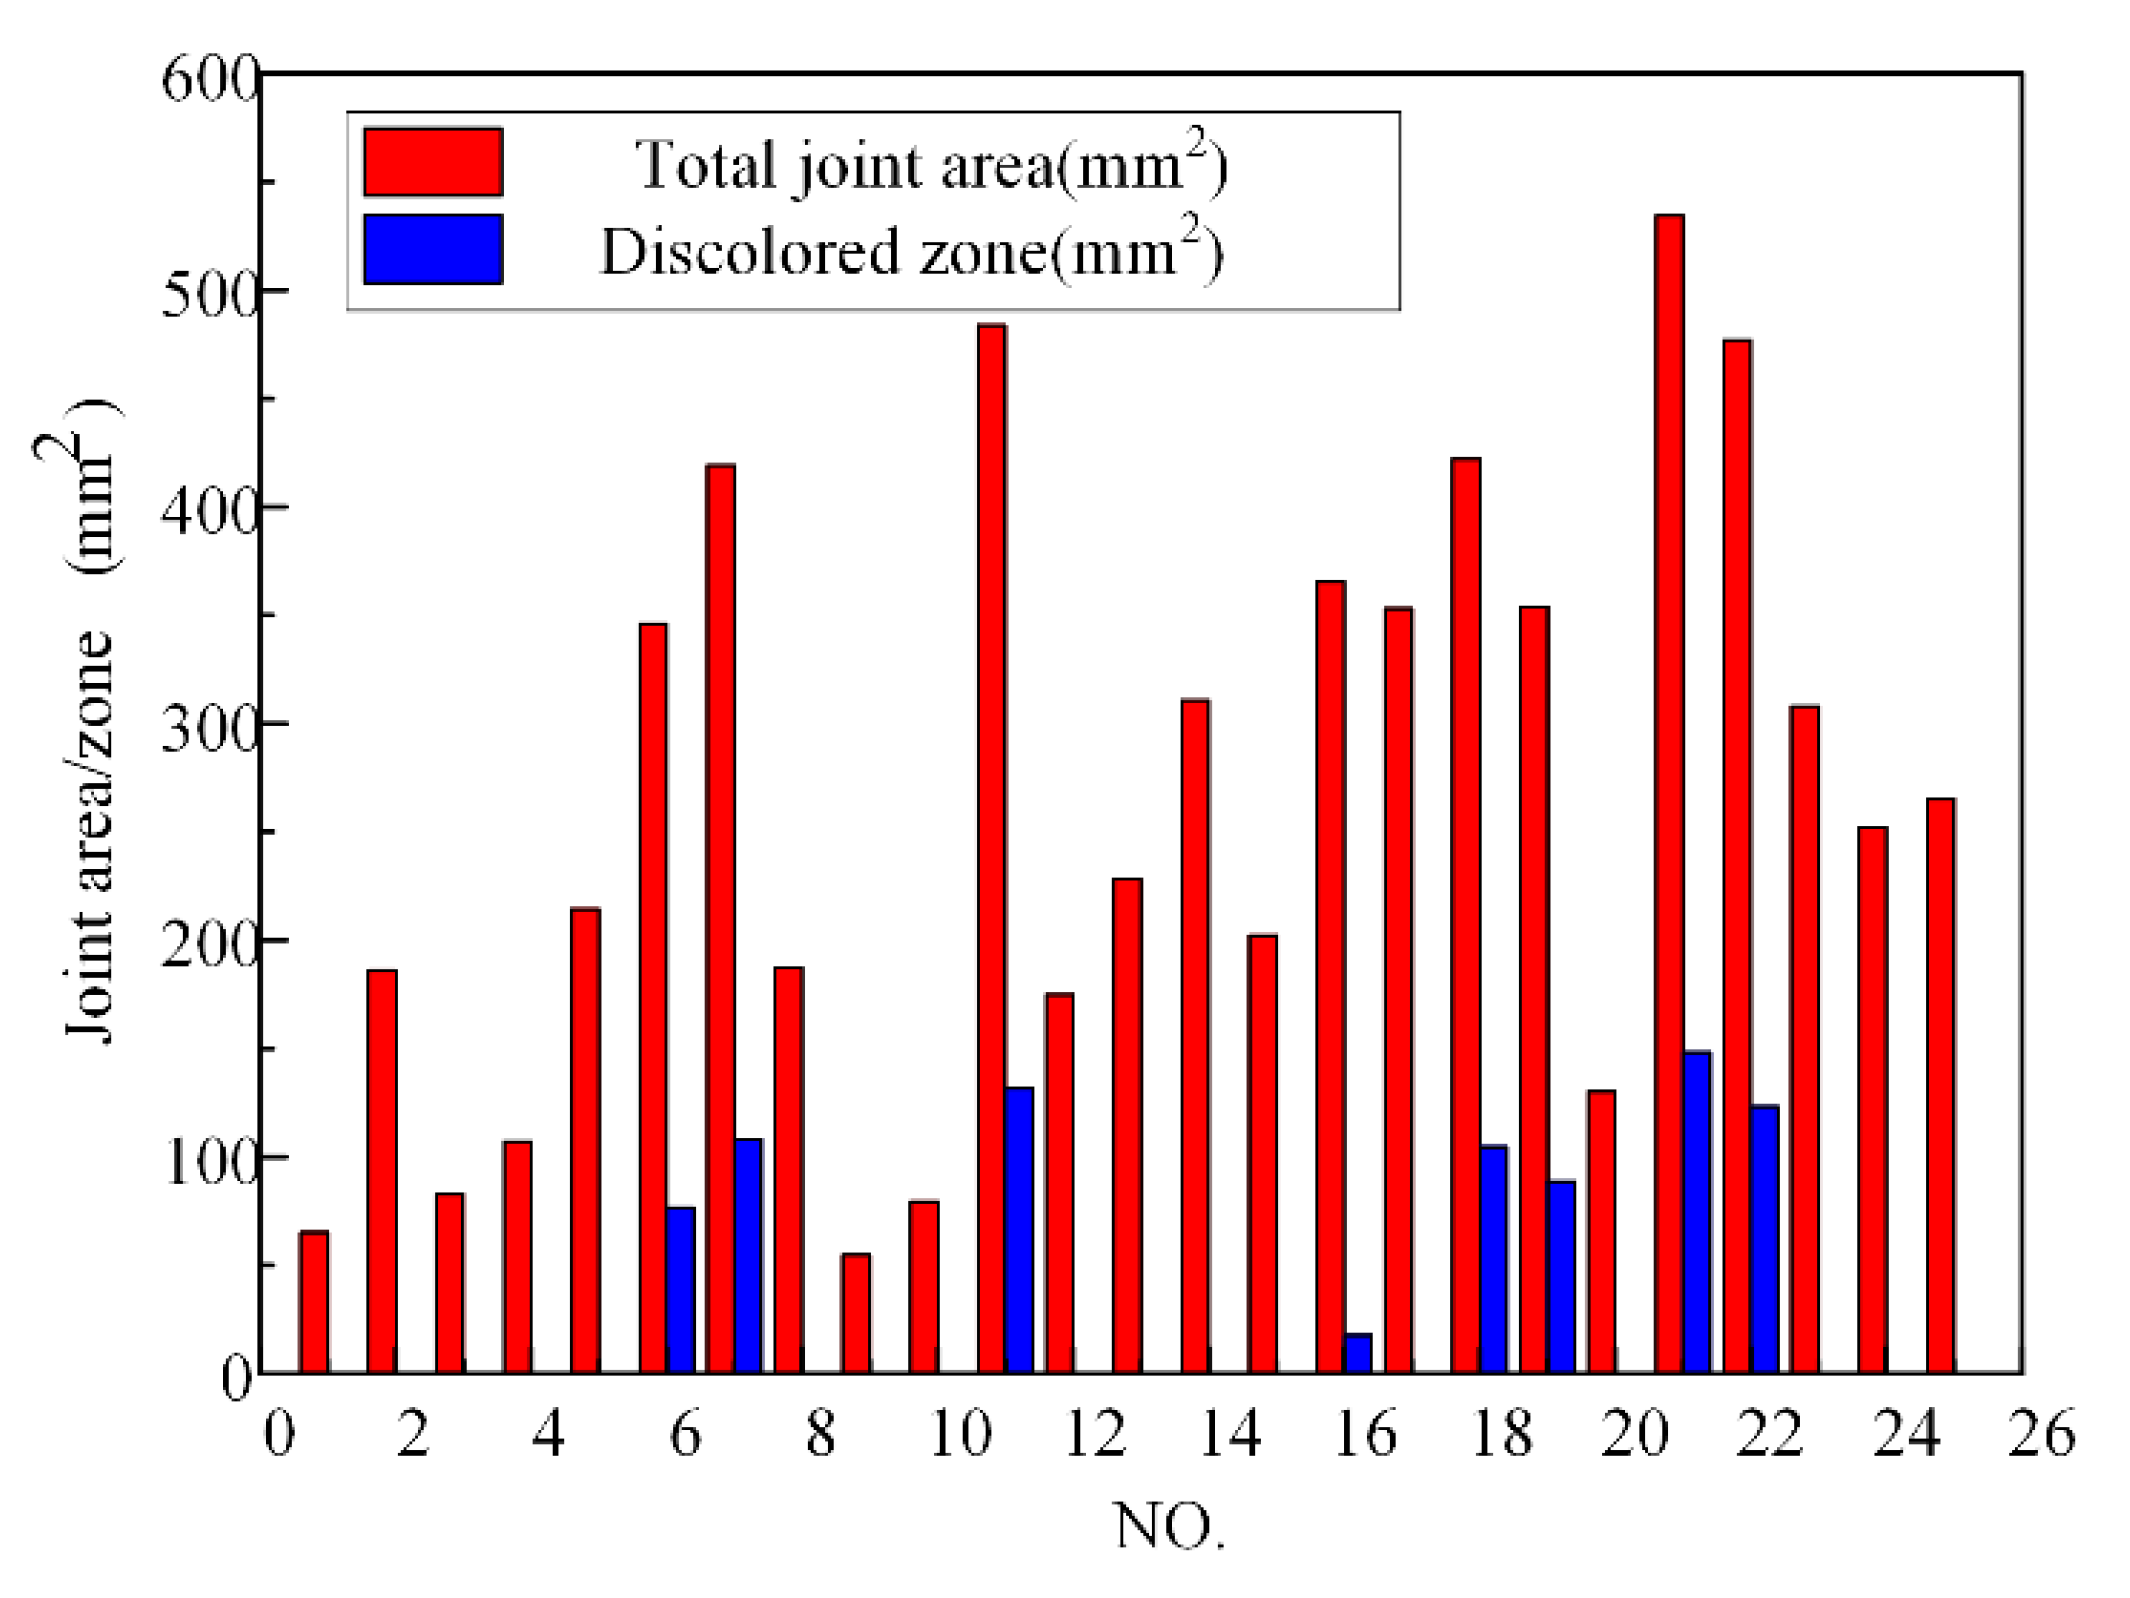
Figure 13.
Orthogonal experimental design result of the 25 conditions: measured shear force and calculated tensile shear stress.
Figure 13.
Orthogonal experimental design result of the 25 conditions: measured shear force and calculated tensile shear stress.

Table 1.
Physical and mechanical properties of polymethyl methacrylate and 304 austenitic stainless steel [31].
Table 1.
Physical and mechanical properties of polymethyl methacrylate and 304 austenitic stainless steel [31].
| Performance | Polymethyl Methacrylate | 304 Austenitic Stainless Steel |
|---|---|---|
| Density (kg/m3) | 1186–1190 | 7900 |
| Thermal conductivity (W·m−1·K−1) | 0.194–0.196 | 14 |
| Melting point (°C) | 540 | 1400–1425 |
| Specific heat (J·(kg·k)−1) | 1900 | 500 |
| Elongation at break (%) | 2–3 | 40 |
| Tensile strength (MPa) | 55–77 | 520 |
Table 2.
The laser parameters and their levels for welding PMMA–steel.
| Process Parameters | Units | Factor Levels | ||||
|---|---|---|---|---|---|---|
| 1 | 2 | 3 | 4 | 5 | ||
| Peak power (p) | kW | 1.4 | 1.6 | 1.8 | 2.0 | 2.2 |
| Welding speed (v) | mm/s | 3.0 | 3.5 | 4.0 | 4.5 | 5.0 |
| Beam diameter (Ф) | mm | 7.6 | 8.0 | 8.4 | 8.8 | 9.2 |
| Pulse frequency (f) | Hz | 5.0 | 6.0 | 7.0 | 8.0 | 9.0 |
| Pulse duration (t) | ms | 14.0 | 15.0 | 16.0 | 17.0 | 18.0 |
| Ar gas flows (q) | L/min | 10.0 | 15.0 | 20.0 | 25.0 | 30.0 |
Table 3.
Line energy and maximum temperature for each process parameter combination in the L25 orthogonal experimental design.
Table 3.
Line energy and maximum temperature for each process parameter combination in the L25 orthogonal experimental design.
| NO. | Process Parameters | Experimental Results | ||||||||
|---|---|---|---|---|---|---|---|---|---|---|
| P (kW) | v (mm/s) | h (mm) | Φ (mm) | f (Hz) | t (ms) | q (L/min) | LE (J/mm) | Tmax (°C) | F (N) | |
| 1 | 1.4 | 3.0 | 19 | 7.6 | 5 | 14 | 10 | 16.30 | 255.0 | 211 |
| 2 | 1.4 | 3.5 | 20 | 8.0 | 6 | 15 | 15 | 18.00 | 276.8 | 245 |
| 3 | 1.4 | 4.0 | 21 | 8.4 | 7 | 16 | 20 | 19.60 | 302.8 | 0 |
| 4 | 1.4 | 4.5 | 22 | 8.8 | 8 | 17 | 25 | 21.15 | 323.2 | 131 |
| 5 | 1.4 | 5.0 | 23 | 9.2 | 9 | 18 | 30 | 22.68 | 324.1 | 819 |
| 6 | 1.6 | 3.0 | 20 | 8.0 | 7 | 17 | 30 | 31.70 | 491.3 | 516 |
| 7 | 1.6 | 3.5 | 21 | 8.4 | 8 | 18 | 10 | 32.90 | 499.2 | 754 |
| 8 | 1.6 | 4.0 | 22 | 8.8 | 9 | 14 | 15 | 25.20 | 469.8 | 370 |
| 9 | 1.6 | 4.5 | 23 | 9.2 | 5 | 15 | 20 | 13.30 | 156.0 | 0 |
| 10 | 1.6 | 5.0 | 19 | 7.6 | 6 | 16 | 25 | 15.36 | 248.3 | 257 |
| 11 | 1.8 | 3.0 | 21 | 8.4 | 9 | 15 | 25 | 40.50 | 534.9 | 523 |
| 12 | 1.8 | 3.5 | 22 | 8.8 | 5 | 16 | 30 | 20.57 | 312.7 | 636 |
| 13 | 1.8 | 4.0 | 23 | 9.2 | 6 | 17 | 10 | 22.95 | 325.2 | 828 |
| 14 | 1.8 | 4.5 | 19 | 7.6 | 7 | 18 | 15 | 25.20 | 469.0 | 834 |
| 15 | 1.8 | 5.0 | 20 | 8.0 | 8 | 14 | 25 | 20.16 | 305.0 | 829 |
| 16 | 2.0 | 3.0 | 22 | 8.8 | 6 | 18 | 20 | 36.00 | 523.0 | 761 |
| 17 | 2.0 | 3.5 | 23 | 9.2 | 7 | 14 | 25 | 28.00 | 458.6 | 681 |
| 18 | 2.0 | 4.0 | 19 | 7.6 | 8 | 15 | 30 | 30.00 | 502.2 | 690 |
| 19 | 2.0 | 4.5 | 20 | 8.0 | 9 | 16 | 10 | 32.00 | 498.0 | 230 |
| 20 | 2.0 | 5.0 | 21 | 8.4 | 5 | 17 | 20 | 17.00 | 260.0 | 378 |
| 21 | 2.2 | 3.0 | 23 | 9.2 | 8 | 16 | 15 | 46.90 | 550.6 | 527 |
| 22 | 2.2 | 3.5 | 19 | 7.6 | 9 | 17 | 20 | 48.08 | 580.4 | 556 |
| 23 | 2.2 | 4.0 | 20 | 8.0 | 5 | 18 | 25 | 24.75 | 465.1 | 830 |
| 24 | 2.2 | 4.5 | 21 | 8.4 | 6 | 14 | 30 | 20.50 | 309.7 | 475 |
| 25 | 2.2 | 5.0 | 22 | 8.8 | 7 | 15 | 10 | 23.10 | 426.7 | 514 |
Table 4.
Chemical compositions (wt%) of representative elements of the analysis points in Figure 10a.
Table 4.
Chemical compositions (wt%) of representative elements of the analysis points in Figure 10a.
| Position Element | P1 | P2 | P3 | P4 | P5 | |
|---|---|---|---|---|---|---|
| (wt%) | ||||||
| Carbon | 0.000 | 70.065 | 61.742 | 73.838 | 62.677 | |
| Oxygen | 1.135 | 27.757 | 14.714 | 15.640 | 10.620 | |
| Fe | 81.645 | 1.658 | 18.318 | 8.578 | 21.400 | |
| Cr | 17.220 | 0.519 | 5.225 | 1.943 | 5.303 | |
Table 5.
Range analysis results of shear stress (σ).
| Target | Parameter | ||||||
|---|---|---|---|---|---|---|---|
| P (kW) | v (mm/s) | Φ (mm) | f (Hz) | t (ms) | q (L/min) | ||
| Shear stress (MPa) | 1.920 | 2.042 | 2.579 | 2.492 | 2.626 | 2.418 | |
| 1.913 | 2.175 | 2.175 | 2.452 | 1.383 | 1.469 | ||
| 3.106 | 2.093 | 1.741 | 1.694 | 1.817 | 2.152 | ||
| 2.008 | 1.327 | 2.191 | 2.258 | 2.248 | 2.113 | ||
| 1.891 | 3.200 | 2.151 | 1.942 | 2.763 | 2.685 | ||
| Rw | 1.215 | 1.873 | 0.838 | 0.798 | 1.380 | 1.216 | |
| Rank | 4 | 1 | 5 | 6 | 2 | 3 | |
Publisher’s Note: MDPI stays neutral with regard to jurisdictional claims in published maps and institutional affiliations. |
© 2021 by the authors. Licensee MDPI, Basel, Switzerland. This article is an open access article distributed under the terms and conditions of the Creative Commons Attribution (CC BY) license (https://creativecommons.org/licenses/by/4.0/).
Share and Cite
MDPI and ACS Style
Huang, Y.; Gao, X.; Ma, B.; Zhang, Y. Interface Formation and Bonding Mechanisms of Laser Welding of PMMA Plastic and 304 Austenitic Stainless Steel. Metals 2021, 11, 1495. https://doi.org/10.3390/met11091495
AMA Style
Huang Y, Gao X, Ma B, Zhang Y. Interface Formation and Bonding Mechanisms of Laser Welding of PMMA Plastic and 304 Austenitic Stainless Steel. Metals. 2021; 11(9):1495. https://doi.org/10.3390/met11091495
Chicago/Turabian StyleHuang, Yijie, Xiangdong Gao, Bo Ma, and Yanxi Zhang. 2021. "Interface Formation and Bonding Mechanisms of Laser Welding of PMMA Plastic and 304 Austenitic Stainless Steel" Metals 11, no. 9: 1495. https://doi.org/10.3390/met11091495
Note that from the first issue of 2016, this journal uses article numbers instead of page numbers. See further details here.