
The Relationship between Tribo-Magnetization and Wear State during Reciprocating Sliding

College of Safety and Ocean Engineering, China University of Petroleum, Beijing 102200, China
*
Author to whom correspondence should be addressed.
Metals 2021, 11(8), 1247; https://doi.org/10.3390/met11081247
Submission received: 2 July 2021
/
Revised: 27 July 2021
/
Accepted: 3 August 2021
/
Published: 5 August 2021
(This article belongs to the Special Issue Friction and Wear of Metals)
Abstract
:In order to investigate the relationship between tribo-magnetization and wear phenomena, a series of sliding-friction tests were carried out using a pin-on-block reciprocator type device, which was specially designed to generate sliding friction and to detect magnetic fields. The tribological behavior was observed by a charge-coupled device (CCD) camera in real time, and the magnetic signal was detected by using a two-axis magnetic sensor. It was found that as the friction continues, both the tangential and the normal components of magnetic field on the material surface increase gradually, and that both the average value of the tangential magnetic field ΔH(x)mean and the peak-to-peak value of the normal magnetic field Vpp at the wear scar clearly reflect changes of the wear state. Furthermore, in order to better understand the tribo-magnetization phenomenon, the changes of surface morphology and wear debris in different wear stages were analyzed. Moreover, an improved magnetic dipole model that considered the distribution of magnetic charges on the worn surface was established. This model can successfully describe the tribo-magnetization phenomenon during the stable wear stage, and should be useful for characterizing frictional wear phenomena in the future.
1. Introduction
Friction and wear are among the most common natural phenomena in our lives, and also the main cause for the failure of moving parts. There is a long history of research on friction and wear, bringing ever deeper understanding and providing a systematic and clear delineation of the main forms and mechanisms of wear. In recent years, the precise detection of wear has become a topic of interest for researchers [1,2]. At present, the main testing methods include acoustic emission, ultrasonic testing, ferrography, and spectral analysis [3,4,5]. The first two of these methods directly detect the worn parts to realize the evaluation of the wear state; the latter two methods are used mainly to monitor the wear state by analyzing the wear debris. Tribo-magnetization is a common phenomenon in friction, and has been studied to evaluate wear states [6,7]. Many researchers have begun to carry out related research on the mechanism and the behaviors of tribo-magnetization. A. Hase et al., Japanese researchers, have studied the relationship between friction magnetization and wear phenomena and the mechanism of magnetization in the initial stages of friction, and have concluded that the individual wear particles and aggregates of fine wear particles were all magnetized in one direction by tribological action, showing that the wear particles and transfer particles on the friction surface are the principal sources of magnetization [8,9,10]. Y. Chang has investigated that the effects of sliding speed and normal load on the surface magnetization mechanisms of self-mated iron pairs under the dry severe wear process, and has concluded that severe friction phenomena are the prerequisite conditions for tribo-magnetization [11]. F. Gao studied the phenomenon of friction magnetization with and without lubrication, and found that the increase in the magnetic field is greater for dry surfaces. Through the observation of magnetic domain structure, it is concluded that the generation and accumulation of surface plastic deformation is the main cause of tribo-magnetism [12,13]. In previous work, we have carried out a series of studies of the phenomenon of reciprocating friction magnetization under the condition of dry friction, studied the influence of the initial magnetic field, normal load and sliding speed on the tribo-magnetic effect with and without geomagnetic shielding, and found that the surface magnetic field at the wear scar position can be used to evaluate the wear state [14,15].
The magnetic dipole model is commonly used in the simulation of magnetic field. W. Zhou et al. have characterized magnetic flux leakage (MFL) of defects using a magnetic dipole model [16]. G. Han et al. have proposed a magnetic dual-dipole model to describe and evaluate the stress concentration in ferromagnetic materials [17]. In addition, to reveal the effect of the stress concentration on the induced MFL signals, Y. Wang et al. [18] have proposed an improved magnetic dipole model which is applicable to solve the inverse problem for estimating the shapes and sizes of the defects. However, all of these applications consider that the magnetic charge is only distributed on the two side walls of the defect.
The purpose of this paper is to further study the variation of a magnetic field on a sample surface during reciprocating sliding, and to reveal the relationship between tribo-magnetization and wear state. Therefore, in order to eliminate the influence of the residual magnetic field of a pin sample, non-magnetic material 316L was used for the pin sample, and the common engineering material 40CrMo with higher coercivity was used for the block sample. A high-sensitivity biaxial tunneling magneto-resistance (TMR) sensor was used to scan and detect the magnetic field on the surface of the specimen during the friction process. The relationship between the change of magnetic field and the wear state was then established by combining this result with the results of SEM and charge-coupled device (CCD) imaging. In addition, by reconsidering the magnetic charge distribution at the bottom of the wear scar, an improved magnetic dipole model is established, which differs from the traditional magnetic dipole model [19]. This model is more suitable for the simulation of the magnetic field distribution in the stable wear stage. The simulation results prove to be in remarkable agreement with the actual results.
2. Experimental Work
2.1. Specimen Preparation
A pin-on-block friction pair was used in the reciprocating sliding experiment without lubrication. In order to eliminate the influence of remanence of the pin sample on the tribo-magnetization effect of the block sample, the pin sample used in the experiments, a 6-mm diameter cylinder, was fabricated from non-magnetic stainless steel-316L (its hardness is 174 HBW). The block specimen was a plate of 100 mm× 25 mm× 8 mm made of 40CrMo steel (its hardness is 192 HBW) having good mechanical properties and high coercivity. This material is widely used for high-pressure manifolds and in oil drilling and production equipment. Its chemical composition is shown in Table 1. Before the test, the pin sample and block sample needed to be polished by 600, 800, 1000, and 1200 grades of SiC grinding paper to a surface roughness Ra of less than 3 μm and cleaned with ethanol or acetone in an ultrasonic cleaner. The block specimen was then demagnetized using an alternating current demagnetization method. Figure 1 presents the working position and shapes of the specimens. The block specimen was vertically placed and the scanning line AB, with a length of 120 mm, located 1 mm above the central axis of the block specimen, was selected.
2.2. Apparatus and Method
The experiments were carried out on a pin-on-block reciprocating sliding device. Figure 2 shows the schematic diagram of the experimental apparatus. The pin specimen is fixed on a pressure bar, which is perpendicular to the block surface and converts dead weight into positive pressure through a pulley mechanism. The block specimen is reciprocating in the wear region, relying on a crank connecting-rod mechanism. In the testing region, the variations of magnetic field were measured by a two-axis magnetic sensor that consists of two tunneling magneto resistive-type sensors; these have the merits of high sensitivity (12 mV/V/Gs) and a wide linear range. As shown in Figure 1, the normal component H(z) and the tangential component H(x) of the magnetic field were measured separately by a two-axis magnetic sensor. The positive direction of the normal magnetic field H(z) was chosen to point north. A CCD digital microscope was used to observe the tribological behavior.
All experiments were carried out with a reciprocating frequency of 1 Hz and a stroke of 20 mm at room temperature (about 20 °C) and normal relative humidity (about 45%) without lubrication. The normal load was 60 N, and the total number of reciprocating strokes was set 8000. During the experiment, both the pin and block specimen were separated after a certain number of reciprocating strokes, and wear debris on the specimen was carefully removed to reduce the impact of its own residual magnetic field. Then the magnetic field of the block specimen was detected along the scanning line AB (A to B) and a picture was taken by the digital microscope. The surface morphology of the wear scar was examined using an SEM. In addition, the magnetic field on the surface of the pin was measured before and after the tests, and the constant magnetic field value indicated that the pin sample was not magnetized (because the plastic deformation can lead to the transformation of austenite into martensite). Therefore, the effect of pin sample on friction magnetization can be ignored in this paper.
3. Results and Discussion
3.1. Variations of Magnetic Field during Reciprocating Sliding
Figure 3 and Figure 4 show the changes in both the tangential and normal components of magnetic field without lubrication under geomagnetic field conditions, respectively. The change in the magnetic field ΔH is the difference between the magnetic field after rubbing n times (Hn) and that before rubbing (H0): ΔH = Hn − H0.
Shown in Figure 3a and Figure 4a are the changes in the tangential and the normal magnetic fields in the wear scar during the whole friction process (ΔH(x) and ΔH(z), respectively). For up to 100 reciprocating cycles, the fluctuation amplitudes of both components are extremely weak and ΔH(x) in the wear scar is negative as shown in Figure 3b and Figure 4b. After 100 reciprocating cycles, both amplitudes gradually increase as the number of cycles increases.
ΔH(x) presents a U-curve that is below the zero line in the wear scar area. On both sides of the U-curve are peaks above the zero line. The two points where the ΔH(x) curve crosses the zero line are the starting and ending points of the wear scar. After 2500 reciprocating cycles, as shown in Figure 3c, the U-curve is concave inward. In other words, the amplitude of ΔH(x) in the middle of the wear scar decreases. In addition, around 400 reciprocating cycles, the growth of the tangential magnetic field in the wear scar becomes relatively slow and it seems difficult to find the rules easily (as shown in Figure 3c,d). Hence, in the following analysis, the mean value of the tangential magnetic field increment in the wear scar is proposed to characterize the changes of the magnetic field.
For the normal magnetic field ΔH(z), an oscillatory waveform appears in the wear scar area after 100 reciprocating cycles as shown in Figure 4a. The peak and valley of this waveform are at the starting and ending points of the wear scar, respectively, and the waveform between peak and valley is approximately a straight line. As the friction progresses, the peak-to-peak value (the difference between the peak and the valley) of the curve gradually increases (Figure 4b). The slope of the straight line increases with the number of cycles, more rapidly up to 400 cycles. After 400 reciprocating cycles, both the peak-to-peak value and the slope of the straight line increase slowly (Figure 4c,d).
Figure 5 shows the surface micromorphology of the wear scar at its ends and in its middle after 7000 cycles. It is obvious that material accumulates at the ends of the wear scar. As expected, the accumulation increases with increasing numbers of cycles. The phenomenon of material transfer and accumulation form plastic deformation and dislocation pinning effect, which hinders the increase in the magnetic field [20,21].
3.2. The Relationship between Magnetic Field and the Wear State
Figure 6 shows the dependence of ΔH(x)mean on the number of reciprocating cycles, where ΔH(x)mean is the average change of tangential magnetic field in the wear scar. Obviously, ΔH(x)mean goes through four different stages as the number of reciprocating cycles increases. At first it grows slowly; then it rapidly increases; finally, the growth rate gradually slows down, tending toward a near-constant growth rate. Based on these results, one may draw the following conclusions:
(1) Before point A, the OA section of the graph shows the initial friction period, and ΔH(x)mean is not significant. This is because the contact surfaces of the pin and block are not completely parallel. In fact, it appears that only part of the end face of the pin specimen is in contact with the block sample. Under the condition of low load, the surface of the block sample does not show a wear scar after the initial friction, and there is no wear debris at this time. With the further development of friction, fatigue wear occurs on the contact surface of the block specimen. At this stage, the variations of magnetic field can be explained by J-A theory [22,23,24,25]. The theory is that its magnetization state will change when the ferromagnetic component is subjected to stress—stress that will not only produce plastic deformation but also cause magnetostrictive effect. Therefore, the stress effect on the ferromagnetic component is equivalent to an effective magnetic field. The equivalent magnetic field under stress can be expressed as:
where θ is the angle between the applied stress and the equivalent magnetic field, λ is hysteresis coefficient, M is magnetization, ν is Poisson’s ratio, μ0 is the vacuum permeability, σ is the applied stress, and σ0 is the non-coaxial stress.
Reciprocating sliding of course causes the friction surface to be subjected to cyclic stress. The total magnetization M of the ferromagnetic material consists of two parts: one is the reversible magnetization Mrev caused by the bending of the domain wall; the other is the irreversible magnetization Mirr caused by the motion of the domain wall. The sum of the two parts constitutes the combined magnetization M: M = Mrev + Mirr. The dependence of magnetic field intensity on cyclic stress is shown in Figure 7.
Returning now to Figure 6:
(2) After point A, ΔH(x)mean increases rapidly until point B. Referring to Figure 8, it is found that point B corresponds exactly to the time when the wear scar is completely formed, so the A-to-B stage can be considered as the growth period of the wear scar. The width and depth of the wear scar increase during this period, and the boundary of the wear scar becomes clear. In addition, friction will produce some debris particles. At point B, the shape of the debris is sharp, and the particle size is large. The debris and the pin-block friction pair constitute a three-body wear mechanism, which has a high wear rate. Accordingly, ΔH(x)mean shows rapid growth from A to B.
After point B, the wear scar is completely formed. The width of the wear scar does not change further, but its depth increases slowly. Additionally, with the progress of the reciprocating sliding, the wear debris on the surface of the wear scar become smooth and the particle size of the wear debris becomes smaller. This fine wear debris acts as a lubricant, resulting in a decrease in wear rate and the attenuation of the growth rate of ΔH(x)mean. Therefore, B to C is a transitional period.
(3) Beyond point C, the coarse debris is ground repeatedly and is completely transformed into finer particles, some of which adhere to the surface of the wear scar. At the same time, because of friction heat, some fine black powder appears. Its admixture further reduces the frictional resistance, resulting in a decrease in wear rate. ΔH(x)mean then maintains a constant growth rate for a long period of time; this stage (C to D in Figure 6) is a stable wear period. The main mechanism of friction magnetization in the stable wear period is self-leakage magnetic field [11]. Figure 9 shows the micro morphology of the wear scar surface before and after point C.
Figure 10 shows the dependence of Vpp on the number of reciprocating cycles, where Vpp is the difference between the peak and the valley of the normal magnetic field curve in the wear scar. Compared with the dependence of ΔH(x)mean on the number of reciprocating cycles, Vpp follows the same trend. The curve of Vpp also appears four different stages as the number of reciprocating cycles increases and has the same transition points. Therefore, we conclude that changes of both the average value of tangential magnetic field intensity ΔH(x)mean and the peak-to-peak value of normal magnetic field intensity Vpp can, to a considerable extent, reflect the changes of wear state.
3.3. Magnetic Dipole Model
In this subsection, an improved magnetic dipole model, analogous to an electric dipole model, is proposed to simulate the magnetic field distribution in the stable wear stage. This model differs from traditional magnetic charge theory in that ferromagnetic components under the action of an external magnetic field accumulate opposite-polarity magnetic charges on two side walls that are perpendicular to the magnetization direction at the bottom of the defect, and the magnetic charges of opposite polarity cause the superposition of the magnetic field on the surface of the defect to form a leakage magnetic field [26,27]. The enhancement of the leakage magnetic field is the reason for the enhancement of tribo-magnetization in the stable wear stage. The distribution of the magnetic charges in the model is shown in Figure 11.
In typical plane dipole theory, it would be assumed that the magnetic charge exists only in the defect sidewalls perpendicular to the applied magnetic field, and that the sidewall polarities are equal and opposite. However, it is undeniable that the magnetic charge is also distributed at the bottom of the defect, where, however, the magnetic charge density is less. The bottom magnetic charges cannot be ignored in the wear scar because many tiny furrows exist there, especially in the early stage of the formation of wear scar defects. Each furrow is equivalent to a small new wear scar. We therefore establish a revised model.
In this model, a Cartesian coordinate system is selected, and the coordinate origin O is located on the upper surface of the workpiece at the midpoint above the wear scar, as indicated in Figure 10. The geomagnetic field is H, the length of the wear scar is 2b, and the depth of the scar is h. Therefore, the magnetic field intensity vectors of the surface element ds on both sides of the wear scar at point P are as follows:
where
is the vacuum permeability, and r1 and r2 are the distances from surface elements ds on both sides of the wall to the point P. The components of the magnetic field intensity vector of the surface element ds in the x and z directions at point P are as follows:
As shown in Figure 12b, a part of the magnetic charge is distributed on the bottom of the wear scar. For the next calculation, we assume that the magnetic charge is distributed only on the bottom of the wear scar. According to the characteristics of magnetic charge distribution, the closer to the edge line, the greater the magnetic charge density. Therefore, it can be assumed that the magnetic charge density is linearly distributed along the bottom of the wear scar, with the largest magnetic charge density appearing at the edge line and with the magnetic charge density in the middle of the wear scar being zero. The specific distribution formula of magnetic charge density is
The magnetic field intensity vectors contributed by the surface element of width dl on both sides of the middle line of the wear scar bottom at point P are as follows:
The components of the magnetic field intensity vectors contributed by the surface element of width dl along the x- and z-axes at point P are as follows:
The combined magnetic field intensities at point P along the x and z axes are then obtained:
Equations (12) and (14) are expressions of the tangential and normal leakage magnetic field intensity components based on the improved magnetic dipole model. Here, is the surface magnetic charge density on the side wall of the wear scar and is the maximum surface magnetic charge density at the bottom of the wear scar.
3.4. Simulation Result
In order to simplify the calculation, let . Additionally, take the wear scar length to be 2b = 20 mm and the sensor lift-off value to be y = 1 mm. According to relevant experimental results of W.C. Zhong, ≥ 8 [28,29]. Here, (k = 0.1), and the magnetic field leakage on the surface of the block specimen with different abrasive depth is numerically simulated according to Equations (11) and (13). The results are shown in Figure 13 and Figure 14.
Figure 13 shows the simulation results based on the improved model. It can be seen in this figure that the amplitude of Hp(x) at the wear scar increases gradually as the wear scar depth increases, and that the way in which Hp(x) changes at the wear scar closely matches the way in which the surface magnetic field changes at the stable wear stage. That is to say, in the early stage of stable wear, the tangential magnetic field presents a U-shape at the wear scar, and the edges of both sides of the U-shape protrude upward. In the later stage of stable wear, the tangential magnetic field shows a hump in the middle of the wear scar, and the U-shaped tangential magnetic field curve gradually turns into a W-shape, as indicated in Figure 13a.
The appearance of the normal magnetic field Hp(z) in Figure 13b closely matches that of the real normal magnetic field of the wear scar, and their dependence on the depth of the wear scar also closely matches. It appears that the positions of the peak and valley in the figure are the reverse of those of the actual magnetic field, but that it attributable to the selection of the positive direction of the normal magnetic sensor.
In order to show the advantages of the proposed model, the dependence of Hp(x) and Hp(z) on wear scar depth based on the traditional magnetic dipole model was shown in Figure 14. Comparing the experimental results (as shown in Figure 3 and Figure 4) with the results of both models, it is obvious that the improved model is close to the real situation.
In conclusion: the improved magnetic dipole model can accurately simulate the changes of tangential and normal magnetic fields during the growth period and stable wear period of the wear scar. However, the model is only suitable for the case where the leakage magnetic field is dominant; it does not consider the influence of any thermal demagnetization effect or dislocation pinning effect on the tribo-magnetization effect.
4. Conclusions
In this work, the tribo-magnetization effect was studied in a carefully controlled experiment with a pin-on-block reciprocating pair. It was found that the tangential and normal components of the surface magnetic field of the block increase gradually with increasing friction and follow the same trend. By extracting the average value of the tangential magnetic field intensity ΔH(x)mean at the wear scar position, it was found that the signal on the surface of the sample is divided into three principal stages: an initial friction period, a wear scar growth period, and a stable wear period. In the initial friction period, the tangential magnetic field on the surface of the block sample grows slowly. At this stage, the wear scar is not yet formed. The tribo-magnetization phenomenon conforms to the force-magnetic equivalent theory proposed by J-A, and the stress magnetization occurs when the friction surface is repeatedly extruded by reciprocating sliding stress. During the growth period of the wear scar, ΔH(x)mean increases rapidly. In this stage, the wear scar gradually deepens, and debris appears on the friction surface. Then, the debris and the pin-block friction pair form a three-body wear mechanism, promoting the aggravation of wear and leading to enhanced self-magnetic flux leakage on the sample surface. At the end of this stage, the wear debris becomes thinner and plays the role of lubricant. The wear decreases and enters into a stable wear stage. The growth rate of ΔH(x)mean decreases and tends to be stable. Vpp of the normal magnetic field intensity shows the same trend. There is a striking consistency between the wear state and the change of magnetic field. Therefore, it is feasible to monitor the change of the wear state by monitoring the change of magnetic field on the friction surface. Moreover, in order to evaluate and predict the variation of magnetic field on the surface of wear scar more accurately, an improved magnetic dipole model is established by considering the existence of the magnetic dipole at the bottom of the wear scar. The simulation results of the model are consistent with the actual wear process.
Author Contributions
Conceptualization, K.Z., J.F. and L.Z.; methodology, K.Z.; software, K.Z.; validation, K.Z., J.F. and L.Z.; formal analysis, L.Z.; investigation, K.Z., J.F.; resources, K.Z.; data curation, K.Z.; writing—original draft preparation, K.Z.; writing—review and editing, K.Z.; visualization, K.Z.; supervision, J.F., L.Z.; project administration, J.F.; funding acquisition, J.F. All authors have read and agreed to the published version of the manuscript.
Funding
This research was funded by the National Natural Science Foundation of China, grant number 51275528.
Institutional Review Board Statement
Not applicable.
Informed Consent Statement
Not applicable.
Data Availability Statement
The processed data required to reproduce these findings cannot be shared at this time as the data also forms part of an ongoing study.
Conflicts of Interest
The authors declare no conflict of interest.
References
- Cao, W.; Zhang, H.; Wang, N.; Wang, H.W.; Peng, Z.X. The gearbox wears state monitoring and evaluation based on on-line wear debris features. Wear 2019, 426–427, 1719–1728. [Google Scholar] [CrossRef]
- Li, W.; Liu, T. Time varying and condition adaptive hidden markov model for tool wear state estimation and remaining useful life prediction in micro-milling. Mech. Syst. Signal. Process. 2019, 131, 689–702. [Google Scholar] [CrossRef]
- Henry, B.; Harper, P.; Roger, L. The real-time measurement of wear using ultrasonic reflectometry. Wear 2015, 332–333, 1129–1133. [Google Scholar]
- Liu, X.; Wang, J.; Sun, K.; Cheng, L.; Wu, M.; Wang, X. Semantic Segmentation of Ferrography Images for Automatic Wear Particle Analysis. Eng. Fail. Anal. 2021, 122, 105268. [Google Scholar] [CrossRef]
- Knig, F.; Sous, C.; Chaib, A.O.; Jacobs, G. Machine learning based anomaly detection and classification of acoustic emission events for wear monitoring in sliding bearing systems—ScienceDirect. Tribol. Int. 2020, 155, 106811. [Google Scholar] [CrossRef]
- Xie, T.; Feng, S.; Yan, Z.; Yang, T. Tribo-magnetization of the PTFE composites containing ferromagnetic fillers of Fe, Co, or Ni. Wear 2019, 424–425, 233–245. [Google Scholar] [CrossRef]
- Shi, C.L.; Dong, S.Y.; Xu, B.S.; He, P. Research on metal magnetic memory test in process of frictional wear. J. Mater. Eng. 2009, 30, 35–44. [Google Scholar]
- Mishina, H.; Iwase, H.; Hase, A. Generation of wear elements and origin of tribo-magnetization phenomenon. Wear 2010, 269, 491–497. [Google Scholar] [CrossRef]
- Hase, A.; Mishina, H. Magnetization of friction surfaces and wear particles by tribological processes. Wear 2010, 268, 185–189. [Google Scholar] [CrossRef]
- Mishina, H.; Hase, A.; Nakase, T.; Dohi, M. Mechanism of surface magnetization by friction of ferromagnetic materials. J. Appl. Phys. 2009, 105, 474. [Google Scholar] [CrossRef]
- Chang, Y.P.; Yur, J.P.; Chu, L.M.; Chou, H.M.; Hwang, Y.C. Effects of friction on tribo-magnetization mechanisms for self-mated iron pairs under dry friction condition. J. Eng. Tribol. 2009, 223, 859–869. [Google Scholar] [CrossRef]
- Gao, F.M.; Fan, J.C. Research on the effect of remanence and the earth’s magnetic field on tribo-magnetization phenomenon of ferromagnetic materials. Tribol. Int. 2017, 109, 165–173. [Google Scholar] [CrossRef]
- Gao, F.M.; Fan, J.C.; Zhang, L.B.; Jiang, J.K.; He, S.J. The generation of the tribo-magnetization in a ferromagnetic material during friction process. J. Magn. Magn. Mater. 2020, 493, 165741. [Google Scholar] [CrossRef]
- Zhao, K.P.; Fan, J.C.; Gao, F.M.; Hu, Z.B. Research on tribo-magnetization phenomenon of ferromagnetic materials under dry reciprocating sliding. Tribol. Int. 2015, 92, 146–153. [Google Scholar] [CrossRef]
- Zhao, K.P.; Fan, J.C.; Gao, F.M. Research on Magnetic Memory Effect of the Ferromagnetic Materials during the Friction Process. In Proceedings of the 19th World Conference on Non-Destructive Testing 2016, Munich, Germany, 13–17 June 2016. [Google Scholar]
- Zhou, W.; Fan, J.; Liu, X.; Liu, S. Quantitative research of defects for pipelines based on metal magnetic memory testing. Insight 2020, 62, 292–299. [Google Scholar] [CrossRef]
- Han, G.; Huang, H. A dual-dipole model for stress concentration evaluation based on magnetic scalar potential analysis. NDT E Int. 2021, 118, 102394. [Google Scholar] [CrossRef]
- Wang, Y.; Liu, X.; Wu, B.; Xiao, J.; Wu, D.; He, C. Dipole modeling of stress-dependent magnetic flux leakage. NDT E Int. 2018, 95, 1–8. [Google Scholar] [CrossRef]
- Zhao, X.; Su, S.; Wang, W.; Zhang, X. Metal magnetic memory inspection of Q345B steel beam in four point bending fatigue test. J. Magn. Magn. Mater. 2020, 514, 167155. [Google Scholar] [CrossRef]
- Makar, J.M.; Tanner, B.K. The effect of plastic deformation and residual stress on the permeability and magnetostriction of steels. J. Magn. Magn. Mater. 2000, 222, 291–304. [Google Scholar] [CrossRef]
- Song, X.; Liu, Y.; Xiao, A.; Yuan, T.; Ma, T. Cell-boundary-structure controlled magnetic-domain-wall-pinning in 2:17-type Sm-Co- Fe-Cu-Zr permanent magnets. Mater. Charact. 2020, 169, 110575. [Google Scholar] [CrossRef]
- Jiles, D.C.; Atherton, D.L. Theory of ferromagnetic hysteresis. J. Appl. Phys. 1984, 55, 2115–2120. [Google Scholar] [CrossRef]
- Jiles, D.C. A new approach to modeling the magneto-mechanical effect. J. Appl. Phys. 2004, 95, 7058–7060. [Google Scholar] [CrossRef] [Green Version]
- Jiles, D.C.; Devine, M.K. Recent developments in modeling of the stress derivative of magnetization in ferromagnetic materials. J. Appl. Phys. 1994, 76, 7015–7017. [Google Scholar] [CrossRef]
- Jiles, D.C. Theory of the magneto mechanical effect. J. Phys. D Appl. Phys. 1995, 28, 1537–1546. [Google Scholar] [CrossRef]
- Shi, P.; Bai, P.; Chen, H.E.; Su, S.; Chen, Z. The magneto-elastoplastic coupling effect on the magnetic flux leakage signal. J. Magn. Magn. Mater. 2020, 504, 166669. [Google Scholar] [CrossRef]
- Wu, D.; Liu, Z.; Wang, X.; Su, L. Composite magnetic flux leakage detection method for pipelines using alternating magnetic field excitation. NDT E Int. 2017, 91, 148–155. [Google Scholar] [CrossRef]
- Zhong, W.C. The linear magnetic charge density along the edges of a longitudinally-magnetized steel cuboid. Nondestr. Test. 2002, 24, 332–334. [Google Scholar]
- Zhong, W.C. On the Proportional Coefficient α of Areal Density of Magnetic Charges σs to Linear Density of Magnetic Charges σl. Nondestr. Test. 2009, 31, 186–187. [Google Scholar]
Figure 1.
Specimen shape and scanning lines (length unit: mm).
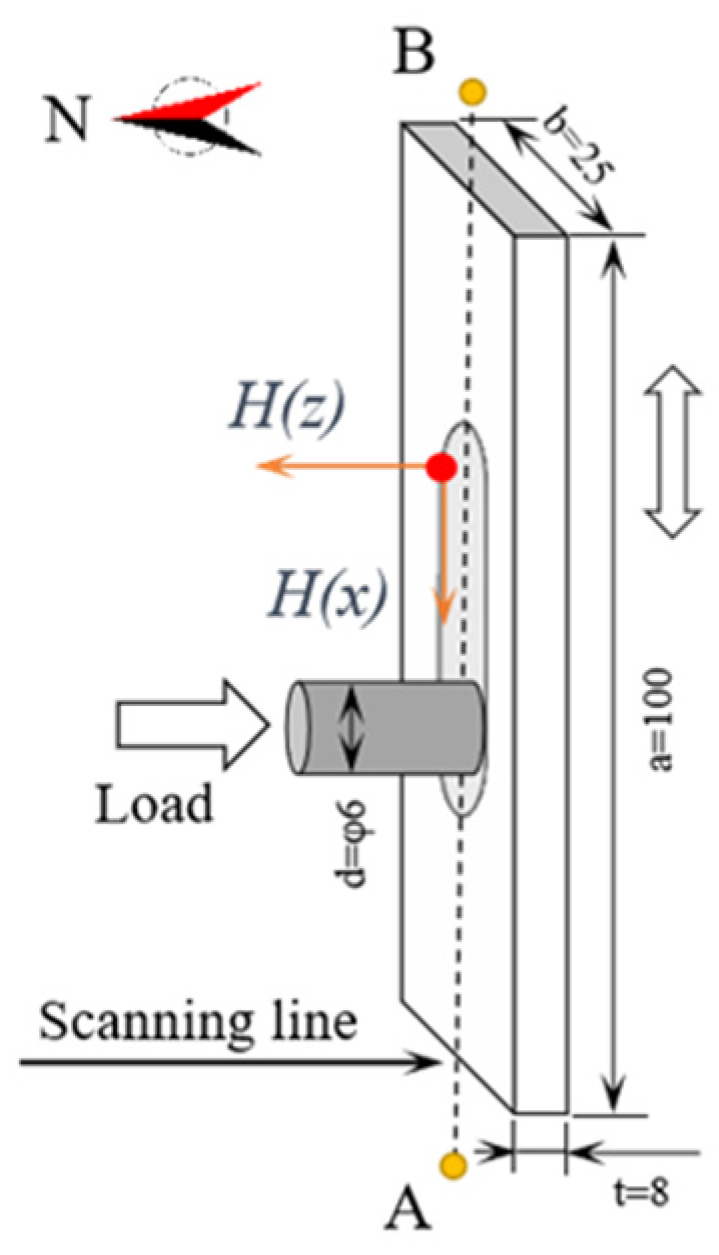
Figure 2.
Schematic diagram of the experimental setup.

Figure 3.
Changes in the tangential magnetic field for different numbers of reciprocating strokes: (a) the whole process; (b) n = 10~400; (c) n = 1000~4000; (d) n = 3000~8000. (f as reciprocating frequency and Ld as the normal load.)
Figure 3.
Changes in the tangential magnetic field for different numbers of reciprocating strokes: (a) the whole process; (b) n = 10~400; (c) n = 1000~4000; (d) n = 3000~8000. (f as reciprocating frequency and Ld as the normal load.)

Figure 4.
Changes in the normal magnetic field for different numbers of reciprocating strokes: (a) the whole process; (b) n = 10~400; (c) n = 1000~4000; (d) n = 3000~8000. (f as reciprocating frequency and Ld as the normal load.)
Figure 4.
Changes in the normal magnetic field for different numbers of reciprocating strokes: (a) the whole process; (b) n = 10~400; (c) n = 1000~4000; (d) n = 3000~8000. (f as reciprocating frequency and Ld as the normal load.)

Figure 5.
The surface micromorphology of the wear scar after 7000 cycles of reciprocating sliding.

Figure 6.
The average change of ΔH(x) within the wear scar as a function of the number of reciprocating cycles on a log scale.
Figure 6.
The average change of ΔH(x) within the wear scar as a function of the number of reciprocating cycles on a log scale.

Figure 7.
The dependence of magnetization on cyclic stress produced by friction.

Figure 8.
The macroscopic morphology of the wear scar at different stages.

Figure 9.
Micro morphology of wear scar surface before and after point C in Figure 5: (a) before point C; (b) after point C.
Figure 9.
Micro morphology of wear scar surface before and after point C in Figure 5: (a) before point C; (b) after point C.

Figure 10.
The peak-to-peak value of ΔH(z) within the wear scar as a function of the number of reciprocating cycles on a log scale.
Figure 10.
The peak-to-peak value of ΔH(z) within the wear scar as a function of the number of reciprocating cycles on a log scale.

Figure 11.
Distribution of magnetic charges in the magnetic dipole model.

Figure 12.
Revised magnetic dipole model: (a) magnetic charge of side wall; (b) magnetic charge at the bottom.
Figure 12.
Revised magnetic dipole model: (a) magnetic charge of side wall; (b) magnetic charge at the bottom.

Figure 13.
The dependence of Hp(x) and Hp(z) on wear scar depth based on the improved magnetic dipole model. (a) Hp(x); (b) Hp(z).
Figure 13.
The dependence of Hp(x) and Hp(z) on wear scar depth based on the improved magnetic dipole model. (a) Hp(x); (b) Hp(z).

Figure 14.
The dependence of Hp(x) and Hp(z) on wear scar depth based on the traditional magnetic dipole model. (a) Hp(x); (b) Hp(z).
Figure 14.
The dependence of Hp(x) and Hp(z) on wear scar depth based on the traditional magnetic dipole model. (a) Hp(x); (b) Hp(z).


Table 1.
Chemical composition of pin and block material (wt.%).
| Steel | C | Mn | Si | Cr | Mo | S | Ni | P | Cu |
|---|---|---|---|---|---|---|---|---|---|
| 40CrMo | 0.35~0.45 | 0.5~0.8 | 0.17~0.37 | 0.90~1.20 | 0.15~0.25 | ≤0.035 | ≤0.03 | ≤0.035 | ≤0.03 |
| 316L | ≤0.030 | ≤2.0 | ≤1.0 | 16.0~18.0 | 2.0~3.0 | ≤0.030 | 12.0~15.0 | ≤0.045 |
Publisher’s Note: MDPI stays neutral with regard to jurisdictional claims in published maps and institutional affiliations. |
© 2021 by the authors. Licensee MDPI, Basel, Switzerland. This article is an open access article distributed under the terms and conditions of the Creative Commons Attribution (CC BY) license (https://creativecommons.org/licenses/by/4.0/).
Share and Cite
MDPI and ACS Style
Zhao, K.; Fan, J.; Zhang, L. The Relationship between Tribo-Magnetization and Wear State during Reciprocating Sliding. Metals 2021, 11, 1247. https://doi.org/10.3390/met11081247
AMA Style
Zhao K, Fan J, Zhang L. The Relationship between Tribo-Magnetization and Wear State during Reciprocating Sliding. Metals. 2021; 11(8):1247. https://doi.org/10.3390/met11081247
Chicago/Turabian StyleZhao, Kunpeng, Jianchun Fan, and Laibin Zhang. 2021. "The Relationship between Tribo-Magnetization and Wear State during Reciprocating Sliding" Metals 11, no. 8: 1247. https://doi.org/10.3390/met11081247
Note that from the first issue of 2016, this journal uses article numbers instead of page numbers. See further details here.