
Improvement in the Resistance to Wear of Work-Rolls Used in Finishing Stands of the Hot Strip Mills


Department of Material Science and Metallurgical Engineering, University of Oviedo, 33004 Oviedo, Spain
*
Author to whom correspondence should be addressed.
Metals 2021, 11(11), 1873; https://doi.org/10.3390/met11111873
Submission received: 22 October 2021
/
Revised: 18 November 2021
/
Accepted: 19 November 2021
/
Published: 21 November 2021
Abstract
:Work-rolls manufactured through the Indefinite Chill Double Poured (ICDP) method present an exterior work layer manufactured in a martensitic white cast iron alloyed with 4.5 %Ni, 1.7 %Cr, and 0.7 %Nb (wt.%). In its microstructure, there are abundant carbides of the type M3C and MC, which give high resistance to wear, and graphite particles which improve the service behaviour of the rolls against thermal cycling. The core of the rolls is manufactured in grey cast iron of pearlitic matrix and spheroidal graphite. These work-rolls are used in the finishing stands in Hot Strip Mills for rolling slabs proceeding from continuous casting at 1200 °C. Through the application of a Design of Experiments (DoE), an attempt has been made to identify those manufacturing factors which have a significant effect on resistance to wear of these rolls and to find an optimal combination of levels of these factors which allow for improvement in resistance to wear. To increase resistance to wear, it is recommended to situate, simultaneously, the liquidus temperature and the percentage of Si in the respective ranges of 1250–1255 °C and 1.1–1.15 (wt.%). Higher liquidus temperatures favour the presence of the pro-eutectic constituent rather than the eutectic constituent. The outer zone of the work layer, in contact with the metal sheet, which is being rolled, does not show the graphitising effect of Si (0.8–1.15 wt.%). On the contrary, it confirms the hardening effect of the Si in solid solution of the ferrite. The addition of 0.02% of Mg (wt.%) and the inoculation of 6 kg/T of FeB tend to eliminate the graphitising effect of the Si, thus favouring that the undissolved carbon in the austenite is found to form carbides in contrast to the majority formation of graphite.
1. Introduction
The work-rolls manufactured with the Indefinite Chill Double Poured (ICDP) method are used in the last two finishing stands of the hot strip mills (HSMs). The term “indefinite” refers to the fact that part of the carbon in the shell appears in the form of carbides, while another small part appears in the form of graphite [1]. The dispersed interdendritic graphite is the result of the solidification of the residual eutectic liquid that provides an optimum combination of wear life and enhanced thermal shock resistance. In the hot strip mills, the flat slabs, proceeding from continuous casting, are rolled [2]. The rolled slabs are heated to temperatures of 1200 °C or higher, in order to go through a large reduction in the hot strip mill at a range of temperatures between 1100–1200 °C. Subsequently, in the finishing stand, the metal sheet reaches a final reduction for the winding of the metal sheet. The finishing temperature usually oscillates between 820 °C and 920 °C. The finishing stand is made up of seven rolling stands. The work-rolls of these stands should have a high level of resistance to wear, resistance to rusting, resistance to fracture, and an excellent surface finish [2,3]. The work layer is exposed to periodic cycles of heating and cooling during contact with the metal and subsequent cooling with water. The maximum temperatures reached on the surface of the work-roll could exceed 500 °C. This heating is countered with jets of water, both before and after passing through rolling. The minimum temperatures could reach 100 °C [4]. During rolling, the work-roll is exposed to compression forces which resist thermal dilation, and which cause cycles of mechanical forces complementary to thermal cycles. Therefore, the service life of the material will depend on its resistance to wear as well as its resistance to thermal and mechanical cycles [3,5,6]. These rolls are manufactured by vertical centrifugal casting. In the first step, the work layer is cast and, once this outer shell has solidified, the core is cast. The core is cast in two steps. In the first step, the part of the core intended to achieve an optimal bond with the shell is cast. Subsequently, the remainder of the core and roll necks are casted by gravity and solidify statically; Figure 1 shows this process. The exterior work layer is a martensitic white cast iron with graphite particles, and the core is a grey cast iron with a pearlitic matrix and spheroidal graphite. The main alloying elements in the work layer are Ni (4.4–4.6 wt.%) and Cr (1.7–18 wt.%). To improve resistance to wear, Nb (0.7 wt.%) and Mo (0.25 wt.%) are also included in its chemical composition [7,8,9]. The Nb forms carbides with an MC stoichiometry and with a hardness close to 2400 HV, while, in the Cr in compositions of lower than 15%, carbides of the type M3C and with a hardness of close to 1200 HV are formed [10,11]. The Ni and the Mo increase hardenability [12]. The microstructure is made up of pro-eutectic austenite and a double eutectic constituent; on the one hand, that which is derived from a ledeburitic eutectic is formed by austenite and carbides, and, on the other hand, that which is formed by austenite and graphite [13]. The presence of graphite increases resistance to thermal shock. At the same time, the graphite performs functions of dry lubrication, thus reducing the coefficient of friction between the roll and the sheet of steel [4,14,15,16,17,18].
The aim of this study is to identify those manufacturing factors which have a significant effect on resistance to wear on the work layer. Apart from the microstructural characteristics of the work layer, the rate of wear will depend mainly on temperature, the speed of sliding, and the load applied [19]. Among the studied factors are the use of alloys of FeSi with traces of Lanthanum as an inoculant and the inoculation of the hot metal with different contents of Mg, FeB, and SiCaMn. Also, the effects of the variation in the Liquidus Temperature were studied, as well as the percentage of Si. The liquidus temperature indicates the volume fraction of the eutectic constituent. If the liquidus temperature is low, it means that the eutectic constituent is the majority, compared to the proeutectic austenite. The ledeburitic matrix exhibits high wear resistance, poor toughness, and low thermal shock resistance due to the ceramic nature of the cementite carbides. These carbides exhibit true continuity in the microstructure; thus, they become the true mechanical matrix [20]. Inoculation with La produces an increase in the number of beads, by unit area, of graphite, and the thinning of the carbide network [21,22,23]. B has a whitening effect, thus increasing the volume fraction of carbides and improving the resistance to wear of the material [24,25]. The Nb tends to reduce the size of the eutectic cell, which could produce graphite of a smaller size and that is more uniformly distributed. The NbC incrementally improves abrasive wear resistance, and, on the other hand, could favour the heterogeneous nucleation of the graphite [25,26,27]. At the same time, inoculation with FeB favours heterogeneous nucleation of the NbC. The Mg performs as a nucleating agent of the graphite, thus favouring its spheroidal morphology [28,29,30]. However, the Mg produces subcooling during eutectic solidification, which favours the formation of ledeburitic eutectics [10]. In previous studies, it was concluded that inoculation with SiCaMn, apart from increasing the volume fraction of graphite and its nodularity, produced fractioning in the continuity of the carbide network, which favours an improvement in the toughness performance of the work layer [23,28]. On the other hand, it was shown that, with effective quantities of Mg (around 0.02%), a deterioration in the nodularity of the graphite was produced [23]. This same effect was observed with the inoculation of FeB [23]. In previous works, the properties of the working layer were characterized. Hardness of the working layer is between 550 and 650 HV. The flexural strength, obtained through a three-point bending test, is between 500 and 660 MPa. The toughness is rather low. The impact energy, obtained by means of an unnotched Charpy test, is just 3–4 J/cm2 [28].
2. Materials and Methods
Table 1 shows the range of habitual compositions both for the outer layer as well as for the core.
The manufacturing process can be summed up as the following: initially the work layer is cast and, after that, the core, in two steps. In the first step, the part of the core which will be joined to the work layer is cast. In the second step, the rest of the core is cast. The work layer is smelted in a medium frequency induction oven. The bleeding from the oven to the ladle is carried out at around 1420 °C. When tapping occurs, the inoculants are to be found at the bottom of the ladle. Casting is carried out at around 90 °C above the liquidus temperature. Five days after casting, the roll is unmoulded. After quenching at 1000 °C with air cooling, the roll was subjected to tempering at 400 °C.
The methodology used in this research was that of Design of Experiments (DoE). Through this methodology, the aim is to deliberately modify certain work conditions to generate variations in one or a number of characteristics of the product (responses). These variations in responses should allow for reaching a deeper understanding of this product. In industrial processes, it is habitual that only a small number of factors are responsible for the majority of variations in responses. Therefore, the main effects are defined as those which are a consequence of each separate factor. That is to say, the main effect of a certain factor is defined as a change in the response function upon varying that factor between its level −1 and its level +1. The interactions between 2 factors are defined as the variation between the average of a factor with another factor at its level −1, and the average effect of the same factor with another factor at its level +1. The interactions between various factors would be defined in a similar way [31]. Complete Design of Experiments factorials require a large number of experiments, which grows exponentially depending on the number of factors studied. For example, when k factors are analysed, the number of experiments is 2k, where 2 is the number of levels applied to each factor (−1 and +1). However, fractional factorial designs allow for the study of a large number of factors, thus reducing the number of experiments [32]. This implies that the interactions of two, three, or more effects become confounded between main effects and other interactions of two factors. This loss of information is not usually of importance in industrial practice.
The experimental response is subject to random variation. This variation will follow a normal law, where its typical deviation reflects experimental error. The effects are linear combinations of the responses, so that by applying the Central Limit Theorem, they will follow a normal law. Starting from a normal law, the distribution function associated with it can be represented graphically. This will appear as a straight line if it is represented on the scale of a ‘normal probability paper’. If all the effects were not significant, these would follow a law ley N(0,σ), so that they would appear in a linear fashion. If any of the effects were significant, then they would follow a law N(µ,σ), so that they would not appear in line with other effects. Those significant effects which are separated from the straight line to the left and above this line indicate that its level −1 increases the response function. Those significant factors which are separated from the line to the right and below this line indicate that its level +1 increases the response function [32,33].
Table 2 shows the studied factors and the levels which limit this study. The factors A, B, and E are inoculants. Table 3 shows the chemical composition of the inoculants used in this study. Table 4 shows the matrix of experiments. The column ‘generators’ indicates the algorithm of signs applied in the construction of columns D, E, and F. The column ‘restricted confounding pattern’ shows those second order interactions whose effects are confounded with the main effects. For example, in this case, the effects of the interactions BD and CE will be confounded with the effect of factor A. The columns for the signs D, E, and F have been constructed as the product of columns AB, AC, and BC respectively.
The mathematical model applied to estimate the volume fraction of carbides and the resistance to wear is formed by the main effects and the interactions of two factors. Therefore, both the volume fraction of carbides as well as the resistance to wear would be approximated in the following function (1):
From this model, the optimum combination of levels allows for the maximisation of resistance to wear. The statistical software used for this was Statgraphics Centurion XVI, version 16.1.03.
The thickness of the work layer was studied in two zones (Figure 2a): an external zone, starting at the exterior edge of the roll reaches a depth of 15 mm (named Zone I); (b) a more interior zone that begins at 25 mm from the outer edge of the roll and whose thickness reaches another 15 mm (named Zone III). In both zones, the volume fraction of carbides was determined using the software Image ProPlus (version 4.5.0.29) and its module of analysis Materials-Pro. In order to do this, 5 micrographs of each zone were obtained randomly. The different types of precipitated carbides were identified under a JEOL JSM-5600 (JEOL, Nieuw-Vennep, The Netherlands) scanning electron microscope (SEM), equipped with the characteristic X-ray scattering microanalysis system (SEM-EDX).
Resistance to wear was measured with a Pin on Disc test (ASTM G99), using a linear speed of 0.36 m/s and a load of 20 N. The distance covered was 8000 m. Each of the pins corresponded to each of the experiments. The cross section of the pin was circular with a 3 mm diameter. The disc was of steel DIN 42CrMo4 (AISI 4140) in an oil quenched state without tempering. At the time of testing, its hardness was 650 HV. Wear resistance was measured as weight loss (mg). The tests were carried out at 250 and 350 °C.
The chemical analysis of each experiment was determined by Inductively Coupled Plasma Mass Spectrometry (ICP-MS), (HP 7500c, Agilent, Santa Clara, CA, USA).
3. Results and Discussion
Table 5 shows the chemical composition and the liquidus temperature of each of the work layers which form part of the matrix of experiments. The pouring temperature was always the liquidus temperature + 90 °C.
Figure 3 shows the general microstructure of some of the experiments. These micrographs are referred to as the work layer. The microstructure is formed by proeutectic austenite and two eutectic constituents, one of these formed by austenite and graphite. Figure 3a shows the continuity of the ledeburitic carbides in the microstructure. The austenite is largely found to be transformed into martensite [27]. In Figure 3b–d, it may be observed that the graphite has a compact morphology without reaching a nodular geometry. Among the carbides, two types appear to be observed. One of these is of greater size and with a darker tone (type M3C, associated with Cr), and the other is of much smaller size with a lighter tone (type MC carbides, associated with Nb).
In Figure 4, the different precipitated phases can be observed. Table 6 shows the results of the semi-quantitative micro-analysis carried out on these types of carbides (spectrums 1 to 5). The lighter toned carbides (spectrums 1, 2, and 4) are carbides of stoichiometry MC, associated with the Nb. Fe and B appear fixed in this type of carbide, and, therefore, it may be deduced that FeB acts as a heterogeneous nucleant in this type of carbide [27]. The darker toned carbides (spectrums 3 and 5) are mixed carbides with stoichiometry M3C, of the type (Fe,Cr)3C.
Table 7 shows the results obtained compared to the volume fraction of carbides. The average percentage of the eight experiments was very similar in both zones. In zone I it was 23.08% and in zone III it was 23.95%. Figure 5 shows a graphic representation of the effects through a normal probability paper.
In zone I, the factors C (liquidus temperature) and F (% Mg) have a significant effect. Therefore, in order to increase the volume fraction of carbides, both factors should be situated at their respective levels −1 (1250–1255 °C) and +1 (0.02% Mg). The Mg generates greater sub-cooling in the eutectic reaction ‘austenite + graphite’; thus, without a very elevated content in Si, this favours the formation of eutectic austenite + carbides.
In zone III, where the cooling speed is slightly lower, the factors with a significant effect are C (liquidus temperature) and F (% Mg), and the confounded interactions are AF + BE + CD. To increase the volume fraction of carbides, the factors C and F should be situated in their respective levels −1 (1250–1255 °C) and −1 (0% Mg). Given the ‘contradiction’ in the effect of factor F with respect to zones I and III, the effect should be analysed in greater detail. In Table 8, the effect of factor F on zone III is analysed, including the effect of the confounded interactions with the main effect. In this table, the effects of the interactions AF + BE + CD are also analysed. From this analysis it may be deduced that the effect of factor F (% Mg) is negligible with respect to the effect of the interaction BC. In this case, to increase the volume fraction of carbides, it would be necessary to situate these factors at their respective levels B = + 1 and C = −1; that is to say, inoculation with 6 Kg/T of FeB and fixing the liquidus temperature between 1550 and 1555 °C. Thus, if an increase in the percentage of carbides is required, both factors should be situated at their respective levels −1; that is to say, liquidus temperature of 1255–1255 °C and a % Si of 0.8–0.85.
Therefore, in order to increase the volume fraction of carbides in both zones of the work layer, the liquidus temperature should be situated at 1250−1255 °C (level −1). This range of temperatures favours the increase in the eutectic constituent in comparison with a liquidus temperature in the range of 1570–1575 °C (level +1). In zone I, where the speed of cooling is slightly higher, the graphitising effect of Si is not confirmed. However, in zone III, where the speed of cooling is slightly slower, the effect is more significant. Because of this, in order to increase the volume fraction of carbides in this zone, the percentage of Si should be situated at its level −1 (0.8–0.85 %Si). It may be highlighted that the Mg requires greater sub-cooling during solidification of the eutectic constituent, which favours the formation of ledeburitic eutectic. Its effects are significant in zone I, where cooling is more rapid.
Table 9 shows the results obtained in the wear tests in zone I. The average value of wear in the eight experiments at 250 °C was 22.6 mg, while the average value of the eight experiments at 350 °C was 25.9 mg. Figure 6 shows a graphic representation of the effects. Figure 6a,c represent the effects on a normal probability paper, and Figure 6b,d represent the effects in a Pareto diagram.
In both cases, a single significant effect is confirmed which corresponds to the ‘confounded’ interactions AF, BE, and CD. Table 10 shows a detailed analysis of these interactions, highlighting the combination of factors that generates less wear. This seems to suggest a contradiction in the effects in the interactions AF at 250 °Cand at 350 °C. If one of these is found at its level +1, the other should be situated at its level −1.
As a consequence of applying a mathematical model of the interactions of two factors, and in analysing all the possible combinations of level, the optimum combination which allows the minimising of wear may be determined. Table 11 shows this combination.
It must be taken into account that the optimum combination of levels coincides at both temperatures. This optimum combination forces factors C (liquidus temperature) and D (%Si) to be situated at their levels −1 (1250–1255 °C) and +1 (1.1–1.15 %Si), respectively. A low liquidus temperature would reflect a higher content of the eutectic constituent, while a high percentage of Si could elevate the graphitising potential of the alloy. However, it must be pointed out that this ‘graphitising’ effect is not confirmed in zone I due to the fact that this is the zone which shows a greater cooling speed. On the other hand, the Si has a tendency to favour the formation of pearlite in martensitic white cast iron. However, the high content of Ni and Cr avoid the formation of this constituent, thus favouring the transformation of martensite into austenite. At the same time, the high content of Si raised the Ms temperature, thus reducing the quantity of retained austenite. This favours an increase in the quantity of martensite. The hardening effect of the Si in solid solution with ferrite must also be highlighted. This means an additional ‘stimulus’ in the increase of resistance to wear. The system recommends situating Factor A at its +1 level and Factor F at its −1 level. With respect to this, it must be pointed out that, in the exterior zone of the work layer, zone I, the number of beads of graphite per unit of area increases when Factor A is situated at level +1 and that the size of these beads is smaller when Factors A and F are situated at their respective levels +1 and −1 [22]. Therefore, it may be deduced that it could be favourable to resistance to wear that the precipitation of graphite were produced with a high density of graphite beads and in a small size. At the same time, the ‘whitening’ effect of FeB (level +1) and the reduction in the ‘graphitising’ effect of the SiCaMn at its level −1 seem to be favourable.
Table 12 shows the results obtained from the wear tests in Zone III. The average value for wear in the eight experiments at 250 °C was 25.7 g, while the average value for the eight experiments at 35 °C was 29.8 mg. These values are greater than those reached in zone I. Figure 7 shows a graphic representation of the effects. Figure 7a,c show the effects on a normal probability paper and Figure 7b,d show the effects in a Pareto diagram.
In both cases, the lack of factors with a significant effect is confirmed. However, it may be observed that the factor with the greatest effect in both cases is Factor F, which included the confounded effects of interactions BC and DE. In Table 13, these effects are analysed. In both cases, the interaction which has a larger effect on resistance to wear at both temperatures is interaction DE. It may be deduced that, in order to increase resistance to wear, both factors should be situated at their levels +1; that is to say, %Si = 1.1–1.15 and the inoculation with 6 Kg/T of SiCaMn.
In the tests carried out at 250 °C, factor E and the interactions AC + DF also appear to have a large effect. In Table 14, these effects are analysed separately. It can be seen that the interaction DF has a more significant effect. It is concluded that, in order to increase resistance to wear, both factors should be situated at their levels +1; that is to say, %Si = 1.1–1.15 and % Mg = 0.02.
On the other hand, in the tests carried out at 350 °C, interactions AF + BE + CD also appear to have a large effect. In Table 15, the effect of these interactions is analysed separately. It is concluded that the largest effect is a consequence of the interaction AF in such a way that, in order to reduce the message level, this interaction should be fixed at the following levels: A = −1 and F = +1. Also, the interaction CD at its levels C = −1 and D = +1 shows a large effect.
As a consequence of applying a mathematical model to the interactions of three factors, and analysing all the possible combinations of levels, the optimum combination can be determined, and this would allow for minimising wear in this zone III. Table 16 shows this combination. It can be confirmed that this combination of levels is in agreement with the results shown in Table 13, Table 14 and Table 15.
In this interior zone of the work layer, it is observed that resistance to wear improves when the liquidus temperature is maintained at its level −1. That is to say, similar to what happened in zone I, the presence of the eutectic constituent rather than the proeutectic austenite should be favourable. Situating factor D (%Si) at its level +1 and taking advantage of the hardening effect of Si on the proeutectic constituent are also favourable. It must be taken into account that a high %Si increases the Ms temperature, thus reducing the quantity of retained austenite and the Si in a solid ferrite solution substantially hardens this phase. On the other hand, it must be highlighted that the ‘whitening effect’ of the Mg favours the precipitation of metastable eutectic (austenite + carbides) rather than stable (austenite + graphite).
4. Conclusions
Work rolls manufactured through the process Indefinite Chill Double Poured (ICDP) present an exterior work layer manufactured in a martensitic white cast iron alloyed with Cr, Ni, and Nb. These rolls are used in the finishing stands of Hot Strip Mills. Through the application of a Design of Experiments (DoE), the aim was to increase resistance to wear. In order to do this:
- In the exterior zone of the work layer it is recommended that the liquidus temperature and the percentage of Si be situated in their respective ranges of 1250–1255 °C and 1.1–1.15%. More elevated liquidus temperatures favour the presence of the proeutectic constituent as opposed to the eutectic constituent. In this zone, where the speed of cooling during solidification is greater, the graphitising effect of Si is not confirmed. However, the results confirm the hardening effect of Si in a solid ferrite solution after tempering of the martensite. At the same time, the ‘whitening’ effect of inoculation with 6 kg/T of FeB, and that the size of precipitated graphite particles is small, with a high number of ‘beads’ per unit of area, may both be considered favourable;
- Resistance to wear in more interior areas of the work layer is increased, as in the previous case, with liquidus temperatures between 1250–1255 °C and the content of Si between 1.1–1.15%. However, in this zone, the graphitising effect is confirmed, and, therefore, the addition of Mg as a micro-alloy as well as the inoculation with 6 kg/T de FeB, is favourable. All of this evidences that the undissolved carbon in the austenite is found to be forming carbides rather than the majority formation of graphite.
Author Contributions
Conceptualization, F.A.-A.; methodology, F.A.-A.; software, F.A.-A.; validation, A.C.-V., F.A.-A.; formal analysis, F.A.-A.; investigation, A.C.-V. and C.H.A.-P.; resources, F.A.-A. and C.H.A.-P.; data curation, F.A.-A.; writing—original draft preparation, F.A.-A.; writing—review and editing, F.A.-A. and A.C.-V.; visualization, F.A.-A.; supervision, F.A.-A.; project administration, F.A.-A.; funding acquisition, F.A.-A. All authors have read and agreed to the published version of the manuscript.
Funding
This research received no external funding.
Conflicts of Interest
The authors declare no conflict of interest.
References
- Strilkova, L.; Valek, T.; Tanger, L.T.D. Microstructural investigation of icdp iron designed for working layers of composite centrifugally cast rolls in hot rolling mills. In Proceedings of the 21st International on Conference Metallurgy and Materials, Brno, Czech Republic, 23–25 May 2012; pp. 788–794. [Google Scholar]
- Palit, P.; Patel, S.N.; Mathur, J.; Shenoy, S. Analysis of a Progressive Failure of a Work Roll in Hot Strip Mill. J. Fail. Anal. Prev. 2019, 19, 1297–1303. [Google Scholar] [CrossRef]
- Ramirez-Ramirez, J.H.; Colas, R.; Garza-Montes-de-Oca, N.F. High Temperature Oxidation of a Work Roll Grade High-Chromium White Cast Iron. J. Iron Steel Res. Int. 2013, 20, 122–129. [Google Scholar] [CrossRef]
- Bombac, D.; Kugler, G.; Markoli, B.; Tercelj, M. Hot work roller surface layer degradation progress during thermal fatigue in the temperature range 500–700 degrees C. Int. J. Fatigue 2017, 104, 355–365. [Google Scholar] [CrossRef]
- Nilsson, M.; Olsson, M. An investigation of worn work roll materials used in the finishing stands of the hot strip mill for steel rolling. Proc. Inst. Mech. Eng. Part J J. Eng. Tribol. 2013, 227, 837–844. [Google Scholar] [CrossRef] [Green Version]
- Ray, A.; Prasad, M.S.; Dhua, S.K.; Sen, S.K.; Jha, S. Microstructural features of prematurely failed hot-strip mill work rolls: Some studies in spalling propensity. J. Mater. Eng. Perform. 2000, 9, 449–456. [Google Scholar] [CrossRef]
- Filipovic, M.; Kamberovic, Z.; Korac, M.; Jordovic, B. Effect of Niobium and Vanadium Additions on the As-Cast Microstructure and Properties of Hypoeutectic Fe-Cr-C Alloy. ISIJ Int. 2013, 53, 2160–2166. [Google Scholar] [CrossRef] [Green Version]
- Zhang, Z.G.; Yang, C.K.; Zhang, P.; Li, W. Microstructure and wear resistance of high chromium cast iron containing niobium. China Foundry 2014, 11, 179–184. [Google Scholar]
- Bedolla-Jacuinde, A. Microstructure of vanadium-, niobium- and titanium-alloyed high-chromium white cast irons. Int. J. Cast Met. Res. 2001, 13, 343–361. [Google Scholar] [CrossRef]
- Pero-Sanz, J.A. Fundiciones Férreas; Dossat: Madrid, Spain, 1994; p. 154. [Google Scholar]
- Antolin, J.F.A.; Garrote, L.F.; Lozano, J.A. Application of Rietveld Refinement to the correlation of the microstructure evolution of white cast irons with 18 and 25 %-wt. Cr after oil quench and successive temper treatments, with abrasive wear and bending testing. Rev. Metal. 2018, 54, 11. [Google Scholar] [CrossRef] [Green Version]
- Mourad, M.M.; El-Hadad, S.; Ibrahim, M.M. Effects of Molybdenum Addition on the Microstructure and Mechanical Properties of Ni-Hard White Cast Iron. Trans. Indian Inst. Met. 2015, 68, 715–722. [Google Scholar] [CrossRef]
- Bravo, S.V.; Yamamoto, K.; Miyahara, H.; Ogi, K. Control of carbides and graphite in Ni-hard type cast iron for hot strip mills. In Proceedings of the 6th Pacific Rim International Conference on Advanced Materials and Processing, Jeju, Korea, 5–9 November 2007; Volume 561–565, p. 1023. [Google Scholar]
- Sergio, V.; Ishikawa, S.; Yamamoto, K.; Miyahara, H.; Ogi, K.; Kamimiyada, K. Control of graphite formation in solidification of white cast iron. Int. J. Cast Met. Res. 2008, 21, 27–30. [Google Scholar] [CrossRef]
- Gowda, D.; Kumar, D.C.; Sandeep, G.M.; Parthasarathy, A.; Chandrashekar, S. Tribological Characterization of Centrifugally Cast Graphite Cast Iron under Dry and Wet conditions. Mater. Today Proc. 2018, 5, 145–151. [Google Scholar] [CrossRef]
- Holmgren, D.; Dioszegi, A.; Svensson, I.L. Effects of nodularity on thermal conductivity of cast iron. Int. J. Cast Met. Res. 2007, 20, 30–40. [Google Scholar] [CrossRef]
- Tercelj, M.; Fajfar, P.; Godec, M.; Kugler, G. Characteristics of the thermal fatigue resistance for 3.1C, 0-8Si, 0.9Mn, 1.7Cr, 4.5Ni and 0-3Mo ICDP cast iron roll at 600 degrees C. Mater. Tehnol. 2017, 51, 515–521. [Google Scholar] [CrossRef]
- Drobne, M.; Urska, K.; Tercelj, M.; Fajfar, P. Thermal crack propagation during hot rolling and its influence on cast iron work roll degradation. In Proceedings of the Metal 2017: 26th International Conference on Metallurgy and Materials, Brno, Czech Republic, 24–25 May 2017; pp. 408–413. [Google Scholar]
- Stott, F.H.; Jordan, M.P. The effects of load and substrate hardness on the development and maintenance of wear-protective layers during sliding at elevated temperatures. Wear 2001, 250, 391–400. [Google Scholar] [CrossRef]
- Asensio, J.; Álvarez, J.F.; Vander, G.F. Microstructural control of FeB-inoculated mottled low-alloy white iron by a design of experiments approach. Int. J. Mater. Res. 2008, 11, 1237–1247. [Google Scholar] [CrossRef]
- Onsoien, M.I.; Skaland, T.; Grong, O. Mechanisms of graphite formation in ductile cast iron containing cerium and lanthanum. Int. J. Cast Met. Res. 1999, 11, 319–324. [Google Scholar] [CrossRef]
- Hamidzadeh, M.A.; Meratian, M.; Saatchi, A. Effect of cerium and lanthanum on the microstructure and mechanical properties of AISI D2 tool steel. Mater. Sci. Eng. A Struct. Mater. Prop. Microstruct. Process. 2013, 571, 193–198. [Google Scholar] [CrossRef]
- Cofino-Villar, A.; Alvarez-Antolin, F.; Asensio-Lozano, J.; Garcia-Garcia, M. Control over the Percentage, Shape and Size of the Graphite Particles in Martensitic White Castings Alloyed with Cr, Nb and Mg. Materials 2019, 12, 10. [Google Scholar] [CrossRef] [PubMed] [Green Version]
- Col, M.; Koc, F.G.; Oktem, H.; Kir, D. The role of boron content in high alloy white cast iron (Ni-Hard 4) on microstructure, mechanical properties and wear resistance. Wear 2016, 348, 158–165. [Google Scholar] [CrossRef]
- Tasgin, Y.; Kaplan, M.; Yaz, M. Investigation of effects of boron additives and heat treatment on carbides and phase transition of highly alloyed duplex cast iron. Mater. Des. 2009, 30, 3174–3179. [Google Scholar] [CrossRef]
- Zhou, W.B.; Zhu, H.B.; Zheng, D.K.; Zheng, H.X.; Hua, Q.; Zhai, Q.J. Niobium alloying effect in high carbon equivalent grey cast iron. China Foundry 2011, 8, 36–40. [Google Scholar]
- Chen, X.R.; Xu, J.; Hu, H.; Mohrbacher, H.; Kang, M.; Zhang, W.; Guo, A.M.; Zhai, Q.J. Effects of niobium addition on microstructure and tensile behavior of as-cast ductile iron. Mater. Sci. Eng. A Struct. Mater. Prop. Microstruct. Process. 2017, 688, 416–428. [Google Scholar] [CrossRef]
- Cofino-Villar, A.; Alvarez-Antolin, J.F.; Asensio-Lozano, J. Enhanced Fracture Strength in the Working Layer of Rolls Manufactured in Ni-Hard Cast Iron Alloyed with Mo, Nb and Mg. Metals 2018, 8, 725. [Google Scholar] [CrossRef] [Green Version]
- Takeda, H.; Yoneda, H.; Asano, K. Effect of Silicon and Bismuth on Solidification Structure of Thin Wall Spheroidal Graphite Cast Iron. Mater. Trans. 2010, 51, 176–185. [Google Scholar] [CrossRef] [Green Version]
- Konig, M.; Wessen, M. Influence of alloying elements on microstructure and mechanical properties of CGI. Int. J. Cast Met. Res. 2010, 23, 97–110. [Google Scholar] [CrossRef]
- Johnson, R. Probabilidad y Estadística para Ingenieros, 3rd ed.; Pearson Education: Mexico City, Mexico, 1997; pp. 489–494. [Google Scholar]
- Prat-Bartés, A.; Tort-Martorell, X.; Grima-Cintas, P.; Pozueta-Fernández, L.; Solé-Vidal, I. Métodos Estadísticos, 2nd ed.; UPC: Barcelona, Spain, 2004; p. 376. [Google Scholar]
- Silva, R.G.; Estay, C.S.; Pavez, G.M.; Vinuela, J.Z.; Torres, M.J. Influence of Geometric and Manufacturing Parameters on the Compressive Behavior of 3D Printed Polymer Lattice Structures. Materials 2021, 14, 1462. [Google Scholar] [CrossRef]
Figure 1.
Manufacture by centrifugal casting: (a) casting of outer working layer; (b) casting of the core intended to achieve an optimal bond with the outer working layer; (c) casting of the remainder of the core and roll necks by gravity and static solidification.
Figure 1.
Manufacture by centrifugal casting: (a) casting of outer working layer; (b) casting of the core intended to achieve an optimal bond with the outer working layer; (c) casting of the remainder of the core and roll necks by gravity and static solidification.
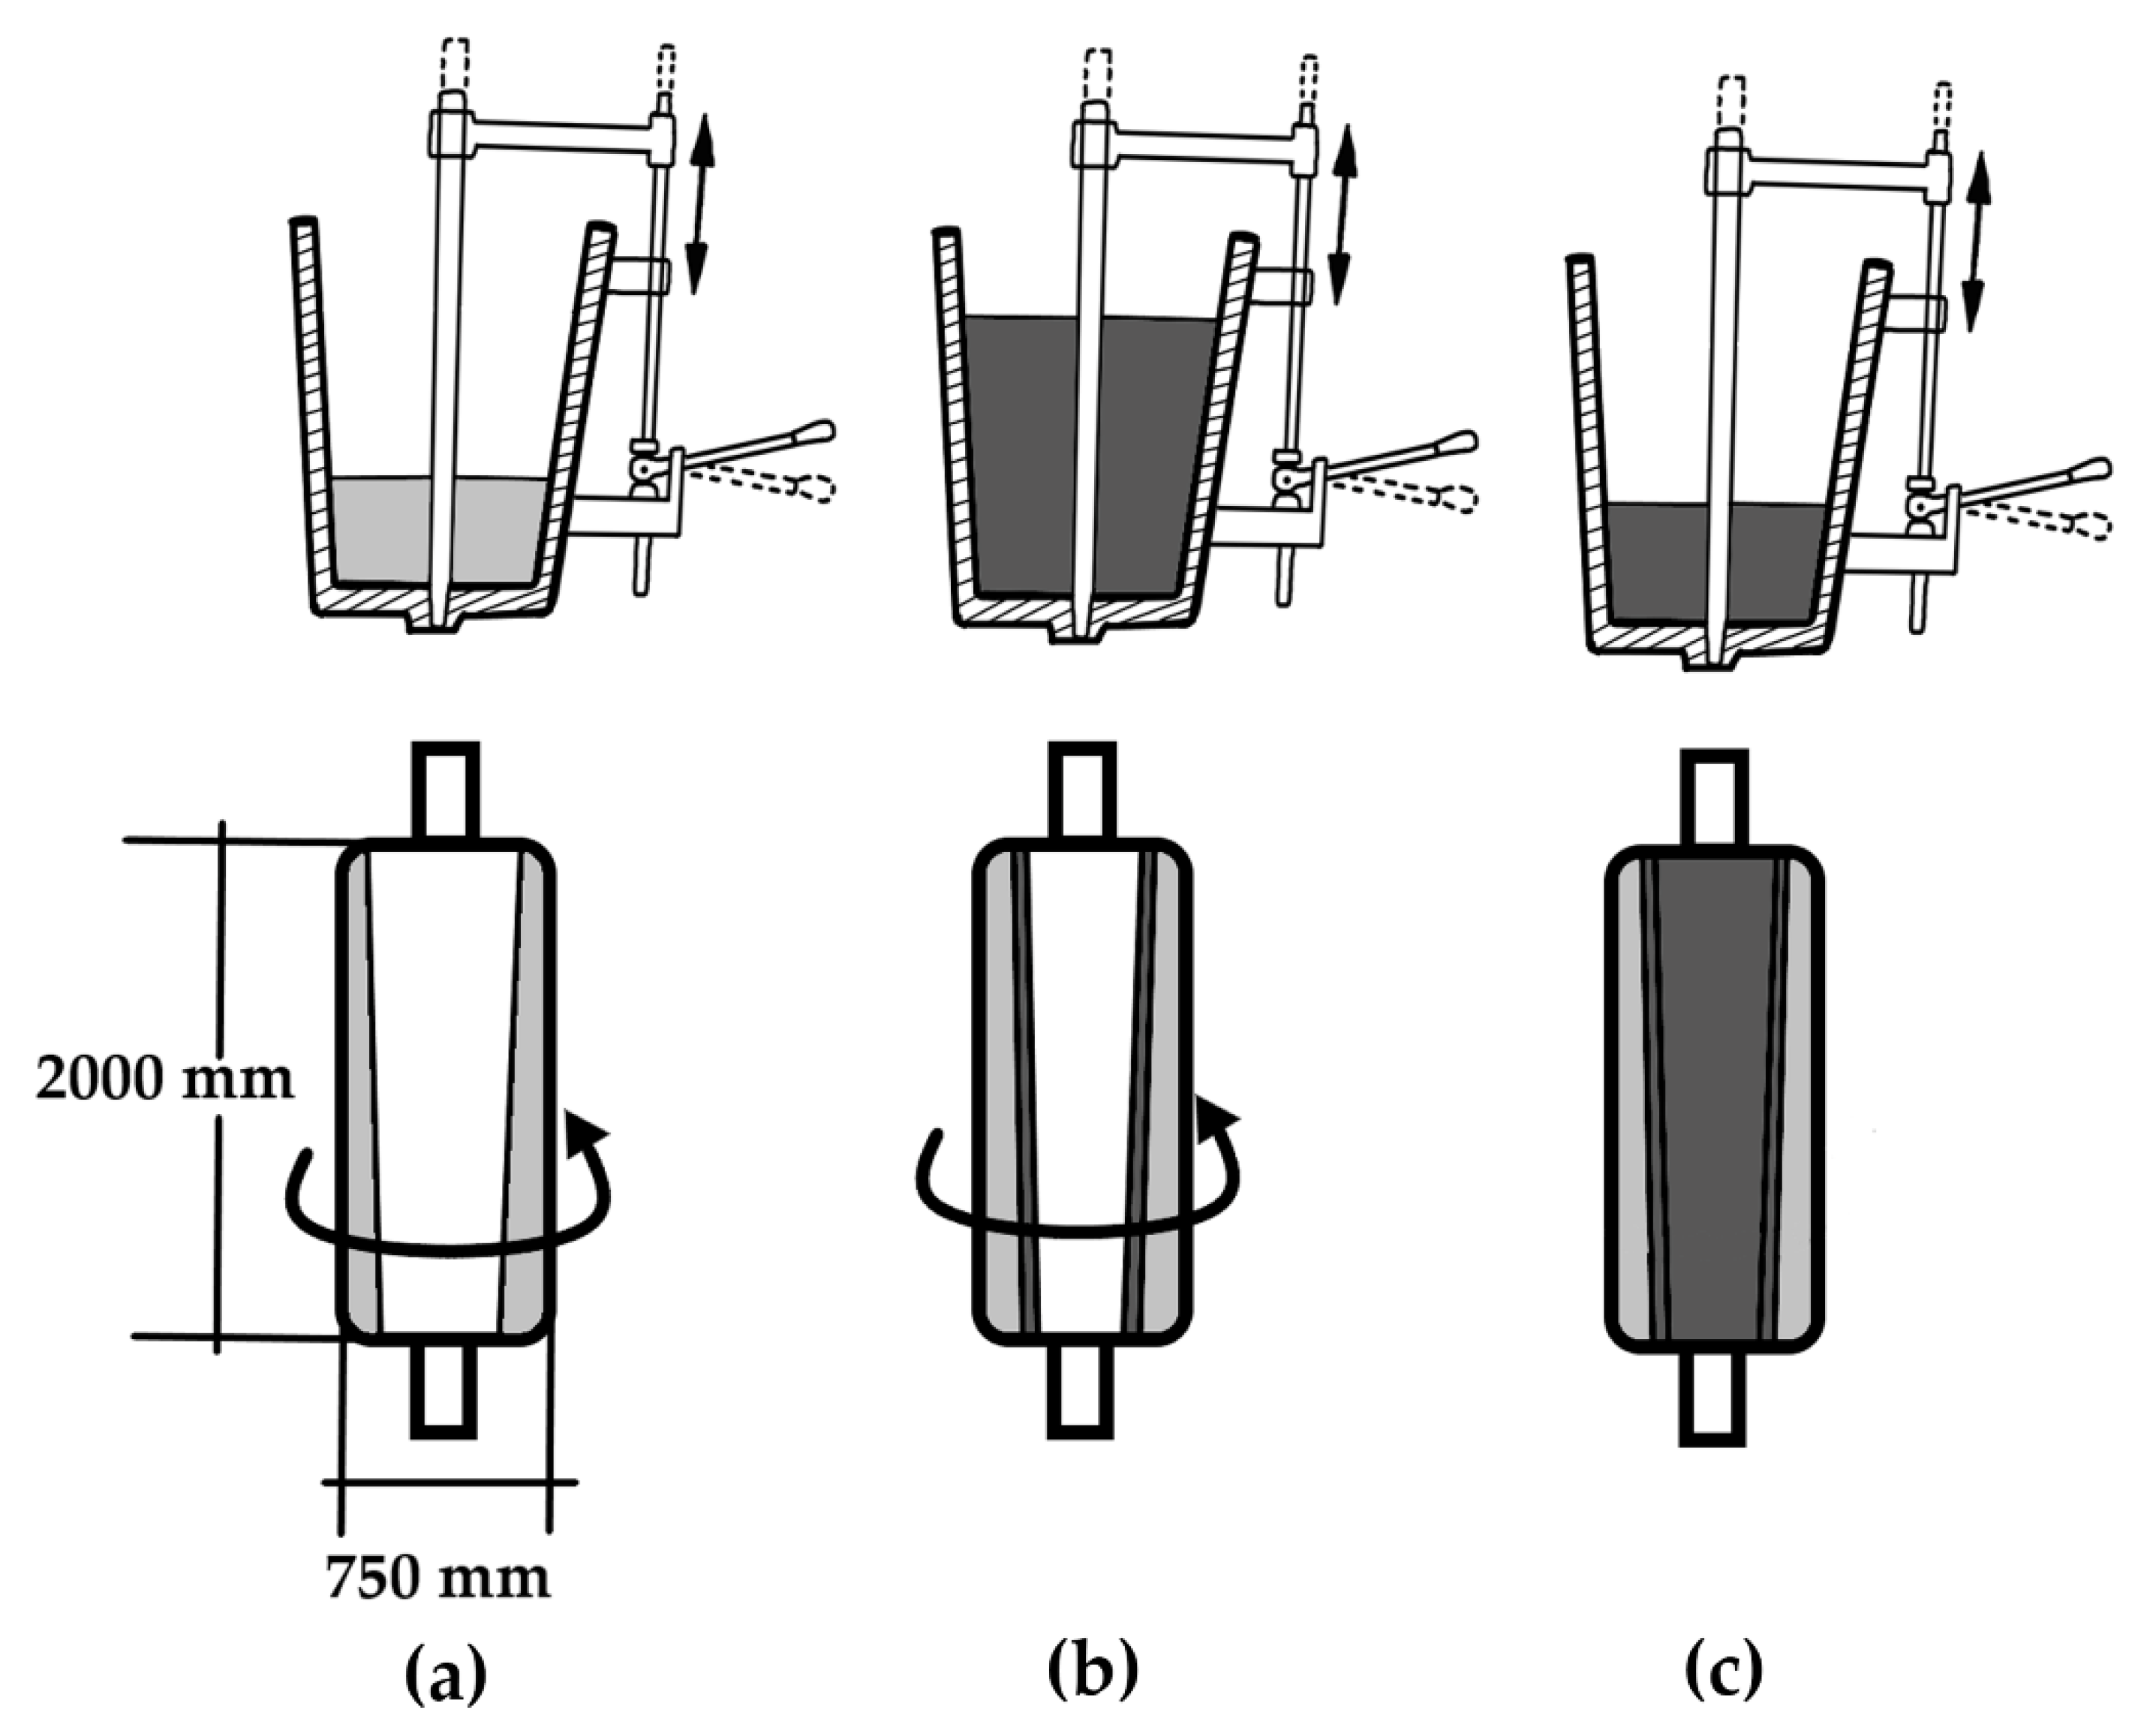
Figure 2.
Analysis zones in the work layer.
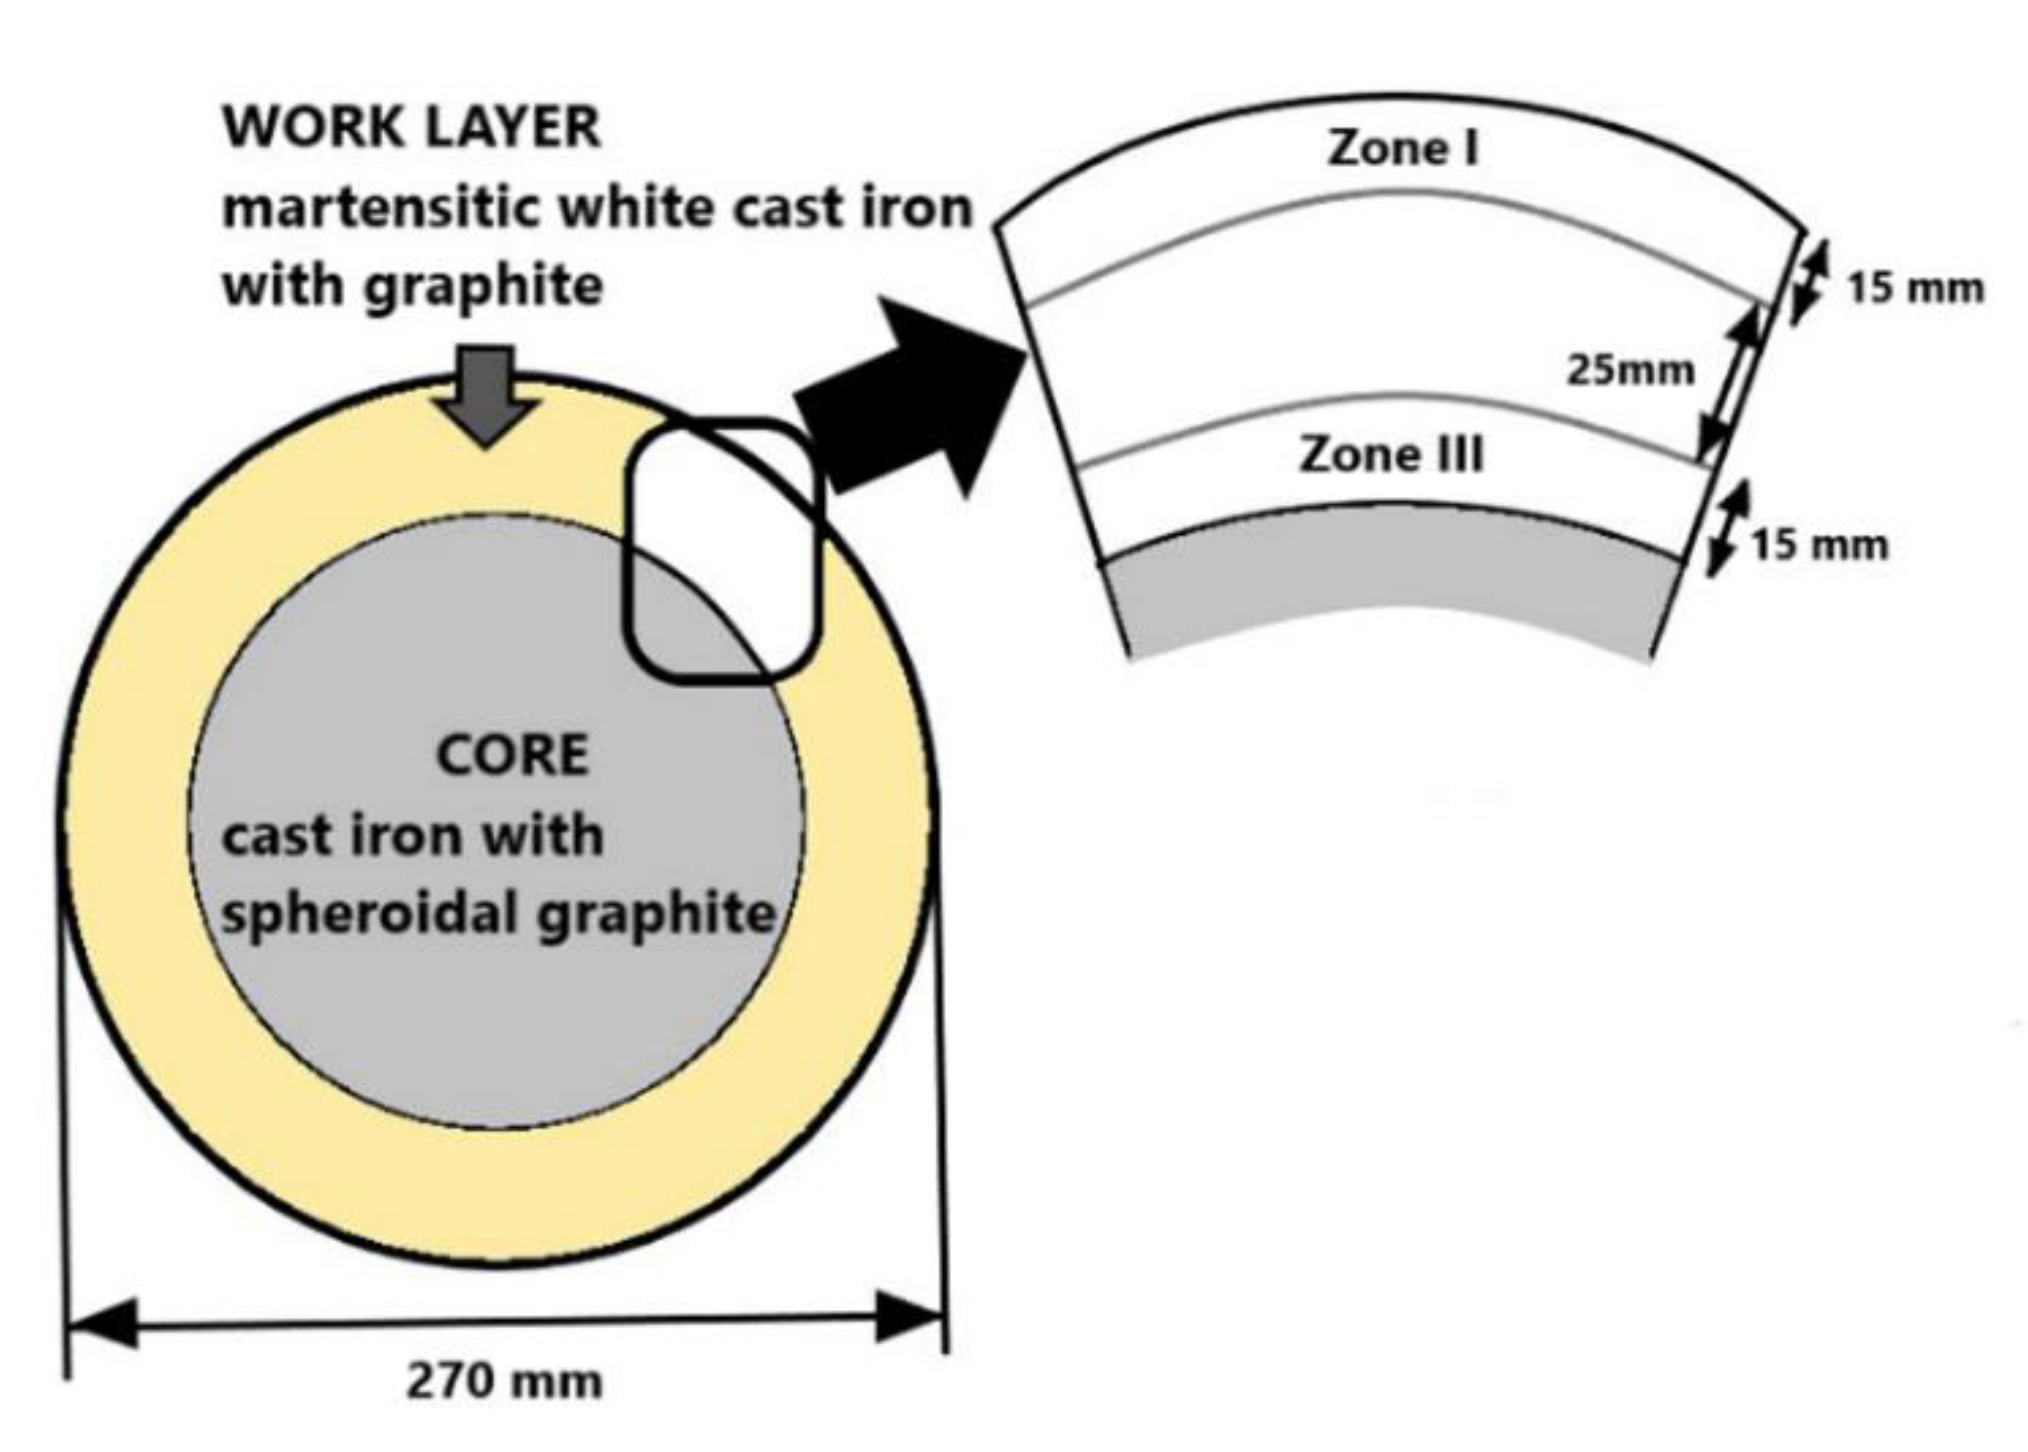
Figure 3.
General microstructure of the work layer. (a) Experiment 1 in zone III; (b) experiment 3 in zone I; (c) experiment 4 in zone III; (d) experiment 7 in zone I.
Figure 3.
General microstructure of the work layer. (a) Experiment 1 in zone III; (b) experiment 3 in zone I; (c) experiment 4 in zone III; (d) experiment 7 in zone I.
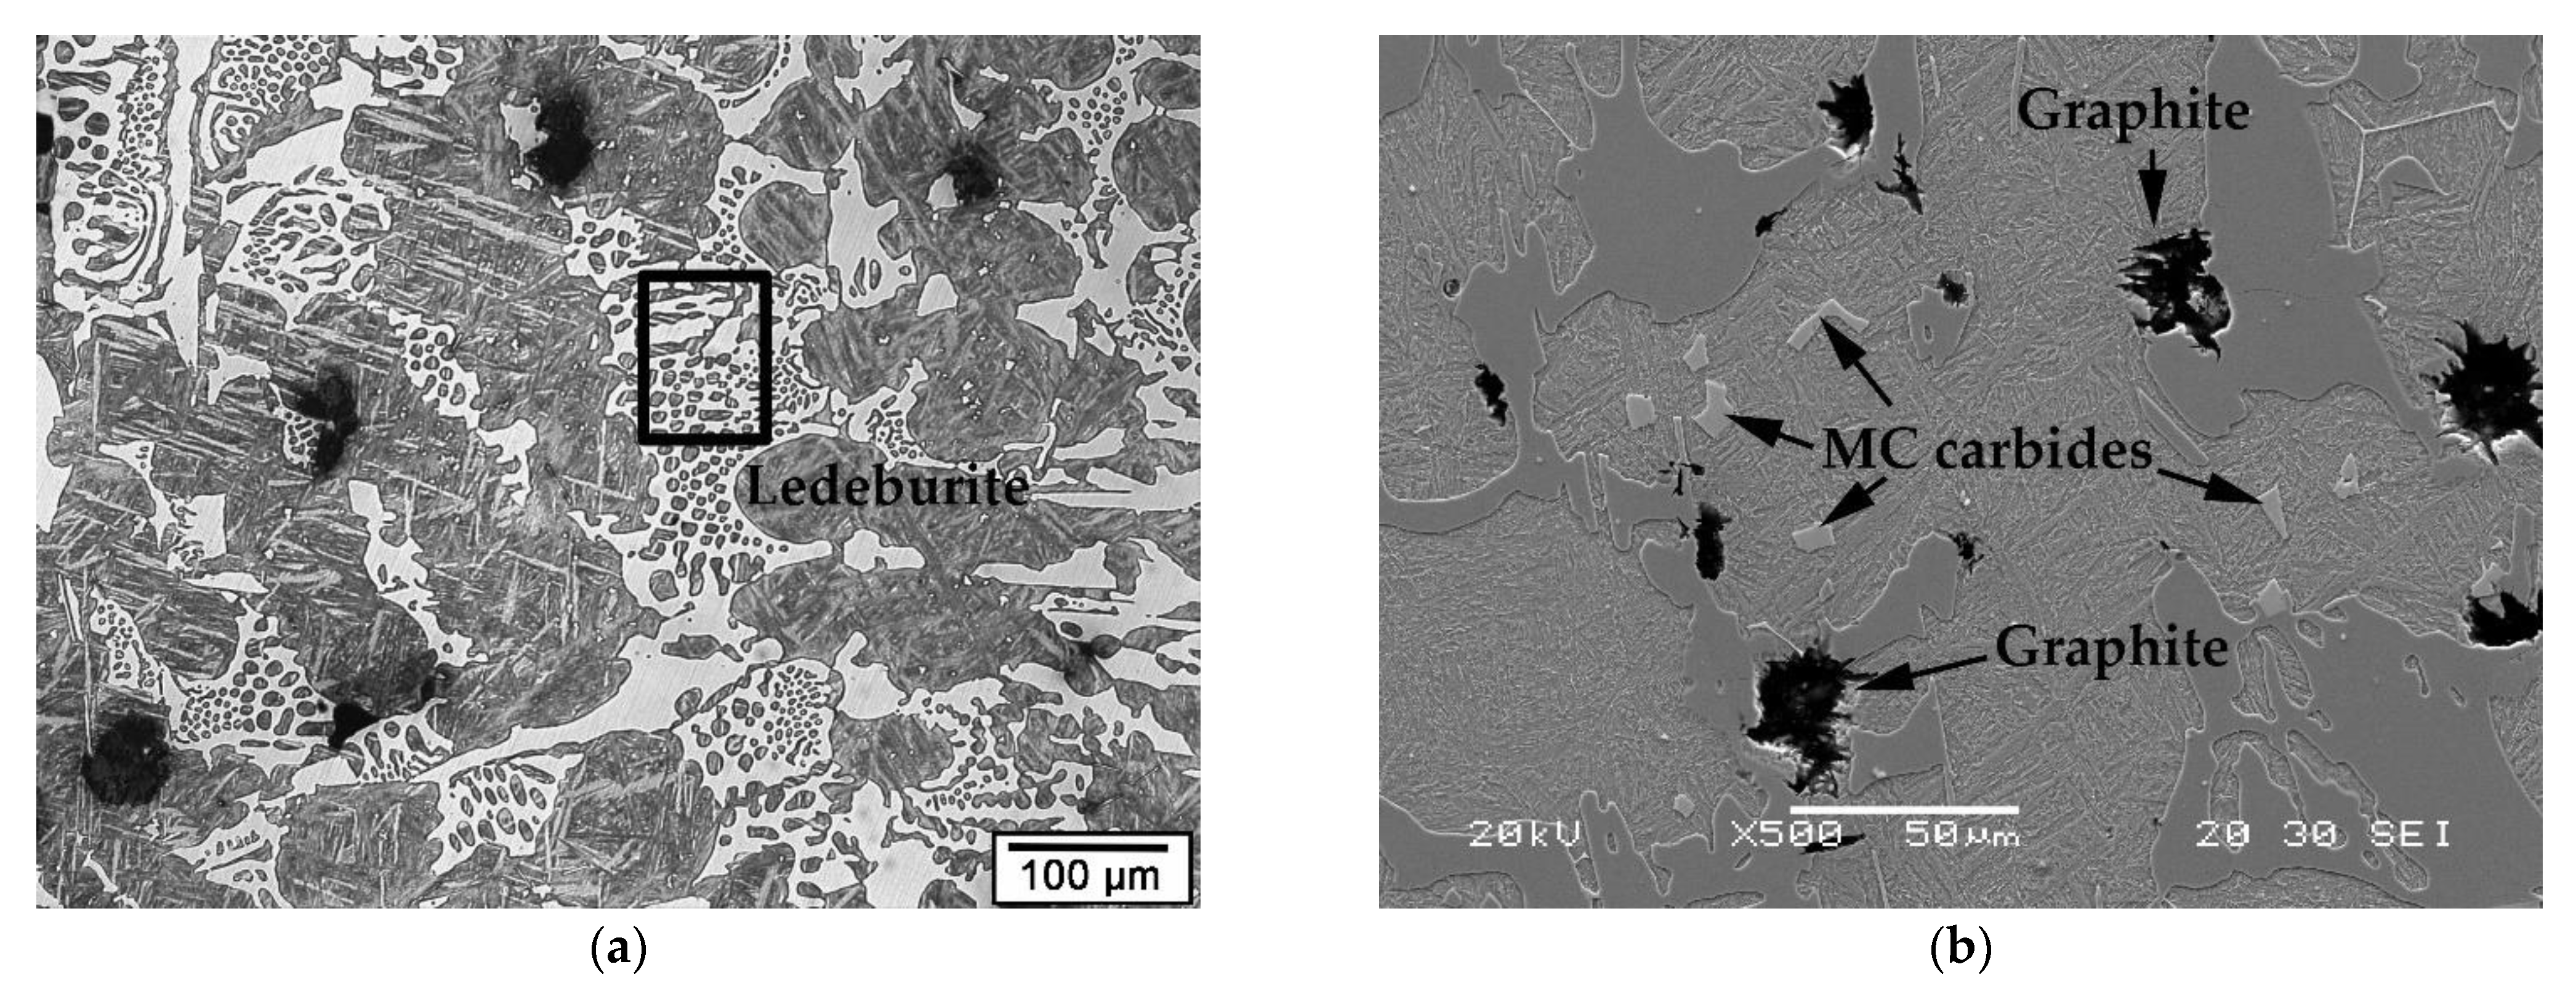

Figure 4.
Main phases and constituents. (a) Experiment 2 in zone I, ledeburite; (b) experiment 3 in zone III, graphite; (c) experiment 3 in zone I, carbides; (d) experiment 6 in zone I, carbides.
Figure 4.
Main phases and constituents. (a) Experiment 2 in zone I, ledeburite; (b) experiment 3 in zone III, graphite; (c) experiment 3 in zone I, carbides; (d) experiment 6 in zone I, carbides.
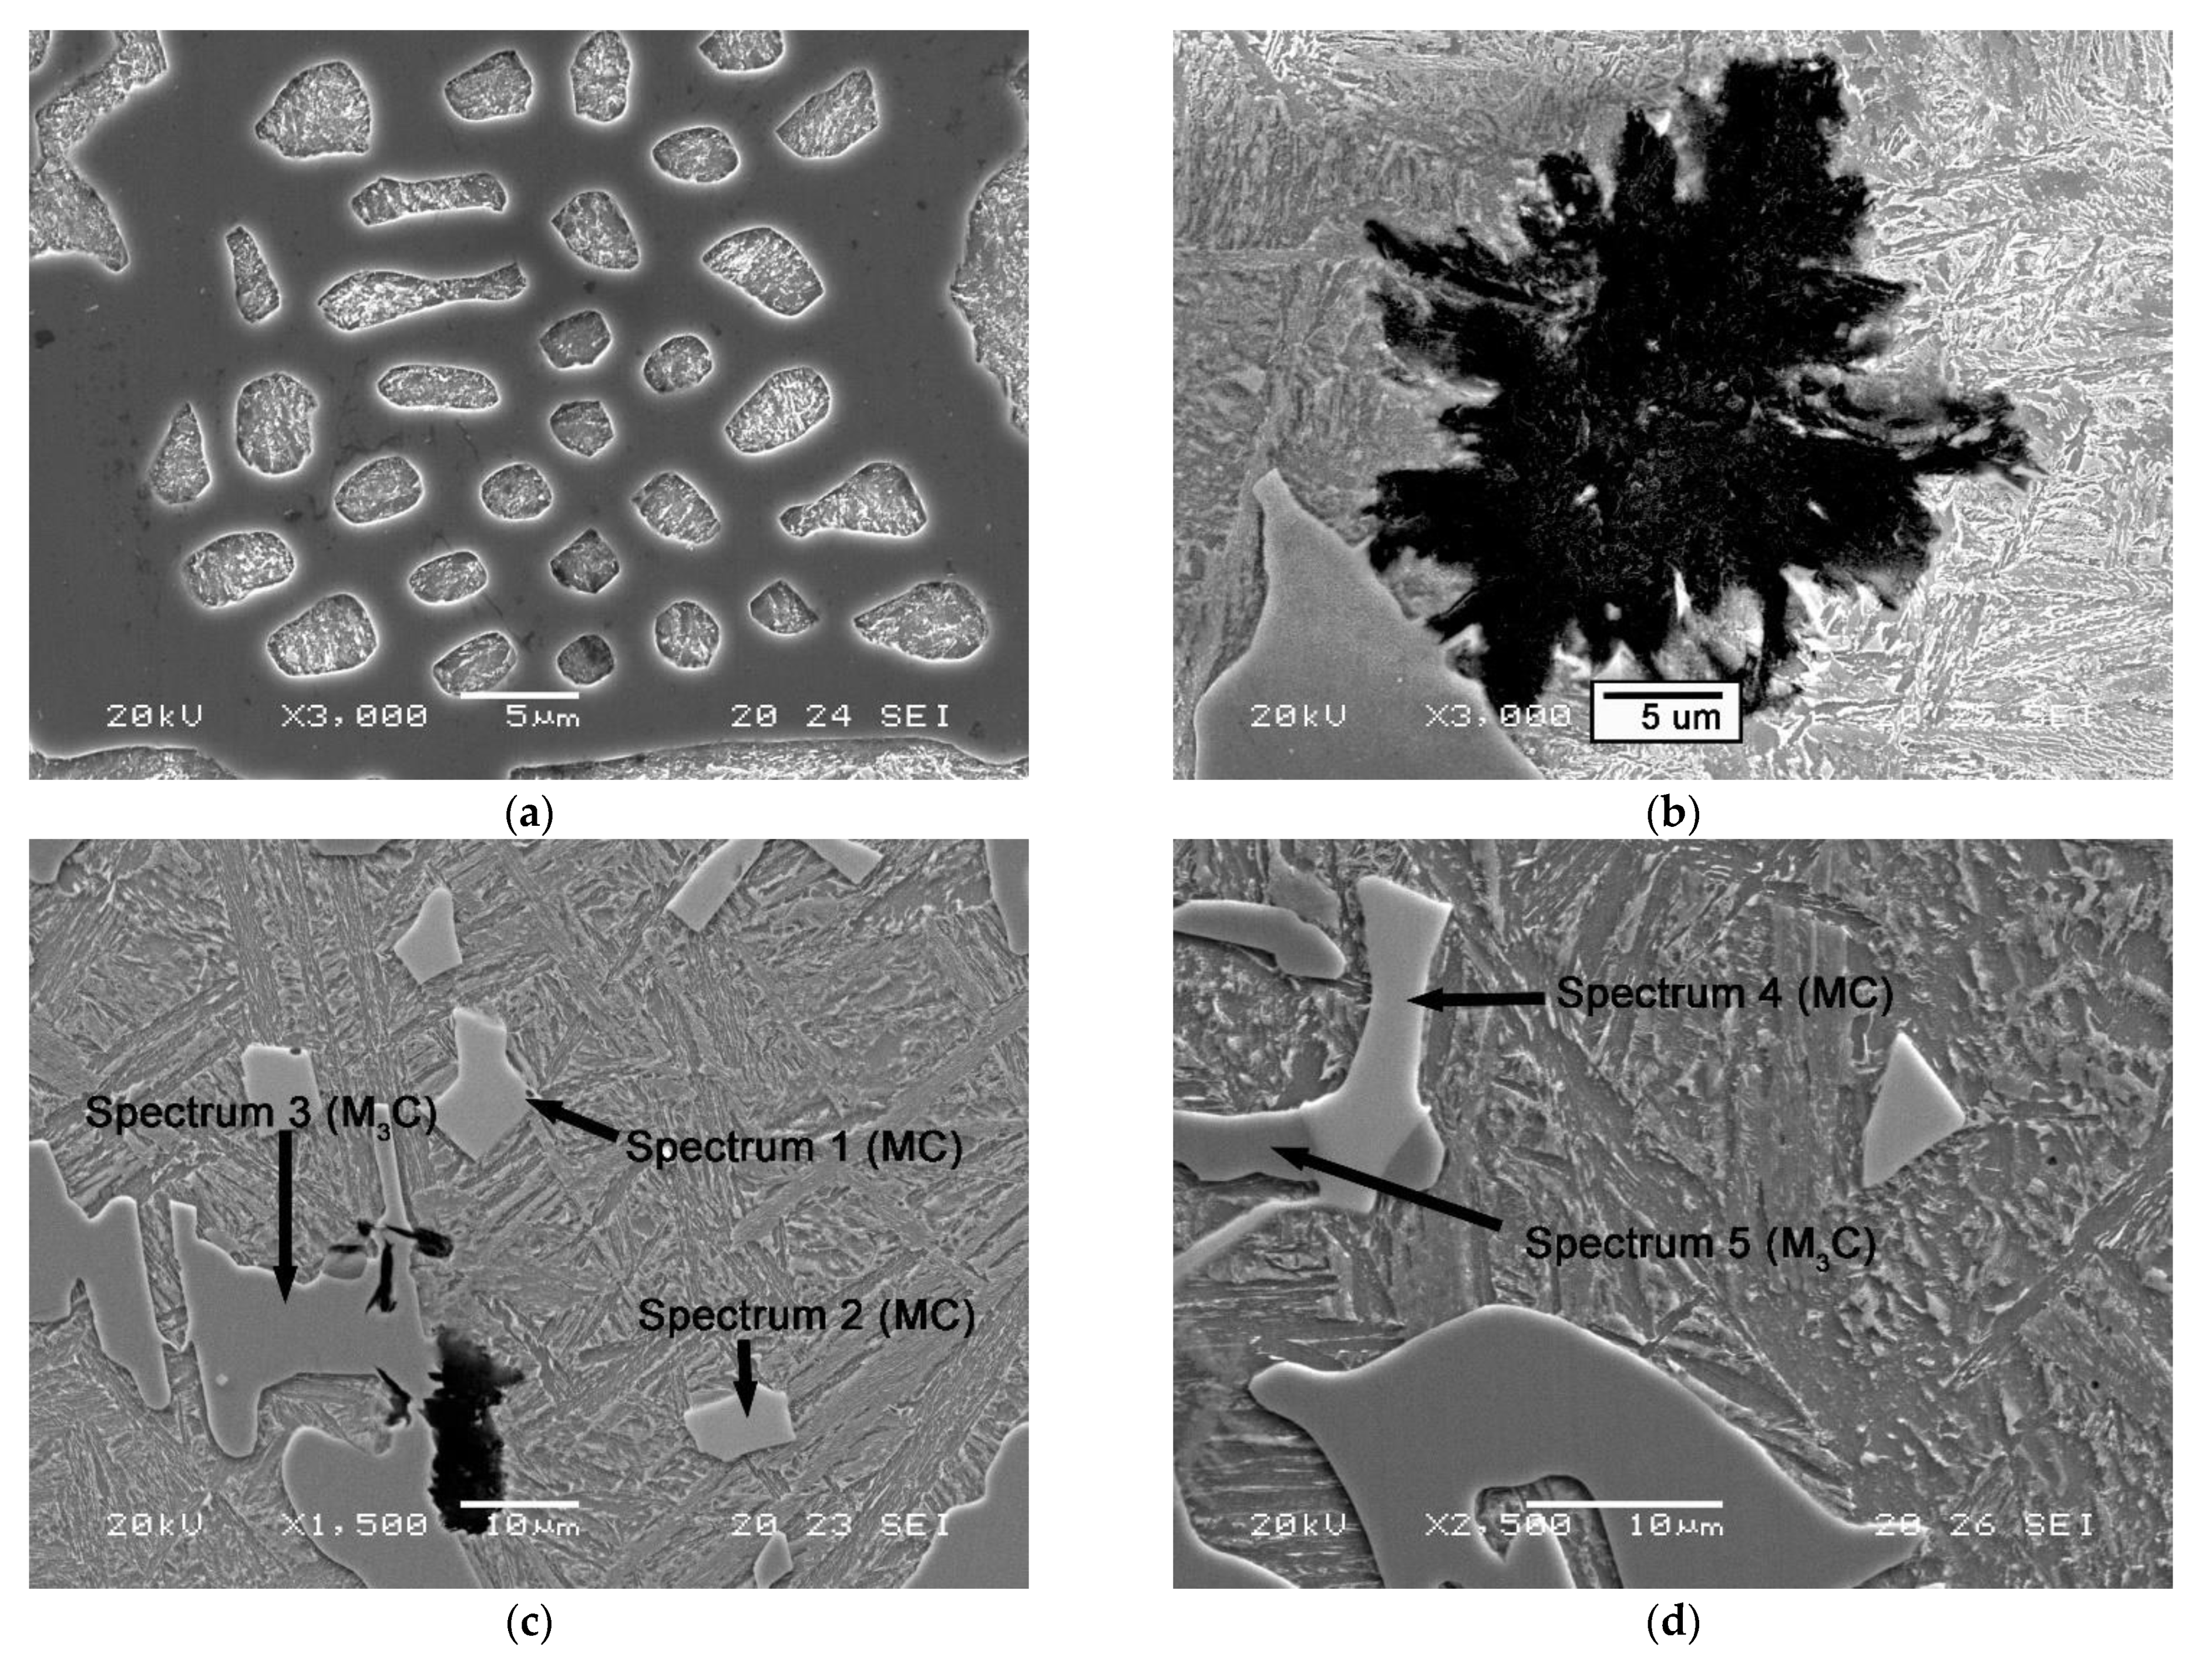
Figure 5.
Representation of the effects in a normal probability paper on Vol.% carbides. (a) Zone I; (b) zone III.
Figure 5.
Representation of the effects in a normal probability paper on Vol.% carbides. (a) Zone I; (b) zone III.
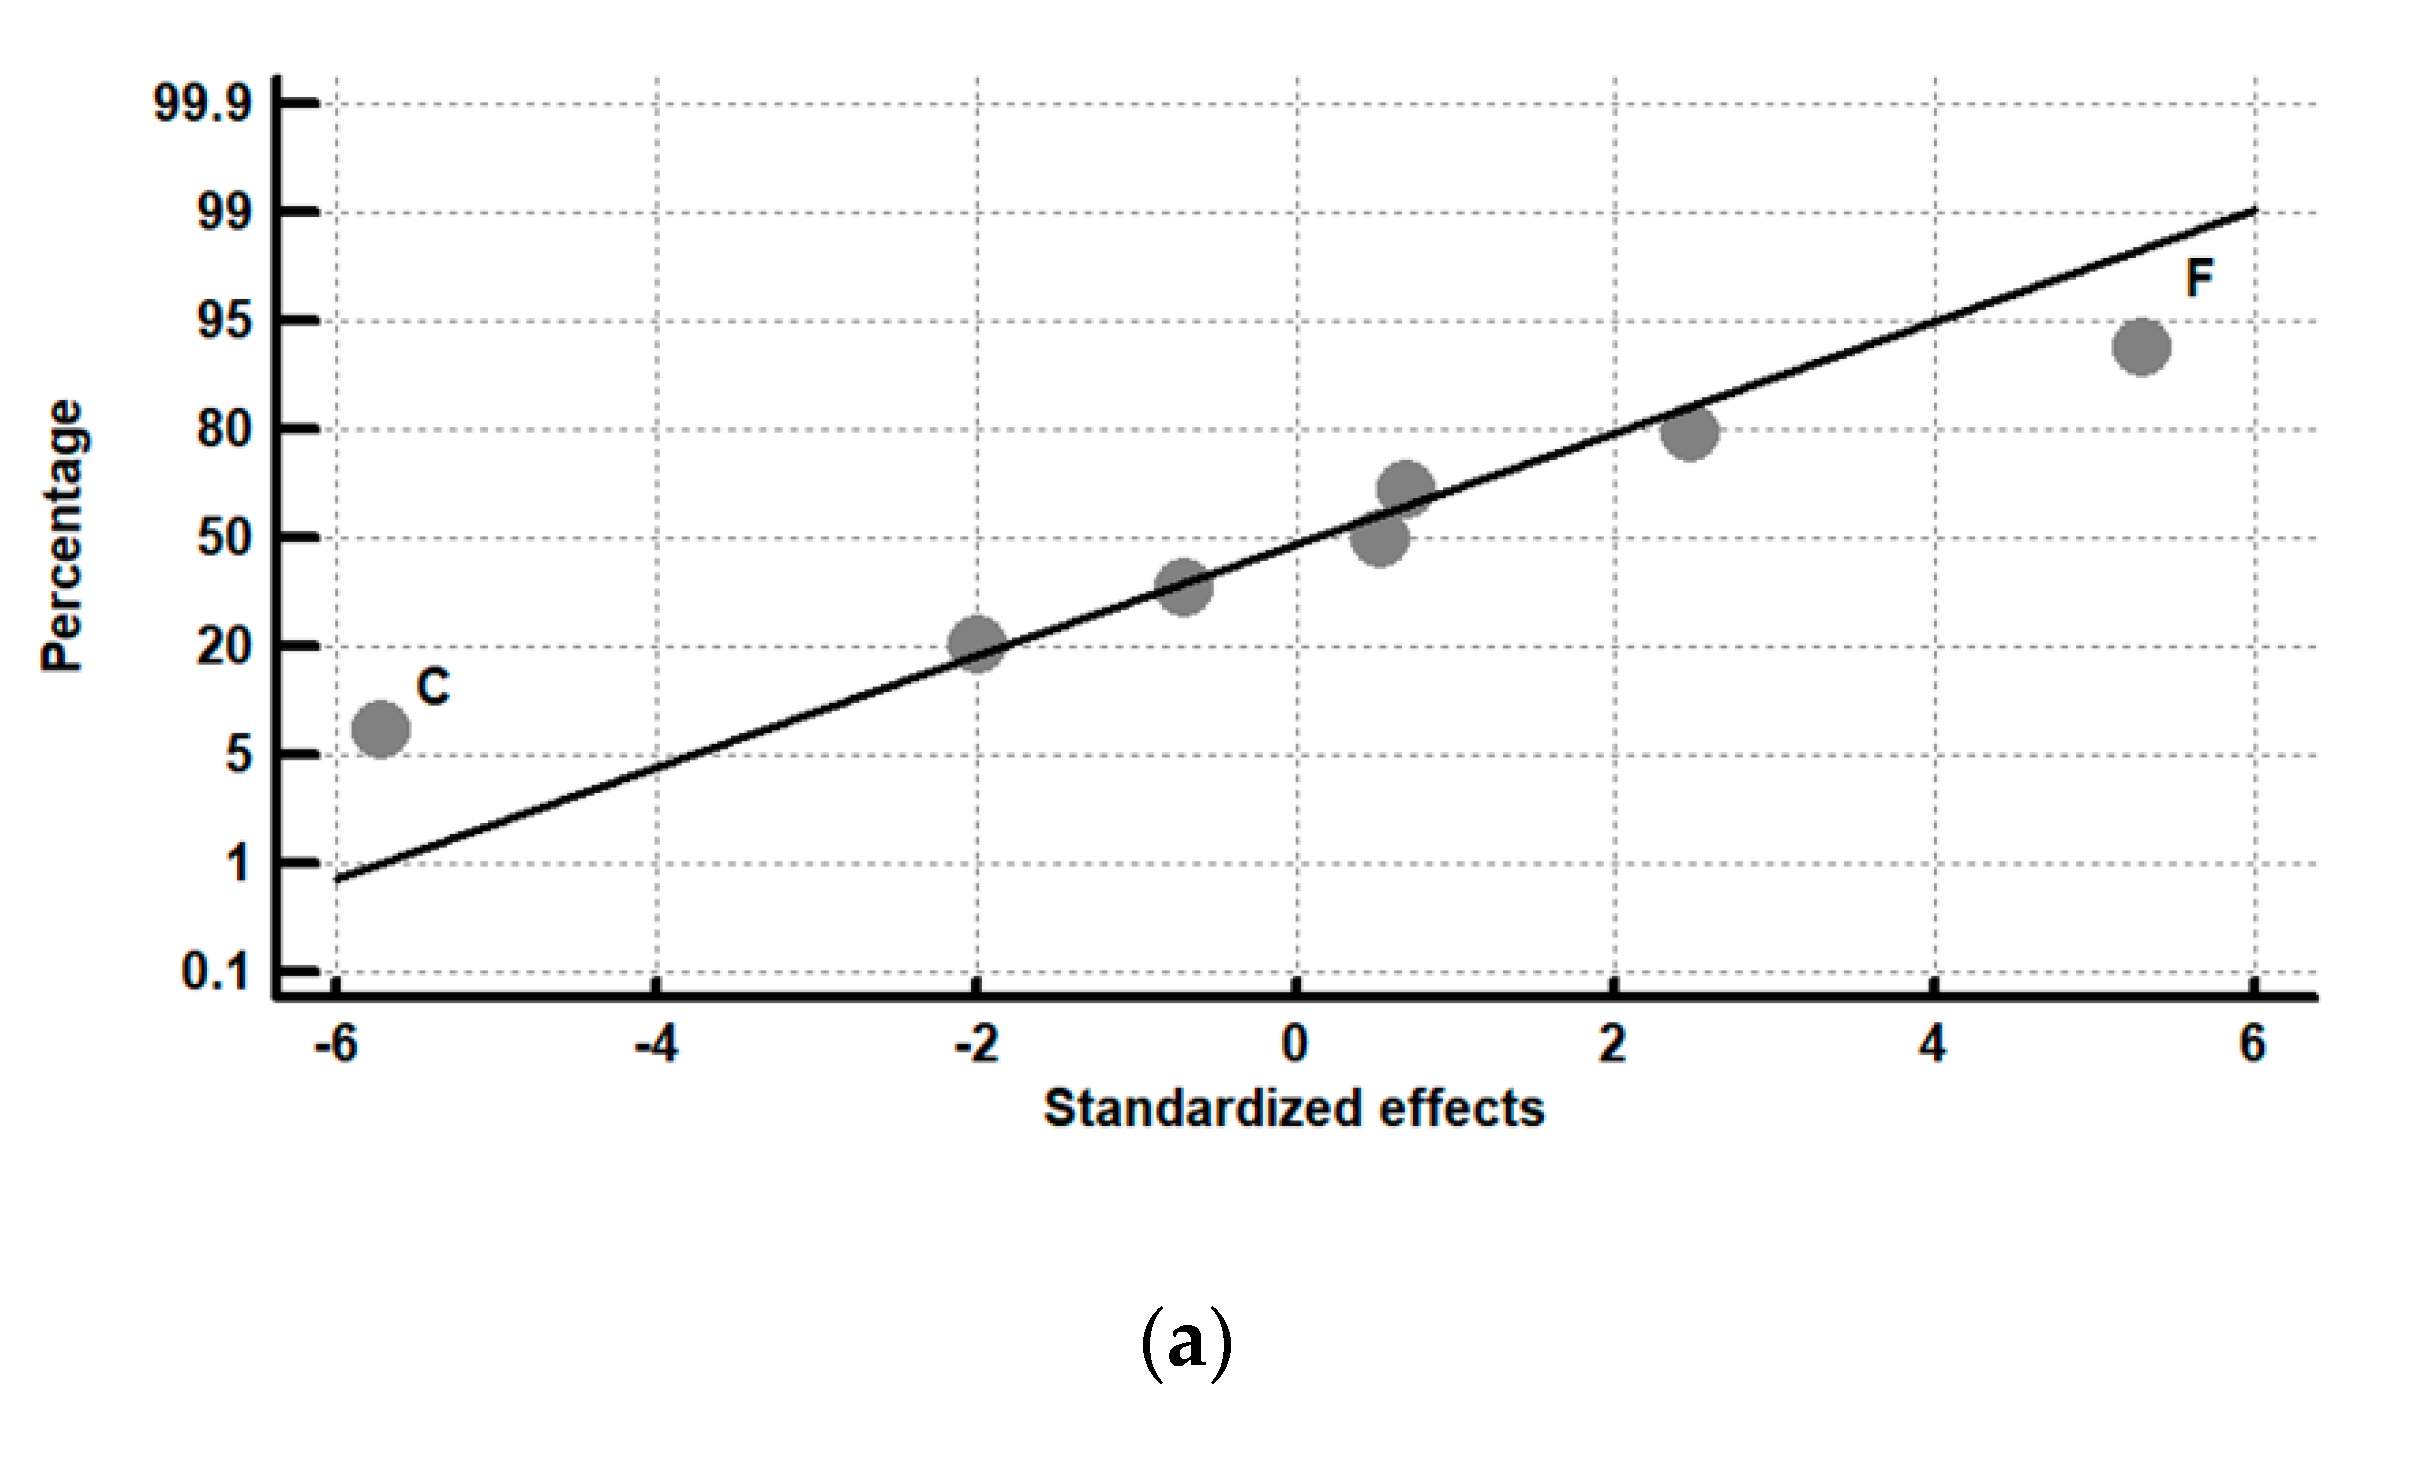
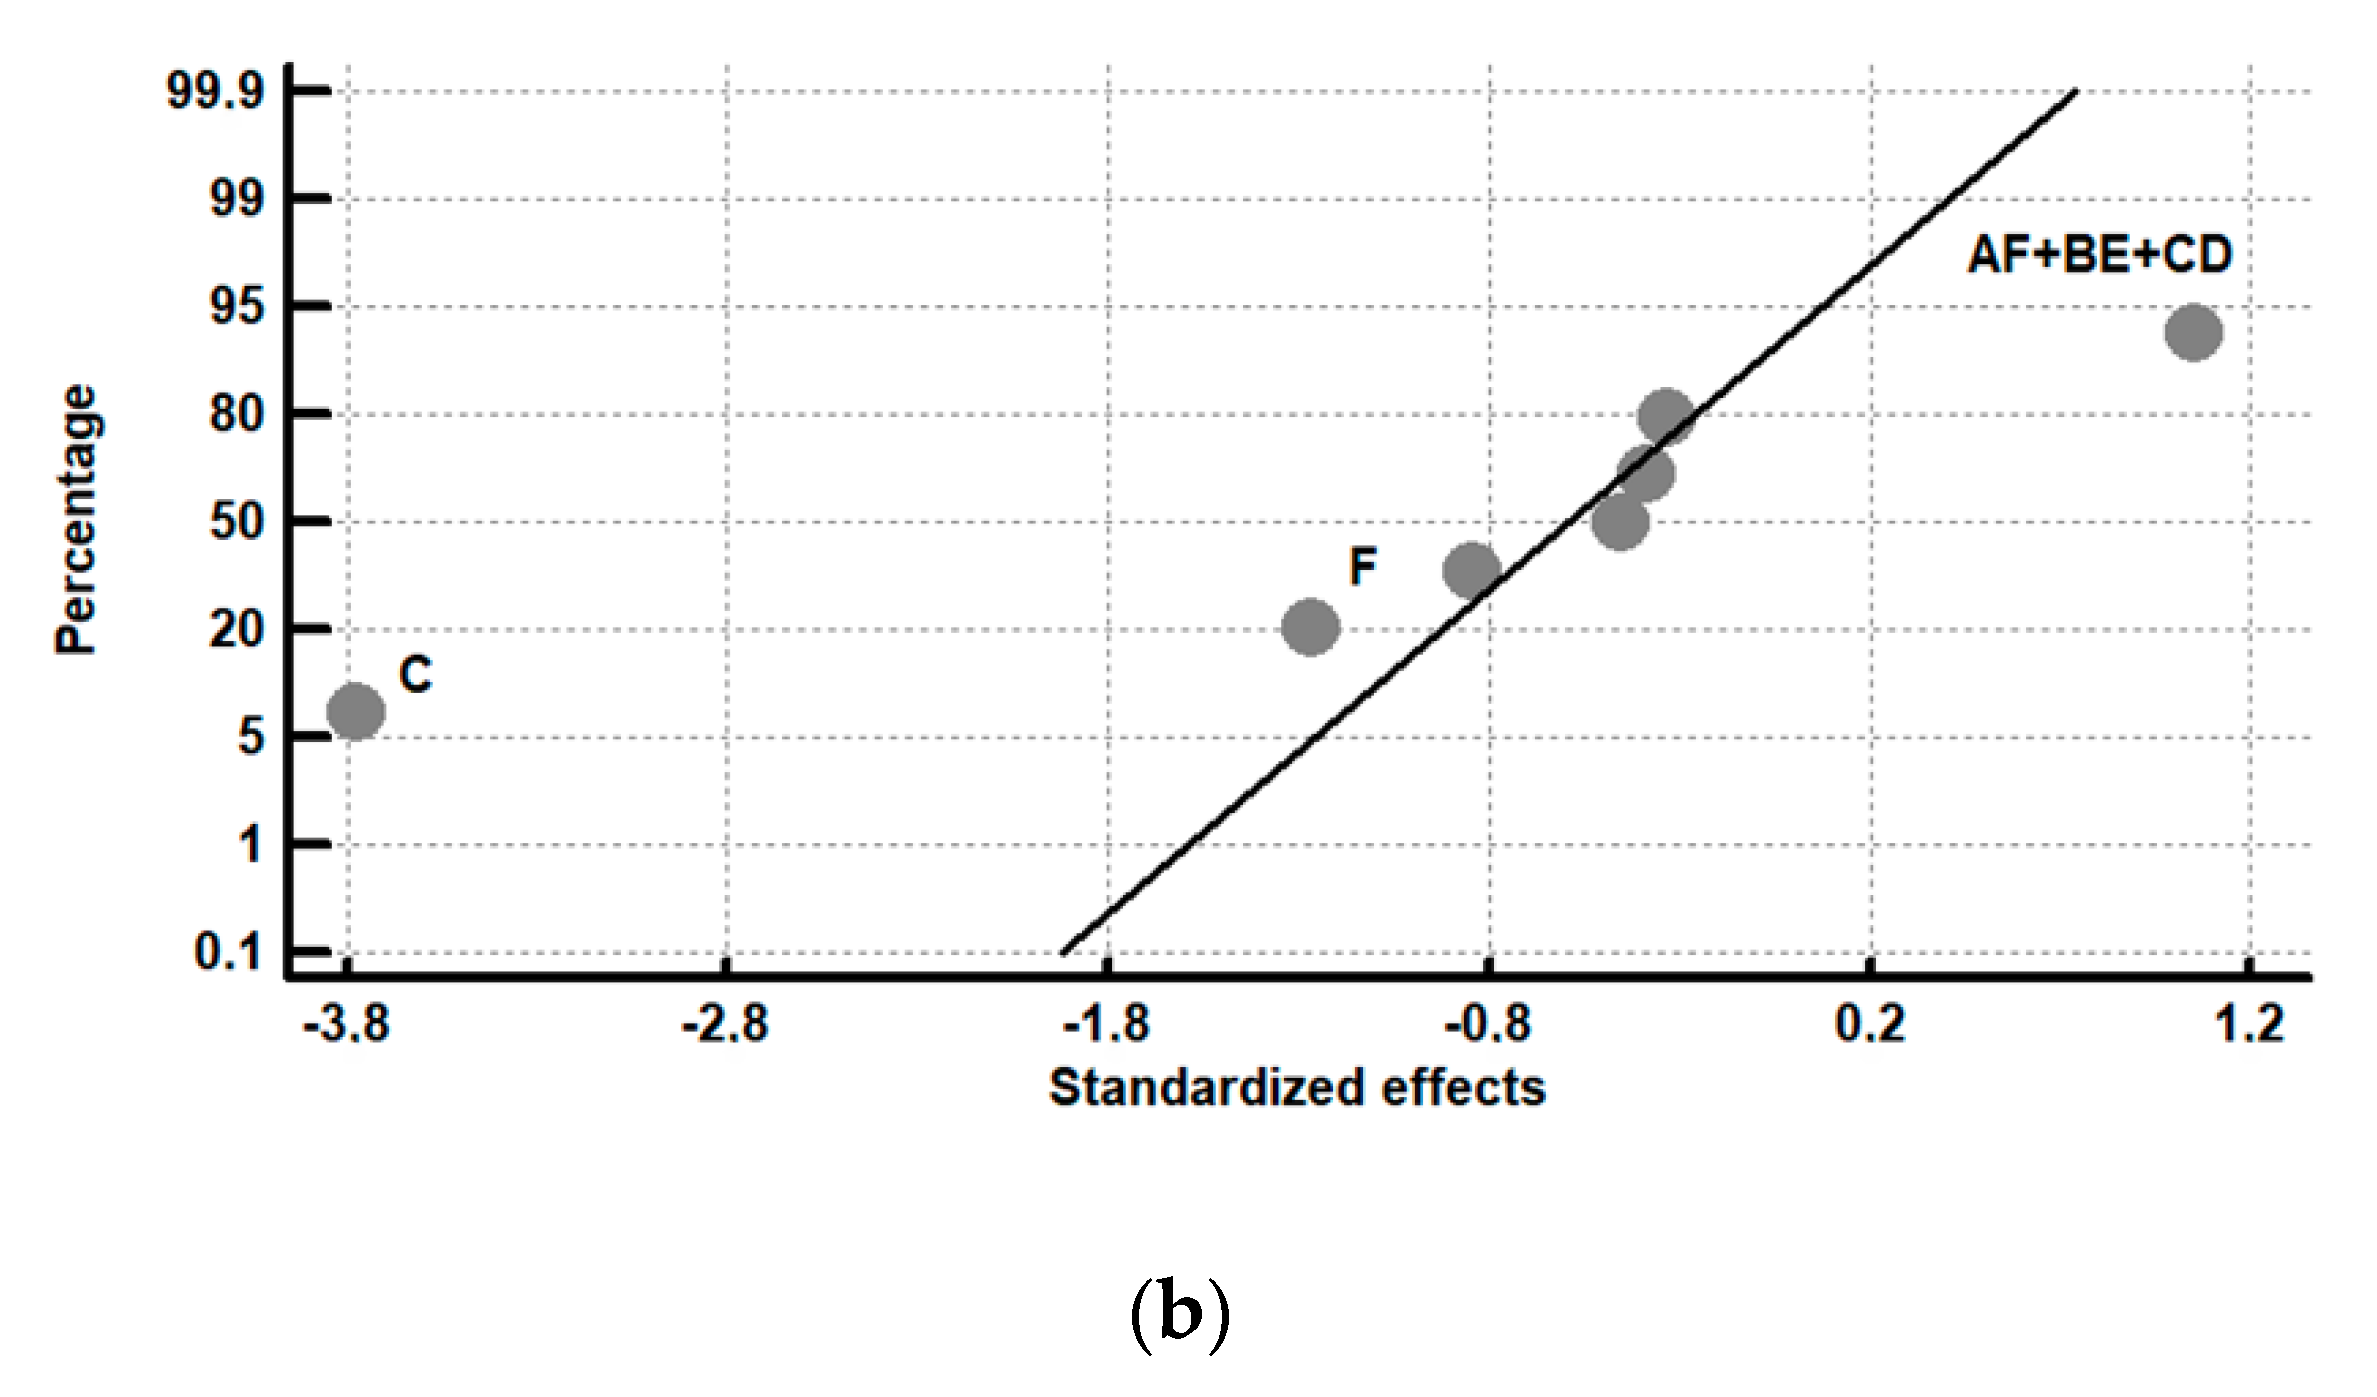
Figure 6.
Graphic representation of wear in zone I (a) 250 °C. Representation of the effects on a normal probability paper; (b) 250 °C. Representation of the effects in a Pareto diagram; (c) 350 °C. Representation of the effects on a normal probability paper; (d) 350 °C. Representation of the effects in a Pareto diagram.
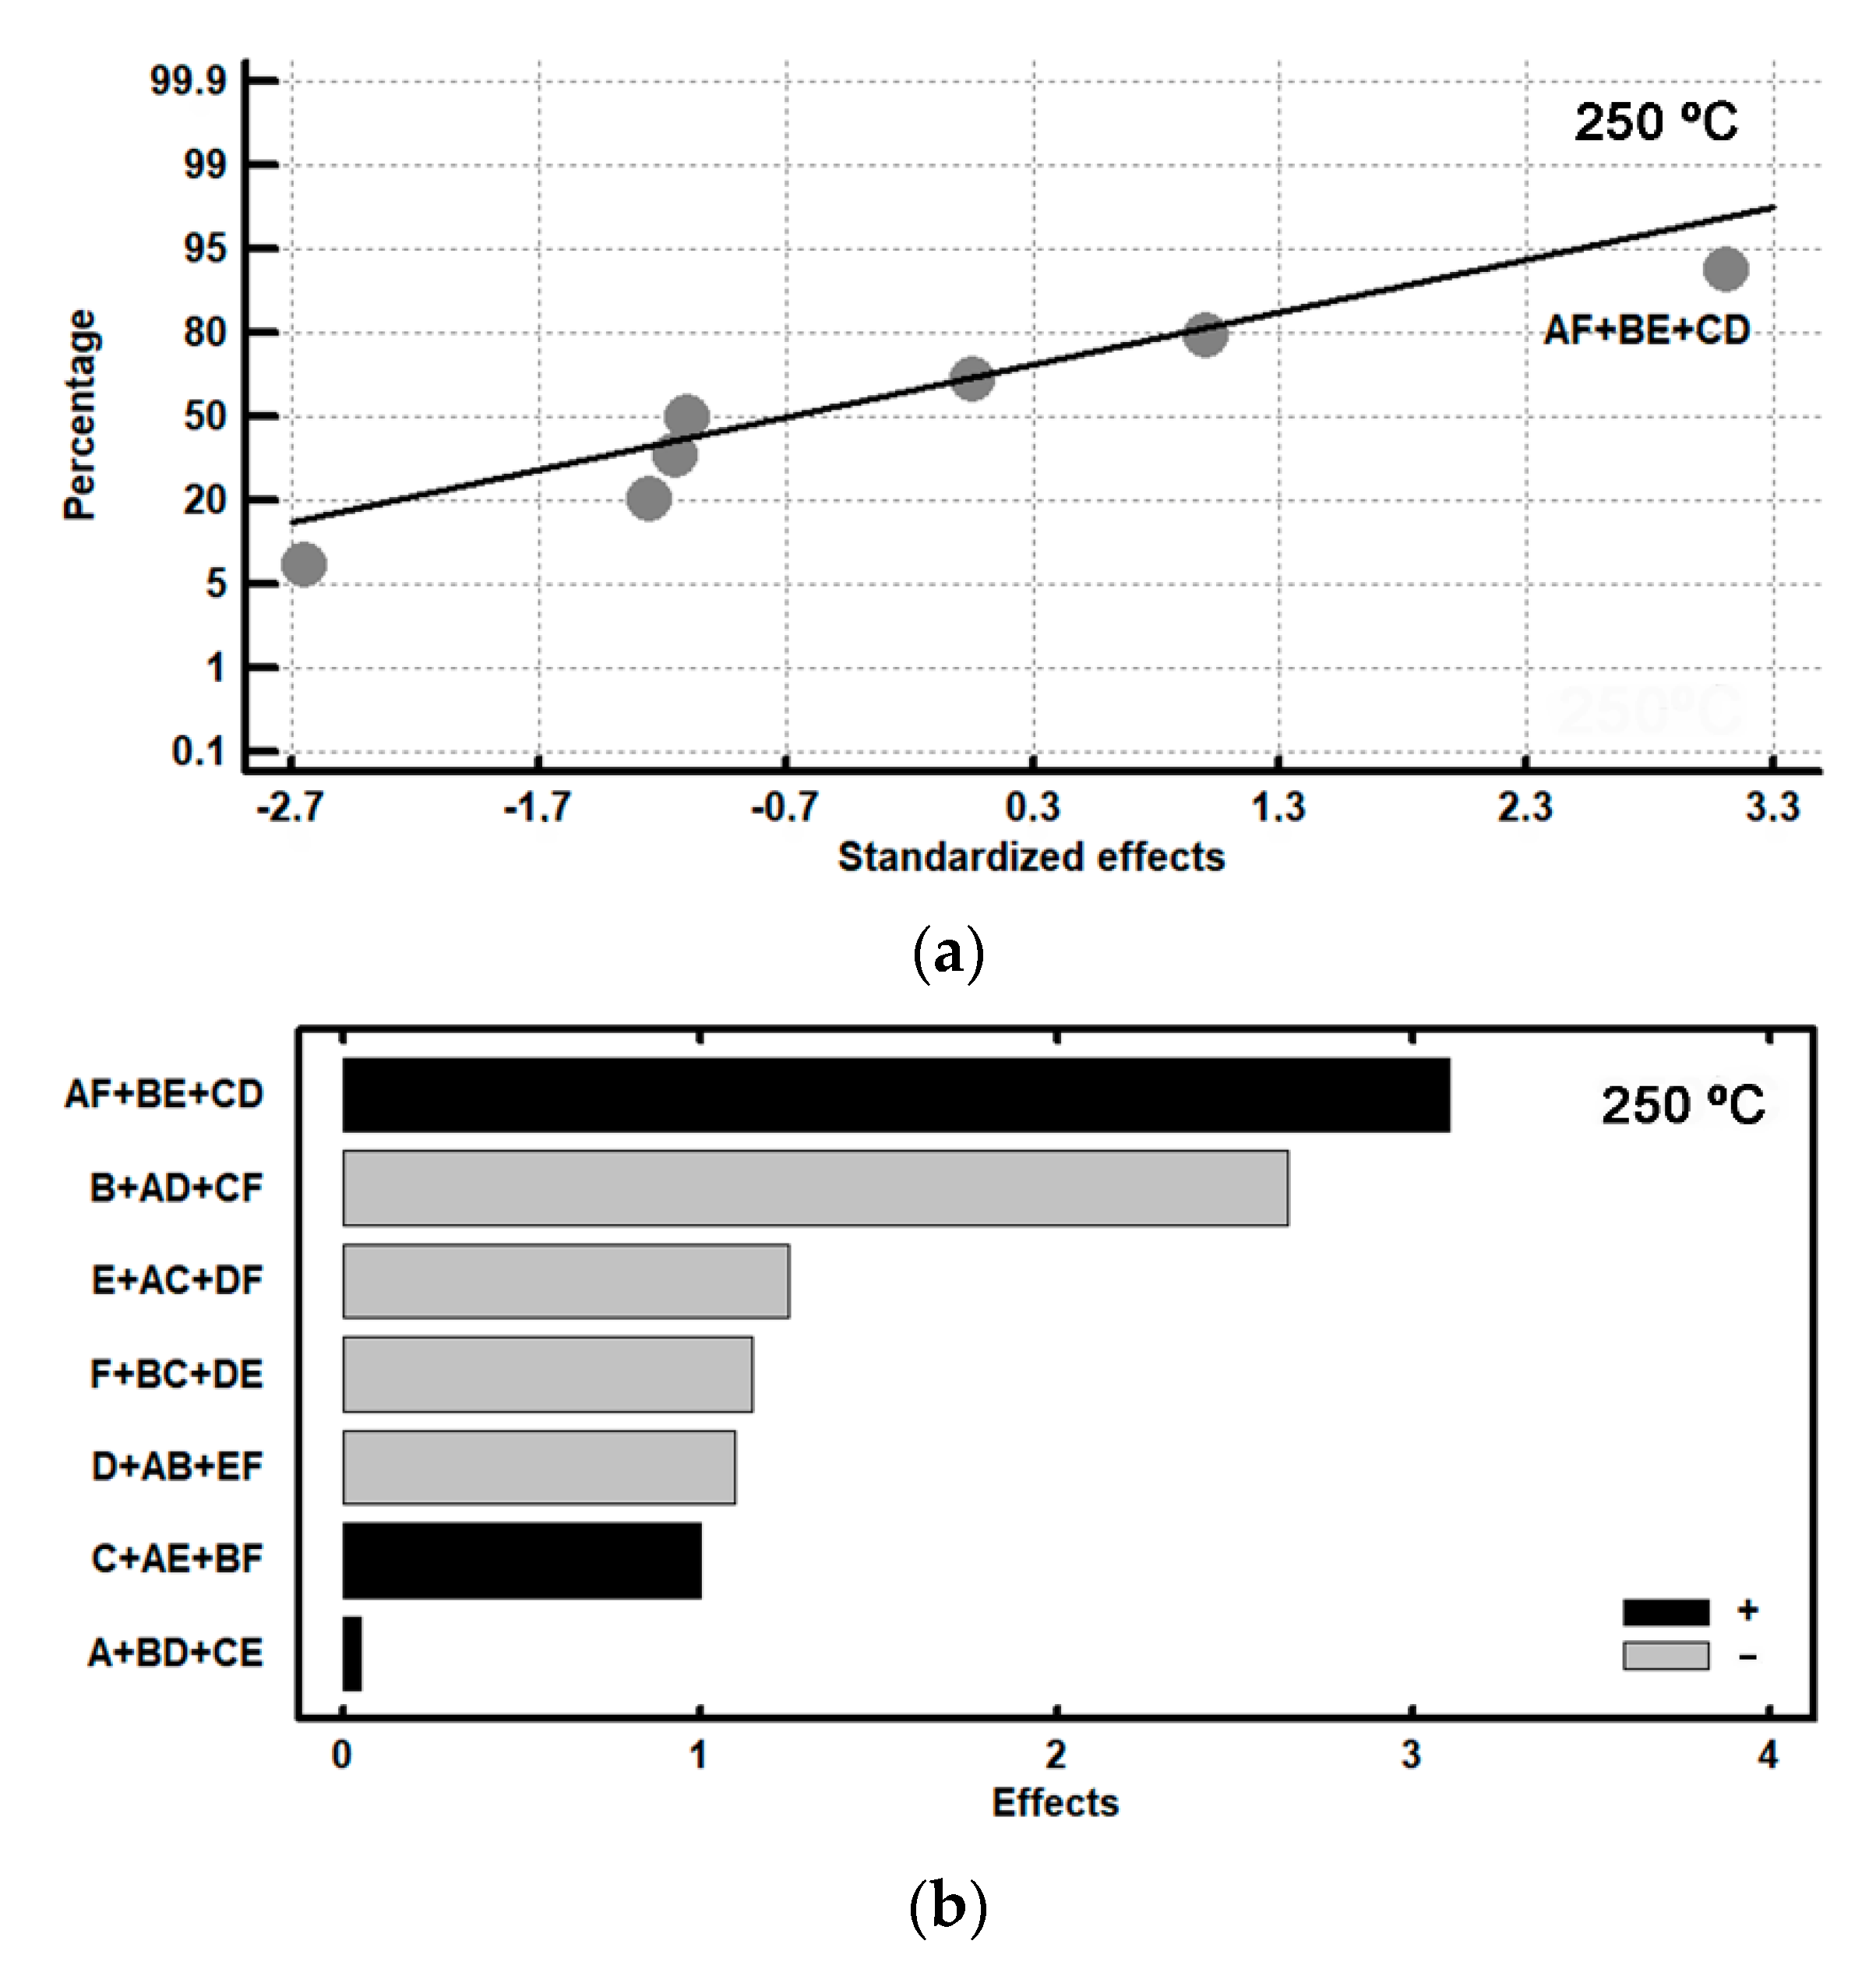
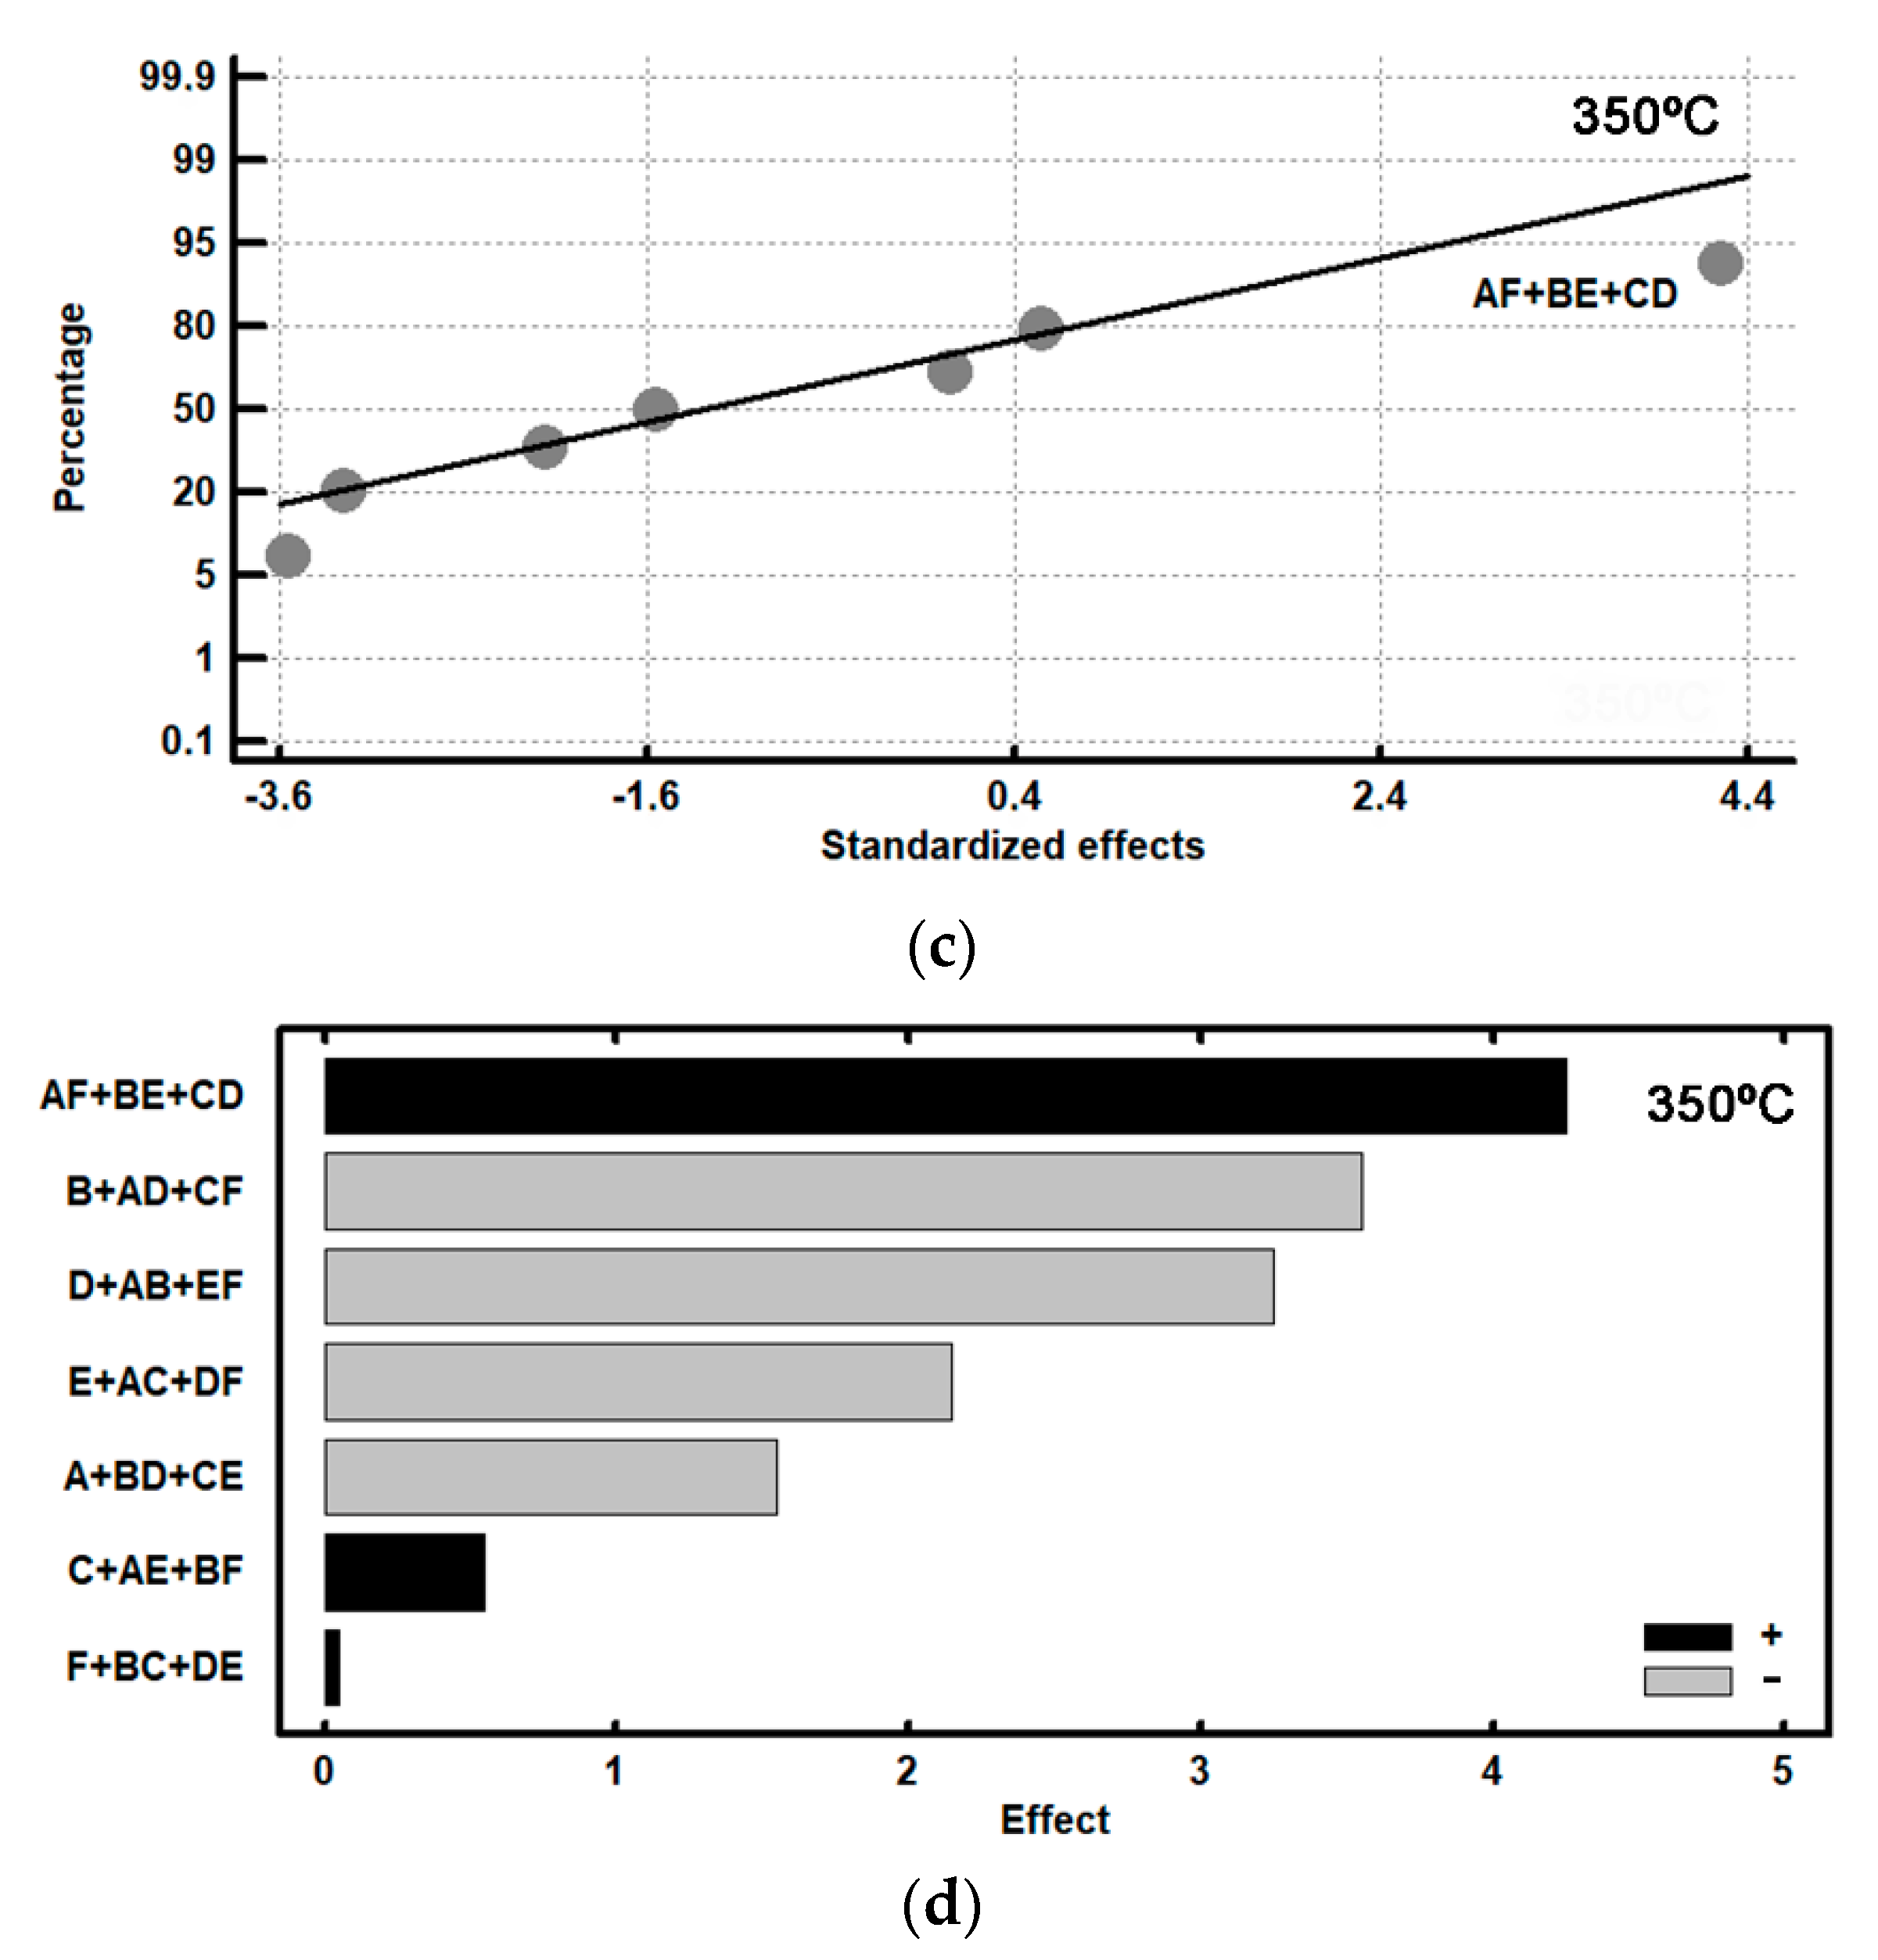
Figure 7.
Graphic representation of wear in zone III. (a) 250 °C, representation of effects on a normal probability paper. (b) 250 °C, representation of effects in a Pareto diagram; (c) 350 °C, representation of effects on a normal probability paper; (d) 350 °C, representation of effects in a Pareto diagram.


Table 1.
Range of chemical composition of the outer layer and of the core (wt. %).
| Work-Roll | C | Si | Mn | Ni | Cr | Nb | Mo | Mg |
|---|---|---|---|---|---|---|---|---|
| Work layer | 3.2–3.4 | 0.9–1.0 | 0.8–1.0 | 4.4–4.6 | 1.7–1.8 | 0.65–0.75 | 0.25 | -- |
| Core (ASTM Grade 100–70–03) | 3–3.02 | 2.2–2.3 | 0.2–0.4 | 0.1–0.2 | 0–0.1 | -- | 0–0.02 | 0.06–0.08 |
Table 2.
Factors and levels analysed in the Design of Experiments.
| Factors | Levels | ||
|---|---|---|---|
| Code | Metallurgical Parameter Correspondence | Level −1 | Level +1 |
| A | FeSi-La (Kg/T) | 0 | 2.7 |
| B | FeB (Kg/T) | 3 | 6 |
| C | Liquidus Temperature (°C) | 1250–1255 | 1270–1275 |
| D | Si (wt. %) | 0.8–0.85 | 1.1–1.15 |
| E | SiCaMn (Kg/T) | 0.3 | 0.6 |
| F | Mg (wt. %) | 0 | 0.02 |
Table 3.
Chemical composition of inoculants given in weight %.
| Inoculants | Base Chemistry | ||||||||||||
|---|---|---|---|---|---|---|---|---|---|---|---|---|---|
| Si | Ca | Al | Mn | Ti | Ba | C | Bi | S | P | B | La | Fe | |
| FeSi-La | 66.0 | 2.5 | 0.8 | --- | --- | 0.3 | --- | 0.3 | --- | --- | --- | 0.8 | rem 1. |
| SiCaMn | 58.3 | 16.4 | 1.1 | 14.8 | 0.030 | 0.6 | 0.030 | 0.030 | --- | rem 1. | |||
| FeB | 0.4 | --- | --- | --- | --- | 0.3 | --- | --- | 17.9 | rem 1. | |||
1 Remainder.
Table 4.
Matrix of experiments.
| No. | A | B | C | D | E | F | Confounding Patterns |
|---|---|---|---|---|---|---|---|
| 1 | –1 | –1 | –1 | +1 | +1 | +1 | A + BD + CE B + AD + CF C + AE + BF D + AB+ EF E + AC + DF F + BC + DE AF + BE + CD |
| 2 | +1 | –1 | –1 | –1 | –1 | +1 | |
| 3 | –1 | +1 | –1 | –1 | +1 | –1 | |
| 4 | +1 | +1 | –1 | +1 | –1 | –1 | |
| 5 | –1 | –1 | +1 | +1 | –1 | –1 | |
| 6 | +1 | –1 | +1 | –1 | +1 | –1 | |
| 7 | –1 | +1 | +1 | –1 | –1 | +1 | |
| 8 | +1 | +1 | +1 | +1 | +1 | +1 |
Table 5.
Casting parameters of each experiment.
| Casting Parameters | Units | Experiment Number | |||||||
|---|---|---|---|---|---|---|---|---|---|
| 1 | 2 | 3 | 4 | 5 | 6 | 7 | 8 | ||
| C | % | 3.35 | 3.46 | 3.4 | 3.28 | 2.94 | 3.04 | 3.02 | 3.04 |
| Si | % | 1.13 | 0.88 | 0.87 | 1.18 | 1.16 | 0.89 | 0.87 | 1.15 |
| Mn | % | 0.77 | 0.78 | 0.79 | 0.77 | 0.79 | 0.83 | 0.80 | 0.82 |
| Ni | % | 4.44 | 4.33 | 4.32 | 4.38 | 4.59 | 4.16 | 4.62 | 4.65 |
| Cr | % | 1.68 | 1.68 | 1.71 | 1.64 | 1.65 | 1.71 | 1.68 | 1.71 |
| Mo | % | 0.26 | 0.25 | 0.25 | 0.24 | 0.25 | 0.25 | 0.26 | 0.26 |
| Mg | % | 0.024 | 0.018 | -- | -- | -- | -- | 0.022 | 0.028 |
| B | % | 0.032 | 0.033 | 0.071 | 0.075 | 0.038 | 0.041 | 0.070 | 0.071 |
| Nb | % | 0.64 | 0.72 | 0.68 | 0.61 | 0.74 | 0.75 | 0.73 | 0.61 |
| Liquidus Temperature | °C | 1252 | 1254 | 1253 | 1250 | 1273 | 1272 | 1272 | 1270 |
Table 6.
Results of the micro-analysis carried out with SEM-EDX. Spectrums highlighted in Figure 2 (weight %). Due to the low fluorescence yield of boron, its analysis by EDX shows a high error. Therefore, the boron analysis should be considered “semi-quantitative”.
Table 6.
Results of the micro-analysis carried out with SEM-EDX. Spectrums highlighted in Figure 2 (weight %). Due to the low fluorescence yield of boron, its analysis by EDX shows a high error. Therefore, the boron analysis should be considered “semi-quantitative”.
| Spectrum | % B | % Fe | % Nb | % Cr |
|---|---|---|---|---|
| 1 | 9.8 | 1.8 | 66.8 | -- |
| 2 | 16.3 | 1.6 | 46.0 | -- |
| 3 | -- | 85.1 | -- | 4.9 |
| 4 | 13.1 | 1.5 | 59.4 | -- |
| 5 | -- | 84.3 | -- | 3.0 |
Table 7.
Average values and standardised effects on the volume fraction of carbides.
| No. | Zone I | Effects | Zone III | Effects | Effects |
|---|---|---|---|---|---|
| 1 | 29.31 | 23.08 | 24.9 | 23.95 | Average |
| 2 | 28.57 | −1.99 | 25.9 | −0.84 | A + BC + CE |
| 3 | 25.09 | −0.71 | 27.2 | −0.39 | B + AD + CF |
| 4 | 20.81 | −5.73 | 25.4 | −3.77 | C + AE + BF |
| 5 | 20.23 | 0.69 | 23.9 | −0.33 | D + AB + EF |
| 6 | 15.63 | 0.53 | 21.9 | −0.45 | E + AC + DF |
| 7 | 21.67 | 5.29 | 21.5 | −1.27 | F + BC + DE |
| 8 | 23.35 | 2.46 | 20.9 | 1.04 | AF + BE + CD |
Table 8.
Vol.% carbides in zone III. Analysis of the effects corresponding to the interactions AF + BE + CD and F + BC + DE.
Table 8.
Vol.% carbides in zone III. Analysis of the effects corresponding to the interactions AF + BE + CD and F + BC + DE.
| (a). Effects of AF + BE + CD. | ||||||||
| A(↓) × F(→) | −1 | +1 | B(↓) × E(→) | −1 | +1 | C(↓) × D(→) | −1 | +1 |
| −1 | 25.5 | 23.2 | −1 | 23.9 | 23.4 | −1 | 26.5 | 25.2 |
| +1 | 23.6 | 23.4 | +1 | 23.5 | 24.1 | +1 | 21.7 | 22.4 |
| (b). Effects of F + BC + DE. | ||||||||
| F | −1 | +1 | B(↓) × C(→) | −1 | +1 | D(↓) × E(→) | −1 | +1 |
| −1 | 24.6 | −1 | 25.4 | 22.9 | −1 | 23.7 | 24.5 | |
| +1 | 23.3 | +1 | 26.3 | 21.2 | +1 | 24.7 | 22.9 | |
Table 9.
Average values and standardised effects with respect to zone I. Values in mg.
| No. | 250 °C | Effects | 350 °C | Effects | Effects |
|---|---|---|---|---|---|
| 1 | 20.1 | 22.6 | 23.4 | 25.9 | Average |
| 2 | 25.6 | 0.0 | 31.5 | −1.5 | A + BC + CE |
| 3 | 22.8 | −2.6 | 27.3 | −3.5 | B + AD + CF |
| 4 | 19.9 | 1.0 | 20.4 | 0.5 | C + AE + BF |
| 5 | 26.6 | −1.1 | 30.3 | −3.2 | D + AB + EF |
| 6 | 23.4 | −1.2 | 25.6 | −2.1 | E + AC + DF |
| 7 | 20.8 | −1.1 | 25.8 | 0.0 | F + BC + DE |
| 8 | 21.6 | 3.1 | 23.1 | 4.2 | AF + BE + CD |
Table 10.
Analysis of the interactions AF, BE, and CD.
| (a). Wear in zone I at 250 °C | ||||||||
| A(↓) × F(→) | −1 | +1 | B(↓) × E(→) | −1 | +1 | C(↓) × D(→) | −1 | +1 |
| −1 | 24.7 | 20.4 | −1 | 24.5 | 21.7 | −1 | 24.2 | 20.0 |
| +1 | 21.6 | 23.6 | +1 | 20.3 | 22.2 | +1 | 22.1 | 24.1 |
| (b). Wear in zone I at 350 °C | ||||||||
| A(↓) × F(→) | −1 | +1 | B(↓) × E(→) | −1 | +1 | C(↓) × D(→) | −1 | +1 |
| −1 | 28.8 | 24.6 | −1 | 30.9 | 24.5 | −1 | 29.4 | 21.9 |
| +1 | 23.0 | 27.3 | +1 | 23.1 | 25.2 | +1 | 25.7 | 26.7 |
Table 11.
Optimum combination of levels to minimise wear in zone I.
| Factors | 250 °C | 350 °C | Value | |
|---|---|---|---|---|
| A | FeSi-La (Kg/T) | +1 | +1 | 0 |
| B | FeB (Kg/T) | +1 | +1 | 6 |
| C | Liquidus temperature | −1 | −1 | 1250–1255 |
| D | Si (%) | +1 | +1 | 1.1–1.15 |
| E | SiCa (Kg/T) | −1 | −1 | 0.3 |
| F | Mg (%) | −1 | −1 | 0 |
| Estimated level of wear (mg) | 18.3 | 18.6 | ||
Table 12.
Average values and standardised effects with respect to zone III. Values in mg.
| No. | 250 °C | Effects | 350 °C | Effects | Effects |
|---|---|---|---|---|---|
| 1 | 19.2 | 25.7 | 21.5 | 29.8 | Average |
| 2 | 27.7 | −1.6 | 30.4 | 2.1 | A + BC + CE |
| 3 | 27.5 | −2.3 | 32.4 | −0.7 | B + AD + CF |
| 4 | 26.5 | 1 | 28.6 | 3.1 | C + AE + BF |
| 5 | 33.8 | −2.3 | 34.2 | −2.4 | D + AB + EF |
| 6 | 26.8 | −5.3 | 34.4 | −0.4 | E + AC + DF |
| 7 | 25.6 | −5.8 | 26.7 | −5.2 | F + BC + DE |
| 8 | 18.8 | 2.4 | 30 | 3.9 | AF + BE + CD |
Table 13.
Analysis of the effect of factor F and interactions BE + CD.
| (a). Effects of F + BC + DE. Wear in zone III at 250 °C (mg). | ||||||||
| F | −1 | +1 | B(↓) × C(→) | −1 | +1 | D(↓) × E(→) | −1 | +1 |
| −1 | 28.6 | −1 | 23.4 | 30.3 | −1 | 26.6 | 27.1 | |
| +1 | 22.8 | +1 | 27.0 | 22.2 | +1 | 30.1 | 19.0 | |
| (b). Effects of F + BC + DE. Wear in zone III at 350 °C (mg). | ||||||||
| F | −1 | +1 | B(↓) × C(→) | −1 | +1 | D(↓) × E(→) | −1 | +1 |
| −1 | 32.4 | −1 | 25.9 | 30.5 | −1 | 28.5 | 33.4 | |
| +1 | 27.1 | +1 | 34.3 | 28.3 | +1 | 31.4 | 25.7 | |
Table 14.
Analysis of the effect of factor E and the interactions AC + DF. Wear in zone III at 250 °C (mg).
Table 14.
Analysis of the effect of factor E and the interactions AC + DF. Wear in zone III at 250 °C (mg).
| E | −1 | +1 | A(↓) × C(→) | −1 | +1 | D(↓) × F(→) | −1 | +1 |
|---|---|---|---|---|---|---|---|---|
| −1 | 28.4 | −1 | 23.3 | 29.7 | −1 | 27.1 | 26.6 | |
| +1 | 23.1 | +1 | 27.1 | 22.8 | +1 | 30.1 | 19.0 |
Table 15.
Analysis of the effect of interactions AF + BE + CD. Wear in zone III at 350 °C (mg).
| AF | −1 | +1 | B(↓) × E(→) | −1 | +1 | C(↓) × D(→) | −1 | +1 |
|---|---|---|---|---|---|---|---|---|
| −1 | 33.3 | 24.1 | −1 | 32.3 | 27.9 | −1 | 31.4 | 25.0 |
| +1 | 31.5 | 30.2 | +1 | 27.6 | 31.2 | +1 | 30.5 | 32.1 |
Table 16.
Optimal combination of levels for minimising wear in zone III.
| Factors | 250 °C | 350 °C | Value | |
|---|---|---|---|---|
| A | FeSi-La (Kg/T) | −1 | −1 | 0 |
| B | FeB (Kg/T) | +1 | +1 | 6 |
| C | Liquidus temperature | −1 | −1 | 1250–1255 |
| D | Si (%) | +1 | +1 | 1.1–1.15 |
| E | SiCa (Kg/T) | +1 | +1 | 0.6 |
| F | Mg (%) | +1 | +1 | 0.02 |
| Estimated level of wear (mg) | 17.0 | 20.8 | ||
Publisher’s Note: MDPI stays neutral with regard to jurisdictional claims in published maps and institutional affiliations. |
© 2021 by the authors. Licensee MDPI, Basel, Switzerland. This article is an open access article distributed under the terms and conditions of the Creative Commons Attribution (CC BY) license (https://creativecommons.org/licenses/by/4.0/).
Share and Cite
MDPI and ACS Style
Cofiño-Villar, A.; Alvarez-Antolin, F.; Alvarez-Perez, C.H. Improvement in the Resistance to Wear of Work-Rolls Used in Finishing Stands of the Hot Strip Mills. Metals 2021, 11, 1873. https://doi.org/10.3390/met11111873
AMA Style
Cofiño-Villar A, Alvarez-Antolin F, Alvarez-Perez CH. Improvement in the Resistance to Wear of Work-Rolls Used in Finishing Stands of the Hot Strip Mills. Metals. 2021; 11(11):1873. https://doi.org/10.3390/met11111873
Chicago/Turabian StyleCofiño-Villar, Alberto, Florentino Alvarez-Antolin, and Carlos Hugo Alvarez-Perez. 2021. "Improvement in the Resistance to Wear of Work-Rolls Used in Finishing Stands of the Hot Strip Mills" Metals 11, no. 11: 1873. https://doi.org/10.3390/met11111873
Note that from the first issue of 2016, this journal uses article numbers instead of page numbers. See further details here.