Influence of Hot Deformation and Precipitates on the Recrystallization of Nb-V-Ti Free-Cutting Steel


The State Key Laboratory of Rolling and Automation, Northeastern University, Shenyang 110819, China
*
Author to whom correspondence should be addressed.
Metals 2020, 10(12), 1587; https://doi.org/10.3390/met10121587
Submission received: 13 October 2020
/
Revised: 23 November 2020
/
Accepted: 24 November 2020
/
Published: 27 November 2020
Abstract
:Nb, V, and Ti were added to free-cutting steel to improve its mechanical properties by means of precipitation strengthening and fine grain strengthening. The process parameters during the hot deformation of Nb-V-Ti free-cutting steel were studied at strain rates of 0.01–10 s−1 and temperatures of 850–1250 °C. The isothermal compression test results showed that the temperature rise at low deformation temperature and high strain rate has a great influence on the softening of the steel. The processing maps at strains of 0.3–0.6 were established based on a dynamic material model (DMM). When the strain was 0.6, the optimum hot-working window was at a temperature in the range of 1150–1250 °C and at a strain rate in the range of 0.01–0.1 s−1. The instable regions were mainly located at low temperature and high strain rate. The instable characteristics included the mixed grains around the MnS phase, flow localization, and intense deformation. In general, the existence of MnS leads to a decrease in the toughness of the steel. The MnS phase was easy to be broken when the compression tested at a lower temperature, e.g., 850 °C and at a higher strain rate, e.g., 10 s−1; its morphology changed from a long-rod shape to a discontinuous shape, and then, to a dot-like shape with the decrease in temperature from 1250 to 850 °C and the increase in strain rate from 0.01 to 10 s−1. The nucleation mechanism of this steel was grain boundary bulging. The size of fine (Nb,Ti) (C,N) precipitates is less than 10 nm, inhibiting austenite recrystallization and leading to austenite strengthening during hot deformation at 850 °C. Moreover, the dislocation motion and grain boundary migration were greatly inhibited by the Ti-rich(C,N) and MnS throughout the entire hot deformation process.
1. Introduction
With the tremendous advances in steel manufacture technology, the demand for high-strength microalloyed steel for auto parts has gradually increased. Nowadays, it has become a trend to use microalloyed steel, which has excellent mechanical properties, to make crankshafts and connecting rods, instead of the traditional quenched and tempered steel. In order to satisfy the requirements of mechanical properties and lightweight design, it is imperative to develop microalloyed steel with high strength and excellent formation performance [1].
Nb-V-Ti microalloyed steel is widely applied around the world, whose basic composition design is adding trace alloy elements Nb, V, and Ti on the base of the main chemical elements (C, Mn, Si, Fe), where the addition of Nb, V, and Ti promotes MC-type carbides and largely improves the strength of the steel [2]. Furthermore, researchers [3,4] reported that the addition of S element into the microalloyed steel can improve the cutting performance, where the S element and Mn element tend to form the MnS phase. In this way, it can be cut directly into the desired parts, eliminating the need of quenching and tempering. Consequently, the design of this component is able to achieve high strength and good cutting performance. Nevertheless, the addition of Nb, V, and Ti elements and formed precipitates will lead to a greater work-hardening ability during hot deformation [5], which in turn increases the hot deformation resistance. The presence of MnS in the matrix causes inconsistent deformation of the soft austenite phase at high temperatures, resulting in cracks. Therefore, these two factors together make hot deformation more difficult. It is widely accepted that mechanical properties are related to the microstructure, and hot deformation is the key factor in determining the microstructure. As a result, it is necessary to study the microstructural evolution during hot deformation [6]. In recent years, studies have focused on factors related to the hot deformation of microalloyed steel including strain rate, strain and deformation temperature, and their influence on the hardening and softening mechanism [7,8]. The effect of initial grain size on recrystallization [9,10] has also been studied. Materials with different stacking fault energies [11,12,13] deformed at high-temperature exhibit different kinds of dynamic recrystallization, for example, discontinuous dynamic recrystallization (DDRX), continuous dynamic recrystallization (XDRX), and geometric dynamic recrystallization (GDRX). Wen et al. [14] showed that deformation temperature and deformation rate play a dominant role in DRX. In previous works [11,15], the constitutive equation of hot deformation was established in order to describe the mathematical model of hot deformation. This reflects the relationship between flow stress and strain, strain rate, and deformation temperature. Buken et al. [16] studied the recrystallization process of Nb-V-Ti microalloyed steel, and proposed a state parameter-based model to describe static recrystallization, dynamic and static recovery, and precipitation during high temperature processes. Qian et al. [17] used a 3D atomic distribution map to characterize the relationship between power dissipation efficiency value and area. The processing map of the steel was drawn by placing the power dissipation map and the instability map together in the form of contour lines on the plane comprising strain rate and deformation temperature. The effect of precipitation on recrystallization in microalloyed steels has gradually become a research hotspot in recent years [18,19,20,21,22,23,24]. Dong et al. [25] studied the second phase precipitation behavior of high-strength pipeline steel at high temperature, and they identified three types of carbides: M3C, Ti-rich MC, and Nb-rich MC carbides. With increasing deformation, the average size of the carbides decreased, while the quantity increased. Comparatively, the complexity of flow stress behavior and the mechanism of precipitation behavior and its effect on the recrystallization of austenite have not been fully explained.
In this paper, a series of hot compression tests was carried out on a Gleeble 3800 thermo-mechanical simulator. The flow stress behavior was analyzed by the stress–strain curves, and the constitutive equation was established. Furthermore, the processing map was established based on the DMM model and the optimum processing parameters were determined. Meanwhile, the effect of MnS and precipitates on dynamic recrystallization at high temperature was studied in detail. This study can serve as a meaningful reference for the optimization of the hot deformation process.
2. Materials and Methods
The experimental material was a low-carbon Nb-V-Ti free-cutting steel, and the specific chemical components, as determined by spark spectroscopy, are shown in Table 1. The ingot was forged and cut into Φ10 × 15 mm cylindrical specimens, in order to analyze the effects of the hot deformation parameters on the experimental steel. Figure 1 shows the original metallographic structure before the hot deformation. Equiaxed grains with a mean grain size of 98 μm were observed. The morphology of MnS was a dot-like or rod-like shape in the interior of the grains and on grain boundaries, and the average size was about 15 ± 3 μm.
In the Gleeble 3800 thermal simulation test machine, Heliumgas was injected for protection, and the specimens were heated to 1250 °C at 10 °C/s, then maintained at this temperature for 300 s. The specimens were cooled to the specified temperature (850–1250 °C, at intervals of 100 °C) at a cooling rate of 5 °C/s, and a soaking time of 120s was needed to eliminate the temperature gradient. Subsequently, the single-pass compression was carried out at a true strain of 0.6, and the deformation rate was 0.01–10 s−1. Then, the samples were quickly quenched to room temperature in water to maintain the high-temperature microstructure. Subsequently, the specimens were sliced along the compression axis section for microstructural analysis. The microstructures were observed and analyzed by optical microscope (OM; OLYMPUS-BX51M, Olympus Corporation, Tokyo, Japan) and transmission electron microscopy (TEM; JEM-2000F JEOL Ltd., Tokyo, Japan), with EDX analysis. The samples for OM were polished and etched in an abluent solution of saturated picric acid (15 mL picric acid, 200 mL water, and 0.15 mL of hydrochloric acid). Thin foil specimens for transmission electron microscope (TEM) observation were prepared by electrochemical polishing at −30 °C for 20 s in a solution containing 10% perchloric acid and 90% alcohol.
3. Results and Discussion
3.1. Equilibrium Phase Diagram
In general, the hot deformation temperature of steel is higher than the austenitizing temperature, where it has a good plastic deformation capacity. In addition, the content and type of precipitates in steel vary on the basis of the deformation temperature. The equilibrium phase diagram of steel at high temperature was calculated using Thermal-Calc software, and thermodynamic analysis was carried out. Figure 2 shows the mole fraction of all phases varying with temperature, with Figure 2b showing an enlarged image of the area within the dotted frame in Figure 2a. It can be seen that the liquid transformed into austenite, with an FCC structure at 1484–1467 °C. The proportion of austenite was about 99.9% at temperatures of 1436–828 °C. The precipitation of MnS increased exponentially at 1484–1440 °C. The content of MnS remained stable when the temperature was lower than 1250 °C. TiN was precipitated at 1378 °C. NbC was precipitated at 978 °C. The precipitation temperature of V(C,N) was about 795 °C. Ferrite with a BCC structure formed below 828 °C. Cementite formed when the temperature remained below 828 °C for a long time. Generally, the rolling deformation process is carried out in the temperature range of 850–1250 °C. This area of the steel was in the austenite region based on the results of the thermodynamic calculations. Precipitates precipitated at high temperatures have a significant influence on austenite grain size. Austenite had lower stacking fault energy (SFE). The trend of occurrence of DRX was higher during the process of deformation. DRX had a significant impact on the flow stress and microstructure evolution.
3.2. Flow Stress Behavior
The flow stress of the Nb-V-Ti free-cutting steel at different temperatures and strain rates was experimentally studied. The true stress–strain curves on the basis of the experimental results are shown in Figure 3. It can be observed that the high-temperature flow stress of the Nb-V-Ti free-cutting steel was predominantly affected by temperature and strain rate. The flow stress decreased when the specimens were deformed at high temperatures and low strain rates, during which there was always a competition between the work hardening and softening, with the softening caused by dynamic recovery and dynamic recrystallization predominating significantly with increasing temperature and decreasing strain rate [26]. As indicated in Figure 2b, the type and content of precipitates in the structure of this steel varied with the temperature in the temperature range of 850–1250 °C, which would bring different difficulties for dynamic recrystallization. The critical strain (εc) is applied to characterize the difficulty of dynamic recrystallization, which is related to the second numerical derivative of the flow stress (σ) in true stress–strain curves as a function of , whose value corresponds to the minimum value at the inflection point on the second derivative curve of flow stress. Then, the critical strain can be obtained by the original true stress–strain data. Table 2 shows the critical strains under different deformation conditions. It can be seen that the critical strain increased with increasing strain rate at a certain temperature. Traditionally, the critical strain should decrease with the increase in strain rate due to the high shear stress at a higher strain rate. In this study, the process of precipitation can be accelerated as the specimen deformed at a higher strain rate. As a result, the precipitates inhibited the dislocation slip and thus, the dynamic recrystallization was delayed. Moreover, it can be detected that the critical strains at 950 °C were the largest in the temperature range of from 850 to 1250 °C. After austenitization at 1250 °C, Nb could be completely dissolved in austenite. Referring to Figure 2b, the Nb(C,N) precipitates would form when the temperature reached 978 °C. That is to say, there existed an amount of Nb(C,N) precipitates in the structure of steel when it deformed at 950 °C. Therefore, it required a larger strain to start the initiation of dynamic recrystallization at 950 °C.
At a fixed strain rate, it was noted that the flow stress decreased greatly when the temperature was increased from 850 to 950 °C; the work hardening was very strong at the low temperature of 850 °C, which is mainly related to the presence of Nb(C,N) precipitates in the host matrix. The Nb(C,N) precipitates decreased continuously in the temperature range from 800 to 978 °C. That is to say, the pinning effect of the Nb(C,N) precipitates on the dislocation motion gradually became weaker. The stress values of the 1 and 10 s−1 curves were similar at 850 °C, which was due to the effect of the temperature increase on low-temperature deformation. At 850 °C, the flow stress at strain rates of 0.01 and 0.1 s−1 increased continuously with increasing strain, showing an apparent dynamic recovery characteristic, and the flow stress at strain rates of 1 and 10 s−1 increased first with increasing strain and decreased in the final stage of deformation, indicating intense dynamic recrystallization appeared in the final stage of deformation. This phenomenon was due to the increase in the strain rate, the increase in the shear stress, and the decrease in the energy required for dynamic recrystallization, meaning that the dynamic recrystallization phenomenon was more prone to occurring. Discontinuous recrystallization may occur, especially at 0.01 s−1 or lower, when the strain rate is low. Additionally, discontinuous recrystallization was also observed at higher temperature, and the flow stress curve showed multiple peaks [27], as shown in Figure 3a,c. The plastic deformation process of metal materials was a hot activation process. The storage energy increased with increasing temperature, providing the hot activation conditions for dynamic recovery or dynamic recrystallization. There was a gradual decrease in the deformation resistance of materials. As a result of the slip of the edge dislocation, the cross slip of the screw dislocation, and the disappearance of the pinning effect of the dislocation node, the dynamic recovery of the material begins. When there was excess free energy in the material, dynamic recrystallization appeared during the continuous deformation. As the strain rate increased, the strain reinforcement began to dominate.
3.3. Constitutive Relationship
The flow stress constitutive equation for metal materials at high temperature can be described using the following models. The flow stress behavior at high temperature, high strain rate, and high deformation in a crystal structure can be described mainly by the Johnson–Cook model [28]. The Zerilli–Armstrong model [29] can be used for different types of materials, such as BCC structure and FCC structure. The Arrhenius model [30] and the Norton–Hoff model [31] can express the relationship between strain rate, deformation temperature, and deformation activation energy [32]. Each model has its advantages and disadvantages [33]. The effect of various factors on the flow stress is different under different conditions. In this paper, the relationship between flow stress behavior and process parameters (temperature, strain rate, and strain) are detailed by the Arrhenius model and Zener–Hollomon parameter by the succession of fitting polynomial coefficients. The Arrhenius model [30] was used to establish the relationship between flow stress and strain rate. There are three forms [34]: when σ < 0.8, it can be expressed as in Equation (1); when σ > 1.2, it can be expressed as in Equation (2). Equation (3) is universal:
where is the strain rate (s−1), Q is the activation energy of hot deformation (KJ/mol), R is the gas constant (8.314 J/molK), T is the absolute temperature (K), σ is peak stress (MPa), and A1, A2, A3, α, β, n1, and n are the material constants.
The service conforms to the following relationship in Equation (4):
The values of n1 are determined using the slope of curves of lnσ–ln in Figure 4a. The value of β can be evaluated using the slope of the curves of σ–ln in Figure 4b. The mean values of n1 and β were evaluated by taking the average of slopes of the above equations at different temperatures. The n1 and β were computed as 8.434486 and 0.086, respectively. The value of β and n1 generation is α = β/n1 = 0.01049.
The influence of deformation temperature and strain rate on flow stress can be described [35] by Equation (5):
where Z is the Zener–Hollomon [36] parameter (s−1), namely, the temperature-compensated strain rate parameter. Take the logarithm of both sides of this equation and take the partial derivative. It can be described as in Equation (6):
When the temperature T is the constant value of the ln formula, calculating partial derivatives can be performed as shown in Equation (7):
The linear relationship between ln[sinh(ασ)] and ln under the same strain rate is shown in Figure 5a. The reciprocal of the slope is n = 6.017354049 under the same strain rate, ln[sinh(ασ)], and 10,000/T possesses the same linear relationship, with a slope of b/10000; the linear relationship, as shown in Figure 5b, results in b = 7958.28. The value of activation energy Q can be obtained by substituting n and b into Equation (8); Q = Rnb = 398.13 KJ/mol. In general, activation energy is mainly dependent on the chemical composition. In terms of microalloyed steel, activation energy is related to the type and content of alloying elements. Some scholars reported that the value of Q was 373.16 KJ/mol in Nb microalloyed steel and 379.29 KJ/mol in Ti-Nb-IF steel [17,37]. Compared with Dong’s results [38], the value of Q in our study is lower, which is due to lower addition of Ti, Nb, and V in the experimental steel. Dynamic recrystallization through dislocation slip and climb is the main hot deformation mechanism, which is consistent with the results reflected in the stress–strain curve.
By taking the logarithm of both sides of Equation (3), Equation (9) is obtained:
By mapping the relationship between lnZ and ln[sinh(ασ)], as shown in Figure 6, the hyperbolic sinusoidal Arrhenius relationship between flow stress, strain rate, and temperature can be well satisfied under high-temperature plastic deformation. The slope of the fitted line is 6.26416, and the intercept is 37.12883, so that A = e37.12883 = 1.333 × 10¹⁶ can be calculated. Therefore, the dynamic activation energy Q and the related parameters of the experimental steel can be obtained, as reported in Table 3.
By substituting the calculated dynamic recrystallization parameters into Equation (3), the hot processing equations of the experimental Nb-V-Ti free-cutting steel can be obtained, as in Equation (10):
The relation between the peak stress and the Z parameter can be written as in Equation (11):
By substituting the obtained material constants into Equation (11), the peak stress of testing can be expressed as Equation (12):
The Z value is derived from Equation (13). The dynamic recrystallization tends to take place more fully, and the smaller the Z-value, the higher the dislocation and grain boundary migration. Dynamic recovery and dynamic recrystallization are partly carried out even without dynamic recrystallization. In the deformation process, the greater the Z [39,40] value is, the lower the degree of dynamic recrystallization.
3.4. Processing Map
The hot-working ability of metal materials in different deformation parameter regions can be analyzed and predicted on the basis of processing maps [41]. The processing map can not only directly reflect the instable area, but can also help determine the appropriate processing parameters, guiding the practical production process. The different microdeformation mechanisms in the hot-working area were also determined. Flow localization, intense deformation zone, and cracks were common in the instability zone. In order to obtain the necessary structure for realizing excellent control over structure and mechanical properties, the process parameters must be optimized. On the basis of the DMM proposed by Prasad et al. [41], the hot working system provides energy to the metal material under external loading P in the hot working process, and the instantaneous σ in the corresponding artifacts on strain rate stands in the dynamic constitutive relation for a given condition. This can be described as shown in Equation (14):
The total input energy of the system in the process of hot deformation is expressed by P, which is consumed in two ways. One is through the deformed heat dissipation, G, and the other is through energy consumption, J, for microstructure transformation in the form of work hardening, recovery, and recrystallization [42]. The relationship among these is shown in Equation (15):
In order to study the two kinds of energy consumption, the ratio of the strain rate sensitivity coefficient m and the calculation of the power dissipation efficiency η [41] is determined as shown in Equation (16):
To ensure the accuracy of the calculation, researchers usually take the third derivative directly from the material stress and strain rate for fitting; therefore, the strain rate sensitivity coefficient m [41] can be expressed as in Equation (17):
During hot processing, dynamic recrystallization takes place more fully with higher material power consumption, and more refined equiaxial grains are more easily obtained. According to the maximum entropy principle, when the plastic deformation of metal is continuous, the dimensionless rheological instability coefficient [41] is used as the instability criterion of the material, as shown in Equation (18):
The values of η and were obtained from the above calculations. The power dissipation map and flow instability map were constructed to vary with the strain rate and deformation temperature. Consequently, the processing map was obtained by combining the power dissipation map and the flow instability map. As shown in Figure 7, processing maps based on the Prasad instability criteria were generated at true strains of 0.3–0.6. The values of the contour lines represent the efficiency of power consumption, while the dark area shows the unstable area. At a strain of 0.3, the values of η in the safe area were all higher than 25%. Two efficiency peaks appeared in this area, marked as A and B in Figure 7a. One was at a relatively low strain rate of 0.01 s−1 at 950 °C and the other was at a strain rate of 0.1 s−1 at 1100 °C. The deformed austenite goes through sufficient dynamic recrystallization in the domains A and B in Figure 7a, as can also be verified by the stress–strain curve shown in Figure 3. A similar trend can be seen in the processing maps when increasing strain from 0.4 to 0.6, as shown in Figure 7b–d. The area of high η is mainly concentrated in about 0.01–0.1 s−1 at 1000–1100 °C. With the increase in strain, the peak value of η tended to move to the lower right, towards the area with high temperature and low strain rate. The areas with high power consumption in the processing map are generally considered to be more suitable for processing. An instable area can be found in the upper half of the processing map. The instable area exhibits a wavy shape. With the increase in strain, the instable area moved to the low-temperature area, as shown by the arrow in Figure 7d. The parameter range of the instable areas should be avoided in industrial production [43]. On the basis of the analysis of the above results, it can be concluded that the optimum hot working parameters are deformation at 1150–1250 °C and a strain rate of 0.01–0.1 s−1, when the experimental steel is deformed at a true strain of 0.6.
3.5. Microstructure Observation
The microstructures of the deformed samples are shown in Figure 8. At a temperature of 1250 °C, the deformed microstructures were all equiaxed with the complete recrystallization in the strain rate range from 0.01 to 10 s−1. The average grain size decreased from 90 to 29 μm with the increase in strain rate from 0.01 s−1 (Figure 8a) to 10 s−1 (Figure 8b). The corresponding η value increased from 0.18 to 0.37. Figure 8c shows that the microstructure of the experimental steel was deformed at 0.01 s−1 at 850 °C. The average grain size was 28 μm. The grain size of the specimen deformed at 850 °C was finer than that deformed at 1250 °C, but not uniform in size. This indicated that although dynamic recrystallization had occurred, dynamic recrystallization was not complete. The austenite grain size at 1250 °C was obviously large and homogeneous, which is due to the lower deformation rate providing more time for the austenite grains to grow. The instability region under different strains was mainly located in the region with high strain rate and low temperature. Figure 8d–e show the microstructures at 850 °C × 10 s−1 and 950 °C × 10 s−1 in the flow instability region; the austenite grains were elongated at temperatures of 850 and 950 °C, and the MnS phases were steadily present in the deformed microstructures. As is widely accepted, MnS has a higher hardness value than the austenite during hot deformation, which inevitably affects the plastic flow of the metal. Flow localization can be observed around MnS in Figure 8d, and mixed grains can be observed around MnS in Figure 8e, indicating that the dislocation motion and boundary migration were inhibited by MnS. Figure 8f shows the occurrence of the intense deformation band when deformed at 1050 °C, 10 s−1. On the basis of the above, it can be concluded that the MnS significantly affects the hot deformation behavior of this steel.
As the deformation temperature decreased, the matrix hardness gradually increased and the difference in hardness between the matrix and MnS decreased. The MnS had undergone more deformation. As indicated in Figure 8, the morphology of MnS changed from a long rod shape to a discontinuous shape, and then, to a dot-like shape with the decrease in temperature from 1250 to 850 °C. Meanwhile, the hardness of the matrix also increased and the morphology of MnS changed with the variation in strain rate. It is noted that the effect of strain rate on the morphology of MnS was dominant at a high temperature of 1250 °C. The length of MnS decreased from 20 to 16 μm, with a corresponding aspect ratio of 4.5–7.8, when the strain rate was increased from 0.01 to 10 s−1. With reference to the processing maps in Figure 7 and the microstructures in Figure 8, it can be observed that the instable regions are mainly located in the high strain rate region and the instability appears around the MnS. It can be inferred that the dislocation multiplication rate is large at high strain rates, and that dislocations are easy to tangle when the dislocation moves to the interface between the matrix and MnS. The dislocation motion and boundary migration are inhibited, leading to a very high concentration of stress. When the concentrated stress surpasses the strength of the matrix, cracks appear.
Figure 9 shows the evolution of grain morphologies during hot deformation. When the dynamic recrystallization was insufficient, the austenite grains were elongated and the serrated boundary was detected, as shown in Figure 9a. Meanwhile, the fine recrystallization grains were formed in the triangle grain boundary, where it had a larger storage energy for the nucleation of new grains. As temperature increased to 1050 °C, the dynamic recrystallization was enhanced, the austenite grains were equiaxed, and the serrated boundary changed into the plate boundary, as shown in Figure 9b. At this time, the austenite size was about 49.7 μm. It is noted that most of the MnS phases were distributed on the grain boundary no matter what the morphology of the austenite grain shape was. Furthermore, the plastic deformation capacity of MnS increased with decreasing temperature [44]. As a result, the length of MnS in the structure of the specimen deformed at 950 °C was larger than that in the structure of the specimen deformed at 1050 °C.
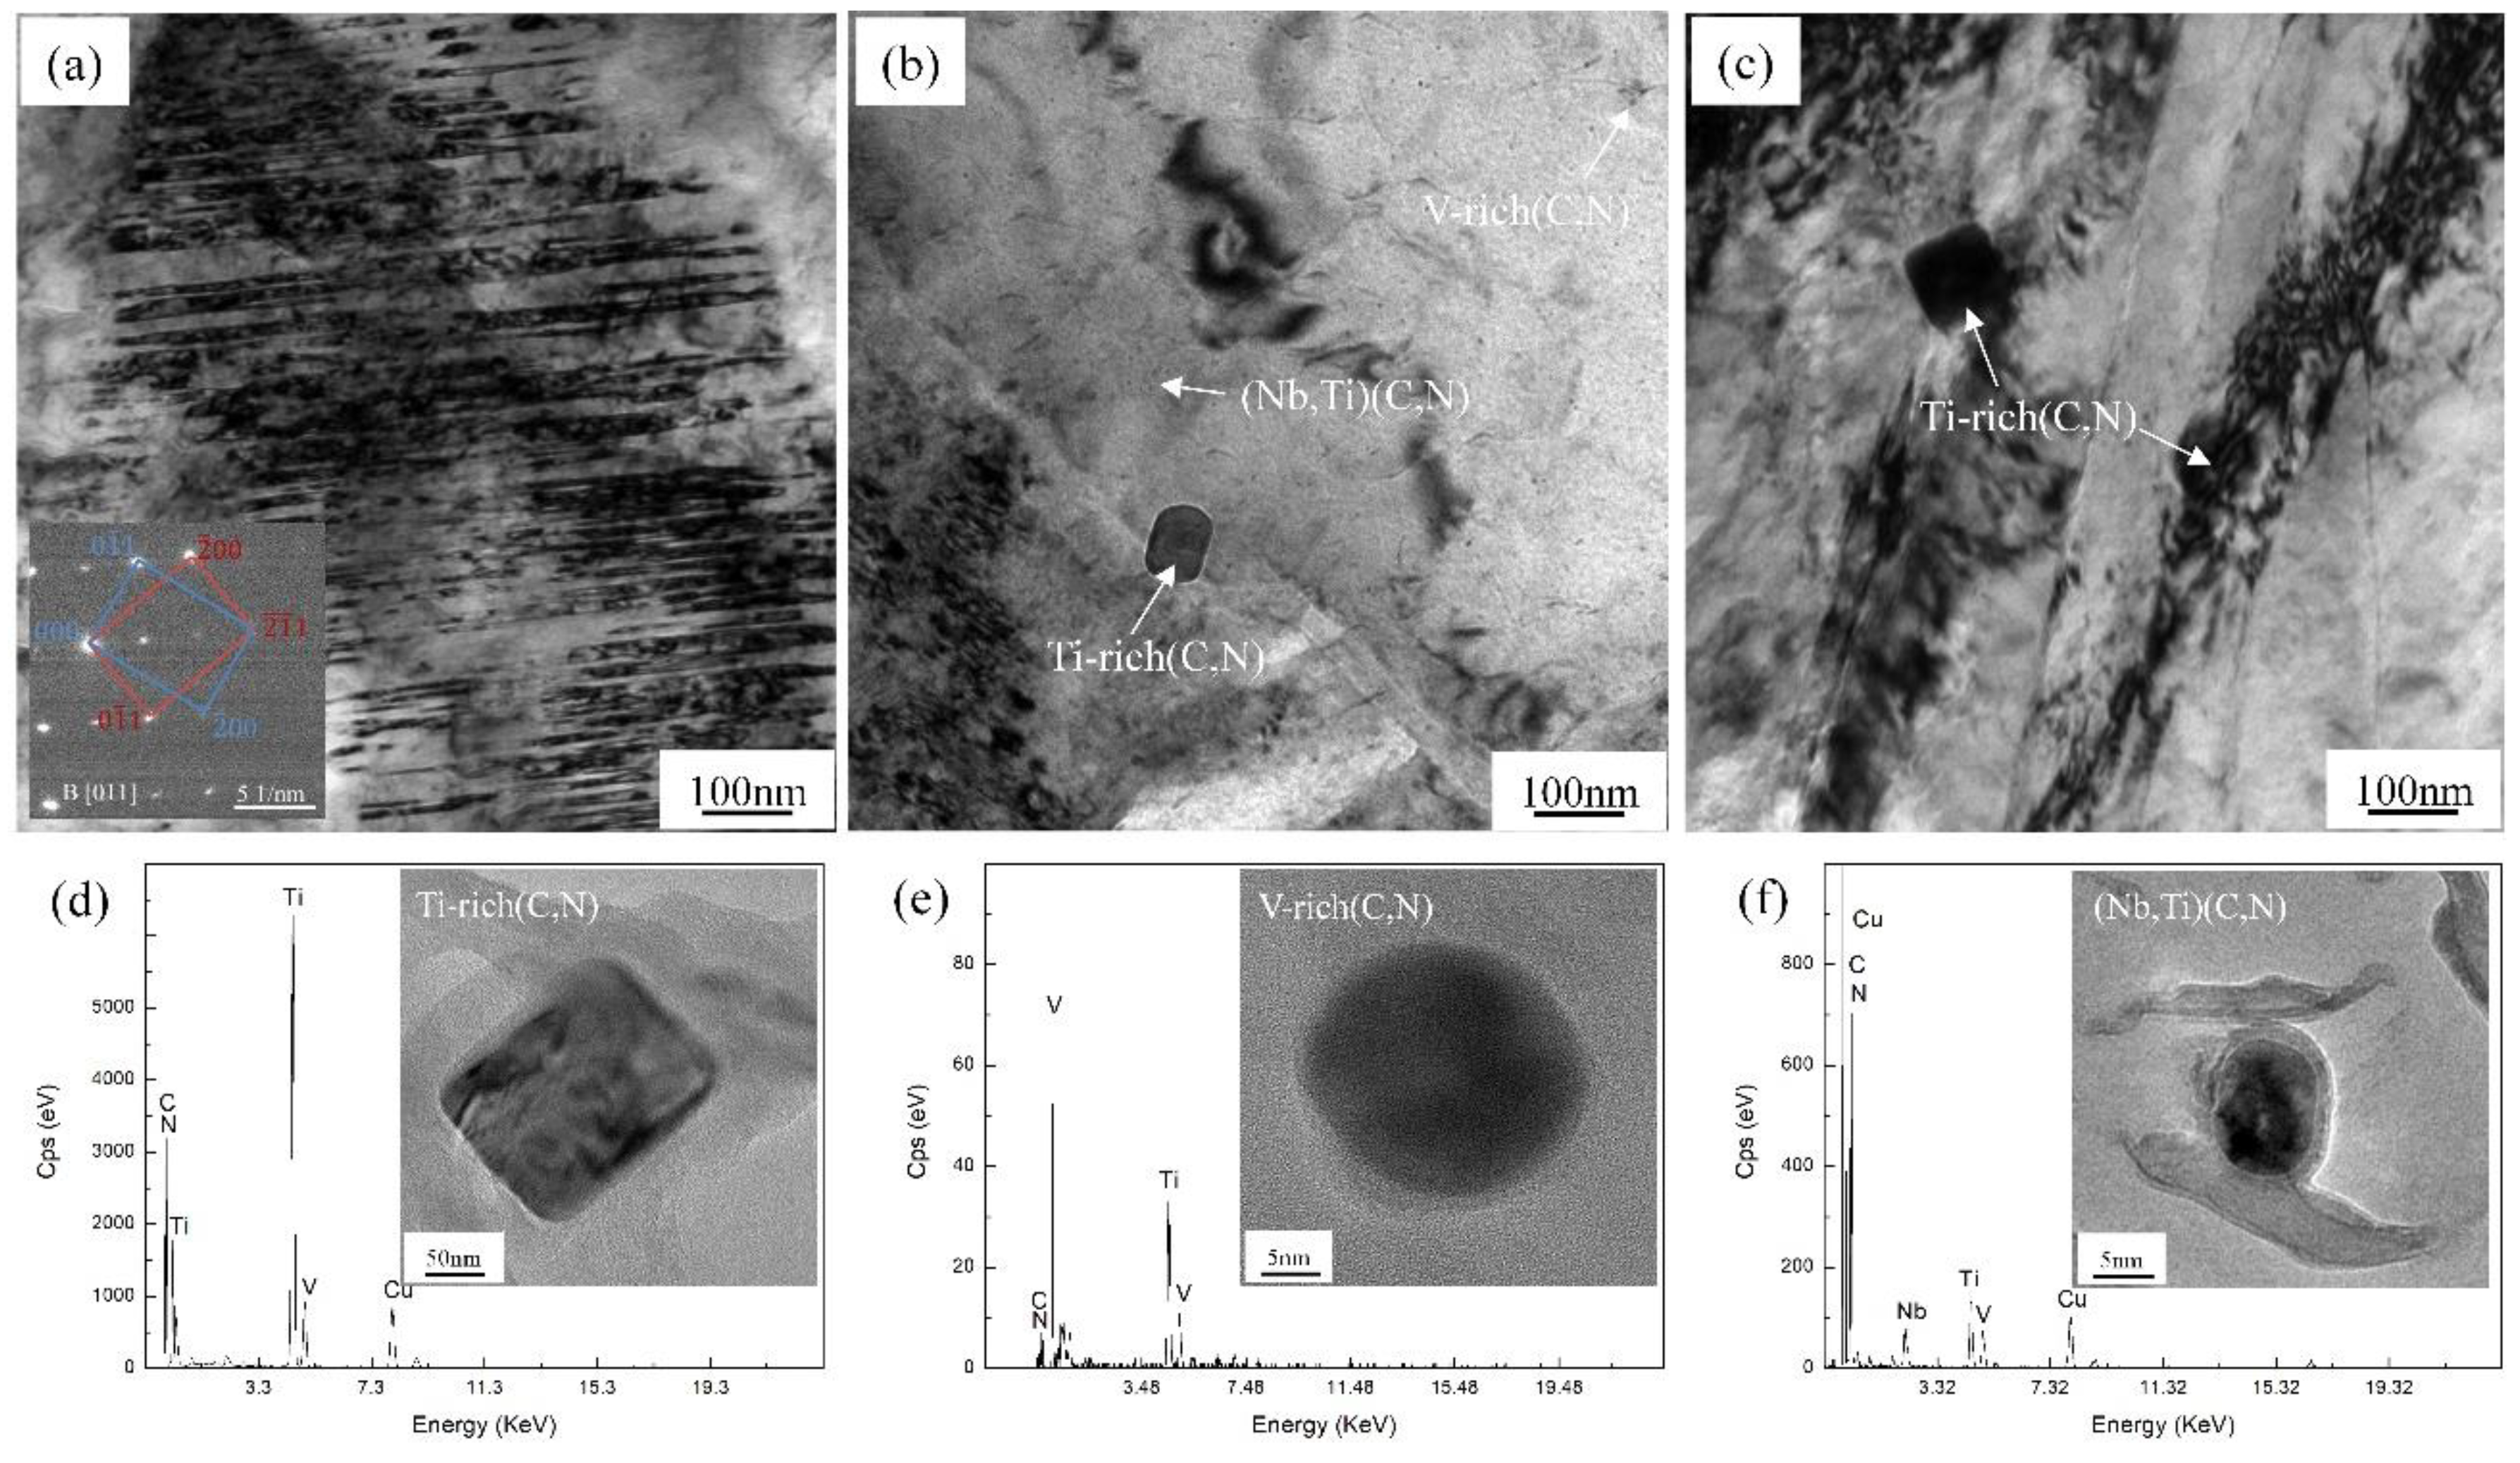
Figure 10 shows the TEM micrographs of specimens deformed at 850 °C, 10 s−1 and 1250 °C, 0.01 s−1. In Figure 10a, it can be seen that the deformation twins were generated during hot deformation. Moreover, the deformation twins were not detected in the structure of any other deformation specimen in this study. As is acceptable to all, an amount of dislocations would be generated sharply and tangled when the alloys and metals deformed at high strain rate and at low temperature [45,46]. The dislocation slip would be inhibited, and it showed a high stress concentration in the high dislocation density region; the deformation twins would be formed to release the intense stress concentration. That is to say, the deformation twins could only be formed when the specimen deformed at 850 °C, 10 s−1. In a previous study [47], it was reported that the secondary phase particles first precipitated along the grain boundary and deformation bands. Afterwards, they precipitated in the interior of the grains. As indicated in Figure 2, the type and content of precipitates varied with the temperature, which would pin the dislocation slip and grain boundary migration [48]. Figure 10b shows the micrograph of precipitates. There are three types of M (C,N) precipitates. The EDX results of the different types of M (C,N) are shown in Figure 10d–f. Here, the square precipitates (Ti-rich (C,N)), spherical particles (V-rich (C,N)) and nanosized elliptic precipitates ((Nb,Ti) (C,N)) can be seen. The size of the Ti-rich (C,N) precipitates was the largest in the steel, at about 110 to 120 nm. The size of V-rich (C,N) precipitates was about 20 to 30 nm. The size of the smallest nanoscale precipitates (Nb,Ti) (C,N) was about 5 to 10 nm. Furthermore, the volume fraction of the Nb(C,N) and V(C,N) precipitates was higher than that of Ti-rich (C,N). It is noted that the pinning effect of small size precipitates Nb(C,N) and V(C,N) on the dislocation slip was obvious, which was proved by Hong et al. [49], where the spherical NbC precipitated between 900 and 1100 °C and inhibited the austenite grain growth obviously.
4. Conclusions
The hot compression deformation behaviors of Nb-V-Ti free-cutting steel were investigated over a wide range of deformation temperatures and strain rates. The effects of process parameters on the high-temperature plastic properties were discussed. Based on the experimentally measured true stress–true strain data, the constitutive model was established in order to predict the peak stress. Some important conclusions can be summarized as follows:
(1) Increasing the temperature and decreasing the strain rate can decrease the flow stress. Meanwhile, the temperature rise was obvious when deformed at high strain rate and low temperature, which in turn decreased the flow stress.
(2) The hot deformation activation energy of the Nb-V-Ti free-cutting steel was calculated to be 398.13 kJ/mol. The constitutive equation of the peak stress for the steel can be described by a hyperbolic sine equation, as follows:
(3) The processing maps of the Nb-V-Ti free-cutting steel were constructed at different strains. The values of power dissipation efficiency increased with the increase in strain when the strain rates were 0.01 and 0.1 s−1. However, it was not obvious at strain rates of 1 and 10 s−1. When the steel was deformed at a strain of 0.6, the processing maps revealed that the optimum hot working parameters for this steel were 1150–1250 °C and 0.01–0.1 s−1.
(4) The dynamic recrystallization mechanism was found to nucleate through the grain boundary bulging mechanism. The precipitate pinning dislocation facilitated austenite grain nucleation, while MnS inhibited the migration of the recrystallization grain boundary. The austenite grain size was refined by the combined action of the two factors.
Author Contributions
Conceptualization, Y.Y. and X.-M.Z.; methodology, Y.Y.; software, Y.Y.; validation, Y.Y., C.-Y.D. and X.-Y.Z.; formal analysis, Y.Y.; investigation, Y.Y.; data curation, Y.Y.; writing—original draft preparation, Y.Y.; writing—review and editing, Y.Y.; funding acquisition, X.-M.Z. All authors have read and agreed to the published version of the manuscript.
Funding
This research was funded by the National Key R&D Program of China (Grant 2017YFB0304201).
Conflicts of Interest
The authors declare no conflict of interest.
References
- Naylor, D.J. Microalloyed Forging Steels. Mater. Sci. Forum 1998, 284, 83–94. [Google Scholar] [CrossRef]
- Felker, C.A.; Speer, J.G.; De Moor, E. Hot Strip Mill Processing Simulations on a Ti-Mo Microalloyed Steel using Hot Torsion Testing. Metals 2020, 10, 334. [Google Scholar] [CrossRef] [Green Version]
- Shao, X.; Wang, X.; Jiang, M. Effect of Heat Treatment Conditions on Shape Control of Large-sized Elongated MnS Inclusions in Resulfurized Free-cutting Steels. ISIJ Int. 2011, 51, 1995–2001. [Google Scholar] [CrossRef] [Green Version]
- Wang, F.; Guo, H.; Liu, W. Control of MnS Inclusions in High- and Low-Sulfur Steel by Tellurium Treatment. Materials 2019, 12, 1034. [Google Scholar] [CrossRef] [Green Version]
- Zhou, Q.; Li, Z.; Wei, Z.S. Microstructural features and precipitation behavior of Ti, Nb and V microalloyed steel during isothermal processing. J. Iron Steel Res. Int. 2019, 26, 102–111. [Google Scholar] [CrossRef]
- Hodgson, P.D.; Gibbs, R.K. A Mathematical Model to Predict the Mechanical Properties of Hot Rolled C-Mn and Microalloyed Steels. ISIJ Int. 1992, 32, 1329–1338. [Google Scholar] [CrossRef] [Green Version]
- Mirzadeh, H.; Cabrera, J.M.; Prado, J.M. Hot deformation behavior of a medium carbon microalloyed steel. Mater. Sci. Eng. A 2011, 528, 3876–3882. [Google Scholar] [CrossRef]
- Ding, R.; Guo, Z.X. Coupled quantitative simulation of microstructural evolution and plastic flow during dynamic recrystallization. Acta Mater. 2001, 49, 3163–3175. [Google Scholar] [CrossRef]
- Custers, J.F.H. On the relation between deformation and recrystallization texture of nickel-iron with cubic orientation. Physica 1947, 13, 97–116. [Google Scholar] [CrossRef]
- Yamagata, H.; Ohuchida, Y.; Saito, N. Nucleation of new grains during discontinuous dynamic recrystallization of 99.998 mass% Aluminium at 453 K. Scr. Mater. 2001, 45, 1055–1061. [Google Scholar] [CrossRef]
- Gourdet, S.; Montheillet, F. An experimental study of the recrystallization mechanism during hot deformation of aluminium. Mater. Sci. Eng. A 2000, 283, 274–288. [Google Scholar] [CrossRef]
- Gourdet, S.; Konopleva, E.V.; Mcqueen, H.J. Recrystallization during Hot Deformation of Aluminium. Mater. Sci. Forum 1996, 217, 441–446. [Google Scholar] [CrossRef]
- Feng, W.; Qin, F.; Long, H. Hot workability analysis and processing parameters optimisation for 20CrMnTiH steel by combining processing map with microstructure. Ironmak. Steelmak. 2018, 45, 317–324. [Google Scholar] [CrossRef]
- Wen, S.B.; Han, C.Y.; Zhang, B.; Liang, Y.F.; Ye, F.; Lin, J.P. Flow Behavior Characteristics and Processing Map of Fe-6.5wt. %Si Alloys during Hot Compression. Metals 2018, 8, 186. [Google Scholar] [CrossRef] [Green Version]
- Kim, Y.M.; Kim, S.K.; Kim, N.J. Simple method for tailoring the optimum microstructures of high-strength low-alloyed steels by the use of constitutive equation. Mater. Sci. Eng. A 2019, 743, 138–147. [Google Scholar] [CrossRef]
- Buken, H.; Sherstnev, P.; Kozeschnik, E. Simultaneous Precipitation and Recrystallization during Hot Deformation of Ti, Nb and V Microalloyed Steel. Mater. Sci. Forum 2016, 879, 2463–2467. [Google Scholar] [CrossRef]
- Qian, P.P.; Tang, Z.H.; Wang, L. Hot Deformation Characteristics and 3-D Processing Map of a High-Titanium Nb-Micro-alloyed Steel. Materials 2020, 13, 1501. [Google Scholar] [CrossRef] [Green Version]
- Okamoto, R.; Borgenstam, A. Interphase precipitation in niobium-microalloyed steels. Acta Mater. 2010, 58, 4783–4790. [Google Scholar] [CrossRef]
- Mridha, S.; Baker, T.N. Overlapping tracks processed by TIG melting TiC preplaced powder on low alloy steel surfaces. Mater. Sci. Technol. 2015, 31, 337–343. [Google Scholar] [CrossRef] [Green Version]
- Fernandez, A.I.; Uranga, P.; Lopez, B. Dynamic recrystallization behaviour covering a wide austenite grain size range in Nb and Nb–Ti microalloyed steels. Mater. Sci. Eng. A 2003, 361, 367–376. [Google Scholar] [CrossRef]
- Craven, A.J.; He, K.; Garvie, L.A. Complex heterogeneous precipitation in titanium-niobium microalloyed Al-killed HSLA steels (Ti, Nb)(C, N) particles. Acta Mater. 2000, 48, 3857–3868. [Google Scholar] [CrossRef]
- Pandit, A.; Murugaiyan, A.; Podder, A.S. Strain induced precipitation of complex carbonitrides in Nb-V and Ti-V microalloyed steels. Scr. Mater. 2005, 53, 1309–1314. [Google Scholar] [CrossRef]
- Mejia, I.; Reyescalderon, F.; Cabrera, J.M. Modeling the hot flow behaviour of a Fe-22Mn-0.41C-1.6Al-1.4Si TWIP steel microalloyed with Ti, V and Nb. Mater. Sci. Eng. A 2015, 644, 374–385. [Google Scholar] [CrossRef]
- Shen, W.; Zhang, C.; Zhang, L. Experimental Study on the Hot Deformation Characterization of Low-Carbon Nb-V-Ti Microalloyed Steel. J. Mater. Eng. Perform. 2018, 27, 4616–4624. [Google Scholar] [CrossRef]
- Dong, J.; Zhou, X.; Liu, Y. Carbide precipitation in Nb-V-Ti microalloyed ultra-high strength steel during tempering. Mater. Sci. Eng. A 2017, 683, 215–226. [Google Scholar] [CrossRef]
- Poliak, E.I.; Jonas, J.J. A one-parameter approach to determining the critical conditions for the initiation of dynamic recrystallization. Acta Mater. 1996, 44, 127–136. [Google Scholar] [CrossRef]
- Naderi, B.; Mohandesi, J.A. Hot Deformation Characteristics of Functionally Graded Steels Produced by Electroslag Remelting. Metall. Mater. Trans. A 2005, 42, 2250–2258. [Google Scholar] [CrossRef]
- Johnson, G.R.; Cook, W.H. A constitutive model and data for metals subjected to large strains, high strain rates and high temperatures. Eng. Fract. Mech. 1983, 21, 541–548. [Google Scholar]
- Zerilli, F.J.; Armstrong, R.W. Description of tantalum deformation behavior by dislocation mechanics based constitutive relations. J. Appl. Phys. 1990, 68, 1580–1591. [Google Scholar] [CrossRef]
- Macdougall, D.A.S.; Harding, J. A constitutive relation and failure criterion for Ti6Al4V alloy at impact rates of strain. J. Mech. Phys. Solids 1999, 47, 1157–1185. [Google Scholar] [CrossRef]
- Hoff, N.J. Approximate Analysis of Structures in the Presence of Moderately Large Creep Deformations. Q. Appl. Math. 1954, 12, 49–55. [Google Scholar] [CrossRef] [Green Version]
- Samantaray, D.; Mandal, S.; Bhaduri, A.K. A comparative study on Johnson Cook, modified Zerilli–Armstrong and Arrhenius-type constitutive models to predict elevated temperature flow behaviour in modified 9Cr-1Mo steel. Comput. Mater. Sci. 2010, 47, 568–576. [Google Scholar] [CrossRef]
- Li, H.Y.; Li, Y.H.; Wang, X.F.; Liu, J.J.; Wu, Y. A comparative study on modified Johnson Cook, modified Zerilli-Armstrong and Arrhenius-type constitutive models to predict the hot deformation behaviour in 28CrMnMoV steel. Mater. Des. 2013, 49, 493–501. [Google Scholar] [CrossRef]
- Richardson, G.J.; Sellars, C.M.; Tegart, W.J. Recrystallization during creep of nickel. Acat Metall. 1966, 14, 1225–1236. [Google Scholar] [CrossRef]
- Zener, C.; Hollomon, J.H. Effect of Strain Rate Upon Plastic Flow of Steel. J. Appl. Phys. 1944, 15, 22–32. [Google Scholar] [CrossRef]
- Medina, S.F.; Hernandez, C.A. General expression of the Zener-Hollomon parameter as a function of the chemical composition of low alloy and microalloyed steels. Acta Mater. 1996, 44, 137–148. [Google Scholar] [CrossRef]
- Bao, S.; Zhao, G.; Yu, C. Recrystallization behavior of a Nb-microalloyed steel during hot compression. Appl. Math. Model. 2011, 35, 3268–3275. [Google Scholar] [CrossRef]
- Dong, J.; Li, C.; Liu, C.; Huang, Y.; Yu, L.; Li, H.; Liu, Y. Hot deformation behaviour and microstructural evolution of Nb-V-Ti microalloyed ultra-high strength steel. J. Mater. Res. 2017, 32, 3777–3787. [Google Scholar] [CrossRef]
- Sellars, C.M.; Mctegart, W.J. On the mechanism of hot deformation. Acta Metall. 1966, 14, 1136–1138. [Google Scholar] [CrossRef]
- Prasad, Y.V.R.K.; Gegel, H.L.; Doraivelu, S.M. Modeling of dynamic material behaviour in hot deformation: Forging of Ti-6242. Mater. Trans. A 1984, 15, 1883–1892. [Google Scholar] [CrossRef]
- Srinivasan, N.; Prasad, Y.V.R.K.; Rao, P.R. Hot deformation behaviour of Mg-3Al alloy-a study using processing map. Mater. Sci. Eng. A 2008, 476, 146–156. [Google Scholar] [CrossRef]
- Murty, S.V.S.N.; Rao, B.N.; Kashyap, B.P. On the hot working characteristics of 2014 Al-20 vol% Al2O3 metal matrix composite. J. Mater. Process. Technol. 2005, 166, 279–285. [Google Scholar] [CrossRef]
- Sivakesavam, O.; Prasad, Y.V.R.K. Hot deformation behaviour of as-cast Mg-2Zn-1Mn alloy in compression: A study with processing map. Mater. Sci. Eng. A 2003, 362, 118–124. [Google Scholar] [CrossRef]
- Wang, C.; Liu, X.G.; Gui, J.T. Effect of MnS inclusions on plastic deformation and fracture behavior of the steel matrix at high temperature. Vacuum 2020, 174, 109209. [Google Scholar] [CrossRef]
- Galindo-Nava, E.I.; Rivera-Díaz-del-Castillo, P.E.J. Understanding martensite and twin formation in austenitic steels: A model describing TRIP and TWIP effects. Acta Metall. 2017, 128, 120–134. [Google Scholar] [CrossRef] [Green Version]
- Han, Y.H.; Li, C.S.; Ren, J.Y. Characterization of Hot Deformation Behavior and Processing Map of As-Cast H13 Hot Work Die Steel. Met. Mater. Int. 2020, 10, 1–16. [Google Scholar] [CrossRef]
- Hansen, S.S.; Sande, J.V.; Cohen, M. Niobium carbonitride precipitation and austenite recrystallization in hot-rolled microalloyed steels. Metall. Mater. Trans. A 1980, 11, 387–402. [Google Scholar] [CrossRef]
- Maalekian, M.; Radis, R.; Militzer, M. In situ measurement and modelling of austenite grain growth in a Ti/Nb microalloyed steel. Acta Metall. 2012, 60, 1015–1026. [Google Scholar] [CrossRef] [Green Version]
- Hong, S.G.; Kang, K.B.; Park, C.G. Strain-induced precipitation of NbC in Nb and Nb–Ti microalloyed HSLA steels. Scr. Mater. 2002, 46, 163. [Google Scholar] [CrossRef]
Figure 1.
Original metallographic structure of the Nb-V-Ti free-cutting steel.
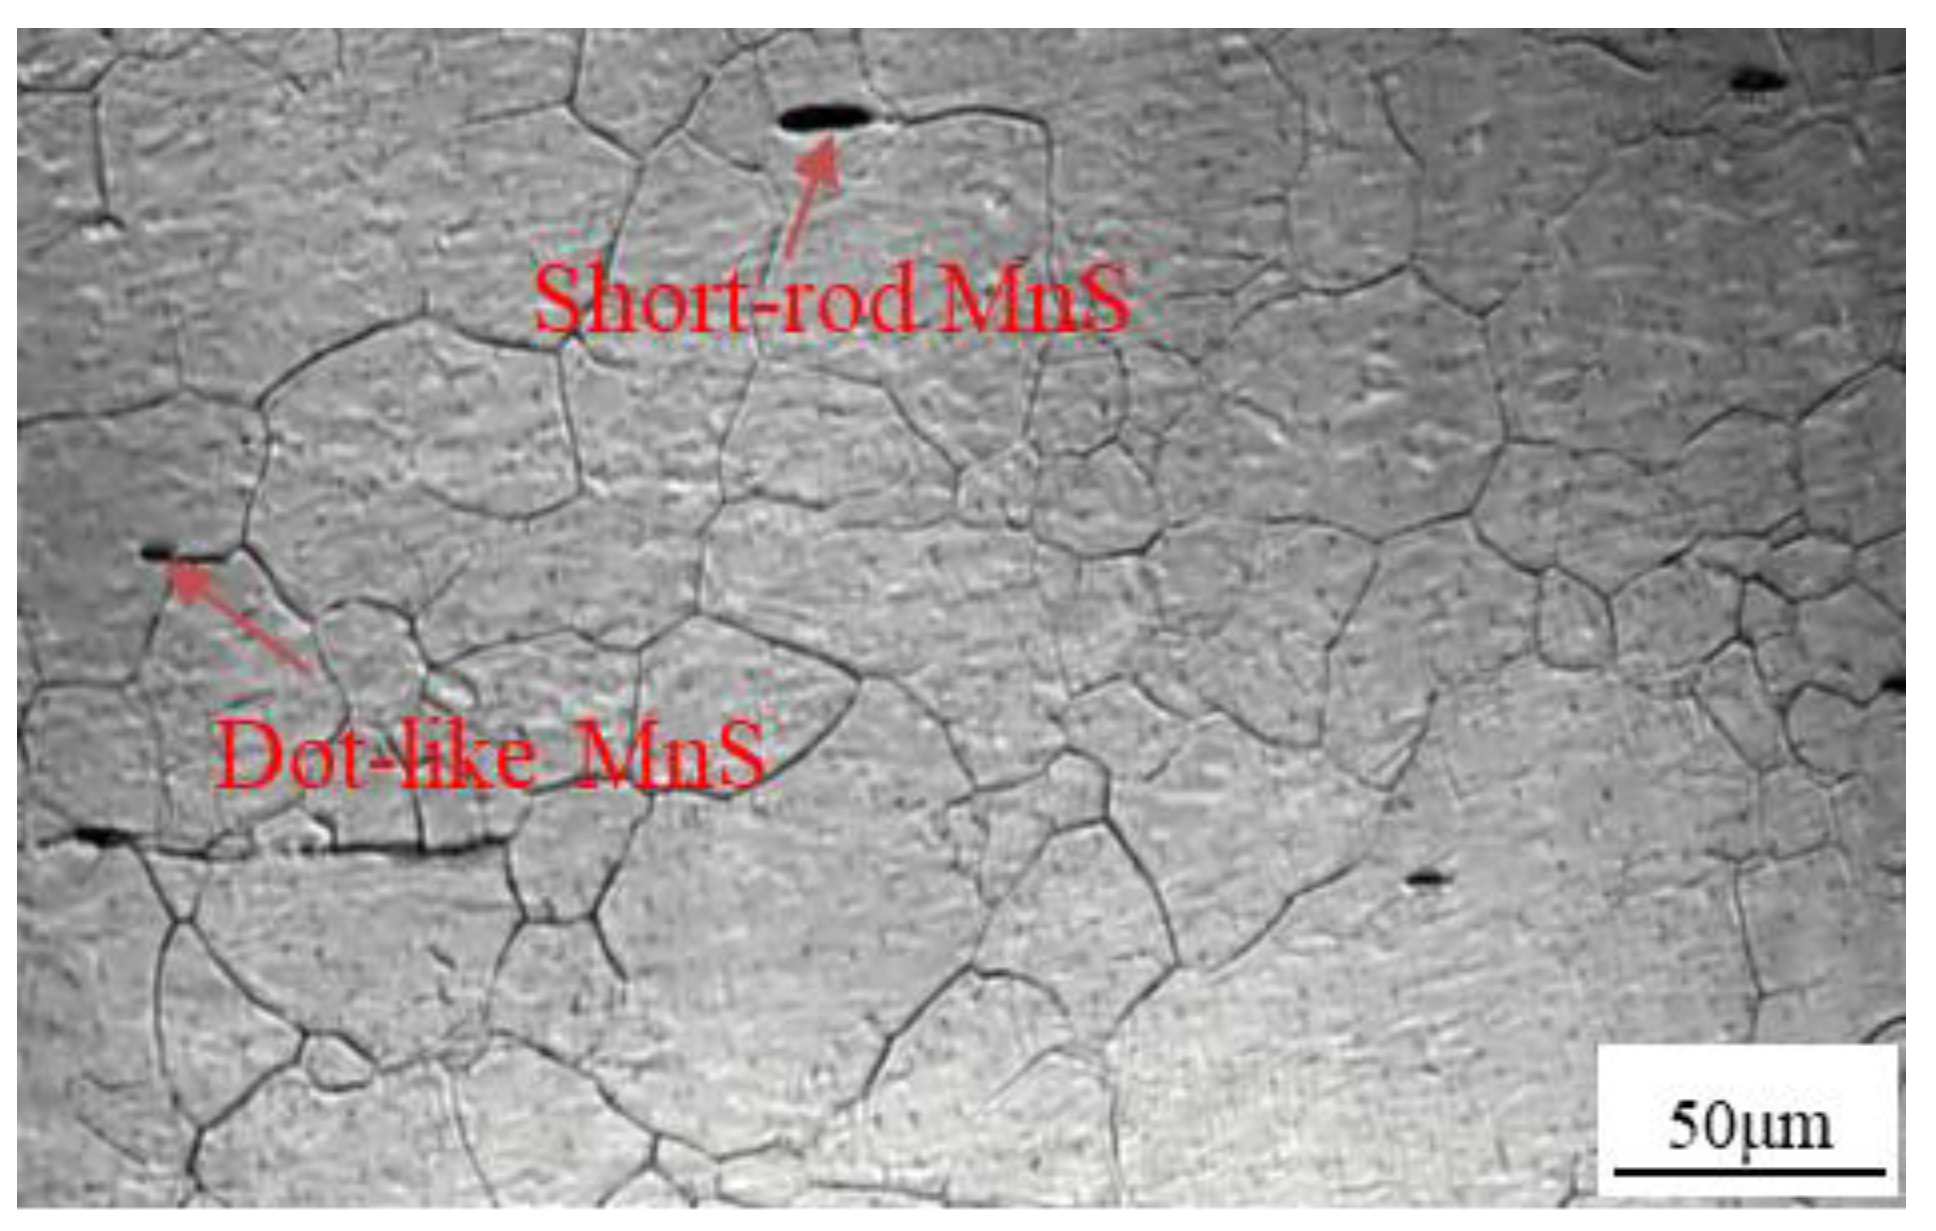
Figure 2.
(a) Equilibrium all phases constituents predicted by Thermal-Calc software for Nb-V-Ti free-cutting steel, (b) Partially enlarged view at dotted line.
Figure 2.
(a) Equilibrium all phases constituents predicted by Thermal-Calc software for Nb-V-Ti free-cutting steel, (b) Partially enlarged view at dotted line.
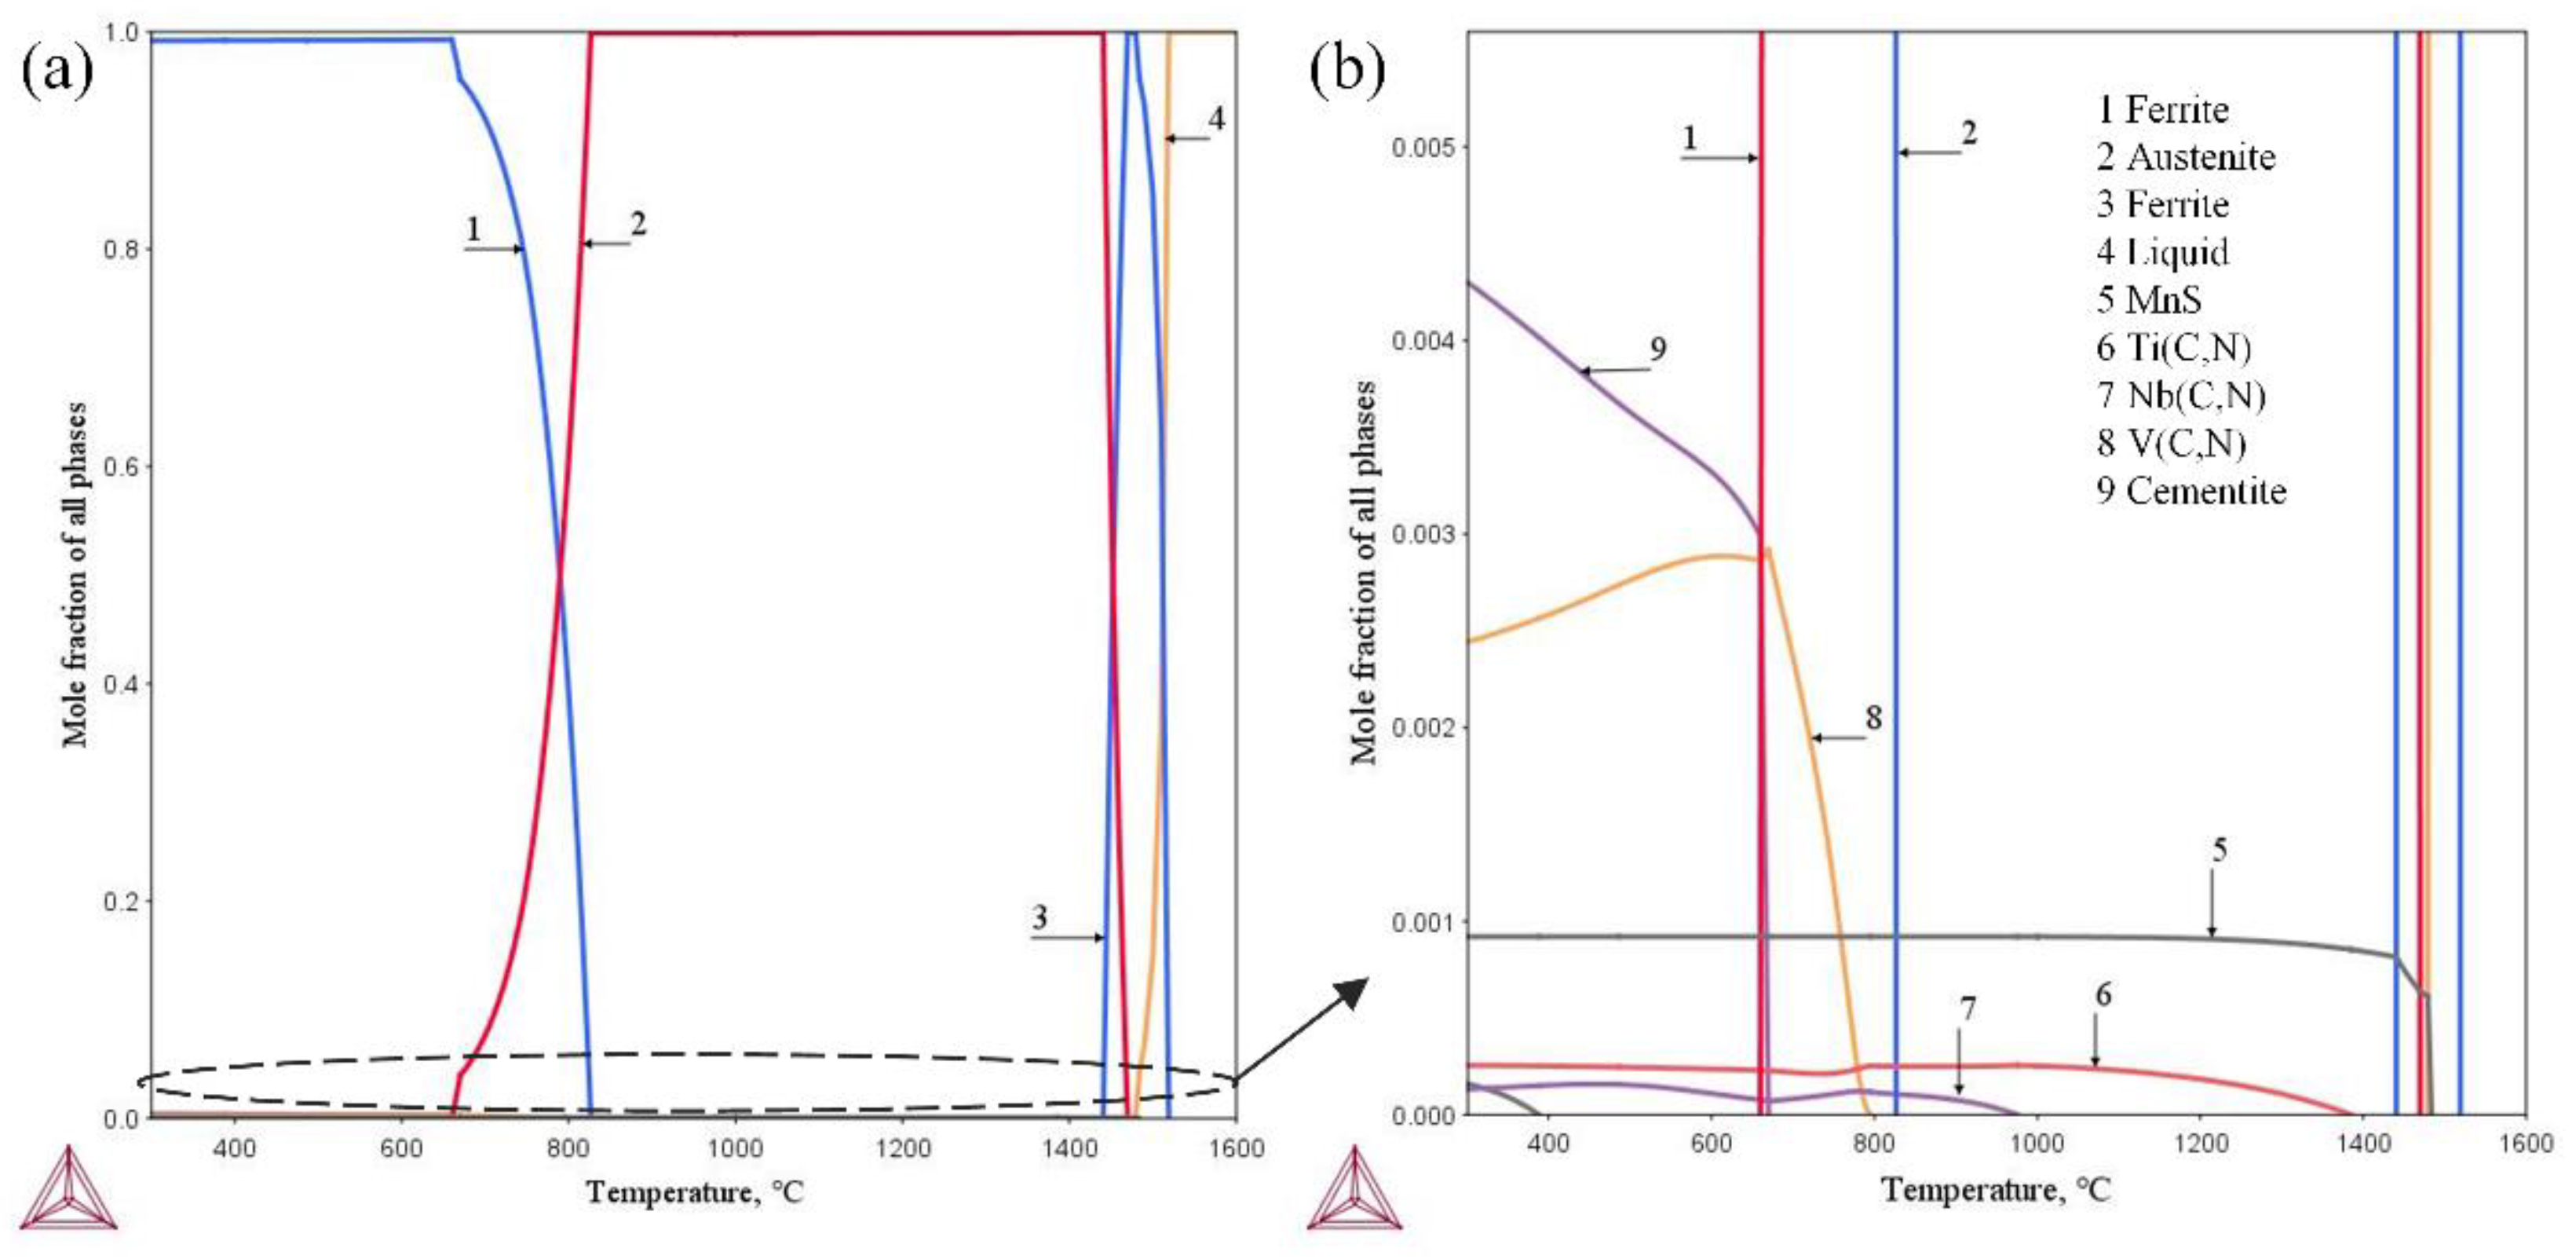
Figure 3.
True stress–true strain curves for Nb-V-Ti free-cutting steel at different deformation temperatures: (a) = 0.01 s−1, (b) = 0.1 s−1, (c) = 1 s−1, (d) = 10 s−1.
Figure 3.
True stress–true strain curves for Nb-V-Ti free-cutting steel at different deformation temperatures: (a) = 0.01 s−1, (b) = 0.1 s−1, (c) = 1 s−1, (d) = 10 s−1.
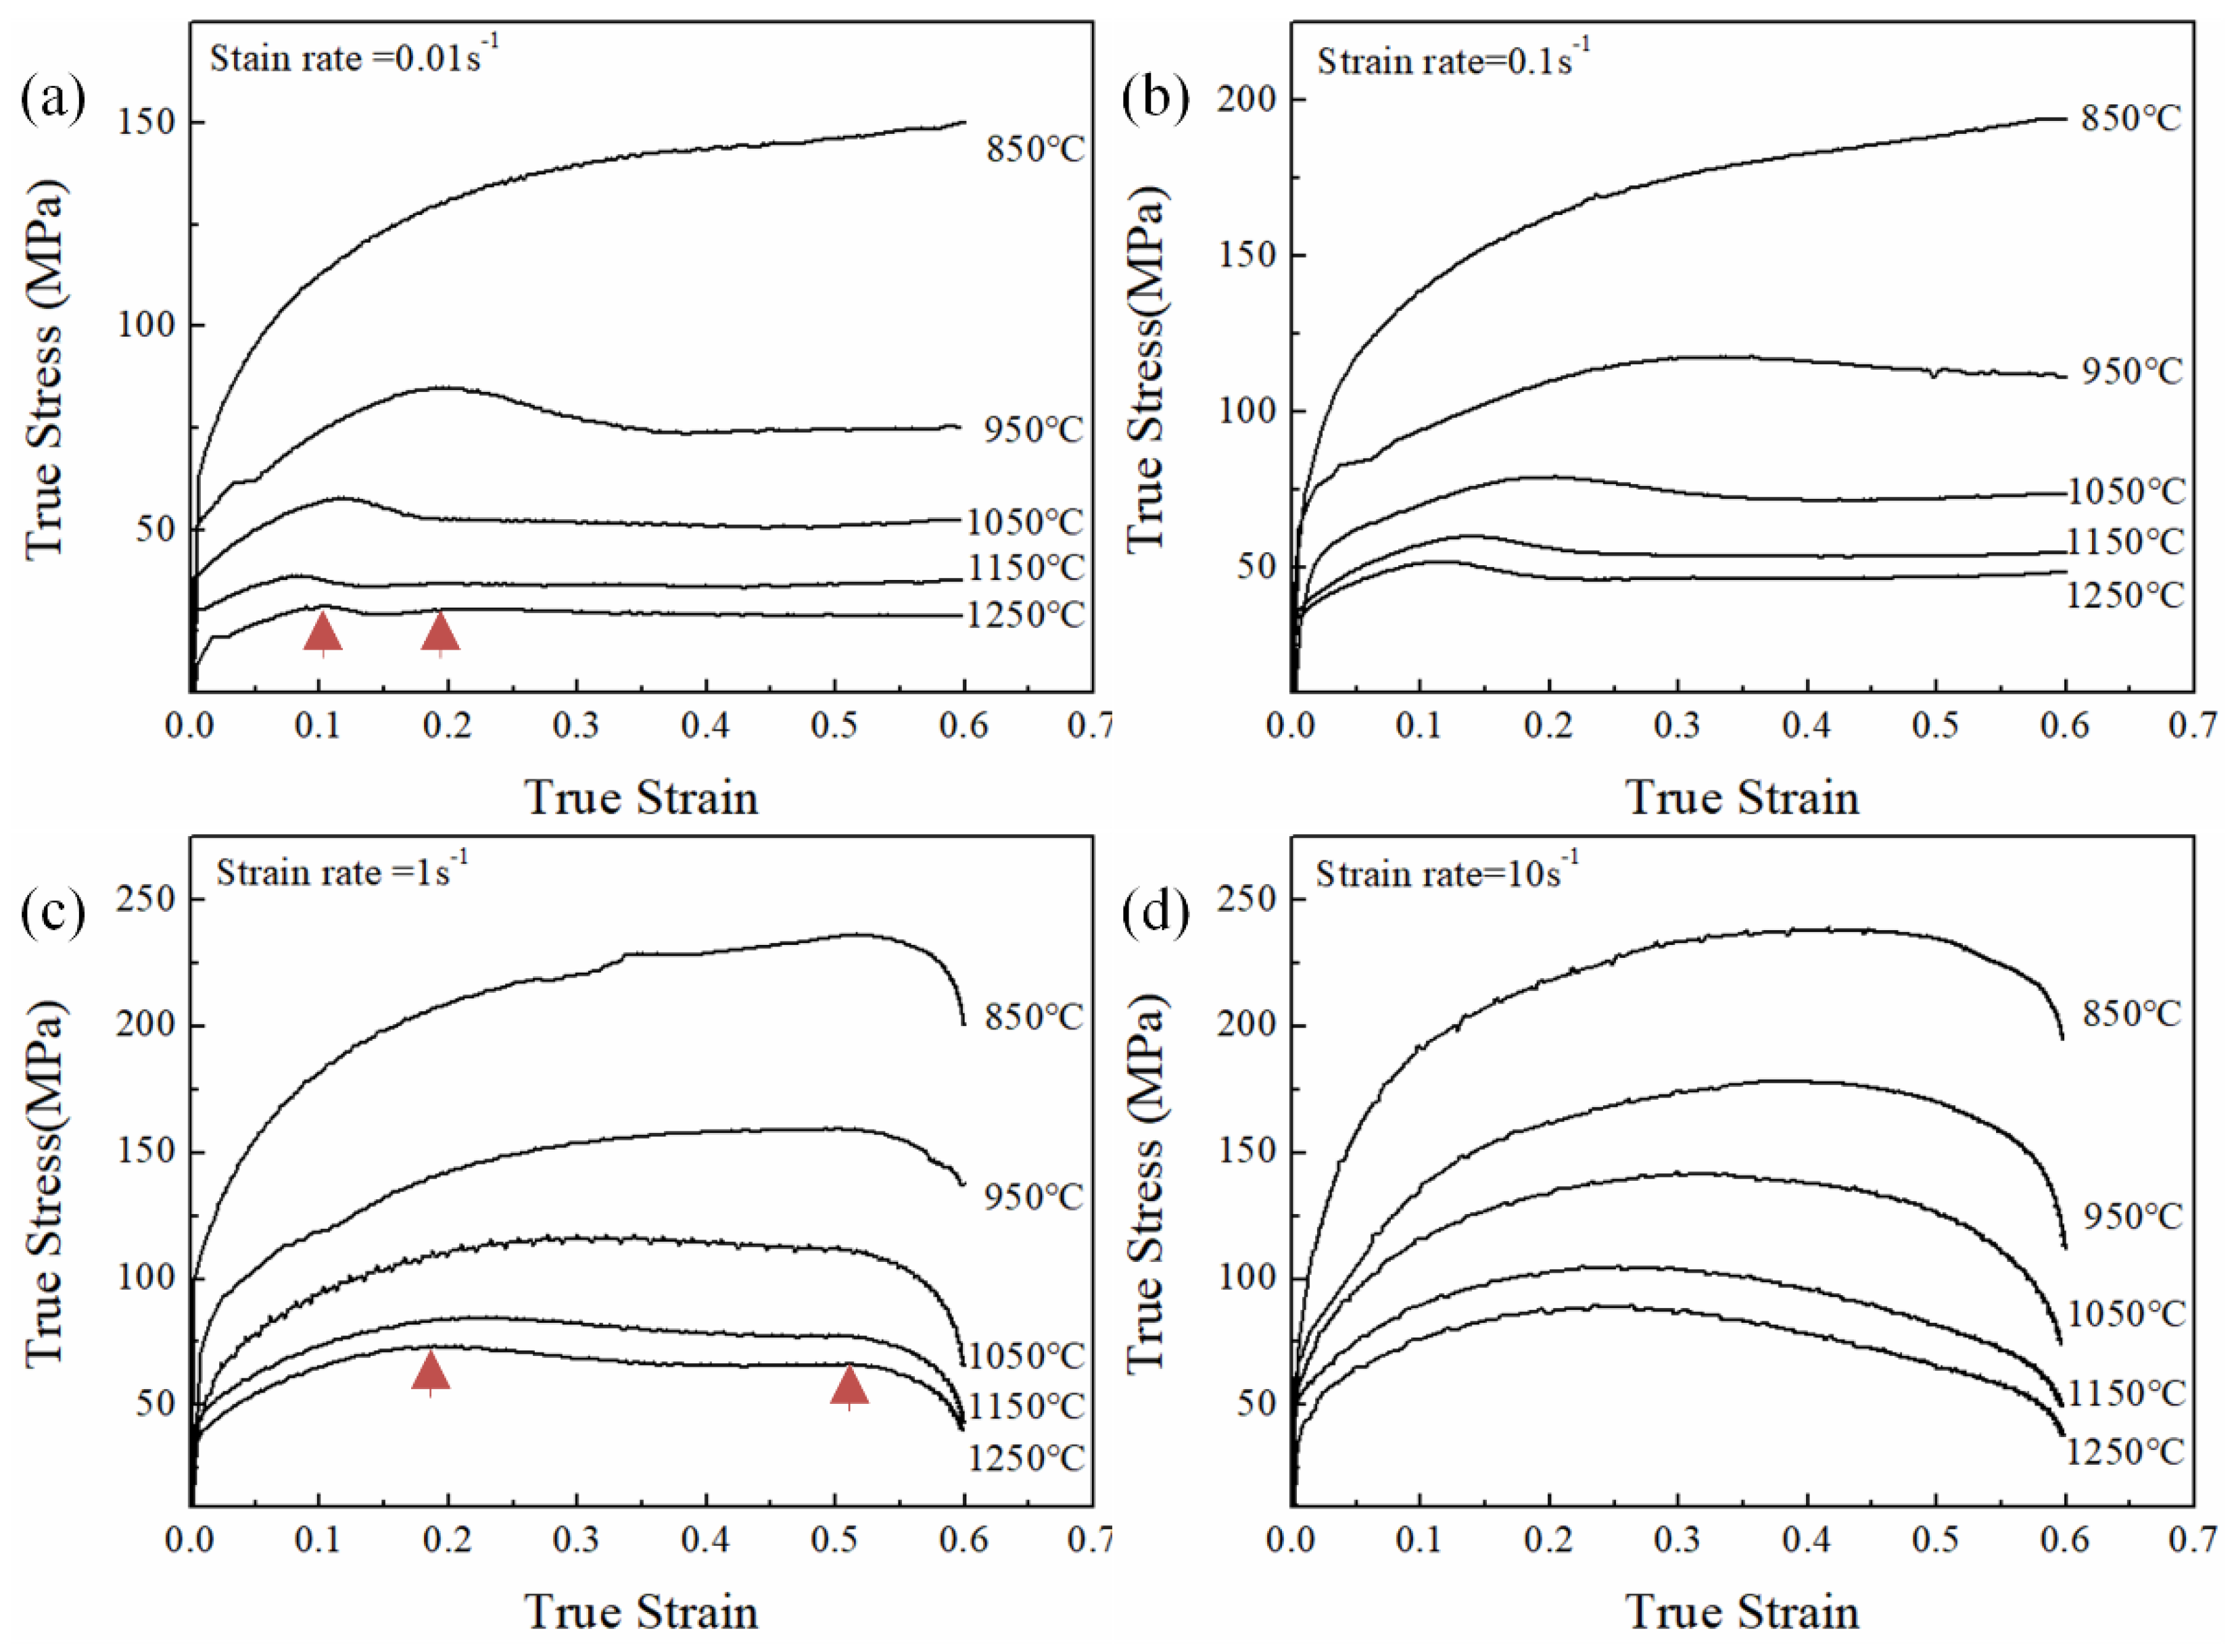
Figure 4.
The relationship between the flow stress and the strain rate: (a) ln–lnσ, (b) ln–σ.
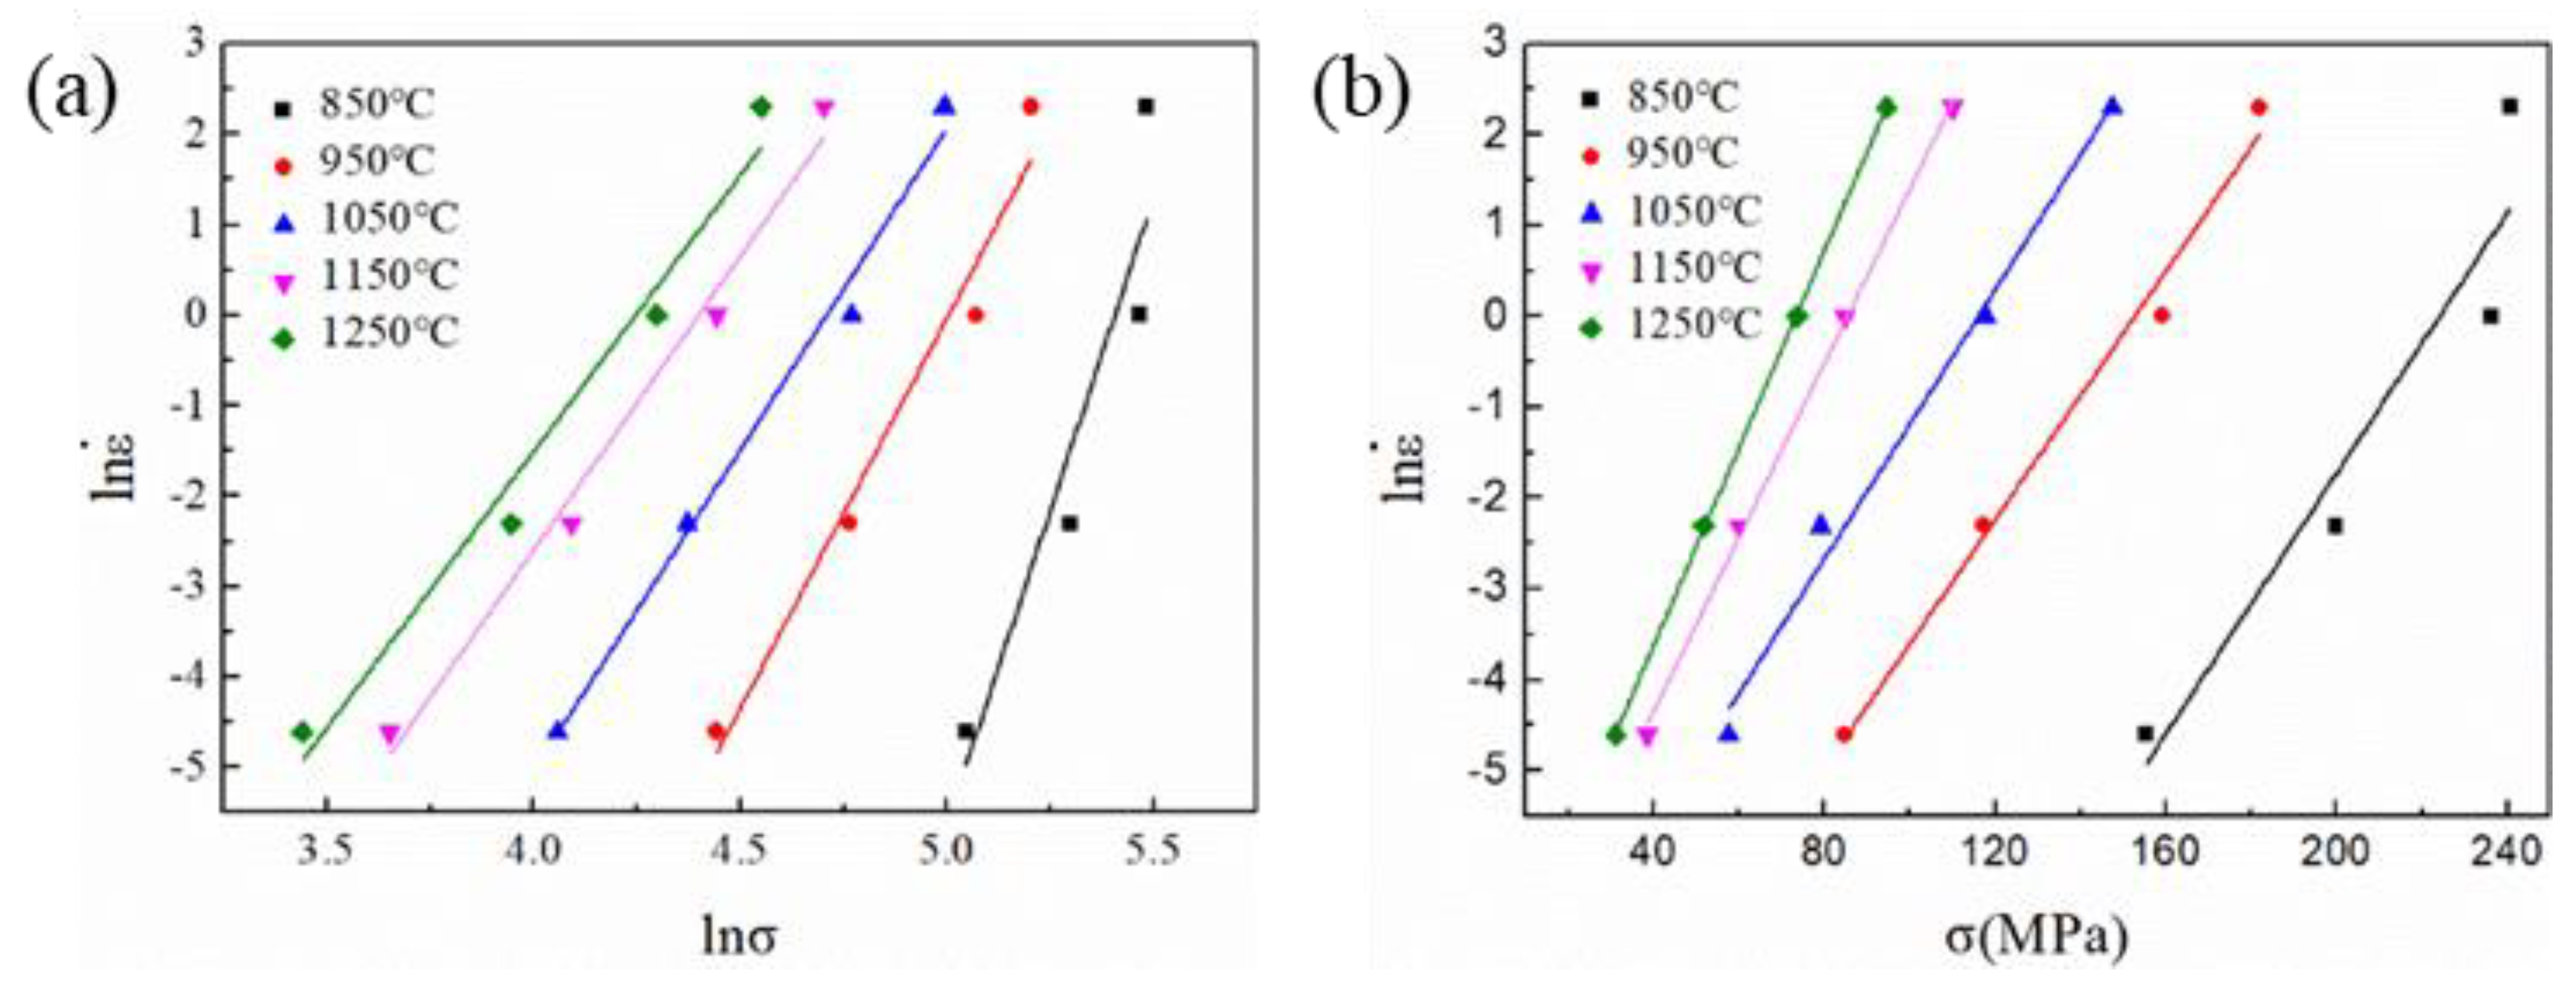
Figure 5.
Linear relationships (a) ln[sinh(ασ)]–ln and (b) ln[sinh(ασ)]–10,000/T.
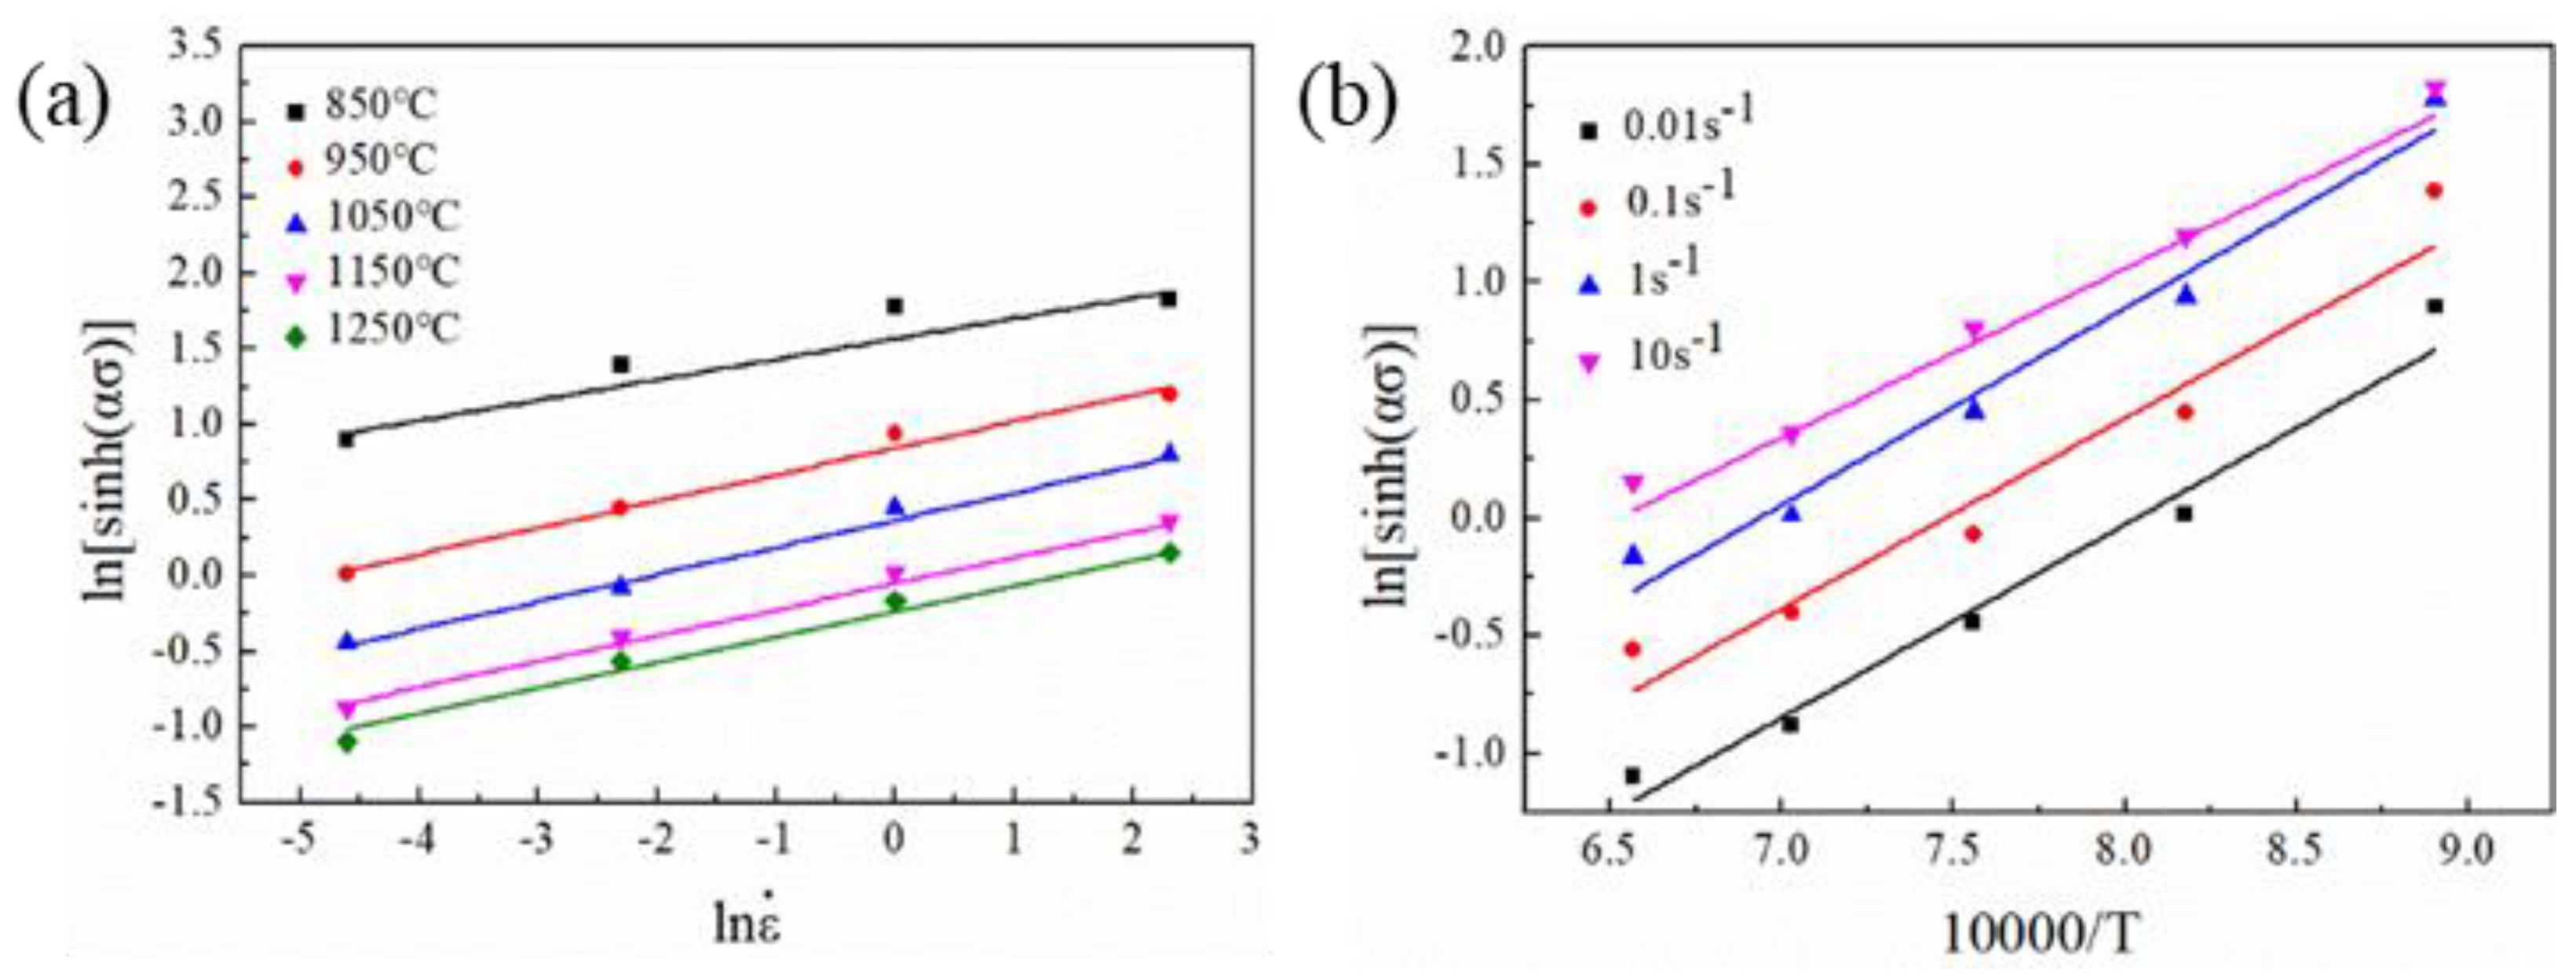
Figure 6.
The linear relationship between ln[sinh(ασ)] and lnZ.

Figure 7.
Processing maps of the experimental Nb-V-Ti free-cutting steel at the true strain of: (a) 0.3, (b) 0.4, (c) 0.5, (d) 0.6.
Figure 7.
Processing maps of the experimental Nb-V-Ti free-cutting steel at the true strain of: (a) 0.3, (b) 0.4, (c) 0.5, (d) 0.6.

Figure 8.
Optical micrographs of the specimens deformed under different conditions. (a) 1250 °C, 0.01 s−1; (b) 1250 °C, 10 s−1; (c) 850 °C, 0.01 s−1; (d) 850 °C, 10 s−1; (e) 950 °C, 10 s−1; (f) 1050 °C, 10 s−1.
Figure 8.
Optical micrographs of the specimens deformed under different conditions. (a) 1250 °C, 0.01 s−1; (b) 1250 °C, 10 s−1; (c) 850 °C, 0.01 s−1; (d) 850 °C, 10 s−1; (e) 950 °C, 10 s−1; (f) 1050 °C, 10 s−1.

Figure 9.
Grain morphologies under different deformation conditions: (a) 950 °C, 1 s−1; (b) 1050 °C, 1 s−1.
Figure 9.
Grain morphologies under different deformation conditions: (a) 950 °C, 1 s−1; (b) 1050 °C, 1 s−1.

Figure 10.
Microstructure of experimental steel after deformation: (a) deformation twins after deformation at 850 °C and 10 s−1; (b) precipitates after deformation at 850 °C and 10 s−1, (c) precipitates after deformation at 1250 °C and 0.01 s−1, (d) EDX analysis of Ti-rich(C,N), the inset is the morphology of Ti-rich(C,N), (e) EDX analysis of V-rich(C,N), the inset is the morphology of V-rich(C,N), (f) EDX analysis of (Nb,Ti)(C,N), the inset is the morphology of (Nb,Ti) (C,N).

Table 1.
Chemical compositions of the Nb-V-Ti free-cutting steel in wt%.
| C | Si | Mn | Cr | S | V | Nb | Ti | Fe |
|---|---|---|---|---|---|---|---|---|
| 0.25 | 0.38 | 2.01 | 0.52 | 0.046 | 0.119 | 0.005 | 0.013 | Balance |
Table 2.
Critical stress and corresponding critical strain (in brackets) for DRX initiation.
| 850 °C | 950 °C | 1050 °C | 1150 °C | 1250 °C | |
|---|---|---|---|---|---|
| 0.01 s−1 | 112 (0.099) | 75 (0.011) | 54 (0.077) | 35 (0.043) | 27 (0.055) |
| 0.1 s−1 | 143 (0.115) | 101 (0.123) | 71 (0.109) | 50 (0.0547) | 38 (0.017) |
| 1 s−1 | 178 (0.091) | 120 (0.107) | 94 (0.100) | 70 (0.085) | 60 (0.075) |
| 10 s−1 | 187 (0.092) | 149 (0.125) | 121 (0.109) | 87 (0.087) | 77 (0.110) |
Table 3.
The parameters in the constitutive equations of testing steel at peak stress.
| Parameter | n1 | β | α (MPa−1) | n | b | A (s−1) | Q (kJ/mol) |
|---|---|---|---|---|---|---|---|
| Value | 8.196 | 0.086 | 0.01049 | 6.017 | 7958.28 | 1.33 × 10¹⁶ | 398.13 |
Publisher’s Note: MDPI stays neutral with regard to jurisdictional claims in published maps and institutional affiliations. |
© 2020 by the authors. Licensee MDPI, Basel, Switzerland. This article is an open access article distributed under the terms and conditions of the Creative Commons Attribution (CC BY) license (http://creativecommons.org/licenses/by/4.0/).
Share and Cite
MDPI and ACS Style
Yang, Y.; Zhao, X.-M.; Dong, C.-Y.; Zhao, X.-Y. Influence of Hot Deformation and Precipitates on the Recrystallization of Nb-V-Ti Free-Cutting Steel. Metals 2020, 10, 1587. https://doi.org/10.3390/met10121587
AMA Style
Yang Y, Zhao X-M, Dong C-Y, Zhao X-Y. Influence of Hot Deformation and Precipitates on the Recrystallization of Nb-V-Ti Free-Cutting Steel. Metals. 2020; 10(12):1587. https://doi.org/10.3390/met10121587
Chicago/Turabian StyleYang, Yang, Xian-Ming Zhao, Chun-Yu Dong, and Xiao-Yu Zhao. 2020. "Influence of Hot Deformation and Precipitates on the Recrystallization of Nb-V-Ti Free-Cutting Steel" Metals 10, no. 12: 1587. https://doi.org/10.3390/met10121587
Note that from the first issue of 2016, this journal uses article numbers instead of page numbers. See further details here.