Solidification and Precipitation Microstructure Simulation of a Hypereutectic Al–Mn–Fe–Si Alloy in Semi-Quantitative Phase-Field Modeling with Experimental Aid


Abstract
:1. Introduction
2. Materials and Methods
3. Results and Discussion
4. Conclusion
Supplementary Materials
Author Contributions
Funding
Conflicts of Interest
References
- Andersen, S.J.; Marioara, C.D.; Friis, J.; Wenner, S.; Holmestad, R. Precipitates in aluminium alloys. Adv. Phys. X. 2018, 3, 1479984. [Google Scholar] [CrossRef]
- Fine, M.E. Precipitation hardening of aluminum alloys. Metall. Trans. A 1975, 6, 625–630. [Google Scholar] [CrossRef]
- Li, Y.; Gao, G.; Wang, Z.; Di, H.; Li, J.; Xu, G. Effects of the Mg/Si ratio on microstructure, mechanical properties, and precipitation behavior of Al-Mg-Si-1.0 wt%-Zn alloys. Materials 2018, 11, 2591. [Google Scholar] [CrossRef] [PubMed] [Green Version]
- Liu, K.; Chen, X.-G. Evolution of Intermetallics, Dispersoids, and Elevated Temperature Properties at Various Fe Contents in Al–Mn–Mg 3004 Alloys. Metall. Mater. Trans. B 2016, 47, 3291–3300. [Google Scholar] [CrossRef] [Green Version]
- Liu, K.; Chen, X.-G. Evolution of microstructure and elevated-temperature properties with Mn addition in Al–Mn–Mg alloys. J. Mater. Res. 2017, 32, 2585–2593. [Google Scholar] [CrossRef]
- Zhang, Y.; Jin, W.; Hao, X.; Qiu, F.; Zhao, Q. Improving Elevated-Temperature Strength of an Al–Mn–Si Alloy by Strain-Induced Precipitation. Metals 2018, 8, 446. [Google Scholar] [CrossRef] [Green Version]
- Schmitz, G.J.; Prahl, U. Handbook of Software Solutions for ICME; Wiley-VCH Verlag GmbH & Co. KGaA.: Weinheim, Germany, 2017; pp. 23–30. [Google Scholar]
- Eiken, J.; Apel, M.; Liang, S.-M.; Schmid-Fetzer, R. Impact of P and Sr on solidification sequence and morphology of hypoeutectic Al–Si alloys: Combined thermodynamic computation and phase-field simulation. Acta Mater. 2015, 98, 152–163. [Google Scholar] [CrossRef]
- Eiken, J.; Böttger, B.; Steinbach, I. Multiphase-field approach for multicomponent alloys with extrapolation for numerical application. Phys. Rev. E. 2006, 73, 066122. [Google Scholar] [CrossRef]
- Monas, A.; Shchyglo, O.; Kim, S.-J.; Yim, C.D.; Höche, D.; Steinbach, I. Divorced eutectic solidification of Mg-Al alloys. JOM 2015, 67, 1805–1811. [Google Scholar] [CrossRef]
- Viardin, A.; Zollinger, J.; Sturz, L.; Apel, M.; Eiken, J.; Berger, R.; Hecht, U. Columnar dendritic solidification of TiAl under diffusive and hypergravity conditions investigated by phase-field simulations. Comput. Mater. Sci. 2020, 172, 109358. [Google Scholar] [CrossRef]
- Wang, I.; Wei, Y. Onset of curved dendrite growth in an Al-Cu welding pool: A phase field study. JOM 2018, 70, 733–738. [Google Scholar] [CrossRef]
- Wei, M.; Zhang, L.; Yang, M.; Li, K.; Liu, S.; Zhao, P.; Du, Y. Phase-field simulation of the solidified microstructure in a new commercial 6xxx aluminum alloy ingot supported by experimental measurements. Int. J. Mater. Res. 2018, 109, 91–98. [Google Scholar] [CrossRef]
- Wang, K.; Wei, M.; Zhang, L.; Du, Y. Morphologies of Primary Silicon in Hypereutectic Al–Si Alloys: Phase-Field Simulation Supported by Key Experiments. Metall. Mater. Trans. A 2016, 47, 1510–1516. [Google Scholar] [CrossRef]
- Greenwood, M.; Shampur, K.N.; Ofori-Opoku, N.; Pinomaa, T.; Wang, L.; Gurevich, S.; Provatas, N. Quantitative 3D phase field modelling of solidification using next-generation adaptive mesh refinement. Comput. Mater. Sci. 2018, 142, 153–171. [Google Scholar]
- Yang, C.; Xu, Q.; Liu, B. CPU-accelerated three-dimensional phase-field simulation of dendrite growth in a nickel-based superalloy. Comput. Mater. Sci. 2017, 136, 133–143. [Google Scholar] [CrossRef]
- Köhnen, P.; Ewald, S.; Schleifenbaum, J.H.; Belyakov, A.; Haase, C. Cotrolloing microstructure and mechanical properties of additively manufactured high-strength steels by tailored solidification. Addit. Manuf. 2020, 35, 101389. [Google Scholar]
- Tangen, S.; Sjølstad, K.; Furu, T.; Nes, E. Effect of Concurrent Precipitation on Recrystallization and Evolution of the P-Texture Component in a Commercial Al–Mn Alloy. Metall. Mater. Trans. A 2010, 41, 2970–2983. [Google Scholar] [CrossRef]
- Steinbach, I. Phase-field models in materials Science. Modelling Simul. Mater. Sci. Eng. 2009, 17, 073001. [Google Scholar] [CrossRef]
- MICRESS. Version 6.4. Access e.V.: Aachen, Germany. Available online: http://www.micress.de (accessed on 18 May 2020).
- Eiken, J. A Phase-Field Model for Technical Alloy Solidification. Ph.D. Thesis, RWTH Aachen, Aachen, Germany, 2009. [Google Scholar]
- Kang, H.; Li, X.; Su, Y.; Liu, D.; Guo, J.; Fu, H. 3–D morphology and growth mechanism of primary Al6Mn intermetallic compound in directionally solidified Al–3at.%Mn alloy. Intermetallics 2012, 23, 32–38. [Google Scholar] [CrossRef]
- Yang, P.; Engler, O.; Klaar, H.-J. Orientation relationship between Al6Mn precipitates and the Al matrix during continuous recrystallization in Al–1.3%Mn. J. Appl. Cryst. 1999, 32, 1105–1118. [Google Scholar] [CrossRef]
- Greer, A.L.; Bunn, A.M.; Tronche, A.; Evans, P.V.; Bristow, D.J. Modelling of inoculation of metallic melts: Application to grain refinement of aluminium by Al–Ti–B. Acta Mater. 2000, 48, 2823–2835. [Google Scholar] [CrossRef]
- Apel, M.; Eiken, J.; Hecht, U. Phase field models for heterogeneous nucleation: Application to inoculation in alpha-solidifying Ti-Al-B alloys. Eur. Phys. J. Special Topics 2014, 223, 545–558. [Google Scholar] [CrossRef]
- Böttger, B.; Eiken, J.; Schmid-Fetzer, R. Phase field simulation of equiaxed solidification in technical alloys. Acta Mater. 2006, 54, 2697–2704. [Google Scholar] [CrossRef]
- Böttger, B.; Eiken, J.; Apel, M. Phase-field simulation of microstructure formation in technical casting–A self-consistent homoenthalpic approach to the micro-macro problem. J. Comput. Phys. 2009, 228, 6784–6795. [Google Scholar] [CrossRef]
- Thermo-Calc Software TCAL6 Al-alloys Database. Version 6. Thermo-Calc Software AB: Solna, Sweden. Available online: https://www.thermocalc.com/media/56825/tcal6_extended_info.pdf (accessed on 18 May 2020).
- Thermo-Calc Software MOBAL5 Al-alloys Mobility Database. Version 5. Thermo-Calc Software AB: Solna, Sweden. Available online: https://www.thermocalc.com/media/56826/mobal5.pdf (accessed on 18 May 2020).
- Andersson, J.-O.; Helander, T.; Höglund, L.; Shi, P.; Sundman, B. Thermo-Calc & DICTRA, computational tools for materials science. Calphad 2002, 26, 273–312. [Google Scholar]


| Element | Al | Mn | Fe | Si | Zn | Ti |
|---|---|---|---|---|---|---|
| Composition (wt%) | Bal. | 2.7 | 0.2 | 0.07 | 0.01 | 0.02 |
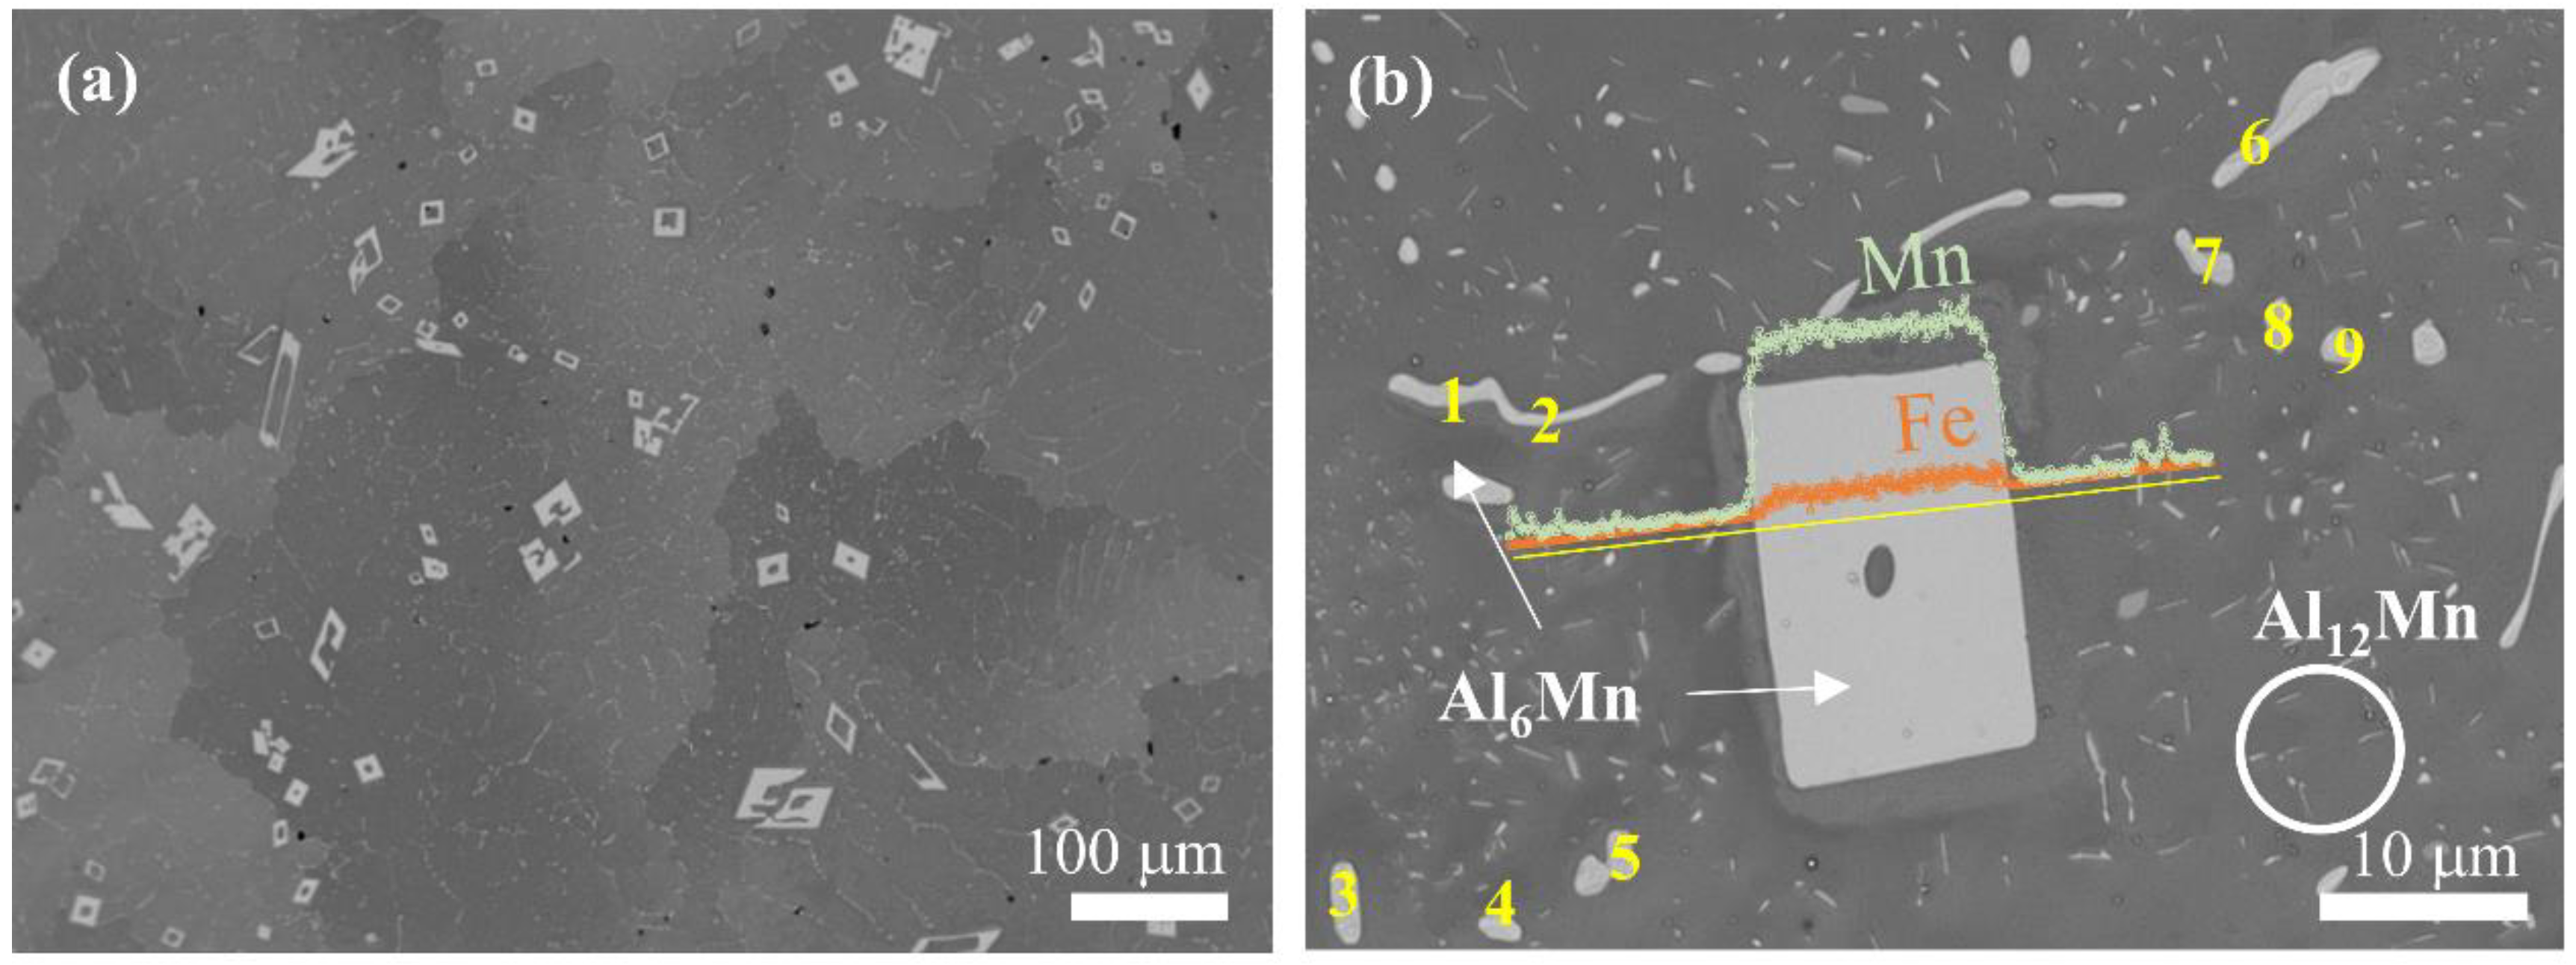
| Element (wt%) | Point ID | Averaged Profile in Figure 3b | ||||||||
|---|---|---|---|---|---|---|---|---|---|---|
| 1 | 2 | 3 | 4 | 5 | 6 | 7 | 8 | 9 | ||
| Al | 81.67 | 82.65 | 79.05 | 80.24 | 77.66 | 82.19 | 83.17 | 81.99 | 83.72 | 69.46 |
| Mn | 15.13 | 14.15 | 14.28 | 15.55 | 17.59 | 13.93 | 14.23 | 13.89 | 14.80 | 2.64 |
| Fe | 3.20 | 3.20 | 6.67 | 4.21 | 4.75 | 3.87 | 2.60 | 4.12 | 1.48 | 27.90 |
| x | 0.83 | 0.82 | 0.69 | 0.79 | 0.79 | 0.79 | 0.85 | 0.77 | 0.91 | 0.91 |
| Parameter | Value | Unit |
|---|---|---|
| Simulation grid size | 1 | μm |
| 2D simulation domain size | 1000 × 1000 | μm2 |
| 3D simulation domain size | 125 × 125 × 125 | μm3 |
| Interface thickness | 3.0 | cells |
| Heat extraction rate | 8.8 × 10⁷ | J/s·m3 |
| 0.09 | J/m2 | |
| 10−10 | m4/J·s | |
| 0.5 | J/m2 | |
| 10−12 | m4/J·s | |
| 0.2 | J/m2 | |
| 10−9 | m4/J·s |
© 2020 by the authors. Licensee MDPI, Basel, Switzerland. This article is an open access article distributed under the terms and conditions of the Creative Commons Attribution (CC BY) license (http://creativecommons.org/licenses/by/4.0/).
Share and Cite
Park, J.; Oh, C.-S.; Kang, J.-H.; Jung, J.-G.; Lee, J.-M. Solidification and Precipitation Microstructure Simulation of a Hypereutectic Al–Mn–Fe–Si Alloy in Semi-Quantitative Phase-Field Modeling with Experimental Aid. Metals 2020, 10, 1325. https://doi.org/10.3390/met10101325
Park J, Oh C-S, Kang J-H, Jung J-G, Lee J-M. Solidification and Precipitation Microstructure Simulation of a Hypereutectic Al–Mn–Fe–Si Alloy in Semi-Quantitative Phase-Field Modeling with Experimental Aid. Metals. 2020; 10(10):1325. https://doi.org/10.3390/met10101325
Chicago/Turabian StylePark, Jiwon, Chang-Seok Oh, Joo-Hee Kang, Jae-Gil Jung, and Jung-Moo Lee. 2020. "Solidification and Precipitation Microstructure Simulation of a Hypereutectic Al–Mn–Fe–Si Alloy in Semi-Quantitative Phase-Field Modeling with Experimental Aid" Metals 10, no. 10: 1325. https://doi.org/10.3390/met10101325