1. Introduction
Homeownership represents a considerable source of investment, upward mobility, and intergenerational transfer of resources and has, therefore, been labeled as the American Dream. The benefit of homeownership is not limited to the individual homeowners but extends to their children, homeowners’ community or neighborhood, and the national economy. The identified benefits for the homeowner include wealth accumulation through equity, intergenerational transfer of wealth, tax deductions, psychological health benefits, and enhanced self-esteem while the children of homeowners tend to have high academic achievements, high-quality home and social environment, especially, when compared with children of renters [
1,
2]. Also, homeownership leads to improved neighborhood stability and greater civic involvement through enhanced participation in social and political programs while the construction of homes fuels the national economy. In view of these benefits, all levels of government have established programs and/or policies designed to promote homeownership especially for low-to-moderate income citizens.
Notwithstanding the proliferation of government policies and programs geared towards homeownership, the psychological and economic benefits to individual homeowners and general incline in homeownership rates, homeownership is not evenly distributed across the different ethnic groups, as ethnic minorities are disproportionately less likely to be homeowners [
3]. The purpose of this research, therefore, is to provide comprehensive information about Habitat for Humanity International’s homeownership program. Such information include the socio-economic characteristics of the beneficiaries to ascertain that the beneficiaries are actually low to moderate income citizens, the beneficiaries’ perceptions of neighborhood quality, and the benefits and challenges of homeownership provided by Habitat.
2. Habitat for Humanity International
One of the most prominent non-profit organizations regarding the provision of homeownership for low to moderate housing is Habitat for Humanity International (HFHI). It is a faith-based housing initiative that was established in 1968 by Millard and Linda Fuller as “Fund for Humanity [
4].” During the next five years, Fund for Humanity completed two partnership homes, one in Sumter County, Georgia, and one in Zaire. The organization was renamed Habitat for Humanity International (Habitat) in 1976 as a faith-based organization that fosters homeownership both in the United States and in developing countries. The stated goal of Habitat is to provide low-income people world-wide with simple, decent, and affordable housing and to enhance the community’s “social capital” by bringing “partner” families and local volunteers together in the home-building process. Habitat currently has a network of more than 1500 local affiliates located in all 50 states of the United States and sponsors partner organizations in 92 nations throughout the world [
5,
6].
Since the inception of Habitat for Humanity International, the total number of houses completed worldwide has been over 400,000, sheltering more than 2 million people in more than 3000 communities and 92 nations [
5]. While this does not seem large in comparison to the vast national and international needs, it is impressive since it has been accomplished by an organization largely composed of volunteers. Habitat’s aggregate volume in the United States easily puts it in the ranks of the nation’s top 20 homebuilders [
5]. In addition to building houses, a few affiliates also undertake activities, such as minor housing repairs for existing homeowners, especially the elderly and individuals with special needs. In contrast to most housing producers, Habitat affiliates usually do not identify specific neighborhoods for housing development but select areas where land is relatively inexpensive. This strategy tends to lower housing cost but leads to the scattering of Habitat homes, thus preventing the cumulative positive effects of home clustering or neighborhood revitalization.
Regarding organizational structure, Habitat has an ecumenical board of directors consisting of 29 people who meet three times annually to set policy and monitor operations. The board of directors is elected to two-year terms that may be renewed four times. They receive no compensation for their voluntary service. The organization’s headquarters operates with a small paid staff, supplemented by volunteers. Monetary contributions to HFHI can be targeted for the activities for specific local affiliates, for its overseas projects, or for general administrative purposes. Reporting to the director of U.S. affiliates are five area directors, each of whom covers three regions working from a field office.
While Habitat affiliates often work closely with low-income neighborhood-based organizations, they do not seem to incorporate the neighborhood residents or advocates into the affiliate’s leadership structures. In the past the absence of minority representation on the board of Habitat affiliates is particularly striking because the beneficiaries of Habitat homes are predominantly African Americans or Hispanic [
7]. Currently, HFHI is noticing the importance of having minorities on the board inasmuch as they are servicing African Americans and Hispanics. As a result, Habitat affiliates are starting to include African Americans and Hispanics as members of the board.
Habitat volunteers, particularly those who render major amounts of time and money, seem to have favorable opinions about the organization’s efforts to foster community service, its advocacy of formation of social capital and civil society. Also, the volunteers seem to believe strongly that the concept of partnership espoused by Habitat contains a genuine element of empowerment and dignity for those served [
8].
Habitat homes are built in partnership with the beneficiaries of the housing (whom the organization always refers to as “partners”), and the “partners” are required to participate in its construction; and rather than receive their house as a gift, they should purchase it. Habitat’s success at creating low-cost affordable home ownership opportunities has been achieved through the following contributions: combined use of homeowner “sweat equity,” on-site labor by other volunteers, contributions (labor, in-kind, and financial) by professionals and corporate sponsors, support generated by churches, individual tax-deductible charitable contributions and donated materials.
Initially, Habitat did not accept government funds, the rationale being that provision of homes to “the poor” should be a voluntary act of charity based on Christian love. This stance differed from that of many other religious groups that do not perceive the use of public funds as contrary to their mission but see public/private partnership as an optimal way to create housing for the poor [
7]. In spite of this position of not accepting government funds, Habitat has become so popular that governments seem eager to support the organization. For example, HUD’s Self-help Homeownership Opportunity Program (SHOP) was presumably created with Habitat in mind [
7].
Over the years, the organization’s policy in this regard has softened and Habitat affiliates accept public support, such as land donations, infrastructures, and administrative cost, but not direct construction of homes. In most of the cities where the affiliates operate, the local government acquires and makes available to Habitat residential lots acquired by the cities through tax delinquencies and demolition of abandoned buildings. Other forms of assistance include free or reduced cost planning, subdivision, and infrastructure assistance [
8].
Although Habitat focuses on building homes for low-income house-holds, its effects are far-reaching and extend beyond constructing houses. Either as homeowners or as volunteers, involvement with Habitat has admittedly been a life-changing experience. Many people who have been touched by Habitat’s philosophy return to volunteer for the organization and help spread its message. Millard Fuller captures this sentiment in his book
More Than
Houses: “It is increasingly obvious that we are building so much more than houses… We are building people. We are building relationships. We are breaking down barriers. We are building and revitalizing neighborhoods; we are activating faith and planting hope in the hearts of people” [
8] (p. 404).
3. Benefits of Homeownership
Homeownership provides substantial benefits to the economy on every level of the society. At the individual level, the benefits of homeownership include mortgage interest tax deduction—the government’s largest housing subsidy, and homeowners can generate equity from mortgage payments on their homes. Home equity can be used to make home repairs or additions, fund college education, and is considered as one of the largest sources of collateral for bank loans to start new businesses [
9]. At the neighborhood level, several authors such as Coulson, Hwang, and Imai [
10]; Drier, [
11]; and DiPasquale and Glaeser [
12], noted that a high rate of homeownership in a community or neighborhood provides several benefits to the neighborhood. Such benefits include higher rates of participation in community organizations, higher rates of direct political participation, and greater awareness of local political officials. Drier [
11] noted that homeowners vote at a substantially higher rate than renters, at 69% and 44%, respectively. DiPasquale and Glaeser [
12] noted that homeowners are six percent more likely to work to solve local problems, fifteen percent more likely to vote at local elections, and nine percent more likely to know the names of the members of local school boards.
Regarding neighborhood tenure and stability, Rohe, Van Zandt, and McCarthy [
1] noted that homeowners are likely to remain in their homes for an average of 8.2 years compared to renters who on the average move every 2.1 years. Additionally, seventy percent of homeowners have lived in their current residence for more than four years, while in direct contrast, greater than seventy percent of renters have lived in their current residence for less than four years.
At the national level, homeownership and the housing sector fuel the national economy through direct spending on housing—new residential construction, home repairs and housing services, taxation and consumer spending by homeowners. For example, the Habitat for Humanity (New York) report noted that first-time homebuyers spend an average of $5000 when moving into a new home, and $3700 when moving into an existing home.
Finally, Rohe, VanZandt, and McCarthy [
1] noted that 86% of the respondents reported that people are better off owning a home while Fannie Mae [
13] made the following observations: 67% of the surveyed renters reported that they rent because they cannot afford to own homes, only 27% stated that they choose to rent, and 60% of the renters rank owning a home as either a “very important priority” or “the number one priority” in their lives.
4. Perceptions of Homeownership
Homeownership over the years has been viewed as an important milestone for many families and an important contribution to vibrant communities. According to Bostic and Surette [
14], there have been efforts from both public and private organizations to foster homeownership, and buying a home is one of the top reasons for saving money (among renters) in various surveys (i.e., Current Population Survey CPS). The decision to own a home is governed by a number of factors, including household circumstances, such as the presence of children, the availability and affordability of homes, and the ability to obtain financing for mortgages. In viewing perceptions of homeownership, according to Ibitayo and McDonald [
15], input from community residents’ is critical for several reasons. Some of these issues and reasons are relevant to poor neighborhoods, including deteriorated housing that are usually inadequately accounted for in the census. The residents are likely to become more aware of the neighborhood conditions and also can more readily identify the needs. Also, citizens’ involvement is necessary in view of the contemporary movement for expanded community participation and greater devolution of authority. If neighborhoods or neighborhood associations are to supplement municipal efforts in areas, such as crime prevention and detection, and education, the views of the residents regarding these issues are critical. While political alienation or efficacy is prevalent in poor, minority communities, soliciting and incorporating citizen’s input into the decision making process may help build solidarity and vested community interest [
16]. Political alienation may lead to resentment, violence and disorder. Efforts to ameliorate these conditions of low-income neighborhoods should not be limited to worse-case scenarios or even large cities, such as Atlanta or Chicago. For these global cities, the focus should move beyond the physical developments and economic growth even though they do not necessarily enhance the social and the economic conditions of the residents.
Several scholars have argued that owning a home can contribute to ones self-esteem and self-worth. Coopersmith [
17] defined self-esteem as an individual’s personal judgment of worthiness that is expressed in the attitudes that individuals hold toward themselves. Rosenberg [
18] identified three mechanisms by which individuals can assess their particular levels of self-esteem: reflected appraisals, social comparison, and self-attribution. Self-esteem has been greatly influenced by how one sees him or herself as well as how one is viewed by others. A person’s esteem in the eyes of others may be influenced by his or her income, education, and occupation. Beyond these factors, homeownership may have a significant influence on self-esteem because it has become an important symbol of social status in American society [
19]. Owning a home, for low-income individuals, may lead them to believe that they are more successful than those who are renting. If a low-income individual has reached his or her goal of owning a home, this is evidence that an individual is worthy and competent. Inasmuch as homeownership is a goal for the majority of Americans, having achieved this goal can be an indication of personal success that may lead to greater self-esteem.
Owning rather than renting is perceived as having control over life events. According to Rohe and Basolo [
19], perceived control has been defined as an individual’s belief that he or she is largely in command of important life events as opposed to those events being a result of fate or the will of others. Some scholars have argued that property rights afforded homeowners greater control over their living environments. Owners can now fix up their homes and yards to suit their personal needs and tastes, and they apply greater security of tenure than do renters. Greater control over one’s living environment, in turn may have a positive impact on his or her sense of perceived control over life events [
19]. Many studies have investigated the determinants of perceived control. Among other findings, these studies report a positive relationship between various socioeconomic indicators such as income, education, and occupational prestige. In addition, research has also found that males tend to have higher levels of perceived control than females [
20].
5. Neighborhood Quality
The value of a housing unit in terms of its rate of appreciation or depreciation and the economic well-being of the homeowner depends on non-shelter items, such as the quality of the neighborhood and the quality and availability of city services where the housing unit is located. The same argument is also tenable in terms of the desirability of the housing unit as a dwelling place [
15,
21]. In addition, Herbert and Belsky [
21] argued that as a social construct, a neighborhood is a primary determinant of youths’ perceived opportunity structure; that is, the neighborhood’s social environment shapes the youths’ employment opportunities, exposure to crime and other anti-social behaviors, such as the potential for teen age pregnancy.
Several researchers, such as Boehm and Scholottman [
22]; Barker and Miller [
23]; Cairney [
24] and Crane [
25] provide empirical evidence of the validity of the perceived opportunity structure concept. For example, Barker and Miller [
23] observed that a teenager’s chances of becoming pregnant were higher in impoverished neighborhoods than in middle class or upper class neighborhoods. Crane [
25] noted that living in poor neighborhoods has a significant influence on the school drop-out rate of black males while Cairney [
24] observed dramatic and positive changes in the children of low income families that were relocated from central cities to the suburbs. In addition to perceived opportunity structure, Shlay [
26] argued that residential location determines the access to several goods and services relative to employment opportunities, educational facilities, medical care, and child care.
The characteristics of the neighborhoods that may affect the value of a housing unit and its desirability include public safety issues such as crime, the physical and social characteristics of the neighborhood, and the availability and the quality of city services [
2]. Safety or freedom from crime whether perceived or real is an important element in an individual’s choice of a place of primary residence. Unfortunately poverty neighborhoods are characterized by high crime rates, decaying infrastructures, poor public transportation systems, low quality public school systems, acute health problems, and abandoned and dilapidated housing units. These observations suggest that a housing unit located in a low-income community or neighborhoods are predisposed to several problems. Westaway [
6] emphasized that the concentration of the poor increases the per capita cost of providing public services, involving police and fire protection, and public education.
According to Hur and Morrow-Jones [
27], satisfaction is defined as the evaluation of features of the physical and social characteristics relative to the neighborhood environment. The contention being that a high level of satisfaction increases households’ sense of attachment to community and, therefore, serves as an important determinant of mobility plans. Past research (Marans and Rodgers [
28]; Marans and Spreckelmeyer [
29]) noted that the relationship between neighborhood satisfaction, decision to move, and quality of life is a sequential process.
Hipp (2009) [
28] study investigated homeowners’ perception of previous residence and their current Habitat homes in order to identify the differences (if any) in their physical living conditions in their Habitat homes as compared to their previous living arrangements. The intent of this set of questions was to gain an understanding of the level of satisfaction that the homeowners derive from Habitat homes particularly when compared to their previous residence. The attributes explored included housing and construction type, number of bedrooms and bathrooms, adequacy of space, and condition and quality of their homes.
In a similar study, Shlay [
26] sampled respondents were asked a set of questions about the attributes of their previous neighborhoods and their current Habitat neighborhoods. These attributes of the neighborhoods covered include physical characteristics, perceived safety/crime levels, racial/ethnic character of the neighborhoods, access to public services and employment opportunities. The intent is to investigate the level of homeowners’ satisfaction not just with their Habitat homes but also with the neighborhoods where the homes are located. More than 80% of the households interviewed (77 respondents) had changed neighborhoods to become Habitat homeowners and the average distance that a homeowner moved was between one and five miles.
10. Results
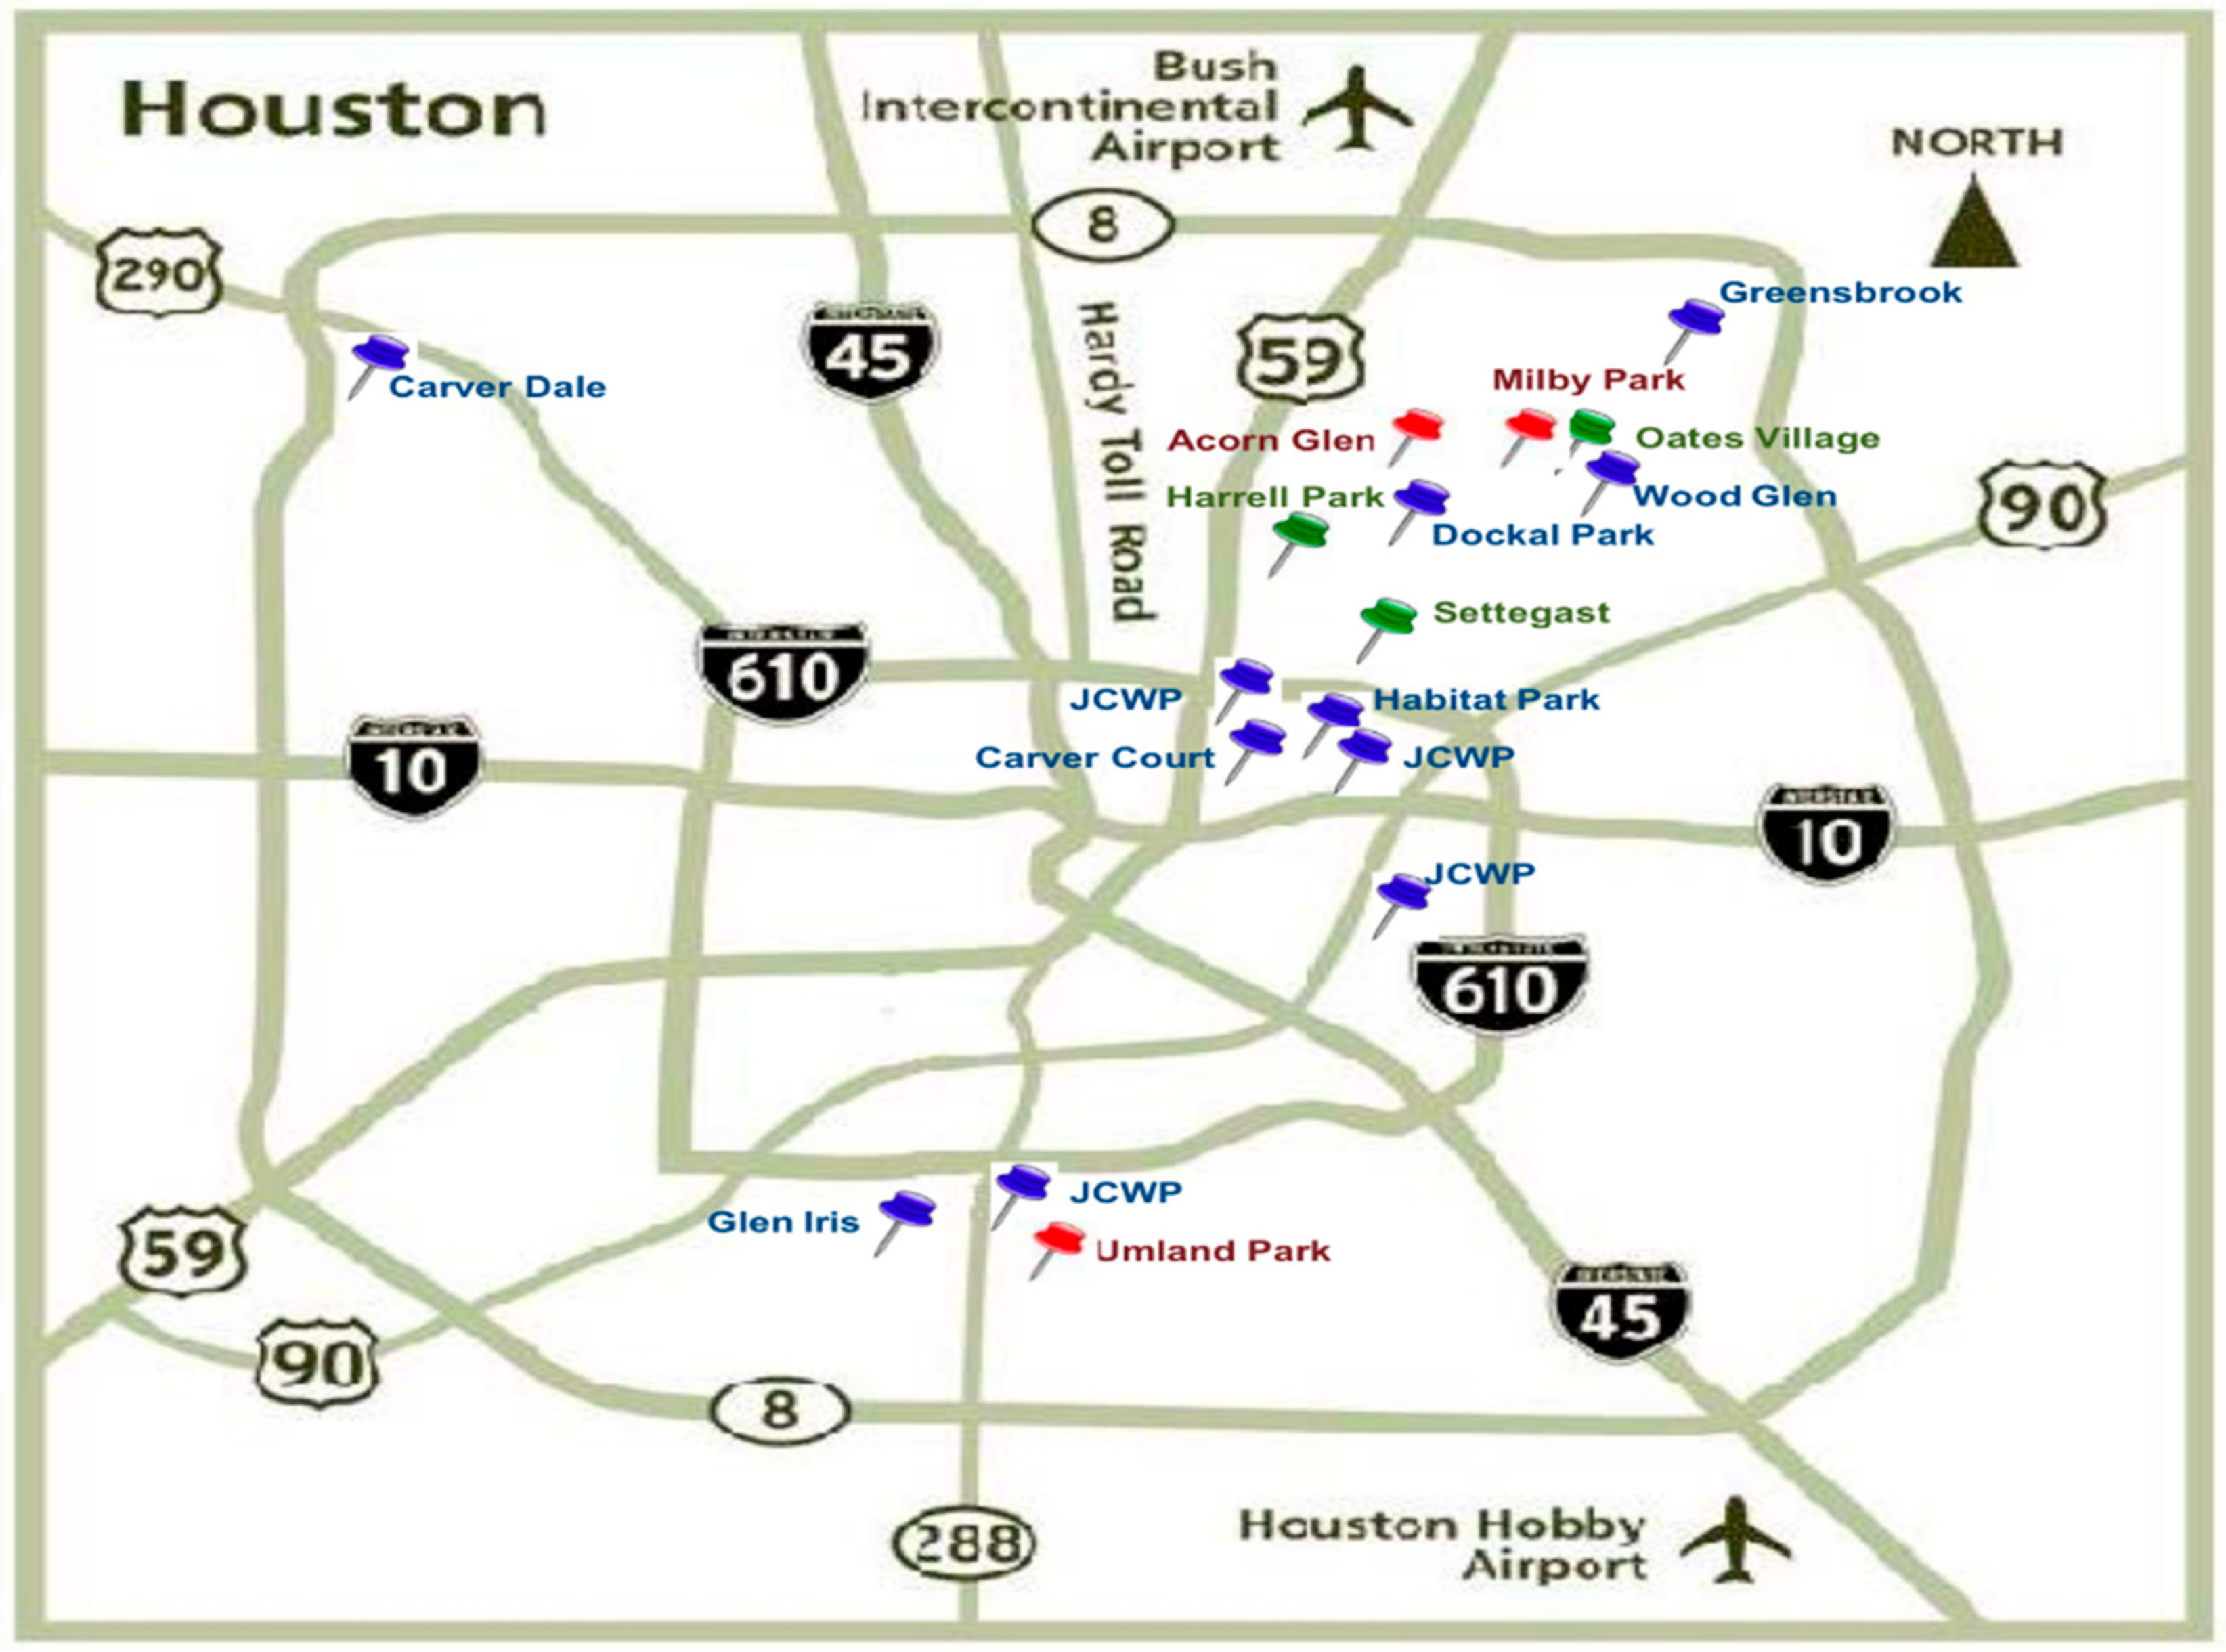
Houston Habitat has been instrumental in providing low-income individuals with affordable housing. Houston Habitat records have expressed what is known as neighborhoods and or clusters. The four particular neighborhoods used in this study: Umland Park, Wood Glen, Greensbrook, and Glen Iris.
Table 1 indicates the number of beneficiaries that were surveyed from each specific neighborhood.
Table 2 shows the ANOVA test for a linear, quadratic, and cubic trend. The between groups test indicates that there is no difference among means across the Habitat neighborhoods with a
p-value more than 0.05. The linear term weighted test is a test that there is not a linear trend with a
p-value of 0.183. Its deviation tests for the existence of less complex trend with a
p-value of 0.563 which indicates that there is a less complex trend than linear. Regarding the quadratic term weighted test, there is not a significant quadratic trend with a
p-value of 0.638. Its deviation indicates that there is still existence of less complex trend with a
p-value of 0.333. The cubic term weighted indicates less complex trend with a
p-value of 0.337. The results of this analysis suggest that there is not a linear increase in the mean neighborhood quality as we change Habitat neighborhoods.
Table 3 highlights total household income of the beneficiaries of Houston Habitat. The annual household income averaged approximately
$25,500, which is considered low income. Roughly, 30% are earning less than
$30,000.
Out of the homeowners surveyed, 36.2% are single and 39.1% are married; separated, divorced, and widowed weighed lightly as compared to single and married. About 55% are single-parent, and 49.2% are female headed households. In regards to their children 10 years or younger, most of the households have none (47.8%), whereas, some of the households did have 1 child or more (52.1%) living in the home. See
Table 4 for these results.
Regarding the highest education level attained by the respondents, 43% had no schooling, 29% completed high school or had GED, 17.4% have trade/vocational school diploma, 29% had some college or associate degree, 17.4% of the respondents completed college while 2.9% had a graduate degree. Almost 77% of the respondents are females while most (95.6%) are ethnic minorities—Hispanic or African Americans. About 61% are employed full-time; 8.7% are employed part time; 11.6% of the respondents are retired while 13% are currently unemployed but seeking employment (
Table 5).
Table 5 also reveals that overall 49.2% of the respondents are female-headed and 55.4% are single parent households. The highest level of education of the respondents is associate degree or less (86.7%); most are ethnic minorities (95.6%), that is, Hispanics or African Americans while the household income is
$30,000 or less (71.7%).
In taking this analysis a step further in order to establish a more descriptive profile of those benefiting from Houston Habitat homeownership programs, a cross tabulation was run. Habitat is servicing one-parent households that are headed by females (94.2%). These homes headed by females are African American (53.5%), who are low income only making $10,000 to $20,000 annually (68.2%). These females age range from 30 to 49 (50.0%) who work full time (68.8%) and have had some vocational training (18.8%) as well as some college or an Associate’s degree (21.9%).
11. Perceptions of the Quality of the Respondents Previous and Habitat Neighborhood and the Quality of City Services Provided
The perceptions of respondents regarding the quality of their previous and Habitat neighborhood in regards to crime are depicted in
Table 6, which shows that home burglary occurred sometimes in both neighborhoods. As the respondents viewed neighborhood quality, other factors, such as car theft, graffiti, domestic violence, and gun shots just to name a few, did not occur at all in both neighborhoods. The perceptions of respondents regarding the quality of their previous and Habitat neighborhood in regards to physical activity are depicted in
Table 7. There was a difference between stray animals and unkempt yards. Respondents reported that there were stray animals sometimes in their previous neighborhood (36.7%) and often (37.9%) in their Habitat neighborhood. In regards to unkempt yards in the previous neighborhood, the occurrence not at all ranked 37.1%. Respondents indicated that this occurred sometimes (47.5%) in their Habitat neighborhood. As the respondents viewed neighborhood quality, other factors such as loitering, street flooding, and homelessness did not occur at all in both neighborhoods.
The respondents’ perceptions of quality of city services in their previous neighborhood and their Habitat neighborhood are depicted in
Table 8. There were only differences between police patrol and public schools-safety in schools. Police patrol in the previous neighborhood was ranked fair and was very poor/poor in their Habitat neighborhood at 40.0% and 43.3%, respectively. In regards to public schools-safety in schools, their previous neighborhood was good/excellent (42.9%) but their Habitat neighborhood it was fair (40.8%). The respondents viewed city services such as street lighting, trash pick-up, street drainage, removal of tall weeds, and city park safety just to name a few was viewed as good/excellent in both neighborhoods. These results indicate that city services have been a positive aspect in both neighborhoods and that the City of Houston is not discriminating on where one lives, they are still doing a job regardless of if it is a neighborhood or an apartment complex. When it comes to the overall satisfaction of the previous neighborhood and the Habitat neighborhood,
Table 9 shows the respondents are more satisfied with their Habitat neighborhood.
In conducting a paired sample
t-test of the neighborhoods the results, therefore, indicate that there is no difference between the previous neighborhood and the Habitat neighborhood, because the
p-value for the equal variances
t-test is
p = 0.803 and the
p-value is more than 0.05. One neighborhood is not greater than the other, but these homeowners wanted to have something that they could call their own. Most (78.8%) of the respondents were renters before becoming homeowners. The facts in
Table 10 indicate where the respondents lived before becoming homeowners. The study further indicates that a friend or a family member referred the homeowners for homeownership to Houston Habitat. Moreover,
Table 11 summarizes how the respondents learned about Houston Habitat for Humanity.
12. Perceptions of Benefits and Challenges of Homeownership
Table 12 shows the perceived benefits as “something to call your own” at 71.0%, privacy at 44.9%, transferring wealth to children at 40.6%, flexibility to make changes to the home at 40.6%, the choice of staying in one place or moving at 39.1%, equity build up at 37.7%, more space at 36.2%, freedom from intrusion by landlords at 26.1%, and tax write off at 15.9%. The results indicate that these perceived benefits are important to the beneficiaries of Houston Habitat and are very important aspects to being a homeowner.
As the respondents indicated, flexibility to make changes to the home was a benefit of homeownership, and the respondents were asked if they made home improvements to their home. If they did, what were the improvements and how was this project (home improvement) funded.
Table 13 depicts that home improvements were made and the top three home improvements were purchasing furniture at 37.0%, other (doors; windows) at 30.4%, and painting at 21.7%.
Table 14 depicts how these projects were funded. Most (47.8%) of the respondents used their employment check to pay for their home improvements made to their Habitat home. In conducting a cross tabulation between flexibility to make changes to the home and home improvements, there is a correlation between the two, meaning that the respondents do agree that making changes to the home does consist of various home improvement projects.
As the respondents mentioned equity build-up as a benefit of homeownership, a question was asked, what “sweat equity” contributions were made by the respondent in the process of building your Habitat home? Habitat homeowners have to contribute 300 “sweat equity” hours as a requirement before moving into their Habitat home.
Table 15 depicts that “sweat equity” contributions made by the respondents. The top three that was made by the respondents were work/landscaping at 62.3%, debris removal/clean-up at 56.5%, and roofing at 50.7%. In fact, there was a negative correlation between equity build-up and “sweat equity” contributions. This negative correlation existed between interior painting-sweat equity contribution and equity build-up (r = −0.120 and −0.990 respectively), dry-walling-sweat equity contribution and equity build-up (r = −0.065 and −0.532 respectively), and yard work/landscaping (r = −0.013 and −0.103 respectively). The respondents do not consider the “sweat equity” contributions as equity build-up, but what they do consider as equity build-up is the money invested in their Habitat home.
The perceived challenges of homeownership are depicted in
Table 16. Being responsible for all maintenance was considered the most challenging at 71.0%, followed by increased monthly expenses at 33.3%, risk of foreclosure at 24.6%, possibility of loss, if sold in a down market at 23.2%, down payment and closing costs at 11.6%, and risk of bankruptcy at 11.6%.
13. Discussion
The data from the survey responses proved that most of the respondents responded from Umland Park (37.7%) and Wood Glen (31.9%). These two neighborhoods were developed more recently. The Greensbrook neighborhood was completed in 2007 and the Glen Iris neighborhood was completed in 2006. Based on the study, it can be concluded that the response rate was higher on the two newer neighborhoods because the homeowners are still excited about being new homeowners and living the “American Dream.”
Overall, 49.2% of the respondents are female-headed and 55.4% are single parent households. An important finding of this study is that the beneficiaries have relatively low levels of education. The highest level of education of 86.7% of the respondents is an associate degree or less, most (95.6%) are ethnic minorities, that is, Hispanics or African Americans while the household income of 71.7% of the respondents is
$30,000 or less. These results, therefore, indicate that the beneficiaries of Houston Habitat homeownership program are indeed predominantly low income, ethnic minorities. Moreover, these findings are consistent with those of Hayes [
7], DiPasquale and Glaeser [
12], and Boeh and Scholottman [
22]. The aforementioned researchers reported that homeownership programs are instrumental in aiding ethnic minorities and low income individuals in purchasing a home.
Another important finding is the high number of one-parent households that are headed by females (94.2%). They are not servicing the traditional family household of two parents as suggested by Coulson (2002) and Hipp (2009). These homes are headed by females that are mostly African Americans (53.5%) who are low income, making $10,000 to $20,000 annually (68.2%). These females age range from 30 to 49 (50.0%) who work full time (68.8%), and they have had some vocational training (18.8%) as well as some college or an Associate’s degree (21.9%).
The results of the survey data indicate that the beneficiaries’ previous neighborhoods are as follows: 36.2% were not at all satisfied/not satisfied with their previous neighborhood, 21.7% was somewhat satisfied, and 30.4% were satisfied/very satisfied. The results in regards to their Habitat neighborhood were; 17.3% were not at all satisfied/not satisfied with their Habitat neighborhood, 29% was somewhat satisfied, and 53.6% were satisfied/very satisfied. These findings are supported by Basolo and Strong [
32], Shlay [
26], and Coulson [
10]. The results of the research conducted by the above researchers revealed that the beneficiaries of homeownership programs are more satisfied with the quality of their Habitat neighborhood than their previous neighborhood.
Another study objective indicates that the beneficiaries of Houston Habitat homeownership program have perceptions of the benefits and challenges of homeownership. The results of the survey data indicated that the beneficiaries perceive these to be benefits of homeownership which are: “something to call your own,” privacy, transferring wealth to children, flexibility to make changes to the home, the choice of staying in one place or moving, equity build up, provides more space, freedom from intrusion by landlords, and tax write off. These findings are consistent with Colton [
8], Harkness and Newman [
9] but not with those of Kearney [
2] and Barker and Miller [
23].
The beneficiaries of Houston Habitat perceive these as challenges of homeownership and they are: being responsible for all maintenance, increased monthly expenses, risk of foreclosure, possibility of loss, if sold in a down market, down payment and closing costs, and risk of bankruptcy. The results show that the beneficiaries feel that the benefits and challenges are equally important when owning a home. All of these findings, with the exception of down payment and closing costs parallel those of Morrow-Jones, Wenning and Li [
3] and Hur, Nasar and Chun [
27]. Herbert and Belsky [
21] and Boehn and Scholottman [
22] concur that both down payment and closing costs are benefits to homeownership. A disadvantage surprisingly mentioned by some homebuyers—especially those living in scattered houses as opposed to clusters of Habitat homes—was the perception that they had moved into a less safe neighborhood. This finding did not correspond with those of Westaway [
6], Rohe and Basolo [
19], Hayes [
7], and Hipp [
28]. These researchers contend that homebuyers with assistance programs feel safer with their new home as opposed to their previous neighborhood.
14. Conclusions
There continues to be a need to build a mechanism that will provide a greater sense of well-being in low income housing and programs since Habitat for Humanity International’s primary objective is to provide low-income individuals with simple, decent, and affordable shelter [
26]. The current process of how Houston Habitat for humanity builds affordable homes, provides homeownership for low-income, and programs to help the beneficiaries sustain homeownership seems to be part of the cure, but there is still more that can be done. Houston Habitat has worked on eliminating some of the obstacles that make homeownership difficult, especially in low-income households. Houston Habitat training the homeowners through special classes before moving into their home and through ‘sweat equity’ participation in housing construction-has somewhat prepared the beneficiaries for homeownership. Houston Habitat has been successful or the key to their ongoing success is their assistance and loan repayment flexibility offered to the beneficiaries over time. Habitat programs have been structured to nurture families and to help them break the poverty cycle—not just to provide affordable housing [
7].
In summation, most of the beneficiaries are satisfied with their Habitat home as well as their Habitat neighborhood. If the beneficiaries had to repeat the process all over again, they would purchase a Habitat home once more. The only challenge for Houston Habitat and their existing programs that offer homeownership to low-income families in the future, will need to continue to deliver affordable housing that they have provided in the past, and to continue preparing their beneficiaries for and assisting them with the ongoing responsibilities of homeownership.
15. Recommendation
In view of the minimal level of knowledge of the beneficiaries valuing homeownership, it is highly recommended that homeownership counseling is offered within six months to a year of the beneficiary being in the home. Almost all (75.4%) of the respondents indicated that they have not had homeownership counseling after being in their Habitat home.
Table 17 depicts the importance of homeownership counseling before and after the home purchase. Homeownership counseling should emphasize the importance of keeping their home, not missing mortgage payments, and not going into foreclosure. In addition, Houston Habitat might consider partnering with HUD and local mortgage companies to increase awareness of valuing homeownership through counseling and workshops.
The evidence of this study has proved to be valuable quantitative data regarding low-income residents’ experience with and perceptions of homeownership. It is strongly recommended to conduct in-person interviews with the beneficiaries, focus groups, and going door to door to achieve ‘real stories’ that can be used to understand the perceived and actual benefits and challenges of homeownership for low-income Houston Habitat program participants. By taking this approach, this will make the quantitative data and analysis more of an in depth study, since a systematic random sampling technique was used to create a response rate of 50%.
Habitat for Humanity International affiliates have previously obtained rehabilitated homes occupied by Habitat. The beneficiaries may not have any maintenance and or repairs, increase in housing costs, and may be placed in scattered areas of a subdivision due to land being less expensive and easy to acquire. Thus, it is recommended that Habitat for Humanity International affiliates initiate home building in clusters or subdivisions. According to AREA [
4], Habitat homeowners who express the greatest satisfaction with their neighborhoods are those living in clusters or subdivisions of Habitat homes, even when the clusters/subdivisions are surrounded by fairly deteriorated neighborhoods.


