
Analysis of Profiles of Family Educational Situations during COVID-19 Lockdown in the Valencian Community (Spain)


Evaluation and Measurement Group (GemEduco): Education for Social Cohesion, included in the Register of Research Groups of the University of Valencia (GIUV2016-290), 46010 Valencia, Spain
*
Author to whom correspondence should be addressed.
Societies 2023, 13(1), 10; https://doi.org/10.3390/soc13010010
Submission received: 14 November 2022
/
Revised: 24 December 2022
/
Accepted: 27 December 2022
/
Published: 30 December 2022
(This article belongs to the Special Issue Inclusion and Equity Education Policy during Epidemic: Actions through Active Methodologies, Technologies and Audiovisual Media)
Abstract
:Due to the pandemic (COVID-19), the education system in Spain was forced to close for three months, creating an unprecedented situation: improvised distance schooling. Family characteristics and their life situations with Information and Communication Technology use would be aspects to be studied as educational conditioning factors. This paper presents the ways in which a representative sample of families in the Valencian Community (Spain) assumed the education of their children during the lockdown. Mixed methods (quantitative -surveys-/qualitative -focus groups-) are used. Multivariate profiles are studied (k-means cluster) that summarise the life circumstances, represented by composite indicators resulting from the families’ responses to specific items describing their way of life and educational performance. Associated variables, such as demographic or life situation characteristics, are analyzed for each profile. Some gaps (described by indicators that synthesize the functioning of the families) are observed due to life circumstances that correspond not only to vulnerable groups but also to upper-middle-level families.
Keywords:
COVID-19; school at home; inequality gaps; teaching methodology; family participation; ICT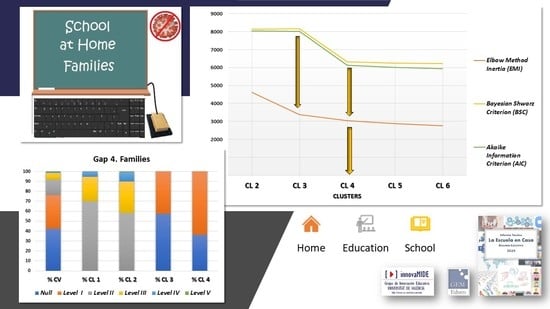
1. Introduction
The COVID-19 pandemic has created the largest disruption of education systems in human history by affecting nearly 1.6 billion learners in more than 200 countries. Closures of schools, institutions, and other learning spaces have impacted more than 94% of the world’s student population. This has brought far-reaching changes in all aspects of our lives [1].
As a result of the COVID-19 pandemic, in Spain, the entire population was locked down in a “state of alarm” from March 14 to 21 June 2020 [2]. This affected the entire educational system. Schooling was transferred to homes and supervised by families, with support from schools.
Because of this, the lockdown created a unique situation in which to analyze the possibilities of school care from home and its impact in situations of vulnerability. Previously, studies had been carried out on the effect of withdrawing from school (during vacations) on groups of diverse Socio-Economic and Cultural Status (ESCS, by OECD glossary of statistical terms), such as those of [3,4,5,6]. However, this situation was unprecedented because, in this case, the risk factors for social exclusion were very diverse [7,8]: not only could those living in disadvantaged families with a low ESCS be vulnerable, but there could be other related factors like type of family, type of house where they live, family members’ occupational status, material resources for using Information and Communication Technology (ICT), knowledge of employing these resources for cultural and educational uses, emotional status during the lockdown, etc.
Moreover, in an extreme situation of family isolation in which teachers would necessarily have to perform their work remotely, several inequality situations could arise. In some cases, they could affect their family circumstances. Other cases could affect the ICT proficiency of families because they had to suddenly play an active and collaborative role with teachers to attend to their children’s education. Finally, they could be a consequence of the characteristics and circumstances of the teachers, which we analyze in [7,9,10].
This unprecedented situation was a key moment to analyze what associated factors, and the resulting inequalities, could occur in society when schools were unable to operate on a face–to–face basis.
Our research group, GemEduco 1, analyzed this situation in the School at Home (SH) study. The initial descriptive study can be consulted in [11].
In addition to the aforementioned study, others have been carried out in both Spain and elsewhere. Most of them [12,13] have aimed to study the impact of lockdowns. Other studies [1,14,15] have assessed the difficulties that teachers and families encountered in adapting teaching to the needs of students and their families.
Depending on their circumstances, families also had to adapt the way that they could support their children in SH. A necessary contextual aspect to understand the framework in which the study was conducted is that the type of lockdown decreed in Spain was almost absolute (see characteristics in Table 1).
This situation led us to consider that inequalities, as we have pointed out, could be associated with many situations and not only with belonging to a disadvantaged group. Therefore, it was a priority to identify possible gaps that could affect personal and family well-being and, consequently, the development of the SH study.
This work presents an exploratory analysis of the differential profiles that could be established from the identified inequalities and their link with the associated variables (see Methodology section), carried out with families, that help to understand school functioning in SH. Previous studies have presented the aforementioned report of the global study, the global consequences for education due to the pandemic [16], and a specific study of the learning ecologies [9] that teachers implemented from home, along with the differential variables that affected families linked to the levels of education their children were attending [17]. It is a question of understanding how education occurred in the situation of confinement, the importance of family circumstances (type of housing, work situation, number of children…), and how families value the role of education at this period.
2. Goals
This article analyses the multivariate profiles of the contexts of families with children as pupils in Early Childhood Education (ECE), Primary Education (PE), and Compulsory Secondary Education (CSE) 2 in the Valencian Community (VC) of Spain.
The general objective is to record the perception and circumstances of families who participated in developing SH (with challenges, difficulties, and achievements of SH) by taking into account the diversity of the educational and family situations that could exist during the lockdown.
The specific objectives of this study are:
- To identify the most appropriate solution for the number of household profiles described in terms of the composite indicators.
- To describe each of the profiles belonging to the cluster typology in terms of the composite indicators and their association with demographic and other external variables.
- To collect information based on focus groups in order to have a complementary qualitative approach that helps us to confirm and expand, if necessary, the quantitative results.
3. Materials and Methods
3.1. Design
3.2. Participants
In Spain, on the whole, 3758 valid family surveys were collected that reported about 5539 students. In all the groups, between 70% and 80% of the cases were from the Valencian Community. This article focuses only on family samples from this geographic area 3.
According to the Continuous Household Survey carried out by the Spanish National Statistics Institute [21], the total number of households (family units of any type) with children living in the Valencian Community comes to 1,481,400. This study worked with 2905 refined and validated surveys, which reported about 4197 students. Therefore, this sample is statistically representative and has a confidence level of 99%, a confidence interval of <3%, and a percentage of 50%. The global representativeness of the student sample (N = 4197) takes 696,587 cases as a population reference (Consejo Escolar de la Comunidad Valenciana —CECV—, 2020; pp. 32–34) and has a significant level of 99%, a confidence interval of ≤2% and a percentage of 50%. According to the type of education center, 61.3% attended public centers 4, and 38.7% attended subsidized/private ones. For the levels of education at which the students being informed about learned, the proportional sample distribution was: ECE (21.4%), PE (52.3%), and CSE (26.3%).
Despite the fact that, for a number of total cases, samples were statistically significant, when using Snowball Sampling, we were unable to ensure the sample’s representativeness in relation to randomness and stratification 5. In addition, we must bear in mind that each family answered about the number of children it deemed appropriate (from one to three), so there was no proper student sample. For this reason, attention was paid to analyze sample composition according to indicators, which helped us to describe its characteristics and the diversity of the collected cases. For this purpose, we used the Gini coefficient [22].
The family’s sample adequately represents groups from medium-low to medium-high levels of ESCS from the Valencian Community, in addition to being quite homogeneous (Gini = 0.235). The characteristics of the people who completed the surveys are found in Figure 1.
In the qualitative approach, we were able to work with the following two focus groups of participants: formed by families, represented by mothers (average age = 31), with children in ECE (n = 7) and in PE (n = 6), total n = 13.
3.3. Data Gathering: Variables, Indicators, and Instruments
During the lockdown, Snowball Sampling was carried out [23] by means of social networks to administer surveys to families (the data collected in each one is synthesized in Table 2).
The survey asked 25 general questions about the family situation, and a series of 13 questions about each child’s specific situation. It was possible to answer for up to three children if the family deemed it necessary to differentiate them. At the end, the survey included an open question for suggestions and comments.
These surveys were administered between April and June 2020 via two online surveys, using Lime Survey, with computer/tablet and smartphone dissemination formats. The complete surveys can be consulted in [11] (pp. 184–220).
In the families’ survey, we were aware of an initial limitation: direct information about the most vulnerable groups would be lacking. These families cannot be reached by online procedures.
Considering our previous experience in other socio-educational evaluative studies [24,25], we included a qualitative approach to better understand the results observed in the survey and to identify any signs that had not been detected by the quantitative study. For this reason, we collected data from focus groups with families representing social and educational diversity and families representing different economic and cultural levels.
Each focus group session lasted between one and a half and two hours. The debate was structured according to the survey inquiry dimensions by fostering participation flexibly so that any matters that the participants considered the most relevant could emerge. The focus groups held were structured around the questions that are presented in Table 3.
3.4. Procedure
The phases that this study was conducted in are found in Table 4. Thus, in designing the survey, we ensured at least content validity in accordance with the objectives of the study, the technical quality of the items, and an online format that would facilitate its application. The initial study was conducted between April and early July 2020 and focused on collecting quantitative data during the lockdown. Continued, as everything else is also in the past tense, to conduct secondary studies to deepen the lines of research derived from the initial results published in [11].
Phase VII refers to the qualitative focus group study, which was conducted after the questionnaire-based study, and the participants were contacted by teachers from schools serving vulnerable groups. They were integrated into the groups according to their availability. The work was carried out in the facilities of the University of Valencia. The duration of each group was between 1.5 and 2 h.
The initial SH study provided the descriptive-exploratory results of the survey held with families. The preparation of compound indicators, conceived as different gaps, allowed groups of families with different facilitating or hindering situations to be identified to deal with SH.
The central point in this exploratory study is the “Compound Indicators of Gaps about SH.” These indicators are the result of jointly considering several items that describe the situation of families regarding different aspects, as shown in Table 5.
3.5. Data Analysis
In order to work toward the research objectives, an exploratory study was carried out using the k-means cluster analysis. In our case, the variables with which we studied the profiles were Compound Indicators of Gaps about SH, which were analyzed using Euclidean distance following the iteration and classification procedure. We studied different classification solutions and chose the most representative one for each group.
The usual problem when exploring groups of people by the k-means cluster analysis procedure is selecting the most suitable number of groups. The selection of criteria to determine the appropriate number of clusters is still a subject of study [26,27,28,29]. We have selected these criteria: (a) minimum intragroup variability; (b) statistically significant differences in the centroids of the identified groups; (c) no residual groups of subjects existing (in our case, we interpret a residual if the number of cases for a group is below 5% of all analyzed cases); (d) parsimony; i.e., the most suitable solution is that which, by meeting the previous criteria, identifies fewer groups; (d) as a verification element of (a) and (d) concurring, we employed Elbow Method-Inertia (EMI), which helped us to identify the classification more efficiently [30].
In addition, before selecting the cluster solution, we analyzed the groups by randomizing the case sample to check if the same solutions would be obtained. As an additional validation element for identifying the most efficient solution, the existing relationship between the Bayesian Shwarz Criterion (BSC) and the Akaike Information Criterion (AIC) 6 was analyzed with EMI. All these classification indicators are efficient [31].
After selecting the most representative solution, the established groups were characterized by gaps according to their demographic characteristics and their perceptions of how SH worked (the variables measured in the questionnaires). To do so, we used nonparametric tests (Mann-Whitney U, Kruskal-Wallis H) depending on the type of variables, and the Chi-square test and/or the likelihood ratio as association measures whenever the cell distribution criterion that was assumed could not meet this test 7.
For the qualitative study, with the focus group transcriptions, the recommendations proposed by several authors were followed to analyze the collected data [32,33]. A three-step sequence was established: (1) breaking down into content units; (2) identifying and classifying elements; (3) synthesis and clustering.
Each transcription was analyzed by two different judges to ensure the reliability and validity of the obtained data by checking if the semantic categories coincided. In the event of a discrepancy, they were analyzed and a consensus was reached. A mixed categorizing process was followed, according to which the judges based themselves on a deductive procedure. During this procedure, semantic units were assigned to the categories that derived from the quantitative questionnaire and also to an inductive procedure followed by reading the material without considering present categories. Categories were added if the initial ones were not believed to suffice.
Following the method of [34], a first “decontextualization” step was conducted by separating relevant portions from the context they were found in. Next, “recontextualization” was performed by grouping data into codes of similar meanings.
With the analyses done by the two judges and having classified responses, common and differentiating aspects of the intra- and interfocus groups were synthesized in such a way that we were able to approach the common situations in both groups, as well as the differences between not only participants but also focus groups. This conferred us richer details than in the questionnaire responses, although we sometimes found that they resembled the responses in the questionnaires.
4. Results
4.1. Characteristics of Participant Families
We analyzed the degree of inequality of the families’ sample by the Gini coefficient. The result is 0.235, which also indicates quite a homogeneous group made up basically of families from medium-low to medium-high ESCS levels, and very few families have a very high ESCS, while more have a very low ESCS level [11].
As for the gaps profile of the families that participated in this study (see graphs Gap 1 to Gap 4 in Figure 2), we highlight the following characteristics [11] (pp. 102):
- (a)
- Gap 1 (squared meters (m2) per capita of home/categorized). In the Valencian Community (Spain), legal references for home sizes are available [11] (pp. 222–224), and the most frequent situation is living in flats of about 90 m2 (dining room, kitchen, two bathrooms/WC, three or four bedrooms). By taking both references, we estimate three situations as a ratio of a home’s m2 in relation to the number of home dwellers, and we obtain the following from the surveyed families in the Valencian Community: satisfactory with 56%, adequate with 29.1% and insufficient with 14.9%.
- (b)
- Gap 2 (digital gap because of having only a few ICT resources to teach from home) refers to not having a suitable Internet connection (and/or Wi-Fi) and/or not having adequate computers and/or tablets and/or not having a smartphone with an adequate amount of data. Of the surveyed families in the Valencian Community, 70.41% present no digital gap, 16.7% have a level I gap, 11.6% have levels between II and III, and 1.3% are between levels IV and V.
- (c)
- Gap 3 (digital gap due to lack of mothers’/fathers’ ICT knowledge to support SH). This refers to self-perceived knowledge that families believe they possess to perform this task. Of those surveyed in the Valencian Community, 95.1% state feeling capable of meeting the demands they face, while 4.4% have difficulties at the level I and 0.5% at level II.
- (d)
- Gap 4 (cohabitation gap at home). This refers to the problems that arise in the relationships between the family members who shared confinement, perhaps because of lack of space, incompatible timetables to perform activities, lack of support to maintain their home, family types (single parents, children studying in different school years) and/or having illnesses. Of those who completed the survey, their distribution levels are Null (42.4%), level I (33.8%), II (15.9%), III (6.3%), IV (1.4%), and V (0.1%).
Figure 2.
Graphs of decision criteria of an efficient cluster solution.

4.2. Profiles of the Obstacles (Gaps) That Families Came across for Performing SH
We analyzed the five classification solutions by k-means cluster analysis from two to six groups. The five analyzed solutions comply with the significant differences criterion between cluster centroids (p ≤ 0.0001 in all cases). All the criteria pointed out in the methodology comply with the 4-cluster solution. As two residual cluster groups appeared in the 5- and 6-cluster solutions (n < 5%), both these solutions were ruled out.
As previously mentioned, we sought the most efficient solution. Figure 3 depicts two solutions, namely the 3- and 4-cluster solutions. When considering the three evaluation procedures followed for intragroup variability (EMI, BSC, AIC), an equal change pattern does not appear in the three, but a marked parallelism is seen. The intraclass correlation coefficient among the three levels is 0.947, and the bivariate correlation coefficients (Pearson) are, respectively, EMI-BSC (0.802), EMI-AIC (0.814), and BSC-AIC (0.999). They are not significant in the first two cases (p = 0.103 and p = 0.093, respectively), but the third is significant (p ≤ 0.0001). The parallelism between the BSC and AIC criteria is practically perfect, while that between them and EMI is high but imperfect. The sharp drop in the variability in the first two occurs in the 4-cluster solution, while the inflection in EMI takes place in the 3-cluster solution. We also see that the reduction in the intragroup variability in EMI is substantial.
We also analyzed which differences in assigning cases would appear between the 3- and 4-cluster solutions and the resulting grouping characteristics in the 4-cluster solution. The distribution of percentages and the number of cases in each cluster solution are as follows: 3-cluster solution with CL1: 19.41% (n = 563); CL2: 11.34% (n = 329); CL3: 69.25% (n = 2009); a 4-cluster solution with CL1: 17.89% (n = 519); CL2: 5.86% (n = 170); CL3: 69.25% (n = 2009); CL4: 7% (n = 203). As we see, in both these solutions, CL3 remains equal, is more numerous, and maintains exactly the same cases. In the 4-cluster solution, CL2 has 25.9% of the cases from CL1 and 74.1% from CL2. The association between belonging to clusters is significant (Chi-square, p ≤ 0.000). The CL2 of the 4-cluster solution allows two groups to be differentiated with a high gap incidence that better details difficulties. By considering the performance of the efficiency criteria and the detected casuistry typology, the 4-cluster solution comes over as the most representative solution.
The four clusters present profiles whose centroids are statistically different (ANOVA/F, p ≤ 0.0001). The following characteristics of the profile of the gap in this 4-clusters solution are (Figure 3, Figure 4 and Figure 5):
- (a)
- CL1 presents favorable conditions in Gap 1 (space at home; 78.1% between adequate and satisfactory); in Gap 2 (ICT resources available at home), 70.5% do not have this problem, and 29.5% do at level I; in Gap 3 (knowledge of using ICT resources), these difficulties are not found (93.8%) and only 5.2% state having them at the level I; in Gap 4 (cohabitation problems), problems appear (level II: 70.1%; level III: 24.7%; level IV: 4.8%; level V: 0.4%).
- (b)
- CL2 also presents favorable space conditions, but percentages are lower than in the other clusters (64.7% lie between insufficient and adequate); Gap 2 indicates mainly problems (level II: 57.6%; level III: 27.6%; level 4: 13.5%; level V: 1.2%); Gap 3 is the group with the most difficulties for self-perceived ICT knowledge (Null: 85.3%; level I: 12.4%; level II: 2.4%); Gap 4 has cohabitation problems to a greater extent than CL1 (level II: 58.2%; level III: 31.8%; level 4: 9.4%; level V: 0.6%).
- (c)
- CL3 shows a good situation in Gap 1 (between adequate and satisfactory with 88.3%); in Gap 2, only 16.5% of its components are at a level I for lack of ICT resources, and 83.5% is Null; in Gap 3, families self-perceive they have more knowledge of ICT resources (Null: 96.8%; level I: 3.1%; level II: 0.1%); Gap 4 (cohabitation) presents fewer difficulties (Null: 57.6%; Level I: 42.4%).
- (d)
- Finally, for CL4, Gap 1 lies between adequate and satisfactory with 80.3%; Gap 2 has the fewest ICT resources (Level II: 68%; Level III: 25.1%; Level IV: 6.4%; Level V: 0.5%); despite Gap 3 being identified mainly with having enough knowledge about ICT uses to face SH (Null: 90.1%), it shows that more families face such problems (Level I: 8.9%; Level II: 1%); in Gap 4 (cohabitation) there are no (Null: 36.5%) or only a few difficulties (Level I: 63.5%).
Figure 4.
Gap profiles for four groups per k-means cluster.

Figure 5.
Percentage distribution of each gap in the 4-group cluster solution compared to the total of the VC.
Figure 5.
Percentage distribution of each gap in the 4-group cluster solution compared to the total of the VC.

4.2.1. Variables Associated with the Profiles Identified in the Group of Families
We now go on to present reflections on the variables associated with this typology of families. As we point out in the Materials and Methods section, we have some information about the families’ global situation in SH (Table 6) and another about the SH for each child (Table 7).
As previously indicated, CL3 is the biggest cluster (69.25%) with the best overall situation. In it, 69.8% are employed, and 25.5% are unemployed in various forms (Table 6). It is not the group with the best occupational status, but its lack of gaps implies that its socio-economic level is good. Therefore, the fact that it often spends more time to support child/children in SH apparently indicates a positive factor in this situation. It is necessary to remember that lack of work-life balance in Spain means that most family care falls on women, including supporting children’s schooling. Moreover, we must also bear in mind that 85.4% of the people who answered our survey were mothers. For a certain socio-economic profile, one partner of the couple earning income suffices. In these cases, the mother (or the father) not working could act as a positive element to support SH rather than as a stress factor from lack of income. In fact, CL3 is the group with the fewest gaps in all cases and also in the total gaps. It is the group that most frequently indicates positive cohabitation aspects (enjoying the time spent together, more effective, understanding, and collaborative children at home, fewer concerns, etc.). Basically, its confinement situation was similar to life without confinement (Table 6).
It is the oldest group (mean age of 42.74 years), with the fewest children studying ECE, PE, and CSE (mean of 1.50) and the fewest people cohabiting at home. It is the group with a higher percentage of children studying CSE and attending subsidized/private schools (Table 7, first block).
On the schooling situation, they report no difficulties with either ICT or anything else to support children’s SH and most frequently indicate that teachers used videoconferencing. Generally speaking, this group perceive similar achievement for their child/children, and it most positively evaluates the SH experience (an average of 3.39 out of 5) (Table 7).
The next group to report a good SH situation is CL1, which is also the second biggest group of families. This group has the highest percentage of both employment and a higher level of education, with a larger mean number of children (1.88). It indicates a lack of gaps, except for cohabitation, for which it presents the most difficulties, probably due to lack of time because of its occupational status (Figure 3). This group traveled to work the most during confinement and also teleworked for similar or longer working hours than usual (Table 6). Although they enjoyed the family time during the confinement and practiced more sports, they are also the group that reported more family arguments, with children feeling more nervous and even getting sick, indicating some somatization.
It has the most children studying PE of the global sample and a similar distribution for school type (public/private) (Table 7).
Schooling support does not report on ICT difficulties but points out having less time available and lack of such support, plus other difficulties (albeit less intensely than CL2): children tired of sitting in front of computer screens and not enough teacher/school support (Table 7). Despite its quite good socio-economic level and showing a marked gap only for cohabitation (precisely because they work), this family’s cluster was distressed with the schooling period during confinement from having little time to spend on SH. It considers that children learned less than normal (69.7% of the children learned less or much less) and evaluated the overall SH experience with 2.77 out of 5 (Table 7).
As previously pointed out, the two groups to have encountered more difficulties with the SH process are CL2 and CL4, in this order. Despite the sample bias, this study was able to identify and characterize some families that are found to have wider gaps than those families that are below the middle class.
CL4 has the weakest socio-economic profile (Table 6). Its employment percentage is a mean of 47.8%, with unemployment (in its different forms) reaching 37.4%, and it is the group with the lowest level of education (a lower percentage had completed higher education). Its children more frequently go to public education centers than the whole group (Table 7). The number of people cohabiting at home is similar to that for CL3, and it had no Gap 4 (cohabitation) problems (Figure 3). Therefore, it does not show SH difficulties related to time and supporting their child/children (linked with a lower employment percentage). Its main difficulty is the digital gap. It is the group in which Gap 2 (ICT resources) is the most marked one, followed by Gap 3 (ICT knowledge) (Figure 3). It reports major difficulties supporting SH due to difficulties in using ICT. However, it is not the cluster with the most school support difficulties because it frequently points out having communicated with teachers by WhatsApp or telephone (Table 7). Its perceived learning loss is not as marked as it is in other groups (57% of the children learned much less or relatively less), and its overall evaluation is the second most positive one (3.18 out of 5) (Table 7). Despite economic difficulties and problems with ICT, they feel they have been able to cope with the situation and have been supported by teachers to do so.
Finally, CL2, the smallest cluster of the sample (5.86%), reports the most difficulties with the SH process. It has comparatively good employment levels (77.1% and 17.8% unemployment in its different forms) (Table 6), but it had less available time, and, based on the identified gaps, this did not compensate for economic difficulties (Figure 3). It is the youngest group with the most children of school age, with a higher percentage studying PE and at public schools (Table 7). It is the group with the most people cohabiting at home. Although it encounters difficulties with all the gaps, they are more marked for lacking ICT resources and not having ICT knowledge to support children (Table 6). Apart from these difficulties, we find those related to time and families’ lack of attention for being very busy with traveling to work or teleworking and, thus, they spent less time supporting their child/children with SH. They also perceive being less competent (ICT and academically) to do so from a lack of home support (Table 6). This family group reports less teacher communication with their child/children. Furthermore, this is the group that most stresses the lack of school/teacher support (too many tasks, very little support for families, not much contact with children, etc.), as well as lack of support outside school and children being tired of sitting in front of computer screens (Table 7). This cluster also has a higher proportion of families with extreme SH support (spending too much time or much less time than normal). They indicate transmitting the stressful situation to their child/children: children were nervous and even had health problems. Thus, their perceived learning loss is the most serious (77.9% of the families indicate that their children had a lot less—34.2% or quite a bit less—43.7%), and their overall evaluation of the SH experience is the worst (2.63 out of 5) (Table 7).
Overall, we conclude that families’ support for SH was influenced by the digital gap (Gap 2 and Gap 3), as well as available time (also reflected in Gap 4 cohabitation), with effects that sometimes compensated (CL4, few resources, but having time to support SH), but made things worse in other cases (CL2, few resources, and not having the available time because of work). This means that differences are clearly shown among clusters for families’ resources and ICT competencies as two groups enjoyed suitable conditions (CL3 and CL1) and two groups encountered difficulties (CL4 and CL2). Some traits between the two appear clearly: CL2 has a better economic situation, fewer serious problems with resources, but more serious ones with ICT competencies, while CL4 has a worse economic situation, serious problems with resources, and less serious ones with competencies, but having more time and good cohabitation made up for it.
Another element that might be related to very clear differences in school support. On the one hand, CL2 families are less at risk of exclusion than CL4 families because they work. On the other hand, they perceive that they cannot cope because of work and feel excluded by schools. CL2 has more economic problems but more time to spend with their child/children, and schools and teachers support them more. This confirms the fundamental role played by schools in the way in which families experienced this process, even when families had objective difficulties economically or obtaining /managing ICT resources.
One aspect to stress to end this synthesis from the quantitative study is teachers’ and families’ views about integrating online activities when they go back to face-to-face teaching. The response of both samples (families-teachers) is mostly positive.
4.2.2. Synthesis of Results Obtained from Focus Groups in the Family Collective
As for contributions from the qualitative approach, it is important to stress that with this work, we present only the beginning of an investigation to be done by such procedures. This limitation which conditions data collection, occurred because the “state of alarm” in Spain ended on 9 May 2021, and until that date, mobility and meetings were restricted. Another limitation is that given the confidential nature of our survey, no groups with representative people from each cluster could be formed.
Here we stress a couple of ideas to supplement the quantitative study (Table 8). Families from the focus groups explain that they typically use resources such as smartphones, email, Google, YouTube, or instant messaging. They also indicate opposing feelings: satisfaction with having been able to cope with this challenge but frustration with the deficiencies in the current face-to-face school model. This created a false perception of “digital self-sufficiency,” but they came across many inconvenient situations from not knowing other resources while performing SH. Many actually indicate learning from their child/children. Although confinement was hard, the families in the focus groups also stressed that it provided occasions to spend time together as a family.
In any case, and as we find in the Results section, the synthesis of qualitative data guides and supports interpretative hypotheses that should be subsequently verified.
5. Discussion
We organized the discussion section according to the objectives proposed in the article.
The families that answered the survey, and were also evaluated by the Gini coefficient, are a widely representative middle-class group which indicates that the quality of life of a few families is at a very high level but is low for other families. Nevertheless, more disadvantaged groups are lacking, such as those who could not be contacted to complete the online survey. Sadly, we firmly believe that SH did not even exist for many of these groups. The face-to-face schooling possibility simply vanished, along with all the implications of this, as pointed out by [5,6] or [35], as did the minimum aid that Spain offers to feed children in school canteens.
With the k-means cluster analysis, we identified a structure that grouped families into four groups: two with a high gaps incidence and two more with more moderate gaps incidences.
CL1, which includes 17.9% of the cases, has enough space at home, its available ICT resources are adequate, and it is the group with the most self-perceived ICT knowledge to support their child/children. However, this cluster presents very high levels of cohabitation problems. In general terms, we can take it to be the third group as far as the gaps that it presents are concerned.
CL2 (with 5.86%) is the group with the most gaps in dealing with SH. It has enough space at home but is the worst of the four clusters. It has insufficient ICT resources (CL4 is the worst cluster for this aspect). Although most families perceive that they have sufficient ICT skills to support their child/children, this group is the one with the most problems in this respect. It is also the second group to indicate having the most cohabitation problems.
CL3 is the biggest group for a number of cases (69.25%). It represents the best situation of all the clusters: has enough space at home, sufficient ICT resources, is the best qualified to help their child/children to use these resources, and has the fewest cohabitation problems.
Finally, CL4 includes 7% of the cases. This is the second group to report frequently encountering gaps. It is the group with the worst employment situation and few ICT resources, and it lacks certain ICT skills. However, this cluster mostly has enough space at home, and the cohabitation of its members during confinement was good.
Overall, the group with the most difficulties is CL2, followed by CL4 and then CL1. CL3 is the group with the fewest difficulties in dealing with SH.
In summary, in view of the results of the profiles, it seems that the NSEC should be considered in relation to other variables as covariates, as it is not currently a totally linear and scalar indicator [11].
The early findings from qualitative procedures corroborate and explain to a large extent what was observed in the sample as a whole, in addition to having been able to identify cases in which the situations were so particular that they made it impossible to carry out educational activities in conjunction with those that could be carried out by the school for all the students in each class. These isolated but existing cases will now be dispersed in the collective, and we hope to be able to offer them the support that will help to compensate for their shortcomings.
6. Conclusions
To end these reflections, we point out some considerations about the study limitations and future research lines that could be derived from it. The most important limitation is that it was not possible to include information on the most vulnerable families, as mentioned above [11], pp. 176–177; [9,17], and briefly refer to them in the specific reflections arising from the present work.
First of all, one of the most relevant conclusions we reached with this study is the excessive totality of the NSEC indicator as an independent and almost permanent variable in differential studies about education. Without scoring its value, as we pointed out earlier in the discussion section, this indicator very much concentrates on economic elements and does not reflect on the complexity of the diversity of the so-called “middle classes.” Thus, it does not allow their socio-economic conditions to be analyzed with their children’s schooling process according to the NSEC level. It is necessary to investigate new compound indicators by taking the concept that we used to define gaps, which were analyzed according to their reliability and validity to suitably depict situations that represent families’ diverse structure, style, and quality of life.
One key element for families is family structure. Analyzing this family structure will allow education to be more suitably studied from the systemic perspective of which school is a fundamental part, and the family is another part on which personal and social development possibilities are based as an expression of education. Families must participate by collaborating with schools in education. It is precisely schools and families that have been inclined to integrate ICT in their delivering and receiving classes. Collaboration in the ICT domain, with schools revitalizing families’ training, would be a strategy to contemplate. However, this would need time to become a possibility in terms of how to achieve a work-life balance.
SH has been an opportunity to look in-depth at understanding not only social structures and needs but also educational responses. To make the most of this, to take a glimpse into the (possible) future, how to anticipate it, and to know to what extent we can bring it about [8]. We cannot keep on responding to social needs when they are evident and have definitely affected part of the population negatively.
The education policy cannot be conceived without taking a systemic and holistic glance. It is necessary to coordinate government decisions about economic, social, and environmental policies along with educational ones. Social cohesion as the basis for personal development and social transformation requires us to take this glance together [36]. We need to be particularly careful with generating inequalities that are generated precisely because of the failure to address social development as a whole; educational, social, and economic policies must be considered in conjunction to achieve social welfare for all.
All this highlights the need for new research approaches to evaluate education with a view to dealing with these questions globally to better understand how processes work. In this way, we will be able to design strategies to revitalize the family-school synergy in children’s educational-school development and, consequently, in the social transformation from education.
Author Contributions
Conceptualization, J.M.J.-M., C.S.-Á. and M.B.-K.; methodology, J.M.J.-M., C.S.-Á. and M.B.-K.; software, J.M.J.-M., C.S.-Á. and M.B.-K.; validation, J.M.J.-M., C.S.-Á. and M.B.-K.; formal analysis, J.M.J.-M., C.S.-Á. and M.B.-K.; investigation, J.M.J.-M., C.S.-Á. and M.B.-K.; data curation, J.M.J.-M., C.S.-Á. and M.B.-K.; writing—original draft preparation, J.M.J.-M., C.S.-Á. and M.B.-K.; writing—review and editing, J.M.J.-M., C.S.-Á. and M.B.-K.; visualization, J.M.J.-M., C.S.-Á. and M.B.-K.; supervision, J.M.J.-M.; project administration, J.M.J.-M. All authors have read and agreed to the published version of the manuscript.
Funding
This research received no external funding.
Institutional Review Board Statement
The study was anonymous and conducted in accordance with the Ethical norms.
Informed Consent Statement
Informed consent was obtained from all subjects involved in the study.
Data Availability Statement
Not applicable.
Acknowledgments
We are grateful to colleagues of: (a) the Teachers’ Union Federació d’Ensenyament de Comissions Obreres-País Valenciá (FE-CCOO-PV); (b) Union of Valencian Teaching Cooperatives (UCEV); (c) European Forum of Education Administrators (FEAE-Spain), (d) Students of the Pedagogy, Social Education, Teaching and Speech Therapy degrees, and of the Psychopedagogy, Special Needs Education, Policy, Management and Direction of Educational Organizations, and Educational Social Action masters degrees, all of the University of Valencia; (e) Teachers from Florida Universitaria and the Catholic University of Valencia; (f) Confederation of parents’ associations of Castilla y León (CONFAPACAL) and teachers of early childhood, basic and secondary and university education, who collaborated individually in the dissemination of the survey. Our thanks to all of them.
Conflicts of Interest
The authors declare no conflict of interest.
| 1 | Research Group on Educational Evaluation and Measurement: Education for Social Cohesion (GEM-Educo: https://www.uv.es/gem/gemeduco, accessed on 13 November 2022). |
| 2 | In Spain, ECE is organised in two cycles (0–3 and 3–6 years) and is not compulsory, although there is a high demand, as many women have entered the labour market. PE (6 grades) and CSE (4 grades) are compulsory. In USA PE is Basic School and CSE is Secondary School. |
| 3 | The 12,914 cases of students enrolled in foreign centres in the Valencian Community were not considered, and the sample contains no such cases. The available data correspond to academic year 2018/19. |
| 4 | Public Schools in Spain are free of charge for families. |
| 5 | In the population, the strata distribution is: Type (Public: 66.22%; Subsidized/Private: 33.78%) and Level of Education (ECE: 25.59%; BE: 44.68%; CSE: 29.73%). Nor was it possible to establish representativeness in relation to the proportional distribution for provinces in the Valencian Community. |
| 6 | Both criteria were taken from a bistage cluster by means of SPSSv26, licence of University of Valencia, Spain. |
| 7 | We opted for non-parametric contrasts because, when previously exploring data characteristics, we found that they did not mostly meet some of the necessary normality conditions to apply parametric tests. |
References
- Pokhrel, S.; Chhetri, R. A literature review on impact of COVID-19 pandemic on teaching and learning. High. Ed. Future 2021, 8, 133–141. [Google Scholar] [CrossRef]
- Royal Decree–Spain-463/2020, of March 14, Declaring a State of Alarm for the Management of the Health Crisis Situation Caused by COVID-19. Available online: https://www.boe.es/eli/es/rd/2020/03/14/463/con (accessed on 13 November 2022).
- Entwisle, D.R.; Alexander, K.L.; Olson, L.S. Children, Schools, and Inequality; Westview Press: Boulder, CO, USA, 1997. [Google Scholar]
- Alexander, K.L.; Entwisle, D.R.; Olson, L.S. Schools, achievement, and inequality: A seasonal perspective. Ed. Eval. Policy An. 2001, 23, 171–191. [Google Scholar] [CrossRef] [Green Version]
- Martínez Rizo, F. ¿Puede la escuela reducir las desigualdades del rendimiento? Págs. Ed. 2009, 2, 7–27. [Google Scholar] [CrossRef]
- Martínez-Rizo, F. La escuela, ¿Gran igualadora o mecanismo de reproducción? La desigualdad social y educativa más de 50 años después de Coleman. Rev. Lat. Am. J. Educ. Stud. 2019, 49, 253–284. [Google Scholar] [CrossRef]
- Council of Europe. Concerted Development of Social Cohesion Indicators. Methodological Guide; Council of Europe: Strasbourg, France, 2005; Available online: http://www.coe.int/t/dg3/socialpolicies/socialcohesiondev/source/GUIDE_en.pdf (accessed on 13 November 2022).
- Jornet-Meliá, J.M. Dimensiones docentes y Cohesión Social. Rev. Iberoam. Eval. Educ. 2012, 5, 349–362. Available online: http://www.rinace.net/riee/numeros/vol5-num1_e/art27.pdf (accessed on 13 November 2022).
- González-Such, J.; Perales Montolío, M.J.; Ortega-Gaite, S.; Sánchez-Delgado, P. Ecologías de aprendizaje digital de los docentes: La Escuela en casa durante la Covid-19 en la Comunidad Valenciana. Rev. Publ. 2021, 51, 165–190. [Google Scholar] [CrossRef]
- Perales-Montolío, M.J.; González-Such, J.; Ortega-Gaite, S.; Sánchez-Delgado, P. Typology of teaching actions during COVID-19 lockdown in the Valencian Community (Spain). Societies 2023, accepted, in press. [Google Scholar]
- Jornet-Meliá, J.M.; González-Such, J.; Perales-Montolio, M.J.; Sánchez-Delgado, P.; Bakieva, M.; Sancho-Álvarez, C.; Ortega-Gaite, S. Informe Técnico: La Escuela en Casa. Resumen Ejecutivo; Ed. Palmero: Valencia, Spain, 2020; Available online: https://www.uv.es/gem/CoVid-19.wiki (accessed on 13 November 2022).
- Aznar Sala, F.J. La Educación Secundaria en España en Medio de la Crisis del COVID-19. RASE 2020, 53–78. [Google Scholar] [CrossRef]
- Beltrán, J.; Venegas, M. Educar en época de confinamiento: La tarea de renovar un mundo común. RASE 2020, 13, 92–104. [Google Scholar] [CrossRef]
- Fernández-Rodrigo, L. Alumnado que no sigue las actividades educativas: El caso de una escuela de alta complejidad durante el confinamiento por COVID-19. Soc. Infanc. 2020, 4, 195–288. [Google Scholar] [CrossRef]
- Hortigüela-Alcalá, D.; Pérez-Pueyo, Á.; López-Aguado, M.; Manso-Ayuso, J.; Fernández-Río, J. Familias y Docentes: Garantes del aprendizaje durante el confinamiento. RIEJS 2020, 9, 353–370. [Google Scholar] [CrossRef]
- Jornet-Meliá, J.M. A educación durante a pandemia. Materias pendentes e leccións aprendidas. EDUGA 2020, 80, 2171–6595. Available online: https://www.edu.xunta.gal/eduga/2015/enfoques/educacion-durante-pandemia (accessed on 13 November 2022).
- Sánchez-Delgado, P.; Bakieva-Karimova, M.; Sancho-Álvarez, C.; Jornet-Meliá, J.M. Estudio diferencial del rol familiar en la educación a distancia en confinamiento debido al COVID-19. REDIE 2022, 24, 1–18. [Google Scholar] [CrossRef]
- Creswell, J.W.; Plano Clark, V.L. Designing and Conducting Mixed Methods Research, 2nd ed.; Sage: Thousand Oaks, CA, USA, 2017. [Google Scholar]
- Sánchez-Gómez, M.C.; Martín-Cilleros, M.V. Implementation of focus group in health research. In Computer Supported Qualitative Research. Studies in Systems, Decision and Control; Costa, A., Reis, L., Neri de Sousa, F., Moreira, A., Lamas, D., Eds.; Springer: Cham, Switzerland, 2017; Volume 71, pp. 49–62. [Google Scholar] [CrossRef]
- Sánchez-Gómez, M.C.; Rodrigues, A.I.; Costa, A.P. From qualitative methods to mixed models: Current trend in social science research. RISTI 2018, 28, 9–12. [Google Scholar] [CrossRef]
- INE. INEbase. Continuous Household Survey. Data for 2020, gan-1. 2020. Available online: https://www.ine.es/prensa/ech_2020.pdf (accessed on 13 November 2022).
- Ceriani, L.; Verme, P. The origins of the Gini index: Extracts from Variabilità e Mutabilità (1912) by Corrado Gini. J. Econ. Inequal. 2012, 10, 421–443. [Google Scholar] [CrossRef]
- Goodman, L.A. Snowball sampling. An. Math. Stat. 1961, 32, 148–170. [Google Scholar] [CrossRef]
- González Such, J.; Sánchez Delgado, P.; Sancho, C. Técnicas evaluativas 2. In Investigación Evaluativa. Una perspectiva basada en la complementariedad metodológica (cuantitativa-cualitativa); Jornet, J.M., González Such, J., Perales, M.J., Eds.; CREA: Lima, Peru, 2013; pp. 112–126. [Google Scholar]
- Perales-Montolío, M.J.; Sánchez-Santamaría, J.; González-Such, J. El uso de grupos focales en el proyecto MAVACO. Consideraciones metodológicas y operativas. In La evaluación de sistemas educativos. ¿Qué informaciones interesan a los colectivos implicados? Jornet, J.M., García García, M., González Such, J., Eds.; PUV: Valencia, Spain, 2012; pp. 47–58. [Google Scholar]
- Milligan, G.W.; Cooper, M.C. An examination of procedures for determining the number of clusters in a data set. Psychometrica 1985, 50, 159–179. [Google Scholar] [CrossRef]
- Kaufman, L.; Rousseeuw, P. Finding Groups in Data: An Introduction to Cluster Analysis; John Wiley & Sons: New York, NY, USA, 1990. [Google Scholar]
- Sugar, C.A.; James, G.M. Finding the number of clusters in a dataset: An information-theoretic approach. J. Am. Stat. Assoc. 2003, 98, 750–763. [Google Scholar] [CrossRef]
- Kodinariya, T.M.; Makwana, P.R. Review on determining number of cluster in k-means clustering. Int. J. 2013, 1, 90–95. [Google Scholar] [CrossRef]
- Syakur, M.A.; Khotimah, B.K.; Rochman, E.M.S.; Satoto, B.D. Integration K-Means Clustering Method and Elbow Method for identification of the best customer profile cluster. IOP Conf. Ser. Mater. Sci. Eng. 2018, 336, 012017. [Google Scholar] [CrossRef] [Green Version]
- Bozdogan, H. Model selection and Akaike’s information criterion (AIC): The general theory and its analytical extensions. Psychometrika 1987, 52, 345–370. [Google Scholar] [CrossRef]
- Miles, M.; Huberman, A.M. Qualitative Data Analysis. A Source Book of New Methods; Sage: Beverly Hills, CA, USA, 1984. [Google Scholar]
- Miles, M.; Huberman, A.M. Data Management and Analysis Methods. Handbook of Qualitative Research; Denzin, N.K., Lincoln, Y.S., Eds.; Sage: Beverly Hills, CA, USA, 1994. [Google Scholar]
- Tesch, R. Qualitative Research: Analysis Types and Software Tools; The Falmer Press: New York, NY, USA, 1990. [Google Scholar]
- Cabrera, L. Efectos del coronavirus en el sistema de enseñanza: Aumenta la desigualdad de oportunidades educativas en España. RASE 2020, 13, 114–139. [Google Scholar] [CrossRef]
- Jornet-Meliá, J.M. Reflexiones sobre el futuro de la educación en España. In Proceedings of the VII Conferência Ibérica de Inovação na Educação comTecnologias da Informação e Comunicação, Madrid, Spain, 18–19 February 2021. [Google Scholar]
Figure 1.
Basic characteristics of the families surveyed in the Valencian Community (Spain).

Figure 3.
Gap profiles for three groups per k-means cluster.


Table 1.
Synthesis of characteristics (Ch) of the lockdown that was carried out in Spain between 14 March and 21 June 2020.
Table 1.
Synthesis of characteristics (Ch) of the lockdown that was carried out in Spain between 14 March and 21 June 2020.
| Ch | Description |
|---|---|
| 1 | The Royal Decree was published on Friday, 14 March. This ordered the closure of the entire educational system from the day following its publication. |
| 2 | The state of alarm periods was debated and approved every fortnight in the Spanish parliament. They could have been rejected at any time, forcing the end of lockdown. The uncertainty was permanent. |
| 3 | All the population had to remain in their homes. Homes became “isolation bubbles” where only cohabitants could be together. |
| 4 | Most of the working population, if they could carry out their work from home, switched to teleworking (this was the case of all teachers, from Early Childhood Education to university), |
| 5 | Part of the working population was considered “essential personnel” for social functioning (health personnel—medical personnel, nursing personnel, pharmacists… -, State security forces—military and police—firefighters, cleaning personnel of public spaces—hospitals, streets, etc.-, personnel who worked in food distribution—large supermarkets, small shops) and transport workers. These had to go to their place of work. |
| 6 | Many of those who were unable to work remotely from home and who were not identified as essential personnel lost their jobs. Many companies were temporarily or permanently closed. Many other workers were included in a furlough scheme -ERTE-: they received a subsidy from the State (although it took a long time to reach them), with the commitment from the company not to close and the hope of returning to the economic situation at the end of the state of alarm. |
| 7 | No one, except those who had to carry out their work in person, could leave the house, except to buy food, receive health care, or care for dependents or deal with work emergencies. In any case, if they did go out, they could only do so for a short period of time and following strict health care measures. |
Table 2.
School at Home (SH) survey content sections.
| Sections | Description |
|---|---|
| Participant profile | Location, family role, age, number of home cohabitants, approximate square meters of house, educational level, occupation, employment situation. |
| Home conditions for online work | Number of children, family routines during confinement, availability and use of home space, activities and personal relationships at home during confinement. |
| Technological adaptation and use of digital technology at home | Family difficulties in supporting online teaching, type of school-based activities, overall assessment of online usage. |
Table 3.
Synthesis of questions that guided the development of the focus groups carried out with families.
Table 3.
Synthesis of questions that guided the development of the focus groups carried out with families.
| Script of Focus Group with Families |
|---|
| How did you experience the lockdown situation at home? |
| What technological resources did they (School Center) have to develop the SH? |
| Did they have enough training to help your children in the SH? Regarding educational content? In IT matters? |
| Have they been able to pay adequate attention to your children in the SH? Did they have time to attend to them?; Did they have other responsibilities to attend to during lockdown? |
| How did you support your children the most in teaching? |
| Do you think it would be beneficial to include online activities when it is possible to return to face-to-face schooling? Why? |
Table 4.
Phases of study development: School at Home.
| Phase | Activities |
|---|---|
| I | Definition of study goals. |
| II | Documentation: (a) similar studies and (b) studies on school absence and its impact on learning. |
| III | Survey design: (a) first draft (GemEduco); (b) logical review of overall content and item formulation (reviewers: teachers and families); (c) pilot test (groups of teachers and families, e-mail contact); (d) second draft for online application; (e) pilot test in online format; (f) revision: final design of survey for online application (GemEduco). |
| IV | Data collection: (a) contacting people and organizations supporting the dissemination of the survey; and, (b) dissemination through social networks. |
| V | Quantitative data analysis: (a) database debugging and, (b) statistical analysis. |
| VI | Technical report: executive summary of the School at Home study. Dissemination through social and academic networks. |
| VII | Secondary studies: (a) qualitative approach (focus groups with families: collection of information and analysis); (b) statistical analysis specific to type of differential. |
| VIII | Dissemination of results. |
Table 5.
Compound Indicators of Gaps about School at Home.
| Family Indicators | Interpretation Scale |
|---|---|
| GAP-1 MCPCHT THEORETICAL: square meters per capita in the home (IC.1 = p8/p7) | Insufficient < 20 Sufficient ≥ 20 and < 25 Adequate ≥ 25 |
| GAP-2 BREDIGERM: lack of technological material resources (IC4.A = Ʃ[p20.1 to p20.6]) | Null (= 1); Level 1 (= 2); Level 2 (= 3); Level 3 (= 4) Level 4 (= 5); Level 5 (= 6) |
| GAP-3 BREDIGESCI: parents’ and/or mothers’ lack of technological knowledge (IC4.B = Ʃ[p20.7 to p20.8]) | Null (= 0) Level 1 (= 2) Level 2 (= 3) |
| GAP-4 BRECONH: home coexistence (problems and personal relationships during confinement) (IC.5 = Ʃ[p21.1 to p21.5]) | Null (= 1); Level 1 (= 2); Level 2 (= 3); Level 3 (= 4) Level 4 (= 5) |
| GAP-5 DSIGUALDADTOTAL: global inequality indicator (IC.6 = quintiles of Ʃ[BREICVCONFINA, BREDIGTOT, BRECONH]) | Null (= 1); Level 1 (= 2) Level 2 (= 3); Level 3 (= 4) Level 4 (= 5) |
Table 6.
Families’ perceptions of the SH functioning in the VC and its association with clusters.
| Cluster Case Number | ||||||
|---|---|---|---|---|---|---|
| Variable | 1 | 2 | 3 | 4 | Total | Sig. |
| Work Situation during Lockdown * | ||||||
| I have to attend my workplace | 38.6% | 35.7% | 29.7% | 24.7% | 31.3% | 0.000 |
| Teleworking from home with the same or similar schedule as usual | 20.6% | 17.9% | 16.5% | 9.5% | 16.8% | 0.005 |
| Teleworking from home doing more hours than usual | 21.8% | 14.9% | 15.3% | 10.0% | 16.1% | 0.000 |
| Teleworking from home doing fewer hours than usual | 7.7% | 5.4% | 6.7% | 6.8% | 6.8% | 0.743 |
| (total teleworking. Calculated by sum) | 50.1% | 38.2% | 38.5% | 26.3% | 39.7% | |
| (total face-to-face work + teleworking. Calculated by sum) | 88.7% | 73.9% | 68.2% | 51% | 71% | |
| I usually work taking care of the family and the home (I do not do paid work outside the home) | 0.6% | 3.0% | 1.1% | 1.6% | 1.1% | 0.082 |
| I have been unemployed for a long time | 6.1% | 10.4% | 14.2% | 23.2% | 13.1% | 0.000 |
| I have been unemployed since the declaration of the state of alarm | 3.3% | 4.3% | 4.4% | 7.4% | 4.4% | 0.142 |
| I am on temporarily leave through a furlough scheme | 3.3% | 3.1% | 6.9% | 6.8% | 6.0% | 0.011 |
| (Total unemployed. Calculated by sum) | 12.7 | 17.8 | 25.5 | 37.4 | 23.5 | |
| Coexistence during confinement * | ||||||
| We have enjoyed moments together that we do not have outside lockdown (watching movies, talking, board games…) | 59.2% | 48.8% | 58.5% | 50.2% | 57.5% | 0.011 |
| My children have exercised indoors (sports) | 43.0% | 34.7% | 41.3% | 33.5% | 40.7% | 0.040 |
| All the household has withstood lockdown calmly | 24.7% | 21.2% | 36.8% | 25.1% | 32.9% | 0.000 |
| Mood and relationships at home are similar to when there is no lockdown | 28.5% | 26.5% | 36.5% | 24.6% | 33.6% | 0.000 |
| Due to the work of a member of the family (Healthcare. Food. Community services) we had to socially distance in the family when they returned from work | 12.7% | 15.3% | 9.2% | 8.4% | 10.1% | 0.010 |
| The youngest members of the family get more nervous than usual when they are indoors for so long | 41.2% | 42.4% | 22.7% | 35.5% | 28.1% | 0.000 |
| We are all more irritable when we are locked down and we argue frequently | 34.1% | 33.5% | 15.3% | 29.6% | 20.7% | 0.000 |
| We are afraid that this situation will drag on for a long time. This affects our mood | 34.9% | 40.6% | 22.2% | 32.0% | 26.3% | 0.000 |
| Difficulties with ICTs that prevented families from carrying out SH * | ||||||
| We do not have an internet connection | 0.6% | 4.7% | 0.4% | 9.9% | 1.3% | 0.000 |
| Our internet connection is not sufficient for this use | 8.5% | 38.8% | 5.6% | 34.0% | 10.0% | 0.000 |
| We don’t have adequate computers | 5.2% | 65.3% | 3.9% | 63.5% | 11.9% | 0.000 |
| We do not have suitable tablets | 2.9% | 60.6% | 1.6% | 56.7% | 9.1% | 0.000 |
| We only have our smartphone. We cannot lend them to our children to study | 0.8% | 44.1% | 1.1% | 42.9% | 6.5% | 0.000 |
| We only have our computers and we use them to work | 11.6% | 44.7% | 3.9% | 32.5% | 9.7% | 0.000 |
| Our children have smartphones but we don’t know how to use them to do homework | 2.1% | 4.7% | 0.8% | 3.0% | 1.4% | 0.000 |
| We do not have any IT knowledge and we cannot help our children to use it | 5.0% | 12.4% | 2.5% | 7.9% | 3.9% | 0.000 |
| We have had no difficulties | 56.3% | 1.2% | 74.7% | 2.5% | 62.0% | 0.000 |
| Other difficulties of families to perform SH * | ||||||
| My children do not have their own space to study | 27.7% | 35.3% | 3.9% | 8.9% | 10.3% | 0.000 |
| We don’t have enough time to spend with our children helping them with school at home | 78.0% | 74.7% | 18.4% | 26.1% | 32.9% | 0.000 |
| We have children in different year groups and we do not have time to attend to all of them | 69.6% | 73.5% | 11.7% | 19.2% | 26.2% | 0.000 |
| I have no one to help me at home. I am alone to take care of my children and to work | 46.4% | 55.9% | 6.9% | 7.9% | 16.9% | 0.000 |
| I am separated or divorced and that has made it difficult to support my children academically | 13.7% | 12.9% | 1.5% | 1.5% | 4.3% | 0.000 |
| One or more family members have been affected by COVID-19 | 1.9% | 2.4% | 1.6% | 3.4% | 1.8% | 0.275 |
| We have no other difficulties | 1.2% | 1.2% | 53.0% | 26.1% | 38.8% | 0.000 |
| Perception of the way in which teachers adapted the methodology to perform SH * | ||||||
| Send assignments from textbooks and correct them later | 59.9% | 50.6% | 57.8% | 55.2% | 57.6% | 0.164 |
| Hold video conferences with the entire class group | 46.1% | 38.8% | 48.8% | 35.5% | 46.8% | 0.000 |
| Video conference with my child | 13.5% | 12.4% | 16.4% | 11.3% | 15.3% | 0.081 |
| Communicate with us by WhatsApp or Telegram etc. | 39.5% | 49.4% | 38.9% | 43.3% | 39.9% | 0.040 |
| Indicate YouTube videos to watch | 45.9% | 55.3% | 38.1% | 49.8% | 41.3% | 0.000 |
| Record videos to explain things to families | 13.3% | 12.4% | 14.6% | 18.7% | 14.5% | 0.244 |
| Record videos to explain topics to my child | 17.7% | 17.6% | 22.1% | 24.6% | 21.2% | 0.059 |
* Used analyses: Chi-square.
Table 7.
Families’ perceptions of the SH functioning in the VC and its association with clusters (Base: Number of children).
Table 7.
Families’ perceptions of the SH functioning in the VC and its association with clusters (Base: Number of children).
| Cluster | |||||||
|---|---|---|---|---|---|---|---|
| Variable | 1 | 2 | 3 | 4 | Total | Sig. | |
| Educational Level: All Children * | |||||||
| Early Childhood Education (ECE) | 21.7% | 21.4% | 21.3% | 22.9% | 21.5% | 0.000 | |
| Primary Education (PE) | 49.1% | 54.1% | 40.3% | 45.5% | 43.4% | ||
| Compulsory Secondary Education (CSE) | 29.2% | 24.6% | 38.4% | 31.6% | 35.1% | ||
| Type | Ownership of the educational center in which your child studied * | ||||||
| 3 | Public | 62.4% | 70.9% | 59.2% | 66.3% | 61.2% | 0.005 |
| Subsidized | 34.3% | 27.2% | 37.1% | 31.0% | 35.4% | ||
| Private | 3.3% | 1.9% | 3.7% | 2.7% | 3.4% | ||
| 2 | Public | 62.4% | 70.9% | 59.2% | 66.3% | 61.2% | 0.000 |
| Subsidized/Private | 37.6% | 29.1% | 40.8% | 33.7% | 38.8% | ||
| Means of communication between teachers and families * | |||||||
| 21.7% | 25.3% | 21.5% | 28.5% | 22.3% | 0.032 | ||
| Telegram | 13.5% | 17.0% | 13.1% | 15.8% | 13.6% | 0.200 | |
| Telephone | 13.0% | 13.8% | 14.2% | 20.8% | 14.4% | 0.013 | |
| 73.0% | 72.0% | 70.3% | 72.2% | 71.1% | 0.479 | ||
| Computer platform of the school or educational administration | 58.9% | 61.2% | 62.1% | 57.7% | 61.1% | 0.232 | |
| Video call with different applications | 32.5% | 27.7% | 32.0% | 32.0% | 31.8% | 0.468 | |
| We have not been in contact with the teachers | 2.1% | 2.8% | 2.2% | 1.8% | 2.2% | 0.868 | |
| Level of communication that teachers have had with their students, according to families * | |||||||
| Very low | 9.7% | 13.0% | 7.1% | 9.4% | 8.2% | 0.000 | |
| Low | 22.7% | 23.9% | 13.8% | 11.9% | 16.2% | ||
| Medium | 32.7% | 29.8% | 32.5% | 33.2% | 32.4% | ||
| High | 25.9% | 22.1% | 31.3% | 30.7% | 29.5% | ||
| Very high | 9.0% | 11.2% | 15.2% | 14.8% | 13.6% | ||
| Means (PCV) ** | 3.0 (0.4) | 2.9 (0.4) | 3.3 (0.3) | 3.3 (0.3) | 3.2 (0.3) | 0.000 | |
| Specific difficulties that you have had helping your children in SH (Mark all those you have had) * | |||||||
| My son/daughter won’t work for long on the computer. (S)he gets tired and does not pay attention | 43.8% | 47.1% | 23.6% | 39.4% | 30.5% | 0.000 | |
| Our academic training is not sufficient to help them with the difficulties they have with their homework | 7.5% | 19.0% | 7.9% | 18.0% | 9.3% | 0.000 | |
| Teachers have not helped the parents by telling us how to help our son/daughter | 18.3% | 25.3% | 9.8% | 16.5% | 13.1% | 0.000 | |
| The teachers have had little contact with our son/daughter | 28.2% | 32.2% | 16.7% | 21.8% | 20.5% | 0.000 | |
| The school has set many homework assignments | 39.7% | 44.3% | 25.5% | 33.1% | 30.3% | 0.000 | |
| Few tasks have been sent to them from school to do at home | 5.9% | 5.2% | 5.4% | 3.9% | 5.4% | 0.637 | |
| My son/daughter had some type of specific support outside school hours (a private teacher, an association that offers educational support) and now he/she does not have this | 8.5% | 8.3% | 5.5% | 9.9% | 6.6% | 0.001 | |
| We have had no difficulties | 13.0% | 8.3% | 39.4% | 20.8% | 30.5% | 0.000 | |
| Time dedicated to the educational process of your child compared to that of a normal situation * | |||||||
| A lot less | 13.5% | 15.8% | 11.7% | 10.6% | 12.3% | 0.000 | |
| Less | 18.1% | 10.2% | 18.6% | 17.4% | 17.8% | ||
| The same | 11.5% | 8.4% | 21.4% | 20.9% | 18.4% | ||
| More | 20.0% | 18.6% | 26.0% | 20.2% | 23.9% | ||
| A lot more | 36.8% | 47.0% | 22.4% | 30.9% | 27.7% | ||
| Means (PCV) ** | 3.5 (0.4) | 3.7 (0.4) | 3.3 (0.40) | 3.4 (0.40) | 3.4 (0.4) | 0.000 | |
| Assessment of your child’s academic achievement compared to before lockdown. Has learned: * | |||||||
| A lot less | 23.8% | 34.2% | 12.2% | 15.8% | 16.4% | 0.000 | |
| Quite a bit less | 45.9% | 43.7% | 42.3% | 41.2% | 43.1% | ||
| The same | 23.9% | 16.9% | 33.9% | 31.5% | 30.5% | ||
| Quite a bit more | 5.3% | 3.9% | 9.1% | 10.0% | 8.0% | ||
| A lot more | 1.1% | 1.4% | 2.5% | 1.4% | 2.0% | ||
| Means (PCV) ** | 2.14 (0.4) | 1.95 (0.5) | 2.47 (0.4) | 2.40 (0.4) | 2.36 (0.4) | 0.000 | |
| Observation of changes in the behavior of children due to lockdown * | |||||||
| Is more nervous and agitated | 50.1% | 50.9% | 32.6% | 43.5% | 38.2% | 0.000 | |
| Has had minor health problems (stomach pain, general malaise, sadness…) | 7.6% | 8.2% | 5.1% | 6.1% | 5.9% | 0.000 | |
| Is the same as always | 20.0% | 18.9% | 30.3% | 21.9% | 26.8% | 0.000 | |
| Maybe a little more affectionate at home | 9.0% | 9.3% | 11.9% | 11.2% | 11.0% | 0.000 | |
| More affectionate and understanding with the situation | 9.2% | 8.9% | 15.2% | 14.0% | 13.5% | 0.000 | |
| Helps in everything he/she can and wants to help others as well as soon as this is over | 4.0% | 3.9% | 4.9% | 3.2% | 4.6% | 0.000 | |
| Global assessment of SH * | |||||||
| Very bad | 13.2% | 18.2% | 5.2% | 6.8% | 7.9% | 0.000 | |
| Bad | 29.7% | 30.8% | 17.3% | 20.8% | 21.1% | ||
| Normal | 29.8% | 29.7% | 28.8% | 36.2% | 29.6% | ||
| Good | 21.5% | 12.9% | 30.2% | 20.4% | 26.5% | ||
| Very good | 5.8% | 8.4% | 18.5% | 15.8% | 14.9% | ||
| Means (PCV) ** | 2.77 (0.4) | 2.63 (0.4) | 3.39 (0.3) | 3.18 (0.4) | 3.2(0.4) | 0.000 | |
* Used analyses: Chi-square. ** Used analyses: H Kruskal-Wallis.
Table 8.
Focus Group Families Quotes.
| Quote 1. |
|---|
| “The truth is that we were fine because we were able to do the things we normally do, but without rushing. So the truth is that we shared and did a lot as a family. Although we were also very uncertain about what was going to happen and it was difficult to explain to the children that we had to be at home and we couldn’t go out… but hey, it was good, it was good.” (GF6P6, Early Childhood Education -ECE mother-). |
| Quote 2. |
| “At the study level it was terrible because at home we had nothing. The truth is that I didn’t even have a pencil, I didn’t have sharpies, I didn’t have anything, and on top of that they sent him a lot of homework and then that was like a little hard, we had a really bad time”. (GF6P2, ECE mother). |
| Quote 3. |
| “I did not know how to download a file, or how to send, attach emails… I had no idea. The only thing I knew was to use the mail, but only read the messages, because me, send, forward, attach—nothing. I have learned afterwards.” (GF6P3, ECE mother) |
| Quote 4. |
| “Well, let’s see, I didn’t have much idea either, because we used Google to enter YouTube to find out how to enter or create accounts, to join the groups live and the truth was that it was not that complicated, we had to investigate, but at in the end, we managed it.” (GF6P6, ECE mother). |
| Quote 5. |
| “In truth I found it really hard. I am like I’m there on the internet and everything, but when we came across this it was like using new methods and new things, and the truth is that it was tough at first, I think that instead of teaching my daughter she taught me. She is more up-to-date, and of course I think more than anything I learned more than her hahaha. The truth is that it was hard, but we did it.” (GF7P1, Primary School -PS mother-). |
| Quote 6. |
| “At home I have been a great help for my children and especially for the little one, because he has gained a lot of confidence in doing his things. We learned to draw: how a child draws, animals… and he already has that initiative to do things himself. He says: Mom, I’ll make a girl or a boy and I already notice that the time that we have spent in lockdown sharing with them has served them well.” (GF6P6, ECE mother). |
| Quote 7. |
| “The truth is that we have been of great help because it shows a lot because as I say, sometimes at school they do not have enough confidence to ask certain questions, and here at home we would look for it online or I would explain to them some way that they could understand it and they would say “ah, now I get it”.” (GF7P3, PS mother). |
| Quote 8. |
| “Well, I think it would be good because sometimes, due to the parents’ work, they are not so aware of what they are working on and something to report on everything that is being done and that we are aware of what they are about to be able to help them with any questions they may have” (GF7P3, PS mother). |
| Quote 9. |
| “It is good that they do not completely disconnect from the online part, but just one small point, because not all of us have the resources, such as a Tablet, so that the child has their independence when working, especially because of that, because there aren’t any resources, all this is a very big conflict” (GF7P4, PS mother). |
Disclaimer/Publisher’s Note: The statements, opinions and data contained in all publications are solely those of the individual author(s) and contributor(s) and not of MDPI and/or the editor(s). MDPI and/or the editor(s) disclaim responsibility for any injury to people or property resulting from any ideas, methods, instructions or products referred to in the content. |
© 2022 by the authors. Licensee MDPI, Basel, Switzerland. This article is an open access article distributed under the terms and conditions of the Creative Commons Attribution (CC BY) license (https://creativecommons.org/licenses/by/4.0/).
Share and Cite
MDPI and ACS Style
Jornet-Meliá, J.M.; Sancho-Álvarez, C.; Bakieva-Karimova, M. Analysis of Profiles of Family Educational Situations during COVID-19 Lockdown in the Valencian Community (Spain). Societies 2023, 13, 10. https://doi.org/10.3390/soc13010010
AMA Style
Jornet-Meliá JM, Sancho-Álvarez C, Bakieva-Karimova M. Analysis of Profiles of Family Educational Situations during COVID-19 Lockdown in the Valencian Community (Spain). Societies. 2023; 13(1):10. https://doi.org/10.3390/soc13010010
Chicago/Turabian StyleJornet-Meliá, Jesús Miguel, Carlos Sancho-Álvarez, and Margarita Bakieva-Karimova. 2023. "Analysis of Profiles of Family Educational Situations during COVID-19 Lockdown in the Valencian Community (Spain)" Societies 13, no. 1: 10. https://doi.org/10.3390/soc13010010
Note that from the first issue of 2016, this journal uses article numbers instead of page numbers. See further details here.