
More Money, More Problems? Addressing the Funding Conditions Required for Rights-Based Child Welfare Services in England


Sheffield Methods Institute, The University of Sheffield, 219 Portobello, Sheffield S1 4DP, UK
Societies 2022, 12(1), 9; https://doi.org/10.3390/soc12010009
Submission received: 9 November 2021
/
Revised: 14 December 2021
/
Accepted: 21 December 2021
/
Published: 6 January 2022
(This article belongs to the Special Issue Child Protection and Child Welfare)
Abstract
:Policymakers and academics continue to debate the criteria used in formulas to allocate funding to children’s services, but few studies have considered how well the results of these formulas align with rights-based entitlements and commitments after implementation. This research measured correspondence between local authority spending per child and levels of income deprivation, special educational needs, and child development from 2011–2019 to assess the extent to which funding matches local authorities’ statutory responsibilities to provide support to children ‘in need’ under the Children Act 1989. There was weak and worsening correspondence between funding and needs, especially for preventative services.
1. Background
As locally delivered public services in many parts of the world have been subjected to reductions in funding as a consequence of political decisions made in the wake of the 2008 financial crisis, there is now, in a time of great perceived scarcity, renewed debate about the socio-technocratic processes of local government funding allocation. With austerity cuts that have disproportionately decreased resources in the poorest children’s services in England [1], alongside large and rising socioeconomic inequalities in the rates of children being taken into state care [2], the need to address the equity and (in)adequacy of funding has grown. This is evident in the Ministry for Housing, Communities, and Local Government’s commissioned study for a prospective funding formula revision [3]. While examinations of the issue of children’s social services funding have often focused on the accurate forecasting of service activity, unmet need, and consequent costs [3,4], the intention of this article is to employ a rights-based perspective and assess how well the resourcing of services in England over the past ten years has been aligned to underlying population needs for which children are entitled to statutory support.
Under Section 17 of the Children Act 1989, local authorities in England have a legal duty to provide support in the form of additional services for children and their parents if the child is ‘unlikely to achieve or maintain … a reasonable standard of health or development’; if their health or development is ‘at risk of being impaired’; or if they are disabled. These services rely on funding distributed to local authorities through various national grants such as the Revenue Support Grant. Recent evidence has indicated that lower spending on these services causally increases the rates of children in need as well as rates of children taken into care [5,6], which imply avoidable deprivations of health, development, and safety in contexts of declining resources. Despite the reliance children’s social services have on central government fiscal policy to create the conditions in which they can meet their duties towards children, the topic has received relatively little attention in academia, though the necessity of funding that meets the aspirations of the Children Act was raised by Nigel Parton [7] as early as its implementation, where existing funding was described as “inadequate even before the potential client population was increased by [the Act’s] introduction”.
One exception to the dearth of research on the topic of adequate funding required to meet children’s rights can be found in the work of Debbie Budlender and colleagues in the context of the implementation of the Children’s Act 2005 in South Africa, where the researchers proactively addressed the issue of the funding conditions required to deliver on new obligations [8,9,10]. Budlender et al. [8] identified the services for which provincial Departments of Social Development would have a legal duty to provide under the South African Government’s Children’s Act 2005. They then produced low- and high-cost estimates of meeting these entitlements based on two scenarios: meeting legal duties based on current and forecast actual service delivery (‘implementation plan’), and meeting legal duties based on evidence about the wider number of children who need, and are entitled to, these services, including those not currently receiving them (‘full cost’). They compared the real funding allocations to provinces with these estimates and found that fiscal allocations amounted to less than 12 per cent, on average, of the low-cost estimate for funding needed to provide services to all children in need of and entitled to them. Further, they identified large provincial inequalities, with some provinces being allocated funding that brought them to as high as 24 per cent of the funding required to meet the low-cost estimate for services for all children requiring them, and others being allocated funding that was only 7 per cent of that required.
Funding formulas for children’s services in England include components for unmet need, measured by local or child-level indicators (c.f. [11,12,13]). While, at the time of writing, there is no data to explore whether the funding of services in total matches the estimated real costs of providing these services to all children who need and are entitled to them as Budlender et al. did, there is some value in knowing whether the spending of local authorities on children’s services is reducible to the needs of the population who are entitled to support from them, especially in contexts of retrenchment where block funding allocations may be repurposed to meet some statutory duties, such as child protection investigations, at the expense of others, such as family support and early help [1,14]. Greater analysis of the connection and disconnection between underlying needs and funding of services can highlight where national government policy is failing to create and maintain the conditions required to meet children’s rights, even at the basic level of proportionality addressed here.
2. Research Objective and Questions
The objective of this study was to assess how the association between the underlying needs of local child populations and expenditure on children’s services within local authorities has changed consequent to prolonged austerity policies. Three measures of local child population needs that local authorities are required to provide services for under Section 17 of the Children Act 1989—the most universal legal threshold for service provision—were identified. Lack of association between indicators of needs for which children have legal entitlements to support and the scale of local provision may indicate a funding system that is inadequate for delivering on children’s rights.
Specifically, the following research questions were explored:
- To what extent can the size of the child population, the proportion of children living in income deprived households, the proportion of children with special educational needs and disabilities (SEN) plans, and the proportion of children not attaining ‘good’ levels of development at age 5, explain variation in spending in local services between 2011 and 2019?
- How closely does variation in expenditure that cannot be explained by population size align with variation in these needs between 2011 and 2019?
- How has the strength of association between each indicator of population needs and expenditure per child on services changed between 2011 and 2019?
- Are residual, non-needs related components of expenditure per child higher or lower in more deprived local authorities?
3. Methods and Data
3.1. Data
Data were collated on local authority children’s services expenditure on all services as well as on services that focus largely on early help and family support, prior to child protection safeguarding and services for children in care. These data were taken from Section 251 outturns published by the Education Funding Agency and Education and Skills Funding Agency [15], for financial years between 2010–2011 and 2018–2019. This included all 152 local authorities in England. For simplicity, the ‘ending year’ of each fiscal year is presented in tables and figures. All expenditure was adjusted for inflation to the most recent year using GDP deflators provided by HM Treasury [16].
Estimates of the population aged 0 to 17 in each local authority from the Office for National Statistics [17], data on the proportion of children living in income deprived households (IDACI) from the Indices of Multiple Deprivation 2015 and 2019 [18,19], data on the proportion of children in each local authority’s school systems with special educational needs and disabilities (SEN) plans [20], and data on the proportion of children reaching ‘good’ levels of development in their early years foundation stage (by around age five) [21] were merged into a single local authority-level dataset. Income deprived households are defined as households in receipt of income support or unemployment benefits, or whose income is otherwise below 60 per cent of the national median income (for a detailed description, see [22]). The IDACI is only calculated approximately every four years; as such, the Indices of Multiple Deprivation 2015 IDACI scores, which are based on data from 2012, were used for years 2011, 2012, and 2013, and the Indices of Multiple Deprivation 2019 IDACI scores, which are based on data from 2015, were used for the other years. Results were compared with models that used only single IDACI measures for all years and no significant differences were found.
SEN plans reflect additional formal provision in education put in place for disabled children and young people, as well as those who might not have a disability but who otherwise have special educational needs determined after an assessment from their local authority. While many children who would benefit from SEN plans may not receive them, this measure is often used to capture the variation of children in each local authority who have, or may have, an impairment that affects their learning or participation at school.
Lastly, children are routinely assessed by education practitioners (typically, ‘reception’ class teachers) at around age five across seventeen early learning goals in three broad areas: personal, social, and emotional development; physical development; and communication and language. A three-point scale is used to identify which children have ‘emerging’ progress towards these goals, which have made the ‘expected’ progress towards these goals, and which have ‘exceeded’ these goals. The Department for Education then determines the number and proportion of children reaching ‘good’ levels of development from the returns of these aggregate scores from schools in each local authority.
All variables were entered into analytical models as percentages. Rates of children not reaching ‘good development’ were calculated so that the interpretation of each needs-related predictor was consistent. Descriptive statistics for all variables across the nine years are provided in Appendix A Table A1. Two local authorities were excluded from all models, the City of London and the Isles of Scilly, due to their very small child populations. Between 1 and 3 local authorities, depending on the year, had missing or undisclosed data for SEN plans and the proportion of children achieving good levels of development and were not included in analyses for those years.
3.2. Justification of Child Population Needs Indicators
SEN plans, ‘good development’, and income deprivation indicators of need were chosen because they reflect the needs in a population likely to meet or lead to the most universal threshold of statutory intervention from children’s social services under the Children Act 1989. Children who are disabled or whose development, in this case their learning, are likely to be impaired without additional support should receive this from local authorities as a statutory duty; this includes children with SEN plans and those not reaching good levels of development in their early years.
The proportion of children living in income deprived households reflects a general indicator of child population needs across a more holistic range of outcomes outside of education. Poverty has consistently been found to be a strong indicator of child welfare interventions [23,24,25,26] and is causally associated with child abuse and neglect [27], the prevention of which is a chief obligation of local authority children’s services. Further, there is an abundance of contemporary and historical evidence that children living in poverty are at heightened risk of impairments to their health [28,29]. Local authorities in England have duties not only to safeguard children from risk of abuse or support their needs after they arise or become acute, but—under the Children Act 1989—are required to provide proactive support for children who are unlikely to achieve or maintain a reasonable standard of health or development. As such, income deprivation reflects a key indicator of need for preventative provision. There is general consensus around its inclusion in funding formulas, as it has been a prominent component of previous formulas [11,12] as well as in the recent revised funding formula study [3].
3.3. Methods
Linear regression models for total expenditure on all children’s services and total expenditure on early help and family support services related expenditure for each year of data were estimated. Early help and family support services related expenditure was approximated by excluding children looked-after and child protection safeguarding lines of expenditure from remaining lines of expenditure to allow for comparison over time, as has been done in previous studies [1]. The R-squared value of each model was used as a measure of correspondence between predictors associated with needs for services and variation in local authority children’s services spending. Initial models included only child population as a predictor to derive the baseline level of correspondence between funding and needs associated with population size. The R-squared change when the three predictors of child population needs were added to the model was then calculated.
Next, expenditure per child for both kinds of spending was used in order to remove the population related component of expenditure variation in order to focus on how the strength of correspondence with each of the needs-based indicators had changed over time. Lastly, the absolute and relative differences in needs-associated expenditure per child and expenditure per child that could not be accounted for by variation in population needs had changed over time was assessed by calculating the predicted expenditure associated with needs based on the linear regression model coefficients, and subtracting the results from the observed expenditure in each local authority, before finally taking the median values for needs-related and non-needs related components for low, average, and high deprivation local authorities. A critical value of 5 per cent for the interpretation of all tests of statistical significance was used.
4. Findings
This section first presents results related to the changing association between all services and early help and family support expenditure, both in total and per capita. Secondly, changing effect sizes for each measure of local child population needs are considered. Lastly, patterns among residual, non-needs associated expenditure in low, average, and high deprivation local authorities are considered, as well as the absolute and relative changes in needs- and non-needs related components of spending per child in an average local authority in England. Results from all regression models, including R-squared statistics, are shown in Table 1.
4.1. Correspondence between Population, Need, and Expenditure on Children’s Services
Our models identified a changing association between levels of local child population needs and levels of local authority expenditure on children’s services. While the association between the four factors used to decompose variance in expenditure had grown slightly over the decade when considering spending on all children’s services, the correspondence between early help and family support services associated with Section 17 of the Children Act 1989 and underlying population need had decreased markedly. In 2011, the size of the child population, rates of children living in income deprived households, rates of schoolchildren with special educational needs, and the proportion of children not achieving ‘good’ levels of development at age five were collectively able to explain 89.3 per cent of all children’s services (‘total’) expenditure and 83.1 per cent of early help and family support associated expenditure. By 2019, the amount of variation explained by these factors had increased to 91.8 per cent for all expenditure, a 2.5 percentage point increase, but had declined to 73.6 per cent for early help and family support expenditure, a 15.7 percentage point decrease. In both cases the relative weight of needs-related factors appeared to decline over the decade.
Figure 1 shows the size of the decrease in needs-related association from models predicting expenditure by both child population and needs-related indicators. In 2011, the R-squared change between a population-only model predicting expenditure on all services and a needs and population based model was 0.112, suggesting a 11.2 percentage point increase in explanatory power. By 2019, this R-squared change had fallen by more than half to 0.044. The reduction in needs-associated variation in expenditure over time was more stark for early help and family support, which fell from 0.12 in 2011 to only a quarter of this amount in 2019 (0.03). These findings imply that the underlying needs of local populations have rapidly become dissociated from the funding for services that meets them.
Figure 2 illustrates the change in variance in per child expenditure explained by needs between 2011 and 2019, effectively removing the variation associated with population size. Both expenditure on all children’s services (‘all’) and on early help and family support services show a decline in association with need-related factors after 2010/11, with some recovery in the latter half of the decade. The amount of variation in local authority expenditure per child on all services that could be explained by the proportion of children affected by income deprivation, with special educational needs or disabilities, and with below ‘good’ levels of development, fell from 60.6 per cent in 2011 to 53.9 per cent in 2019, and the amount of variation in early help and family support-related services per child fell from 52.5 per cent to 21.4 per cent.
4.2. Absolute Changes in Expenditure Associated with Needs
Figure 3 shows the changing absolute amounts of funding per child associated with one percentage point increases in each measure of child population needs. One potential barrier to meaningful interpretation of these effect sizes comes from their correlation with one another, as this introduces multicollinearity among predictors, which may lead to bias distribution of effects [30]. This risk was assessed by observing the correlation between each pair of needs variables for every year between 2011 and 2019 and variance inflation factors (VIF) for each model. Results are presented in Appendix A Table A2 and Table A3. While the correlation between the rates of children not reaching good levels of development and the proportion of children living in income deprived households has increased over time, the VIF statistics indicate that any multicollinearity falls far below any common threshold (e.g., 5) where it would be considered problematic, with the highest VIF being 1.81. This indicates that the effect sizes for each needs-based predictor can be interpreted as independent though they may still act as proxies for unmeasured confounder variables.
Of the three predictors of child population needs only one, income deprivation affecting children, was consistently associated with higher levels of expenditure per child, in both total and early help/family support spending. In 2011, each percentage point increase in children living in income deprived households was associated with a statistically significant increase in all expenditure of £42.07 per child and an average increase in early help and family support expenditure of £20.87 per child. By 2019 these absolute changes in spending associated with income deprivation had fallen to £19.17 per child and £7.92 per child for all and early help/family support services respectively.
In only one instance over the nine years of data this study includes was the proportion of children on special educational needs plans or the proportion of children not achieving ‘good’ levels of development at age five associated with increases in expenditure. In 2019, an increase of 1 percentage point in the rates of children on special educational needs plans was associated with an increase of £65.95 per child in total spending; however, given the difference in the percentage of children on special educational needs plans between the 25th and 75th percentile of local authorities is only 0.79 percentage points, this should be contextualised as a small effect (see Appendix A Table A1). At three points in the decade the proportion of children not reaching ‘good’ levels of development at age 5 was associated with significant, or nearly significant, reductions in spending per child. In 2016, 2017, and 2018, one percentage point increases in ‘below good’ development rates were associated with £11.74 (p = 0.028), £17.99 (p = 0.002), and £10.73 (p = 0.07) per child decreases in total expenditure on all services, and £4.67 (p = 0.076), £7.76 (p = 0.006), and £5.44 (p = 0.056) per child decreases in early help and family support expenditure per child, respectively. These results raise important concerns about whether funding allocation from national government is aligned to the principles of the Children Act 1989.
4.3. Who Benefits from the Disconnect between Underlying Needs and Children’s Services Spending?
Lastly, comparisons were made between more affluent and more deprived local authorities to explore whether some appeared to benefit from the growing proportion of expenditure not associated with our three measures of need over time more than others. Knowing this is helpful because more deprived local authorities in England may still be able to spend more per child on services if our measures of need poorly capture a positive weighting of funding towards them, or if the strength of their association has been affected by model misspecification. Table 2 presents the median residual spending in three equally split quantiles (‘tertiles’) of local authorities reflecting low deprivation, average deprivation, and high deprivation.
The results show, firstly, that the median absolute amount of spending per child that is not associated with our three underlying needs measures has grown over time, while needs-related spending has been shrinking throughout the decade, reflecting a very large relative increase in non-needs associated expenditure. Secondly, that low deprivation local authorities typically have higher median non-needs related spending per child than high deprivation local authorities, but that this difference is not statistically significant in any year. Though less deprived local authorities tend to have greater non-needs related spending components on average, there is no conclusive evidence that this is a general rule. Nor is it necessarily the case that less deprived local authorities have grown to benefit more from the growing dissociation of needs and funding. However, the findings do suggest that the dissociation identified does not appear to be an artefact of our methodological approach.
Lastly, Table 3 shows the absolute and relative change in yearly needs-related and non-needs related expenditure per child for a statistically average (median) local authority, in order to illustrate the magnitude to which our funding and needs dissociation has changed available provision for meeting these needs. An average local authority saw a fall in the relative weight of the needs-related component of spending per child from 63.06 per cent of all spending in the first four years of the decade to 39.8 per cent of all spending in the last four years. For early help and family support related expenditure per child, the needs-related component was 61.5 per cent in the leading four years of the decade, but only 18.2 per cent in the trailing four years. In absolute terms, needs-associated spending fell from £587 per child on all services on average for the first four years to £338 per child on average for the last four years. For early help and family support services, the absolute change was from an average of £241 per child in the first four years to an average of only £43 per child in the last four.
5. Discussion
The analysis suggests that the current distribution of spending on children’s services in England is increasingly failing to reflect the underlying needs of child populations. Local authorities have less to spend, relatively and in absolute terms, on services for the children they have a legal duty to support. National governments have a responsibility to ensure that they create the conditions in which local authorities are able to meet the duties conferred by the Children Act through the distribution of central government funding. This section discusses the potential consequences of these findings for child welfare and protection as well as the potential causes of the growing lack of correspondence between spending and needs. Lastly, some limitations of the study approach are noted.
5.1. Consequences for Child Welfare and Protection
In England, under the Children Act 1989, the state has a duty to provide support for children and their families at an early and proactive stage through local children’s services under Section 17. National governments must, therefore, ensure that local services are adequately resourced to ensure these duties can be fulfilled. However, it is not clear that the funding of local services has ever reached a point of adequacy [7,31]. In the case of South Africa, where the costs of fully implementing a more universal approach to supporting children were estimated, the state’s fiscal policies were found to be woefully inadequate [8]; to our knowledge, a similar analysis of conditions in England has never been undertaken. These findings do indicate that the resourcing of children’s services in England is moving in the wrong direction, towards a system which ends up prioritising some children’s rights over others. This—over many outcomes or inequalities related justifications for a better reflection of need in the funding of services—should be a motivator for policy change. However, there are also compelling health and child welfare related implications of these findings that should be stated.
Poverty is a causal determinant of child abuse and neglect [27], as well as numerous health and development-related impairments [29]. The provision of early help and family support services in particular has been shown to reduce the numbers of children meeting the initial threshold for state intervention [5], reduce rates of children entering the care system [6], and safeguard children’s health and development [32]. Funding of these services has seen the greatest disassociation with underlying needs since 2010, but is the most essential to address ingrained structural inequalities in children’s social care, health, and wellbeing [23,28]. In close parallel to these findings, research by Bennett et al. [2] has shown that inequalities between more affluent and more deprived local authorities in England in the rates of children looked after (in the care system) increased significantly over an overlapping time period, 2004 to 2019, with this trend in growing inequality starting immediately following the financial crises of 2008/2009. The rate of children looked after is a key outcome measure for England, where no equivalent of rates of ‘substantiated abuse’ exists. It is often used to approximate, on one hand, increased exposure to child abuse and neglect as well as, on the other hand, decreased capacity (or willingness) of local authorities to provide services that make it possible for children to stay safely with their family of origin. In the long term, some families—those already in receipt of the multitude of health and wellbeing advantages of living in more affluent parts of the country—will be provided with relatively better funded services to support their children than those living in the most adverse conditions, further entrenching social inequalities.
5.2. Possible Causes of Dissociation between Needs and Service Provision
While the content of funding formulas is increasingly opaque, two features of children’s services and local government funding processes that may help explain some of the falling association between underlying population needs and local children’s services spending can be identified. This includes the recent impact of austerity on the rationing of children’s services, leading to a greater reliance on inequitably distributed local tax bases, and the persistent consequences of ‘limits on gains’ terms in funding formulas.
Funding of local authority children’s services has been reduced by 23 per cent between 2010 and 2019, with early intervention and family support services reduced by 46 per cent [33]. The distribution of funding cuts has been inequitable, with the most deprived local authorities being the most disadvantaged [1,33]. The relative, as opposed to absolute, nature of cuts to funding of central government grants and inequities in the amount of revenue that can be raised from local tax bases, such as from business rates [34,35], creates a disproportionate impact on local authorities with higher expenditure per child, which are predominantly concentrated in more deprived regions of England, where local services are often required to contend with more acute and complex needs. More affluent local authorities have been less affected in terms of spending per child by relative cuts to funding due to their lower absolute spending in general, but they have also been better able to raise revenue to cover these losses from larger local tax bases (for example, from business rates or council tax increases).
The second potential reason for dissociation concerns the use of funding allocation ‘ceilings’ or ‘limits on gains’—often arbitrary thresholds placed on the maximum possible increase between two years, despite the outcome of a needs-based funding formula. Sometimes these ceilings are set as a percentage allowable increase between two years and, at other times, they are created by a limit placed on the total amount of available funding predetermined in national budgets, which are usually aligned with policies on national debt and deficit rather than based on an assessment of needs and obligations. Occasionally, both ways of limiting gains are deployed (as in the early intervention funding formula for 2012–2013 [12]). For example, the ‘high needs national funding formula’ currently places a ‘limit on gains’ in funding of up to 12 per cent of the previous year’s allocation [13]. By contrast, the maximum amount of the Revenue Support Grant is determined by the Secretary of State for Communities and Local Government and is then distributed through the funding formula, as opposed to the funding formula being used to determine how much funding is likely to be required to meet local needs [12,36]. As such, fiscal policies come to override statutory commitments to children.
As more deprived local authorities with greater needs are more likely to have higher allocations of funding under any formula that includes indicators of need in its equation, they are more likely to hit absolute or relative limits on gains between two years. Though the impact of this on any given year may be small, the cumulative effect for a local authority whose funding is repeatedly reduced below what a funding formula implies they require over multiple years could be large and have consequences for the ability of local governments to meet their obligations to children. Further, local authorities with suddenly changing circumstances, for example, population spikes, or spikes in the numbers of children receiving free school meals (a commonly used indicator of need), may also experience shock dissociation where limits on gains abruptly misalign funding and needs, with ramifications far in the future.
5.3. Limitations
A limitation of this study is the lack of yearly estimates of income deprivation affecting children; the use of this measure at time points further away from their point of capture may decrease model R-squared statistics because the data no longer accurately captures the proportion of children living in low income families, not because the association between income deprivation and service expenditure has decreased. However, if this were the case it might be expected to be reflected by notable increases in the R-squared statistic in the years for which the IDACI scores were calculated (around 2012 and 2015). This does not appear to be the case and, as such, there can be some confidence that the findings are robust despite needing to extend IDACI scores across years. Some caution may still be warranted in the interpretation of model output for the years furthest away from IDACI measurement (2018 and 2019).
The system by which funding is allocated from central government for local authority children’s services in England continues to be opaque and has not garnered much academic attention. Names of funding formulas are repeatedly changed and annual local government finance reports contain highly variable information about how local government children’s services funding components are calculated. For example, the 2010/11 local government finance report includes a relatively clear description of the components included in the funding formula for children’s services broken down into ‘youth and community’, ‘central education functions’, and ‘children’s social care’, down to the funding per child associated with each needs factor [11].
By contrast, the 2013/14 report of the same name removes the general ‘children’s services’ section with the closest replacement being ‘early intervention’, with an obtuse relative funding formula that includes apparently arbitrary weightings, which make it difficult to assess the relative importance of each factor included, let alone the absolute resources allocated to each need [12]. By the most recent local government finance report [36], there is no longer any mention of children’s services-related components of funding; nor is there any mention of deprivation or population—the report contains only statements on area based shares of the central grant without any justification other than previous years’ funding. This is despite the fact that the reporting of spending, in the form of Section 251 returns, has remained relatively consistent over the decade. This greatly limits our capacity—and the capacity of others independent of government—to accurately scrutinise the distribution of funding to services.
It is not straightforwardly possible to address how children’s services funding is inequitably distributed according to the full range of children’s safety and health-related outcomes in England, such as whether they are ‘in need’ or on a child protection plan. This is because the designation of ‘child in need’ status or the implementation of a child protection plan itself depends on the capacity and resourcing of local children’s services. Where resources are scarce, it is well documented that thresholds for Section 17 (child in need) and Section 47 (child protection plan) interventions are increased [37,38,39] and, as such, some children who would be classed as ‘in need’ or placed on a child protection plan in a year with greater resources would not be in a year with fewer resources. This makes rates of these interventions an inappropriate way to try and identify funding equitability. However, it may be that other proxies for needs and outcomes from linked data can be integrated into future studies to improve the robustness of estimated funding inequity.
Lastly, the exclusion of other sources of funding used to provide services for local children may suppress or exacerbate the inequity reported here. For example, funding from philanthropic enterprises, community funds (such as the National Lottery Community Fund), government contracts, or central funding for services related to education or public health, may be present in such a way that it provides services that safeguard and improve children’s welfare to variable extents across the country. However, it is often not possible to track the scale of many of these sources of funding over time, or the extent to which they provide services specifically to children and young people within a locale, at least not without significant time and effort beyond the bounds of this research project. Nonetheless, were the inclusion of this funding to improve the equitability of resources available for supporting children across the country, it would raise further questions about whether it is appropriate, and in the spirit of the Children Act, for the equity of statutory local services to depend on piecemeal, uncoordinated, and often charitable provision.
6. Conclusions
Spending on children’s services in England has become increasingly dissociated from the underlying needs of, and obligations to, children over a decade characterised by public services retrenchment. Some of the reasons why this may be can be traced back to the interaction between austerity policies and technocratic features of funding formulas that undermine their capacity to distribute resources based on local populations. However, even in 2011, before austerity had truly ‘bitten’, underlying population needs were barely a predominant predictor of funding variation. As well as growing relative dissociation, the 2010 decade has also seen dramatic reductions in absolute levels of spending, with large amounts of expenditure unaccounted for by needs. Increasingly, the more problems local authorities experience, the less money they see; this is theorised to have contributed to growing regional inequalities in child welfare intervention and rising rates of children in the care system in England.
Four recommendations that could reverse this trend include: the revision of funding formulas to bring their components in line with children’s rights to support based on their needs; a robust evaluation of, and commitment to providing, the full costs required to finally meet the ambitions of the Children Act; the removal of limits on gains from funding formulas, which disproportionately disadvantage places with growing needs or populations, or places that experience sudden shocks in need, a pertinent consideration in the context of the COVID-19 pandemic; and the reversal of the run-down on central revenue grants which has also disproportionately disadvantaged services in deprived local authorities due to their smaller local tax bases.
The redistribution of funding from block or otherwise non-ringfenced grants between children’s services activities in contexts of inadequate resource and austerity appears to have imperilled some statutory obligations (e.g., duties to provide early help and family support to children in need under Section 17) in order to maintain others (such as the provision of social care or child protection). This fractures the spirit of the Children Act 1989 itself, which its architect Rupert Hughes described as being “designed to remind authorities that there is no sharp line between need and risk or between support and protection and that the services needed to be seen more as a continuum with a balanced provision targeted at the various degrees of need” (quoted in [31]).
The increasing obfuscation of technical decision making systems for the distribution of local authority funding in England is a barrier to accurately scrutinising the distribution of resources. Faced with these challenges, I propose there is value for researchers interested in child welfare inequality and its policy drivers in retrospectively analysing the association between variation in needs—which form the basis for service provision according to children’s rights—and variation in public provision. This can help us understand whether methods used to allocate funding are working to create the conditions needed to deliver on children’s rights in practice, not just in principle. However, this analysis only describes the relative picture; there has been little movement in research on the full and necessary costs of meeting the rights to support and services promised to children and families under the Children Act 1989. This evidence gap is especially important if the distance between what is needed and what is provided is even half the magnitude of that which was identified by Budlender and colleagues in South Africa [8].
Nigel Parton highlighted the problems created by this inadequacy of resources twenty-five years ago and, since then, the situation has arguably worsened [7,31]. The process of determining and allocating funding should be reorientated towards our collective commitments to children’s rights, and protected from misalignments caused by fiscal policies and practices that can end up overriding and undermining them. No society that willingly fails to create the conditions required to meet the rights of children laid out in their legislation can claim to promote child welfare or the rights of the child.
Funding
This research was supported by a British Academy Postdoctoral Fellowship grant no. PF21\210024.
Institutional Review Board Statement
Not applicable.
Informed Consent Statement
Not applicable.
Data Availability Statement
Data and code for the analyses contained in this article are available in R format on request.
Acknowledgments
I am grateful to Kathy Evans and Chloë Darlington from Children England (registered charity, no. 1044239), whose submissions to government spending reviews prompted this deeper investigation. I would also like to thank them for their comments on this article.
Conflicts of Interest
CJRW is a member of the Cafcass research advisory committee and has previously acted as an advisor to the Department for Education. Both positions have been unpaid. The founding sponsors had no role in the design of the study; in the collection, analyses, or interpretation of data; in the writing of the manuscript, and in the decision to publish the results.
Appendix A

Table A1.
Descriptive statistics for expenditure on all and early help services, expenditure per child, population size, proportion of children with special educational needs and disabilities (SEND) plans, proportion of children living in income deprived households (IDACI), and proportion of children not achieving a ‘good’ level of development by age five, from Financial Year Ending (FYE) 2011 to 2019.
| Year | N (Missing) | Mean | SD | Median | 25th Percentile | 75th Percentile | |
|---|---|---|---|---|---|---|---|
| Total expenditure (£100,000s) | 2011 | 0 | 707.91 | 453.97 | 590.36 | 419.92 | 855.27 |
| 2012 | 0 | 651.29 | 418.02 | 541.30 | 384.13 | 788.06 | |
| 2013 | 0 | 655.52 | 421.85 | 540.28 | 381.72 | 782.94 | |
| 2014 | 0 | 651.91 | 407.48 | 520.93 | 380.79 | 799.48 | |
| 2015 | 0 | 647.40 | 405.15 | 534.02 | 378.78 | 792.29 | |
| 2016 | 0 | 639.83 | 390.43 | 541.88 | 378.20 | 792.87 | |
| 2017 | 0 | 633.12 | 389.52 | 536.77 | 361.51 | 755.85 | |
| 2018 | 0 | 639.28 | 388.31 | 534.42 | 380.85 | 780.26 | |
| 2019 | 0 | 659.44 | 398.17 | 551.83 | 387.74 | 796.71 | |
| Early help and family support expenditure (£100,000s) | 2011 | 0 | 327.42 | 216.35 | 285.61 | 181.62 | 381.59 |
| 2012 | 0 | 270.98 | 177.30 | 224.18 | 149.46 | 312.90 | |
| 2013 | 0 | 252.55 | 167.87 | 208.37 | 131.83 | 307.49 | |
| 2014 | 0 | 239.27 | 163.96 | 197.35 | 135.04 | 283.84 | |
| 2015 | 0 | 226.26 | 157.78 | 184.56 | 120.96 | 269.81 | |
| 2016 | 0 | 201.90 | 129.32 | 162.17 | 112.87 | 256.09 | |
| 2017 | 0 | 185.18 | 122.88 | 151.84 | 101.45 | 235.46 | |
| 2018 | 0 | 173.13 | 114.67 | 143.69 | 97.35 | 206.67 | |
| 2019 | 0 | 169.39 | 113.44 | 146.61 | 88.82 | 206.44 | |
| Total expenditure per child | 2011 | 0 | 1043.16 | 366.64 | 968.96 | 776.93 | 1178.30 |
| 2012 | 0 | 921.51 | 275.74 | 877.95 | 741.89 | 1042.49 | |
| 2013 | 0 | 925.81 | 310.50 | 882.43 | 734.52 | 1046.73 | |
| 2014 | 0 | 914.49 | 270.84 | 866.79 | 716.29 | 1038.90 | |
| 2015 | 0 | 897.18 | 249.82 | 863.32 | 709.46 | 1035.71 | |
| 2016 | 0 | 881.29 | 240.32 | 838.94 | 702.60 | 1002.30 | |
| 2017 | 0 | 864.52 | 235.72 | 815.47 | 682.08 | 1004.22 | |
| 2018 | 0 | 866.90 | 230.24 | 822.14 | 679.30 | 1005.23 | |
| 2019 | 0 | 887.83 | 232.44 | 827.25 | 718.96 | 1049.43 | |
| Early help and family support expenditure per child | 2011 | 0 | 484.80 | 194.99 | 451.71 | 342.55 | 578.53 |
| 2012 | 0 | 384.38 | 134.74 | 356.02 | 306.03 | 450.90 | |
| 2013 | 0 | 355.21 | 138.45 | 328.76 | 265.70 | 405.29 | |
| 2014 | 0 | 330.50 | 116.82 | 304.68 | 250.09 | 375.03 | |
| 2015 | 0 | 309.73 | 119.56 | 281.93 | 235.14 | 349.35 | |
| 2016 | 0 | 277.88 | 99.58 | 252.63 | 219.31 | 317.83 | |
| 2017 | 0 | 251.23 | 94.86 | 238.23 | 189.73 | 285.59 | |
| 2018 | 0 | 234.95 | 91.29 | 219.38 | 178.13 | 276.74 | |
| 2019 | 0 | 229.11 | 93.04 | 214.74 | 173.23 | 265.11 | |
| Child population (Age 0–17) | 2011 | 0 | 76,105 | 56,620 | 56,994 | 41,506 | 87,648 |
| 2012 | 0 | 76,659 | 56,891 | 57,830 | 41,831 | 89,408 | |
| 2013 | 0 | 77,217 | 57,148 | 58,990 | 42,342 | 89,644 | |
| 2014 | 0 | 77,788 | 57,438 | 59,825 | 42,524 | 90,139 | |
| 2015 | 0 | 78,365 | 57,747 | 60,298 | 42,784 | 91,116 | |
| 2016 | 0 | 79,086 | 58,171 | 61,833 | 43,990 | 92,234 | |
| 2017 | 0 | 79,633 | 58,514 | 62,632 | 44,192 | 92,624 | |
| 2018 | 0 | 80,220 | 58,901 | 62,629 | 44,046 | 92,701 | |
| 2019 | 0 | 80,682 | 59,246 | 63,044 | 44,391 | 93,672 | |
| Income deprivation affecting children index (IDACI) (percentage) | 2012 | 0 | 21.12 | 6.94 | 20.83 | 15.81 | 26.35 |
| 2015 | 0 | 17.98 | 5.93 | 17.9 | 13.2 | 22.2 | |
| Special Educational Needs and Disability (SEN) Plans (percentage) | 2011 | 0 | 2.77 | 0.58 | 2.79 | 2.41 | 3.18 |
| 2012 | 0 | 2.78 | 0.59 | 2.79 | 2.43 | 3.19 | |
| 2013 | 0 | 2.81 | 0.60 | 2.78 | 2.46 | 3.19 | |
| 2014 | 0 | 2.82 | 0.59 | 2.77 | 2.48 | 3.21 | |
| 2015 | 0 | 2.84 | 0.57 | 2.84 | 2.51 | 3.21 | |
| 2016 | 0 | 2.82 | 0.57 | 2.81 | 2.49 | 3.12 | |
| 2017 | 0 | 2.85 | 0.57 | 2.89 | 2.48 | 3.15 | |
| 2018 | 0 | 2.97 | 0.59 | 3.00 | 2.62 | 3.31 | |
| 2019 | 0 | 3.15 | 0.60 | 3.17 | 2.79 | 3.49 | |
| Children not achieving ‘good’ levels of development at age 5 (percentage) | 2012 | 3 | 50.65 | 6.9 | 50.55 | 46 | 55.36 |
| 2013 | 2 | 59.69 | 5.42 | 59.91 | 56.63 | 63.35 | |
| 2014 | 2 | 65.92 | 4.69 | 65.87 | 63.12 | 68.55 | |
| 2015 | 2 | 69.09 | 3.96 | 69.44 | 66.19 | 71.54 | |
| 2016 | 2 | 70.61 | 3.6 | 70.65 | 68.31 | 73.11 | |
| 2017 | 2 | 71.43 | 3.18 | 71.3 | 69.39 | 73.57 | |
| 2018 | 0 | 71.78 | 3.1 | 71.75 | 69.72 | 73.95 |
Table A2.
Correlation between predictors of local authority expenditure FYE 2011–2019.
| 2011 | IDACI | SEN | DEV |
| Income Deprivation Affecting Children (IDACI) | 1 | ||
| Special Educational Needs & Disability (SEN) Plans | 0.021 | 1 | |
| ‘Poor’ levels of development at age 5 (DEV) | 0.284 | 0.003 | 1 |
| 2012 | IDACI | SEN | DEV |
| Income Deprivation Affecting Children (IDACI) | 1 | ||
| Special Educational Needs & Disability (SEN) Plans | −0.028 | 1 | |
| ‘Poor’ levels of development at age 5 (DEV) | 0.284 | −0.008 | 1 |
| 2013 | IDACI | SEN | DEV |
| Income Deprivation Affecting Children (IDACI) | 1 | ||
| Special Educational Needs & Disability (SEN) Plans | −0.038 | 1 | |
| ‘Poor’ levels of development at age 5 (DEV) | 0.445 | −0.112 | 1 |
| 2014 | IDACI | SEN | DEV |
| Income Deprivation Affecting Children (IDACI) | 1 | ||
| Special Educational Needs & Disability (SEN) Plans | −0.041 | 1 | |
| ‘Poor’ levels of development at age 5 (DEV) | 0.584 | −0.159 | 1 |
| 2015 | IDACI | SEN | DEV |
| Income Deprivation Affecting Children (IDACI) | 1 | ||
| Special Educational Needs & Disability (SEN) Plans | −0.013 | 1 | |
| ‘Poor’ levels of development at age 5 (DEV) | 0.593 | −0.134 | 1 |
| 2016 | IDACI | SEN | DEV |
| Income Deprivation Affecting Children (IDACI) | 1 | ||
| Special Educational Needs & Disability (SEN) Plans | 0.012 | 1 | |
| ‘Poor’ levels of development at age 5 (DEV) | 0.606 | −0.116 | 1 |
| 2017 | IDACI | SEN | DEV |
| Income Deprivation Affecting Children (IDACI) | 1 | ||
| Special Educational Needs & Disability (SEN) Plans | 0.068 | 1 | |
| ‘Poor’ levels of development at age 5 (DEV) | 0.610 | −0.078 | 1 |
| 2018 | IDACI | SEN | DEV |
| Income Deprivation Affecting Children (IDACI) | 1 | ||
| Special Educational Needs & Disability (SEN) Plans | 0.114 | 1 | |
| ‘Poor’ levels of development at age 5 (DEV) | 0.648 | −0.031 | 1 |
| 2019 | IDACI | SEN | DEV |
| Income Deprivation Affecting Children (IDACI) | 1 | ||
| Special Educational Needs & Disability (SEN) Plans | 0.158 | 1 | |
| ‘Poor’ levels of development at age 5 (DEV) | 0.648 | −0.014 | 1 |
Table A3.
Variance inflation factors (VIFs) for predictors.
| Model | Income Deprivation (IDACI) VIF | Special Educational Needs (SEN) VIF | ‘Poor’ Development (DEV) VIF |
|---|---|---|---|
| 2011 | 1.088 | 1.000 | 1.087 |
| 2012 | 1.089 | 1.002 | 1.087 |
| 2013 | 1.248 | 1.013 | 1.261 |
| 2014 | 1.523 | 1.029 | 1.56 |
| 2015 | 1.551 | 1.024 | 1.579 |
| 2016 | 1.594 | 1.023 | 1.616 |
| 2017 | 1.624 | 1.026 | 1.628 |
| 2018 | 1.777 | 1.033 | 1.756 |
| 2019 | 1.81 | 1.051 | 1.765 |
References
- Webb, C.J.R.; Bywaters, P. Austerity, Rationing and Inequity: Trends in Children’s and Young Peoples’ Services Expenditure in England between 2010 and 2015. Local Gov. Stud. 2018, 44, 391–415. [Google Scholar] [CrossRef]
- Bennett, D.L.; Mason, K.E.; Schlüter, D.K.; Wickham, S.; Lai, E.T.; Alexiou, A.; Barr, B.; Taylor-Robinson, D. Trends in Inequalities in Children Looked After in England between 2004 and 2019: A Local Area Ecological Analysis. BMJ Open 2020, 10, e041774. [Google Scholar] [CrossRef] [PubMed]
- Charlton, A.; Merritt, R. Developing a New CYPS Relative Need Formula; Ministry for Housing, Communities, and Local Government: London, UK, 2019.
- Carr-Hill, R.; Dixon, P.; Owen, C. Options for the Funding Formula for Children’s Social Services; Department for Children, Schools, and Families: London, UK, 2007.
- Webb, C.J.R. In Defence of Ordinary Help: Estimating the Effect of Early Help/Family Support Spending on Children in Need Rates in England Using ALT-SR. J. Soc. Policy 2021, 1–29. [Google Scholar] [CrossRef]
- Bennett, D.L.; Webb, C.J.R.; Mason, K.E.; Schlüter, D.K.; Fahy, K.; Alexiou, A.; Wickham, S.; Barr, B.; Taylor-Robinson, D. Funding for Preventative Children’s Services and Rates of Children Becoming Looked after: A Natural Experiment Using Longitudinal Area-Level Data in England. Child Youth Serv Rev 2021, 131, 106289. [Google Scholar] [CrossRef]
- Parton, N. Child Protection, Family Support and Social Work: A Critical Appraisal of the Department of Health Research Studies in Child Protection. Child Fam. Soc. Work 1996, 1, 3–11. [Google Scholar] [CrossRef]
- Budlender, D.; Proudlock, P.; Giese, S. Funding of Services Required by the Children’s Act; USAID: Washington, DC, USA, 2011.
- Budlender, D.; Williams, L.; Saal, Q.; Sineke, T.; Proudlock, P. Funding of Children’s Act-Related Services; Community Agency for Social Enquiry: Johannesburg, South Africa, 2011. [Google Scholar]
- Budlender, D.; Proudlock, P. Are Children’s Rights Prioritised at a Time of Budget Cuts? Assessing the Adequacy of the 2013/14 Social Development Budgets for Funding of Children’s Act Services; University of Cape Town: Cape Town, South Africa, 2013. [Google Scholar]
- Department for Communities and Local Government. The Local Government Finance Report (England) 2010/2011 2010; Department for Communities and Local Government: London, UK, 2010.
- Department for Communities and Local Government. The Local Government Finance Report (England) 2013/2014 2013; Department for Communities and Local Government: London, UK, 2013.
- Education & Skills Funding Agency High Needs Funding: 2021 to 2022 Operational Guide; Education & Skills Funding Agency: London, UK, 2021.
- Churchill, H. Retrenchment and Restructuring: Family Support and Children’s Services Reform under the Coalition. J. Child. Serv. 2013, 8, 209–222. [Google Scholar] [CrossRef]
- Education Funding Agency and Education and Skills Funding Agency. Section 251 Documents; Education & Skills Funding Agency: London, UK, 2021.
- HM Treasury. GDP Deflators at Market Prices, and Money GDP; HM Treasury: London, UK, 2021.
- Office for National Statistics. Estimates of the Population for the UK, England and Wales, Scotland and Northern Ireland; Office for National Statistics: London, UK, 2021.
- Ministry of Housing, Communities & Local Government. English Indices of Deprivation 2015; Ministry of Housing, Communities & Local Government: London, UK, 2015.
- Ministry of Housing, Communities & Local Government. English Indices of Deprivation 2019; Ministry of Housing, Communities & Local Government: London, UK, 2019.
- Department for Education. Statistics: Special Educational Needs (SEN); Department for Education: London, UK, 2021.
- Department for Education. Statistics: Early Years Foundation Stage Profile; Department for Education: London, UK, 2020.
- Ministry of Housing, Communities & Local Government. English Indices of Deprivation 2019: Technical Report; Department for Education: London, UK, 2019.
- Bywaters, P.; Brady, G.; Bunting, L.; Daniel, B.; Featherstone, B.; Jones, C.; Morris, K.; Scourfield, J.; Sparks, T.; Webb, C. Inequalities in English Child Protection Practice under Austerity: A Universal Challenge? Child Fam. Soc. Work 2018, 23, 53–61. [Google Scholar] [CrossRef]
- Webb, C.J.R.; Bywaters, P.; Elliott, M.; Scourfield, J. Income Inequality and Child Welfare Interventions in England and Wales. J. Epidemiol. Community Health 2020, 75, 251–257. [Google Scholar] [CrossRef] [PubMed]
- Keddell, E. Current Debates on Variability in Child Welfare Decision-Making: A Selected Literature Review. Soc. Sci. 2014, 3, 916–940. [Google Scholar] [CrossRef] [Green Version]
- Keddell, E.; Davie, G.; Barson, D. Child Protection Inequalities in Aotearoa New Zealand: Social Gradient and the ‘Inverse Intervention Law’. Child. Youth Serv. Rev. 2019, 104, 104383. [Google Scholar] [CrossRef]
- Bywaters, P.; Bunting, L.; Davidson, G.; Hanratty, J.; Mason, W.; McCartan, C.; Steils, N. The Relationship between Poverty, Child Abuse and Neglect: An Evidence Review; Joseph Rowntree Foundation: York, UK, 2016. [Google Scholar]
- Spencer, N. Poverty and Child Health, 2nd ed.; CRC Press: London, UK, 2018; ISBN 978-1-315-38529-7. [Google Scholar]
- Wickham, S.; Anwar, E.; Barr, B.; Law, C.; Taylor-Robinson, D. Poverty and Child Health in the UK: Using Evidence for Action. Arch. Dis. Child. 2016, 101, 759–766. [Google Scholar] [CrossRef] [PubMed] [Green Version]
- An Introduction to Statistical Learning: With Applications in R; James, G.; Witten, D.; Hastie, T.; Tibshirani, R. (Eds.) Springer Texts in statistics; Springer: New York, NY, USA, 2013; ISBN 978-1-4614-7137-0. [Google Scholar]
- Evans, K. Probing the Case for Change. The MJ. 19 July 2021. Available online: https://www.themj.co.uk/Probing-the-case-for-change/221008 (accessed on 19 July 2021).
- Yousafzai, A.K. If Not Now, Then When? The Importance of Intervening Early to Provide Family-Based Environments for All Children. Lancet Child Adolesc. Health 2020, 4, 565–566. [Google Scholar] [CrossRef]
- Action for Children. Children and Young People’s Services: Funding and Spending 2010/11 to 2018/19; Action for Children: London, UK, 2020. [Google Scholar]
- Beatty, C.; Fothergill, S. Hitting the Poorest Places Hardest: The Local and Regional Impact of Welfare Reform; Sheffield Hallam University: Sheffield, UK, 2013. [Google Scholar]
- Children England. Don’t Take Child Protection for Granted; Children England: London, UK, 2017; Available online: https://www.childrenengland.org.uk/dont-take-child-protection-for-granted (accessed on 19 July 2021).
- Ministry of Housing, Communities & Local Government. The Local Government Finance Report (England) 2020/2021; Ministry of Housing, Communities & Local Government: London, UK, 2020.
- Hood, R.; Goldacre, A.; Grant, R.; Jones, R. Exploring Demand and Provision in English Child Protection Services. Br. J. Soc. Work 2016, 46, 923–941. [Google Scholar] [CrossRef] [PubMed] [Green Version]
- Hood, R.; Goldacre, A.; Gorin, S.; Bywaters, P. Screen, Ration and Churn: Demand Management and the Crisis in Children’s Social Care. Br. J. Soc. Work. 2020, 50, 868–889. [Google Scholar] [CrossRef]
- Devaney, J. The Trouble with Thresholds: Rationing as a Rational Choice in Child and Family Social Work. Child Fam. Soc. Work. 2019, 24, 458–466. [Google Scholar] [CrossRef]
Figure 1.
R-squared statistics and R-squared changes for regression models predicting total children’s services spending and early help/family support children’s services spending by child population, proportion of children living in income deprived households (IDACI), proportion of children with special educational needs and disabilities (SEN) plans, and proportion of children not achieving a ‘good’ level of development by age five, from financial year ending (FYE) 2011 to 2019.
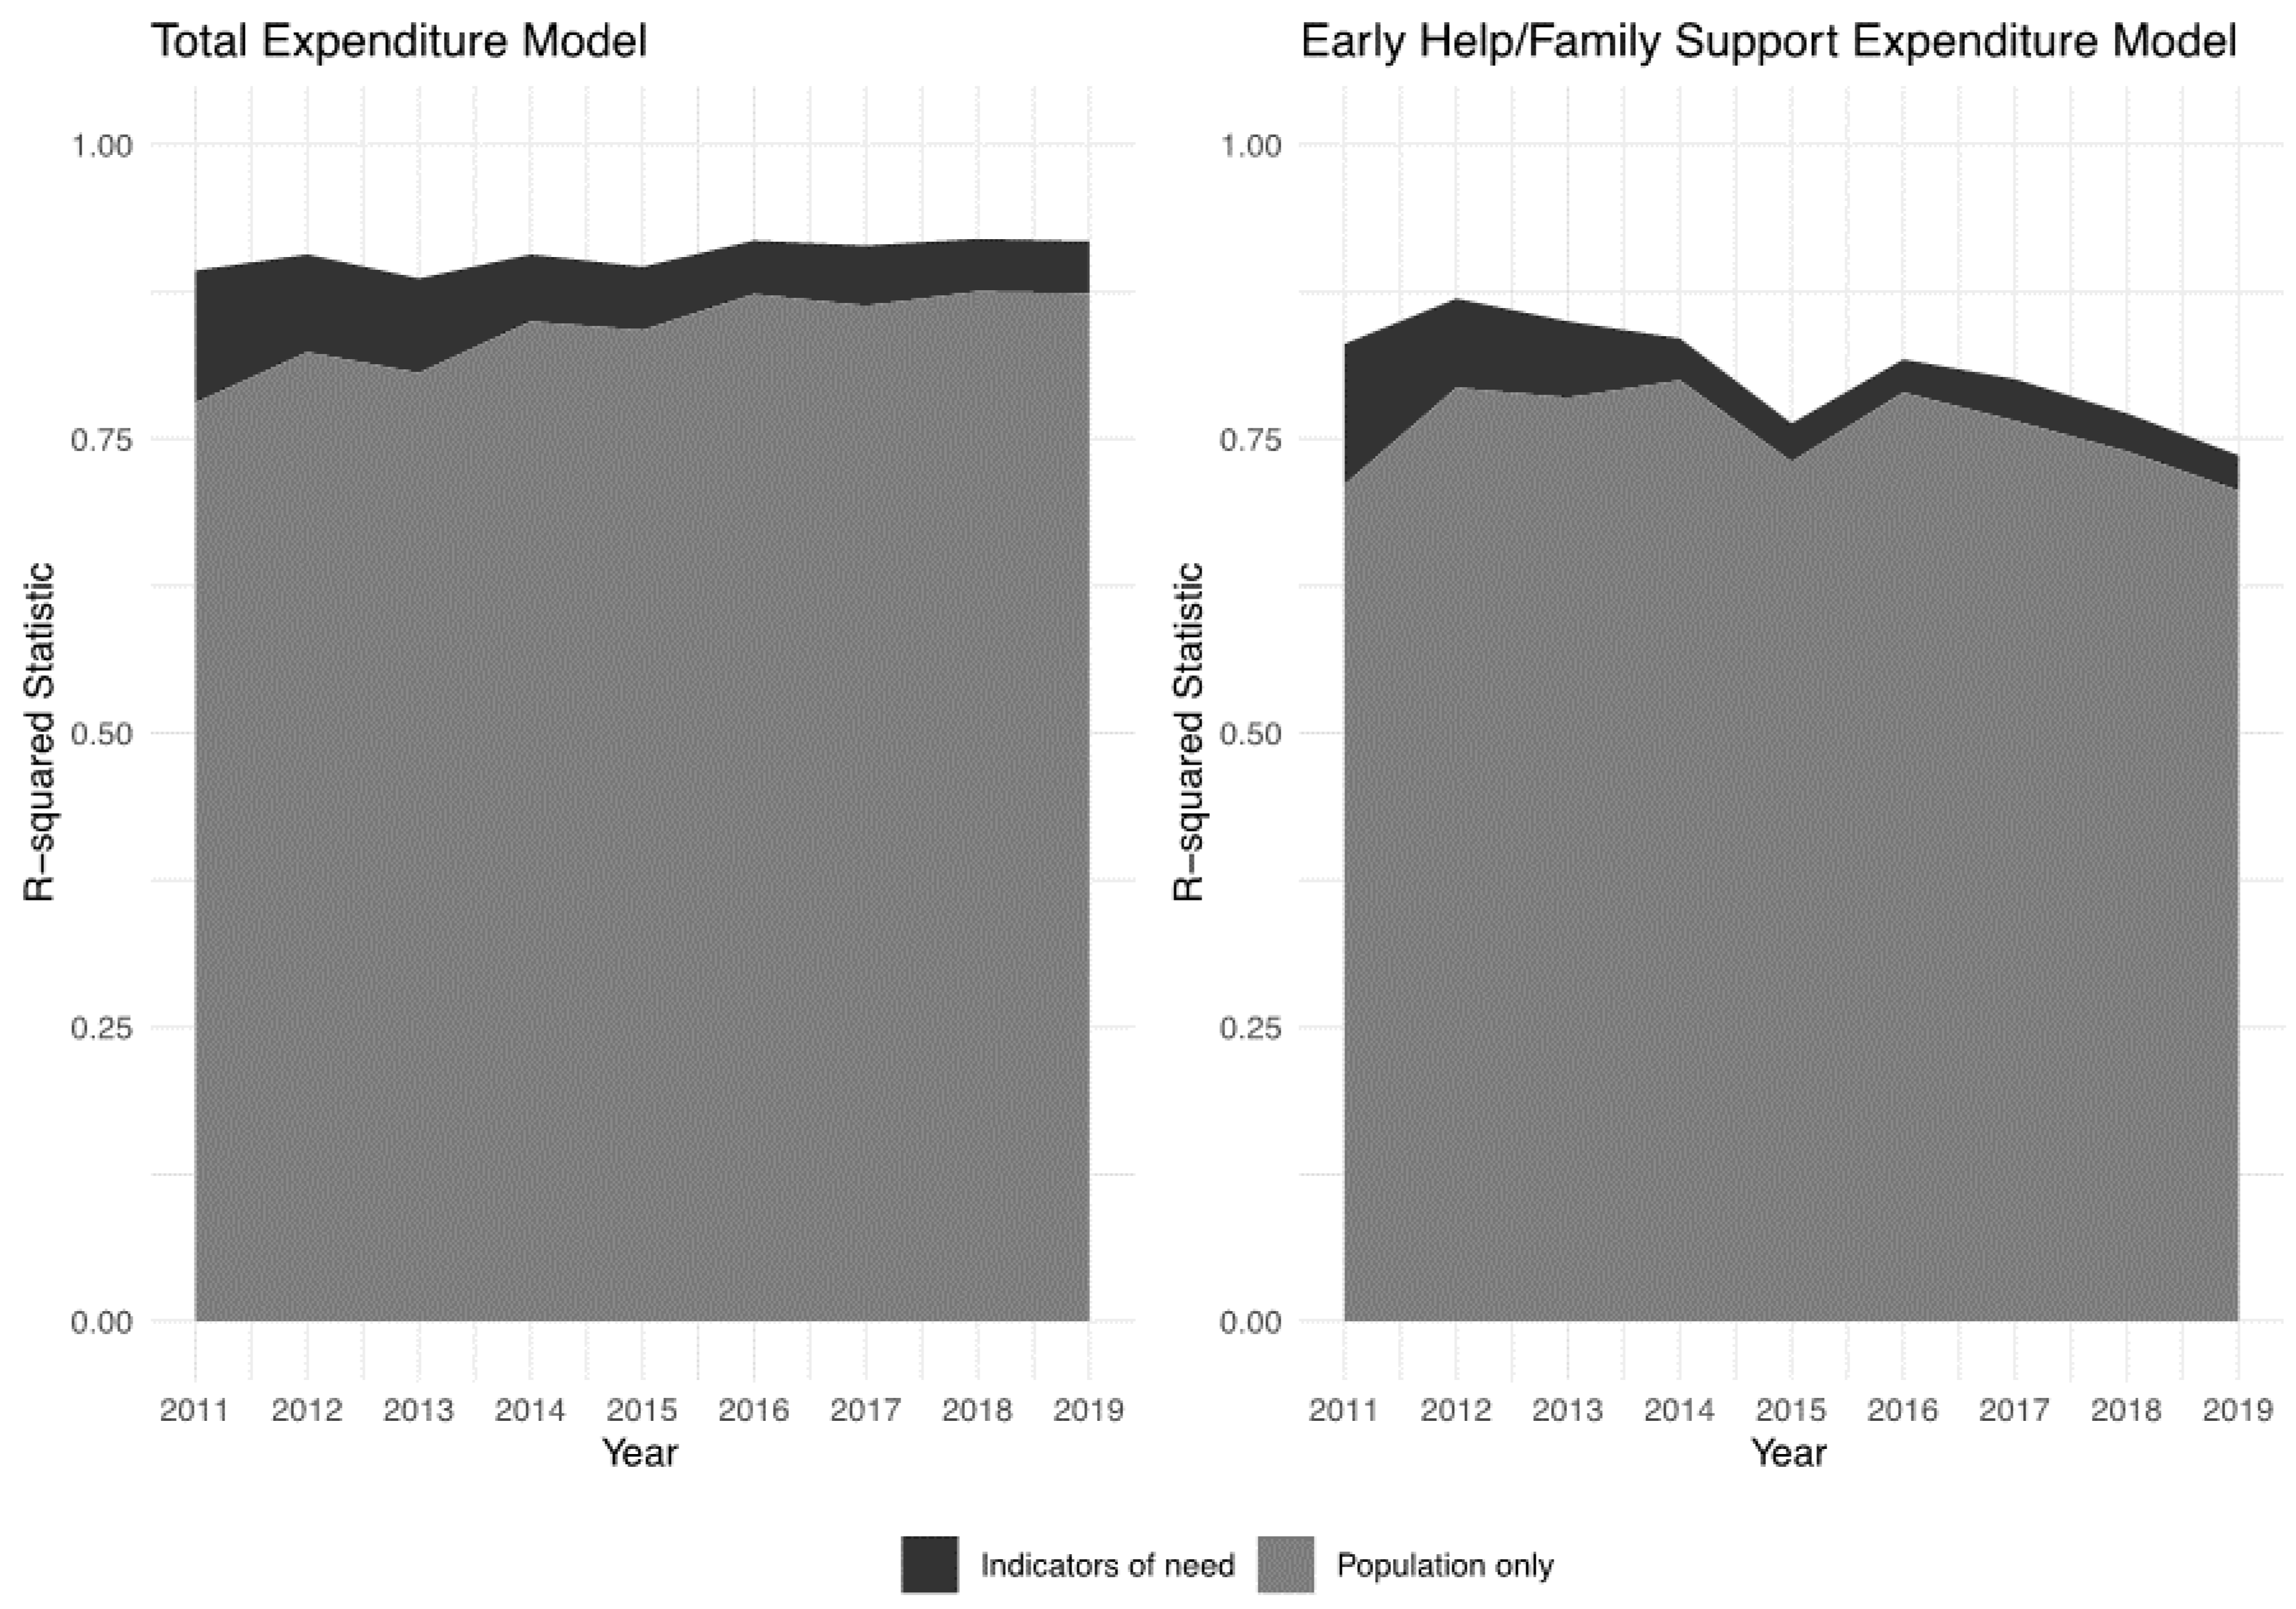
Figure 2.
R-squared statistics showing the variation in expenditure per child in local authorities in England explained by indicators of need (SEN plans, IDACI, and ‘poor’ development at age 5) between FYE 2011 and 2019.
Figure 2.
R-squared statistics showing the variation in expenditure per child in local authorities in England explained by indicators of need (SEN plans, IDACI, and ‘poor’ development at age 5) between FYE 2011 and 2019.
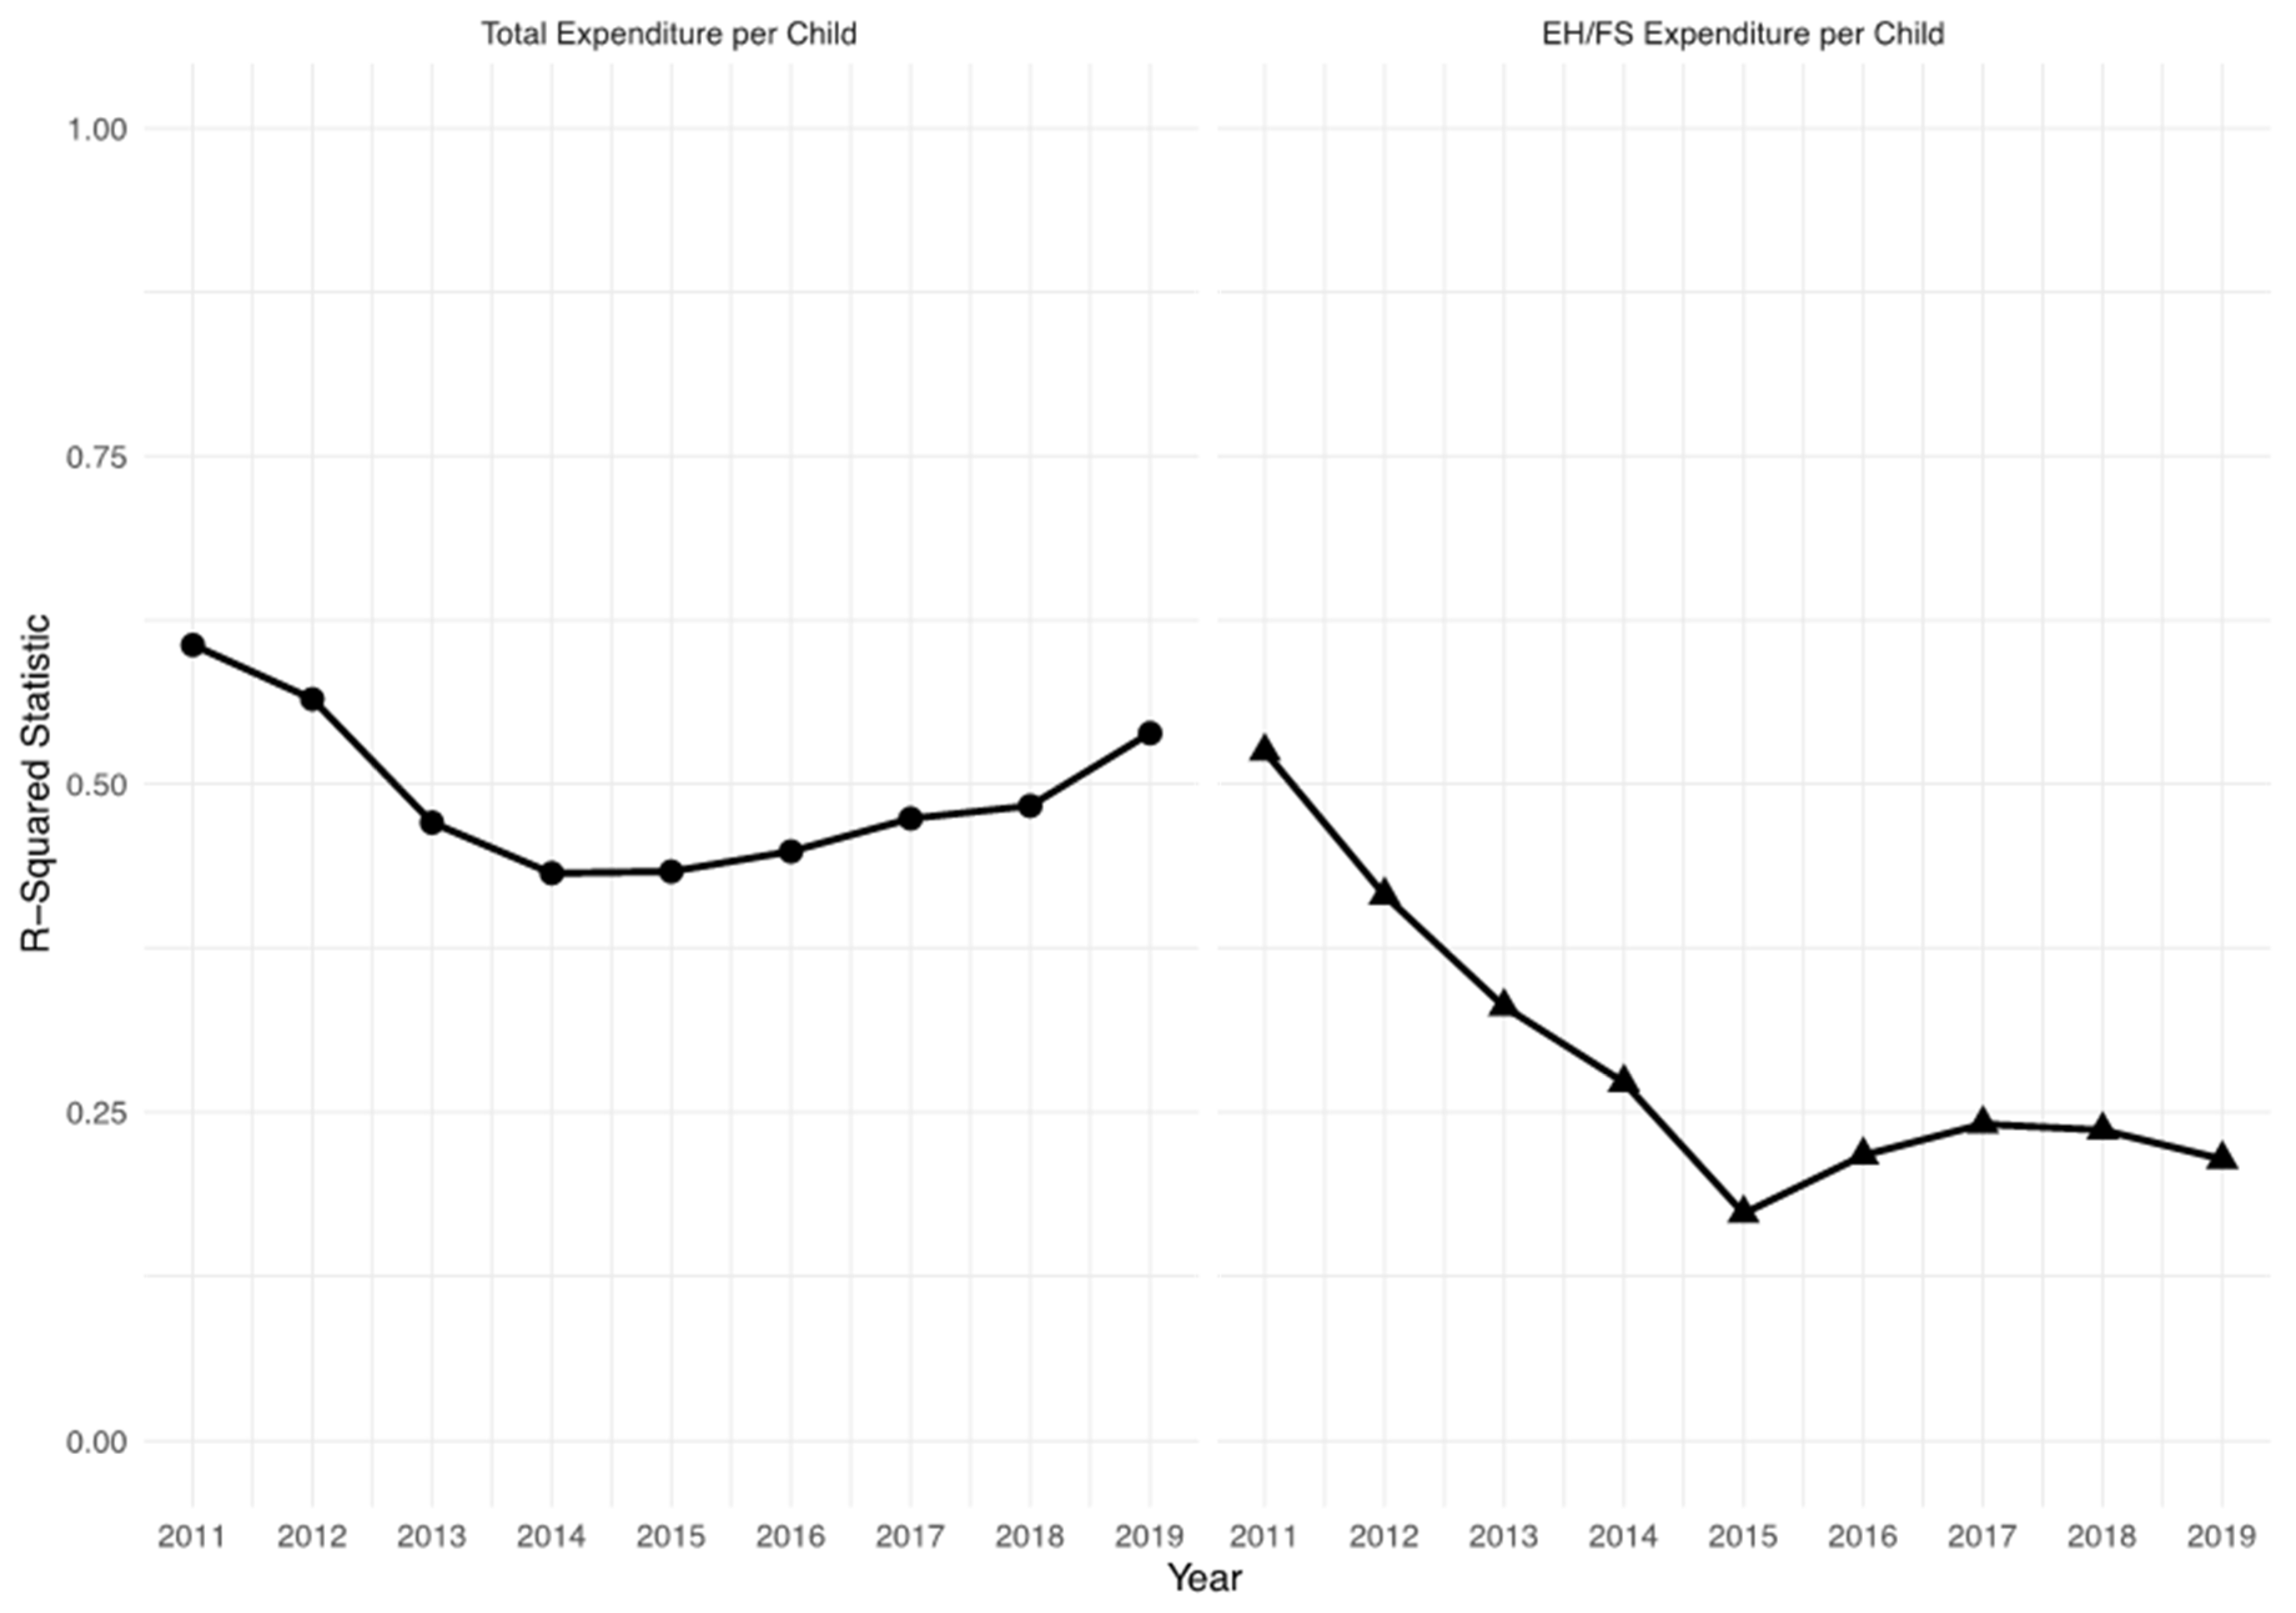
Figure 3.
Comparison of effect sizes on local authority expenditure per child on all and early help/family support services for IDACI, SEN plans, and proportions of children not achieving ‘good’ development at age 5 between FYE 2011 and 2019, with 95 per cent parametric confidence intervals.
Figure 3.
Comparison of effect sizes on local authority expenditure per child on all and early help/family support services for IDACI, SEN plans, and proportions of children not achieving ‘good’ development at age 5 between FYE 2011 and 2019, with 95 per cent parametric confidence intervals.
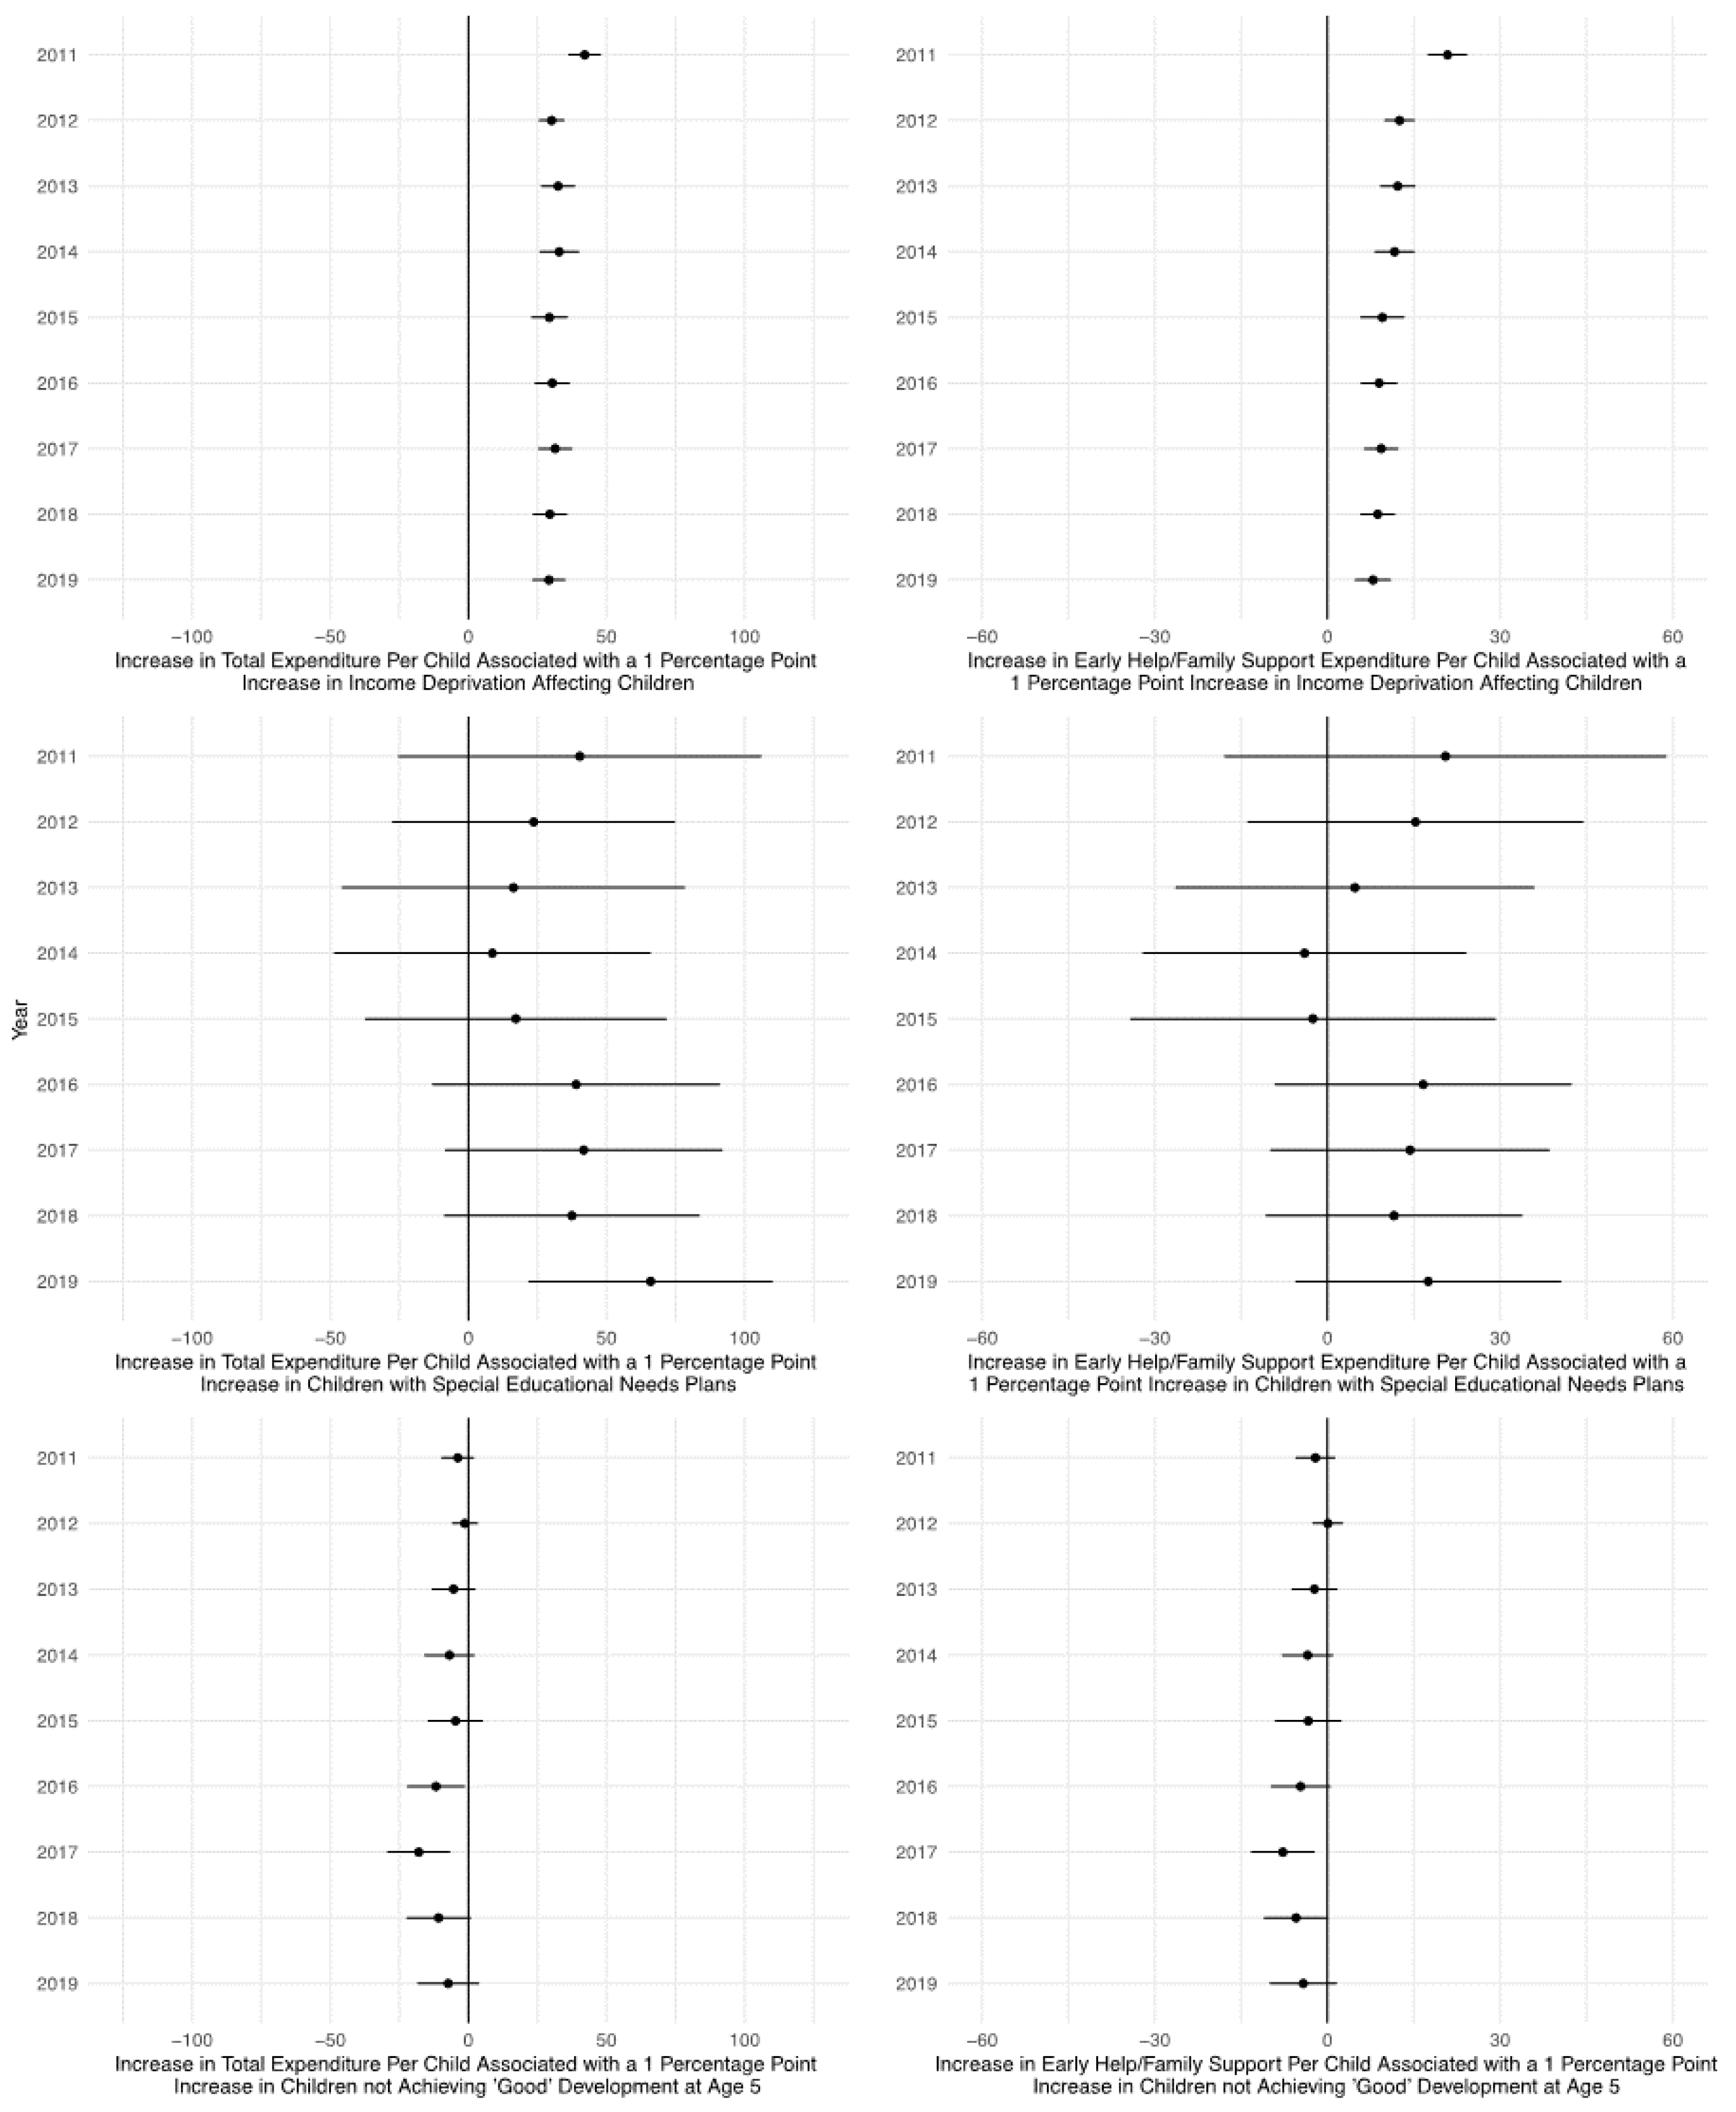
Table 1.
Linear regression model results.
| Intercept | Population (Age 0–18) (10,000 s) | Income Deprivation (IDACI) (%) | Special Educational Needs (SEN) (%) | Not Achieving ‘Good’ Development (%) | R-Squared | ||||||||
| Total Expenditure (£100,000 s) (Population Only) | B (SE) | p | B (SE) | p | B (SE) | p | B (SE) | p | B (SE) | p | R2 | p | N |
| 2011 | 168.68 (29.33) | <0.001 | 70.85 (3.1) | <0.001 | 0.781 | <0.001 | 149 | ||||||
| 2012 | 140.03 (24.25) | <0.001 | 66.69 (2.54) | <0.001 | 0.824 | <0.001 | 149 | ||||||
| 2013 | 143.81 (25.73) | <0.001 | 66.27 (2.68) | <0.001 | 0.806 | <0.001 | 149 | ||||||
| 2014 | 143.18 (21.9) | <0.001 | 65.4 (2.27) | <0.001 | 0.85 | <0.001 | 149 | ||||||
| 2015 | 142.77 (22.34) | <0.001 | 64.39 (2.3) | <0.001 | 0.842 | <0.001 | 149 | ||||||
| 2016 | 143.84 (19.33) | <0.001 | 62.71 (1.97) | <0.001 | 0.873 | <0.001 | 149 | ||||||
| 2017 | 140.6 (20.04) | <0.001 | 61.85 (2.03) | <0.001 | 0.863 | <0.001 | 149 | ||||||
| 2018 | 144.46 (19.08) | <0.001 | 61.68 (1.92) | <0.001 | 0.875 | <0.001 | 149 | ||||||
| 2019 | 152.59 (19.69) | <0.001 | 62.82 (1.97) | <0.001 | 0.874 | <0.001 | 149 | ||||||
| Intercept | Population (Age 0–18) (10,000 s) | Income Deprivation (IDACI) (%) | Special Educational Needs (SEN) (%) | Not Achieving ‘Good’ Development (%) | R-Squared | ||||||||
| Total Expenditure (£100,000 s) (Population and Needs) | B (SE) | p | B (SE) | p | B (SE) | p | B (SE) | p | B (SE) | p | R2 | p | N |
| 2011 | −271.69 (115.8) | 0.02 | 77.14 (2.29) | <0.001 | 22.96 (1.92) | <0.001 | 12.69 (21.59) | 0.558 | −2.57 (1.91) | 0.182 | 0.893 | <0.001 | 146 |
| 2012 | −216.02 (100.84) | 0.034 | 71.7 (1.96) | <0.001 | 18.14 (1.65) | <0.001 | 8.46 (18.45) | 0.647 | −1.79 (1.65) | 0.278 | 0.907 | <0.001 | 146 |
| 2013 | −145.29 (117.25) | 0.217 | 71.18 (2.16) | <0.001 | 18.65 (1.97) | <0.001 | 1.59 (20.01) | 0.937 | −3.65 (2.49) | 0.145 | 0.886 | <0.001 | 147 |
| 2014 | −60.73 (103.97) | 0.56 | 68.98 (1.86) | <0.001 | 18.01 (2.22) | <0.001 | −8.84 (17.92) | 0.623 | −3.59 (2.79) | 0.201 | 0.907 | <0.001 | 147 |
| 2015 | −166 (115.1) | 0.151 | 67.81 (1.95) | <0.001 | 15.88 (2.35) | <0.001 | −6.21 (19.51) | 0.751 | 0.47 (3.49) | 0.894 | 0.896 | <0.001 | 147 |
| 2016 | −36.16 (101.19) | 0.721 | 65.92 (1.66) | <0.001 | 15.63 (2.04) | <0.001 | −0.14 (16.78) | 0.994 | −4.29 (3.33) | 0.2 | 0.919 | <0.001 | 147 |
| 2017 | 57.52 (111.44) | 0.607 | 65.17 (1.69) | <0.001 | 17.17 (2.1) | <0.001 | −2 (17.25) | 0.908 | −8.66 (3.86) | 0.027 | 0.914 | <0.001 | 147 |
| 2018 | −85.15 (106.93) | 0.427 | 64.65 (1.61) | <0.001 | 14.71 (2.11) | <0.001 | −5.52 (15.74) | 0.726 | −1.49 (3.93) | 0.704 | 0.92 | <0.001 | 149 |
| 2019 | −145.95 (112.85) | 0.198 | 65.95 (1.66) | <0.001 | 14.44 (2.21) | <0.001 | 7.52 (16.37) | 0.647 | −0.35 (4.09) | 0.931 | 0.918 | <0.001 | 149 |
| Intercept | Population (Age 0–18) (10,000 s) | Income Deprivation (IDACI) (%) | Special Educational Needs (SEN) (%) | Not Achieving ‘Good’ Development (%) | R-Squared | ||||||||
| Early Help/Family Support Expenditure (£100,000 s) (Population Only) | B (SE) | p | B (SE) | p | B (SE) | p | B (SE) | p | B (SE) | p | R2 | p | N |
| 2011 | 82.18 (16.05) | <0.001 | 32.22 (1.69) | <0.001 | 0.711 | <0.001 | 149 | ||||||
| 2012 | 58.15 (11.13) | <0.001 | 27.76 (1.17) | <0.001 | 0.794 | <0.001 | 149 | ||||||
| 2013 | 51.59 (10.78) | <0.001 | 26.03 (1.12) | <0.001 | 0.785 | <0.001 | 149 | ||||||
| 2014 | 40.7 (10.18) | <0.001 | 25.53 (1.05) | <0.001 | 0.8 | <0.001 | 149 | ||||||
| 2015 | 43.23 (11.37) | <0.001 | 23.36 (1.17) | <0.001 | 0.731 | <0.001 | 149 | ||||||
| 2016 | 45.68 (8.25) | <0.001 | 19.75 (0.84) | <0.001 | 0.79 | <0.001 | 149 | ||||||
| 2017 | 38.87 (8.28) | <0.001 | 18.37 (0.84) | <0.001 | 0.765 | <0.001 | 149 | ||||||
| 2018 | 38.84 (8.15) | <0.001 | 16.74 (0.82) | <0.001 | 0.739 | <0.001 | 149 | ||||||
| 2019 | 39.58 (8.56) | <0.001 | 16.09 (0.86) | <0.001 | 0.706 | <0.001 | 149 | ||||||
| Intercept | Population (Age 0–18) (10,000 s) | Income Deprivation (IDACI) (%) | Special Educational Needs (SEN) (%) | Not Achieving ‘Good’ Development (%) | R-Squared | ||||||||
| Early Help/Family Support Expenditure (£100,000 s) (Population and Needs) | B (SE) | p | B (SE) | p | B (SE) | p | B (SE) | p | B (SE) | p | R2 | p | N |
| 2011 | −90.34 (69.36) | 0.195 | 35.19 (1.37) | <0.001 | 11.41 (1.15) | <0.001 | 0.6 (12.93) | 0.963 | −1.87 (1.15) | 0.106 | 0.831 | <0.001 | 146 |
| 2012 | −88.16 (50.62) | 0.084 | 29.77 (0.99) | <0.001 | 7.34 (0.83) | <0.001 | 5.37 (9.26) | 0.563 | −0.78 (0.83) | 0.345 | 0.869 | <0.001 | 146 |
| 2013 | −47 (53.59) | 0.382 | 27.76 (0.99) | <0.001 | 6.65 (0.9) | <0.001 | 0.98 (9.14) | 0.915 | −1.44 (1.14) | 0.209 | 0.85 | <0.001 | 147 |
| 2014 | −19.13 (55.53) | 0.731 | 26.61 (1) | <0.001 | 5.44 (1.18) | <0.001 | −5.88 (9.57) | 0.54 | −0.87 (1.49) | 0.561 | 0.835 | <0.001 | 147 |
| 2015 | −39.6 (67.67) | 0.559 | 24.32 (1.15) | <0.001 | 4.58 (1.38) | 0.001 | −6.3 (11.47) | 0.584 | 0.36 (2.05) | 0.863 | 0.763 | <0.001 | 147 |
| 2016 | −0.08 (50.16) | 0.999 | 20.62 (0.82) | <0.001 | 4.14 (1.01) | <0.001 | 3.35 (8.32) | 0.688 | −1.53 (1.65) | 0.355 | 0.818 | <0.001 | 147 |
| 2017 | 26.86 (53.63) | 0.617 | 19.29 (0.81) | <0.001 | 4.71 (1.01) | <0.001 | 2.1 (8.3) | 0.801 | −3.01 (1.86) | 0.107 | 0.801 | <0.001 | 147 |
| 2018 | −8.63 (53.4) | 0.872 | 17.55 (0.8) | <0.001 | 3.91 (1.05) | <0.001 | 1.08 (7.86) | 0.891 | −1.15 (1.96) | 0.559 | 0.772 | <0.001 | 149 |
| 2019 | −17.11 (57.69) | 0.767 | 16.89 (0.85) | <0.001 | 3.61 (1.13) | 0.002 | 4.35 (8.37) | 0.604 | −1.01 (2.09) | 0.631 | 0.736 | <0.001 | 149 |
| Intercept | Population (Age 0–18) (10,000 s) | Income Deprivation (IDACI) (%) | Special Educational Needs (SEN) (%) | Not Achieving ‘Good’ Development (%) | R-Squared | ||||||||
| Total Expenditure per Child | B (SE) | p | B (SE) | p | B (SE) | p | B (SE) | p | B (SE) | p | R2 | p | N |
| 2011 | 230.48 (169.25) | 0.175 | 42.07 (2.92) | <0.001 | 40.33 (33.46) | 0.23 | −3.85 (2.94) | 0.193 | 0.606 | <0.001 | 146 | ||
| 2012 | 279.1 (133.68) | 0.039 | 30.11 (2.29) | <0.001 | 23.62 (26.04) | 0.366 | −1.29 (2.31) | 0.577 | 0.565 | <0.001 | 146 | ||
| 2013 | 408.02 (176.83) | 0.022 | 32.47 (3.05) | <0.001 | 16.32 (31.6) | 0.606 | −5.37 (3.93) | 0.174 | 0.471 | <0.001 | 147 | ||
| 2014 | 528.93 (164.86) | 0.002 | 32.88 (3.56) | <0.001 | 8.69 (29.16) | 0.766 | −6.83 (4.56) | 0.136 | 0.432 | <0.001 | 147 | ||
| 2015 | 461.43 (160.8) | 0.005 | 29.34 (3.29) | <0.001 | 17.14 (27.76) | 0.538 | −4.65 (4.99) | 0.353 | 0.433 | <0.001 | 147 | ||
| 2016 | 566.59 (157.92) | <0.001 | 30.38 (3.17) | <0.001 | 38.96 (26.5) | 0.144 | −11.74 (5.27) | 0.028 | 0.449 | <0.001 | 147 | ||
| 2017 | 689.99 (163.3) | <0.001 | 31.41 (3.07) | <0.001 | 41.76 (25.53) | 0.104 | −17.99 (5.74) | 0.002 | 0.474 | <0.001 | 147 | ||
| 2018 | 527.76 (159.28) | 0.001 | 29.52 (3.09) | <0.001 | 37.45 (23.51) | 0.113 | −10.73 (5.87) | 0.07 | 0.483 | <0.001 | 149 | ||
| 2019 | 361.61 (154.25) | 0.02 | 29.17 (2.97) | <0.001 | 65.95 (22.44) | 0.004 | −7.3 (5.61) | 0.196 | 0.539 | <0.001 | 149 | ||
| Intercept | Population (Age 0–18) (10,000 s) | Income Deprivation (IDACI) (%) | Special Educational Needs (SEN) (%) | Not Achieving ‘Good’ Development (%) | R-Squared | ||||||||
| Early Help/Family Support Expenditure per Child | B (SE) | p | B (SE) | p | B (SE) | p | B (SE) | p | B (SE) | p | R2 | p | N |
| 2011 | 90.34 (98.92) | 0.363 | 20.87 (1.7) | <0.001 | 20.49 (19.55) | 0.296 | −2.1 (1.72) | 0.225 | 0.525 | <0.001 | 146 | ||
| 2012 | 73.21 (76.2) | 0.338 | 12.51 (1.3) | <0.001 | 15.28 (14.84) | 0.305 | 0.06 (1.31) | 0.961 | 0.415 | <0.001 | 146 | ||
| 2013 | 174.21 (88.82) | 0.052 | 12.21 (1.53) | <0.001 | 4.77 (15.87) | 0.764 | −2.26 (1.97) | 0.254 | 0.33 | <0.001 | 147 | ||
| 2014 | 248.82 (80.77) | 0.002 | 11.67 (1.74) | <0.001 | −3.98 (14.29) | 0.781 | −3.45 (2.23) | 0.124 | 0.272 | <0.001 | 147 | ||
| 2015 | 247.77 (93.6) | 0.009 | 9.54 (1.92) | <0.001 | −2.53 (16.16) | 0.876 | −3.33 (2.9) | 0.253 | 0.173 | <0.001 | 147 | ||
| 2016 | 205.99 (78.19) | 0.009 | 8.95 (1.57) | <0.001 | 16.63 (13.12) | 0.207 | −4.67 (2.61) | 0.076 | 0.217 | <0.001 | 147 | ||
| 2017 | 262.73 (78.92) | 0.001 | 9.35 (1.48) | <0.001 | 14.33 (12.34) | 0.247 | −7.76 (2.77) | 0.006 | 0.241 | <0.001 | 147 | ||
| 2018 | 197.31 (76.8) | 0.011 | 8.73 (1.49) | <0.001 | 11.55 (11.34) | 0.31 | −5.44 (2.83) | 0.056 | 0.236 | <0.001 | 149 | ||
| 2019 | 149.94 (80.6) | 0.065 | 7.92 (1.55) | <0.001 | 17.52 (11.72) | 0.137 | −4.19 (2.93) | 0.155 | 0.214 | <0.001 | 149 | ||
Table 2.
Median ‘non-needs related’ expenditure per child amount by tertile of income deprivation affecting children index (IDACI).
Table 2.
Median ‘non-needs related’ expenditure per child amount by tertile of income deprivation affecting children index (IDACI).
| Median Non-Needs Associated Spending per Child | ||||
|---|---|---|---|---|
| Total Expenditure | Low Deprivation | Average Deprivation | High Deprivation | Kruskal–Wallis Test |
| 2011 | 235.84 | 175.20 | 157.22 | 5.70, p = 0.058 |
| 2012 | 278.53 | 245.77 | 237.51 | 1.70, p = 0.427 |
| 2013 | 409.72 | 366.96 | 393.04 | 2.08, p = 0.354 |
| 2014 | 512.34 | 504.53 | 477.56 | 0.44, p = 0.803 |
| 2015 | 441.07 | 444.73 | 403.67 | 1.05, p = 0.592 |
| 2016 | 549.91 | 537.86 | 507.38 | 0.91, p = 0.635 |
| 2017 | 682.80 | 669.32 | 649.76 | 1.14, p = 0.565 |
| 2018 | 527.46 | 495.34 | 483.79 | 0.80, p = 0.671 |
| 2019 | 357.83 | 312.03 | 334.65 | 1.20, p = 0.550 |
| EH/FS Expenditure | Low Deprivation | Average Deprivation | High Deprivation | Kruskal–Wallis Test |
| 2011 | 95.81 | 60.11 | 85.68 | 1.05, p = 0.591 |
| 2012 | 84.12 | 47.86 | 41.13 | 3.58, p = 0.167 |
| 2013 | 170.04 | 166.41 | 134.00 | 5.22, p = 0.074 |
| 2014 | 235.22 | 227.91 | 243.05 | 0.13, p = 0.937 |
| 2015 | 238.66 | 225.36 | 218.06 | 1.01, p = 0.604 |
| 2016 | 196.52 | 181.31 | 183.86 | 0.27, p = 0.875 |
| 2017 | 252.51 | 247.48 | 240.56 | 0.54, p = 0.765 |
| 2018 | 196.91 | 186.44 | 176.24 | 1.13, p = 0.568 |
| 2019 | 154.39 | 134.13 | 134.47 | 1.60, p = 0.449 |
Table 3.
Absolute and relative differences in non-needs related and needs-related components of spending per child.
Table 3.
Absolute and relative differences in non-needs related and needs-related components of spending per child.
| Total Expenditure | ‘Non-Needs’ Component | ‘Needs’ Component | ‘Non-Needs’ Component (%) | ‘Needs’ Component (%) |
| 2011 | 202.99 | 803.23 | 20.17 | 79.83 |
| 2012 | 251.38 | 640.52 | 28.18 | 71.82 |
| 2013 | 392.09 | 521.4 | 42.92 | 57.08 |
| 2014 | 500.74 | 385.74 | 56.49 | 43.51 |
| 2015 | 437.08 | 439.92 | 49.84 | 50.16 |
| 2016 | 532.4 | 318.62 | 62.56 | 37.44 |
| 2017 | 668.61 | 172.77 | 79.47 | 20.53 |
| 2018 | 505.41 | 339.68 | 59.81 | 40.19 |
| 2019 | 335.34 | 522.63 | 39.08 | 60.92 |
| EH/FS Expenditure | ‘Non-Needs’ Component | ‘Needs’ Component | ‘Non-Needs’ Component (%) | ‘Needs’ Component (%) |
| 2011 | 81.1 | 388.99 | 17.25 | 82.75 |
| 2012 | 60.05 | 311.96 | 16.14 | 83.86 |
| 2013 | 158.24 | 180.68 | 46.69 | 53.31 |
| 2014 | 234.1 | 82.77 | 73.88 | 26.12 |
| 2015 | 223.77 | 64.04 | 77.75 | 22.25 |
| 2016 | 186.52 | 69.53 | 72.85 | 27.15 |
| 2017 | 245.21 | −16.44 | 107.18 | −7.18 |
| 2018 | 191.01 | 39.5 | 82.86 | 17.14 |
| 2019 | 143.51 | 80.32 | 64.12 | 35.88 |
Publisher’s Note: MDPI stays neutral with regard to jurisdictional claims in published maps and institutional affiliations. |
© 2022 by the author. Licensee MDPI, Basel, Switzerland. This article is an open access article distributed under the terms and conditions of the Creative Commons Attribution (CC BY) license (https://creativecommons.org/licenses/by/4.0/).
Share and Cite
MDPI and ACS Style
Webb, C.J.R. More Money, More Problems? Addressing the Funding Conditions Required for Rights-Based Child Welfare Services in England. Societies 2022, 12, 9. https://doi.org/10.3390/soc12010009
AMA Style
Webb CJR. More Money, More Problems? Addressing the Funding Conditions Required for Rights-Based Child Welfare Services in England. Societies. 2022; 12(1):9. https://doi.org/10.3390/soc12010009
Chicago/Turabian StyleWebb, Calum J. R. 2022. "More Money, More Problems? Addressing the Funding Conditions Required for Rights-Based Child Welfare Services in England" Societies 12, no. 1: 9. https://doi.org/10.3390/soc12010009
Note that from the first issue of 2016, this journal uses article numbers instead of page numbers. See further details here.